syslog-ng
Onboarding allows you to collect metrics about the host, display the host on the Topology page, and to tap into the log flow.
Onboarding requires you to modify the host and the configuration of the logging agent (syslog-ng) running on the host.
- Level 1: Install Axolet on the host where syslog-ng is running. Axolet collects metrics from the host and sends them to the AxoConsole, so you can check host-level metrics on the Metrics & Health page of the host, and displays the host on the Topology page.
- Level 2: Instrument the configuration of the logging agent to provide detailed metrics about the traffic flow. This allows you to display data about the host on the Analytics page.
- Level 3: Instrument the configuration of the logging agent to allow you to access the logs of the logging agent and to tap into the log flow from the AxoConsole. The exact steps for this integration depend on the configuration of your logging agent. We provide basic instrumentation instructions for getting started in this guide, but we strongly recommend to contact us so our professional services can help you with a production integration.
Prerequisites
For syslog-ng PE, version 7.0.33 or newer is required. Note that the 7.0.x product line needs a different configuration snippet than the 8.1.x product line.
For syslog-ng OSE, version 4.1.1 or newer is required, but we recommend using AxoSyslog instead (at least syslog-ng OSE version 4.5.0).
Provision syslog-ng
To onboard an existing syslog-ng instance into Axoflow, complete the following steps.
-
Install Axolet on the host, then approve its registration on the Provisioning page of the AxoConsole.
-
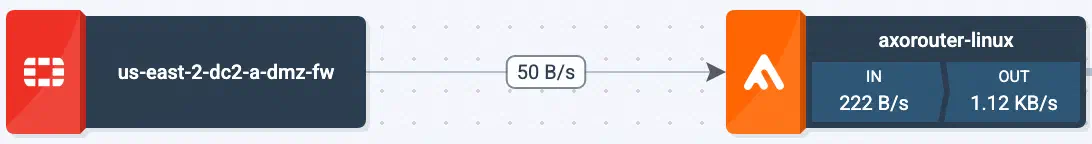
The syslog-ng host will now be visible on the Topology page of the AxoConsole as a source.
-
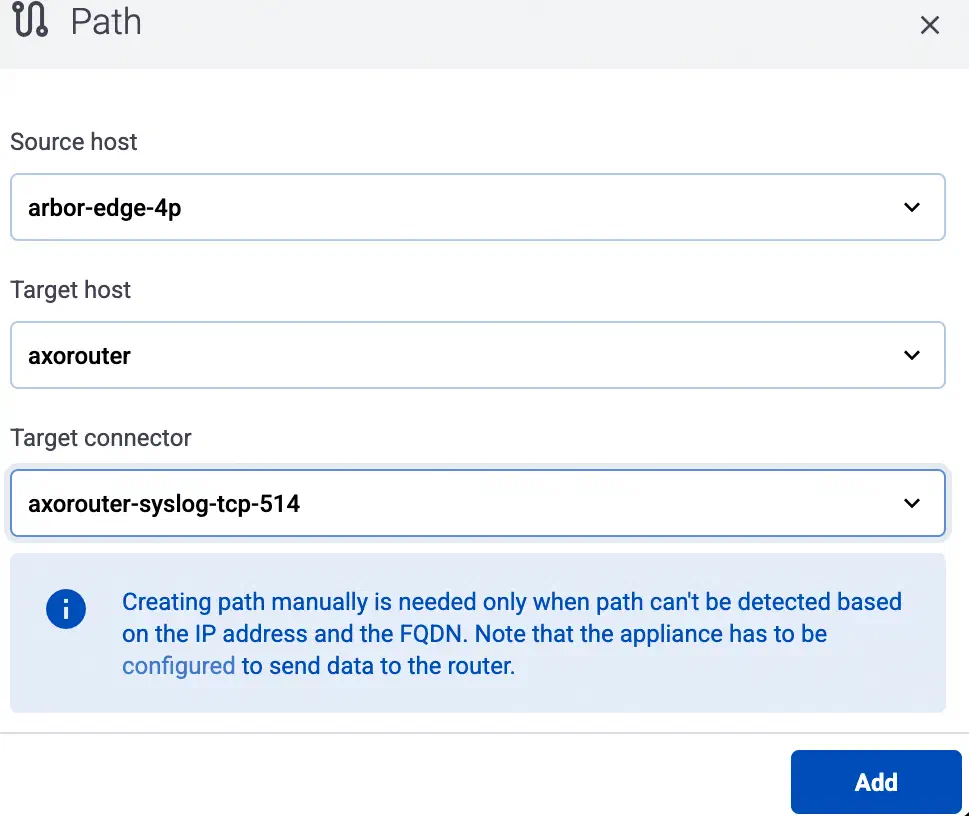
If you've already added the AxoRouter instance or other destination where this newly-registered host is sending data to the AxoConsole, add a path to connect the host to the AxoRouter or the destination.
-
Select Topology > Add Item > Path.
-
Select the target router or aggregator this source is sending its data to in the Target host field, for example,
axorouter. -
Select the Target connector. The connector determines how the destination receives the data (for example, using which protocol or port).
-
Select Add. The new path appears on the Topology page.
-
-
Access the syslog-ng host and edit the configuration of syslog-ng. Set the statistics-related global options like this (if the
optionsblock already exists, add these lines to the bottom of the block):options { stats-level(2); stats-freq(0); # Inhibit statistics output to stdout }; -
(Optional) To get detailed metrics and analytics about the traffic that flows through the host, instrument your syslog-ng configuration as follows:
Note You can use Axolet with an un-instrumented syslog-ng configuration file, but that limits available metrics to host statistics (for example, disk, memory, queue information). You won’t be able to access data about the actual traffic flowing through the host. To collect traffic-related metrics, instrument configuration withmetrics-probe()stanzas. The example below shows how to instrument the configuration to highlight common macros such as$HOSTand$PROTOCOL. If you want to customize the collected metrics or need help with the instrumentation, contact us.-
Download the following configuration snippet to the syslog-ng host, for example, as
For syslog-ng PE, use/etc/syslog-ng/conf.d/axoflow-instrumentation.conffor syslog-ng./opt/syslog-ng/etc/axoflow-instrumentation.conf.For syslog-ng PE 8.x and newer:
# Metrics probe parser definition for a specified destination
# This will yield a reasonable number of metrics for common
# syslog-ng macros
block parser metrics-output(destination(undefined)) {

  # This will probe for the number of *events*.
  # key name is fixed; labels are user-specified
  metrics-probe(
    key("classified_output_events_total")
    labels(
      "host" => "${HOST}"
      "service" => "${PROGRAM}"
      "source" => "${SOURCE}"
      "dest_port" => "$DESTPORT"
      "dest_ip" => "$DESTIP"
      "src_ip" => "$SOURCEIP"
      "protocol" => "$(if ($PROTO == 6) TCP $(if ($PROTO == 17) UDP $PROTO))"
      "ip_protocol" => "$IP_PROTO"
      "transport" => "$TRANSPORT"
      "destination_name" => "`destination`"
      "issue" => "$(or $(tags-head message.parse_error syslog.unexpected_framing syslog.missing_pri syslog.rfc3164_missing_header syslog.invalid_hostname message.utf8_sanitized) 'none')"
    )
  );

  # This will probe for the number of *bytes*.
  # key name is fixed; labels are user-specified
  metrics-probe(
    key("classified_output_event_bytes_total")
    increment("${RAWMSG_SIZE}")
    labels(
        "host" => "${HOST}"
        "service" => "${PROGRAM}"
        "source" => "${SOURCE}"
        "dest_port" => "$DESTPORT"
        "dest_ip" => "$DESTIP"
        "src_ip" => "$SOURCEIP"
        "protocol" => "$(if ($PROTO == 6) TCP $(if ($PROTO == 17) UDP $PROTO))"
        "ip_protocol" => "$IP_PROTO"
        "transport" => "$TRANSPORT"
        "destination_name" => "`destination`"
        "issue" => "$(or $(tags-head message.parse_error syslog.unexpected_framing syslog.missing_pri syslog.rfc3164_missing_header syslog.invalid_hostname message.utf8_sanitized) 'none')"
    )
  );
};


# For syslog-ng OSE this should be /var/lib/syslog-ng/axotap.sock
@define AXOTAP_SOCK "/opt/syslog-ng/var/axotap.sock"

block rewrite format_axotap_sock_message(service_type("input")) {
  set("$(substr ${MESSAGE} 0 32768)" value(MESSAGE));
  set("$(substr ${RAWMSG} 0 32768)" value(RAWMSG));
  set("$(format-json --no-cast debug.msg=$(format-json --no-cast --scope all-nv-pairs) log.body=${MESSAGE})" value(".tap.event"));
  set(json('{"note":"message object too long for tapping"}') value(".tap.event") condition("$(length ${.tap.event})" > 131072));

  set("$(format-json --no-cast tap=$(format-json --no-cast tapId='' serviceType='`service_type`' eventId=${UNIQID} labels=$(format-json --no-cast) hostCandidate=$(format-json --no-cast) facility=${FACILITY} format=${MSGFORMAT} hostFrom=${HOST_FROM} message=$(echo ${MESSAGE}) rawMessage=${RAWMSG} severity=${SEVERITY} source=${SOURCE} tags=${TAGS} timestamp=${ISODATE} transport=${TRANSPORT}) event=json(${.tap.event}))" value(".tap.formatted"));
};


# input side tapping
destination "d_axotap_input_static" {
  channel {
    filter {
      rate-limit(key("$SOURCE:$PROGRAM:$HOST:$SOURCEIP:$DESTIP") rate(1));
    };

    rewrite {
      format_axotap_sock_message(service_type("input"));
    };

    destination {
      unix-dgram("`AXOTAP_SOCK`" persist-name("axotap_input_static") template("${.tap.formatted}"));
    };
  };
};


log {
  destination("d_axotap_input_static");
  flags(catchall);
};


# output side tapping
destination "d_axotap_output" {
  channel {
    filter {
      rate-limit(key("$SOURCE:$PROGRAM:$HOST:$SOURCEIP:$DESTIP") rate(1));
    };

    rewrite {
      format_axotap_sock_message(service_type("output"));
    };

    destination {
      unix-dgram("`AXOTAP_SOCK`" template("${.tap.formatted}"));
    };
  };
};
For syslog-ng PE 7.0.33 and newer 7.0.x, and syslog-ng OSE version 4.1.1-4.4.0:
# Metrics probe parser definition for a specified destination # This will yield a reasonable number of metrics for common # syslog-ng macros block parser metrics-output(destination(undefined)) { # This will probe for the number of *events*. # key name is fixed; labels are user-specified metrics-probe( key("classified_output_events_total") labels( "host" => "${HOST}" "service" => "${PROGRAM}" "source" => "${SOURCE}" "dest_port" => "$DESTPORT" "dest_ip" => "$DESTIP" "src_ip" => "$SOURCEIP" "protocol" => "$(if ($PROTO == 6) TCP $(if ($PROTO == 17) UDP $PROTO))" "ip_protocol" => "$IP_PROTO" "transport" => "$TRANSPORT" "destination_name" => "`destination`" ) ); # This will probe for the number of *bytes*. # key name is fixed; labels are user-specified metrics-probe( key("classified_output_event_bytes_total") increment("${RAWMSG_SIZE}") labels( "host" => "${HOST}" "service" => "${PROGRAM}" "source" => "${SOURCE}" "dest_port" => "$DESTPORT" "dest_ip" => "$DESTIP" "src_ip" => "$SOURCEIP" "protocol" => "$(if ($PROTO == 6) TCP $(if ($PROTO == 17) UDP $PROTO))" "ip_protocol" => "$IP_PROTO" "transport" => "$TRANSPORT" "destination_name" => "`destination`" ) ); }; # For syslog-ng OSE this should be /var/lib/syslog-ng/axotap.sock @define AXOTAP_SOCK "/opt/syslog-ng/var/run/axotap.sock" block rewrite format_axotap_sock_message(service_type("input")) { set("$(substr ${MESSAGE} 0 32768)" value(MESSAGE)); set("$(substr ${RAWMSG} 0 32768)" value(RAWMSG)); set("$(format-json --no-cast debug.msg=$(format-json --no-cast --scope all-nv-pairs) log.body=${MESSAGE})" value(".tap.event")); set(json('{"note":"message object too long for tapping"}') value(".tap.event") condition("$(length ${.tap.event})" > 131072)); set("$(format-json --no-cast tap=$(format-json --no-cast tapId='' serviceType='`service_type`' eventId=${UNIQID} labels=$(format-json --no-cast) hostCandidate=$(format-json --no-cast) facility=${FACILITY} format=${MSGFORMAT} hostFrom=${HOST_FROM} message=$(echo ${MESSAGE}) rawMessage=${RAWMSG} severity=${SEVERITY} source=${SOURCE} tags=${TAGS} timestamp=${ISODATE} transport=${TRANSPORT}) event=json(${.tap.event}))" value(".tap.formatted")); }; # input side tapping destination "d_axotap_input_static" { channel { filter { rate-limit(template("$SOURCE:$PROGRAM:$HOST:$SOURCEIP:$DESTIP") rate(1)); }; rewrite { format_axotap_sock_message(service_type("input")); }; destination { unix-dgram("`AXOTAP_SOCK`" persist-name("axotap_input_static") template("${.tap.formatted}")); }; }; }; log { destination("d_axotap_input_static"); flags(catchall); }; # output side tapping destination "d_axotap_output" { channel { filter { rate-limit(template("$SOURCE:$PROGRAM:$HOST:$SOURCEIP:$DESTIP") rate(1)); }; rewrite { format_axotap_sock_message(service_type("output")); }; destination { unix-dgram("`AXOTAP_SOCK`" template("${.tap.formatted}")); }; }; }; -
Include it in at the top of your configuration file:
@version: current @include "axoflow-instrumentation.conf" -
Edit every destination statement to include a
parser { metrics-output(destination(my-destination)); };line (making sure to include thechannelconstruct if your destination block does not already contain it):destination my-destination { channel { parser { metrics-output(destination(my-destination)); }; destination { file("/dev/null"); }; }; }; -
Reload the configuration of syslog-ng.
systemctl reload syslog-ng -
To enable log tapping for the output logs (traffic that the host sends to its destinations), add the
d_axotap_outputdestination in your log paths. This allows the Axolet agent to collect rate-limited log samples from that specific point in the pipeline.Tapping the input logs (traffic arriving to the sources of the host) needs only the configuration snippet.
Note There are multiple ways to add tapping to your configuration, which in some cases can introduce unwanted side effects. Contact us to help you create a safe tapping configuration for your use case!-
Find a log path that you want to tap into and add the tap destination in a safe way, for example, by adding it in a separate inner log path:
log { source(s_udp514); log { destination(d_udp514); }; log { destination(d_axotap); }; }; -
Reload the configuration of syslog-ng.
systemctl reload syslog-ng -
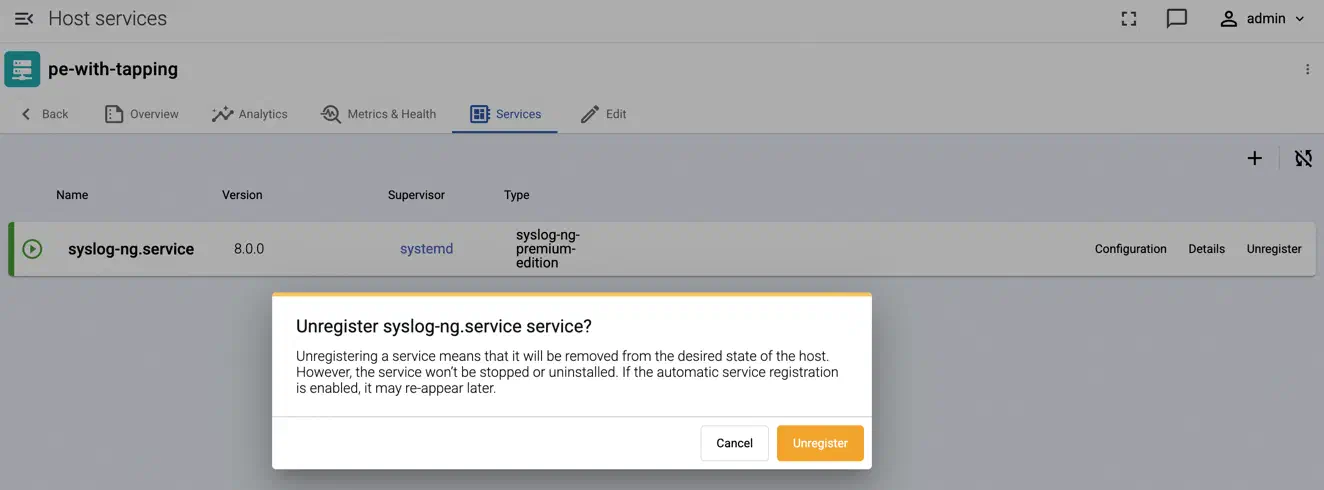
Unregister the service so that auto service registration can discover the new tapping point:
-
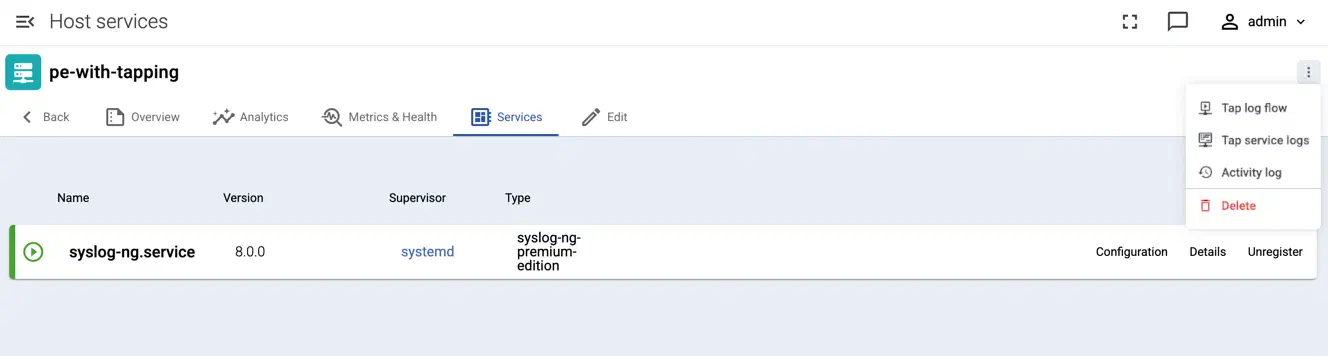
Test log tapping from the top right menu:
-
-
- If syslog-ng is sending data to an AxoRouter, create a placeholder data forwarding rule where the Edge Selector matches syslog-ng and the Router connector is the connector of the AxoRouter instance where syslog-ng is sending the data. This is needed to display syslog-ng and its data metrics on the Topology page, AxoConsole won’t manage syslog-ng.