FortiGate firewalls
FortiGate firewalls: Enterprise firewall platform offering threat protection, VPN, and traffic filtering for secure networking.
The following sections show you how to configure FortiGate Next-Generation Firewall (NGFW) to send their log data to Axoflow.
CAUTION:
Make sure to set data forwarding on your appliances/servers as described in this guide. Different settings like alternate message formats or ports might be valid, but can result in data loss or incorrect parsing.Prerequisites
- You have administrative access to the firewall.
- The date, time, and time zone are correctly set on the firewall.
- You have an AxoRouter deployed and configured with a Syslog connector that has parsing and classification enabled (by default, every AxoRouter has such connectors). This device is going to receive the data from the firewall.
-
You know the IP address the AxoRouter. To find it:
- Open the AxoConsole.
- Select the Routers or the Topology page.
- Select on AxoRouter instance that is going to receive the logs.
- Check the Networks > Address field.
Steps
Note: The steps involving the FortiGate user interface are just for your convenience, for details, see the official FortiGate documentation.
-
Log in to your FortiGate device. You need administrator privileges to perform the configuration.
-
Register the address of your AxoRouter as an Address Object.
-
Select Log & Report > Log Settings > Global Settings.
-
Configure the following settings:
- Event Logging: Click All.
- Local traffic logging: Click All.
- Syslog logging: Enable this option.
- IP address/FQDN: Enter the address of your AxoRouter:
%axorouter-ip%
-
Click Apply.
-
-
Add the source to AxoConsole.
-
Open the AxoConsole and select Topology.
-
Select Add Item > Source.
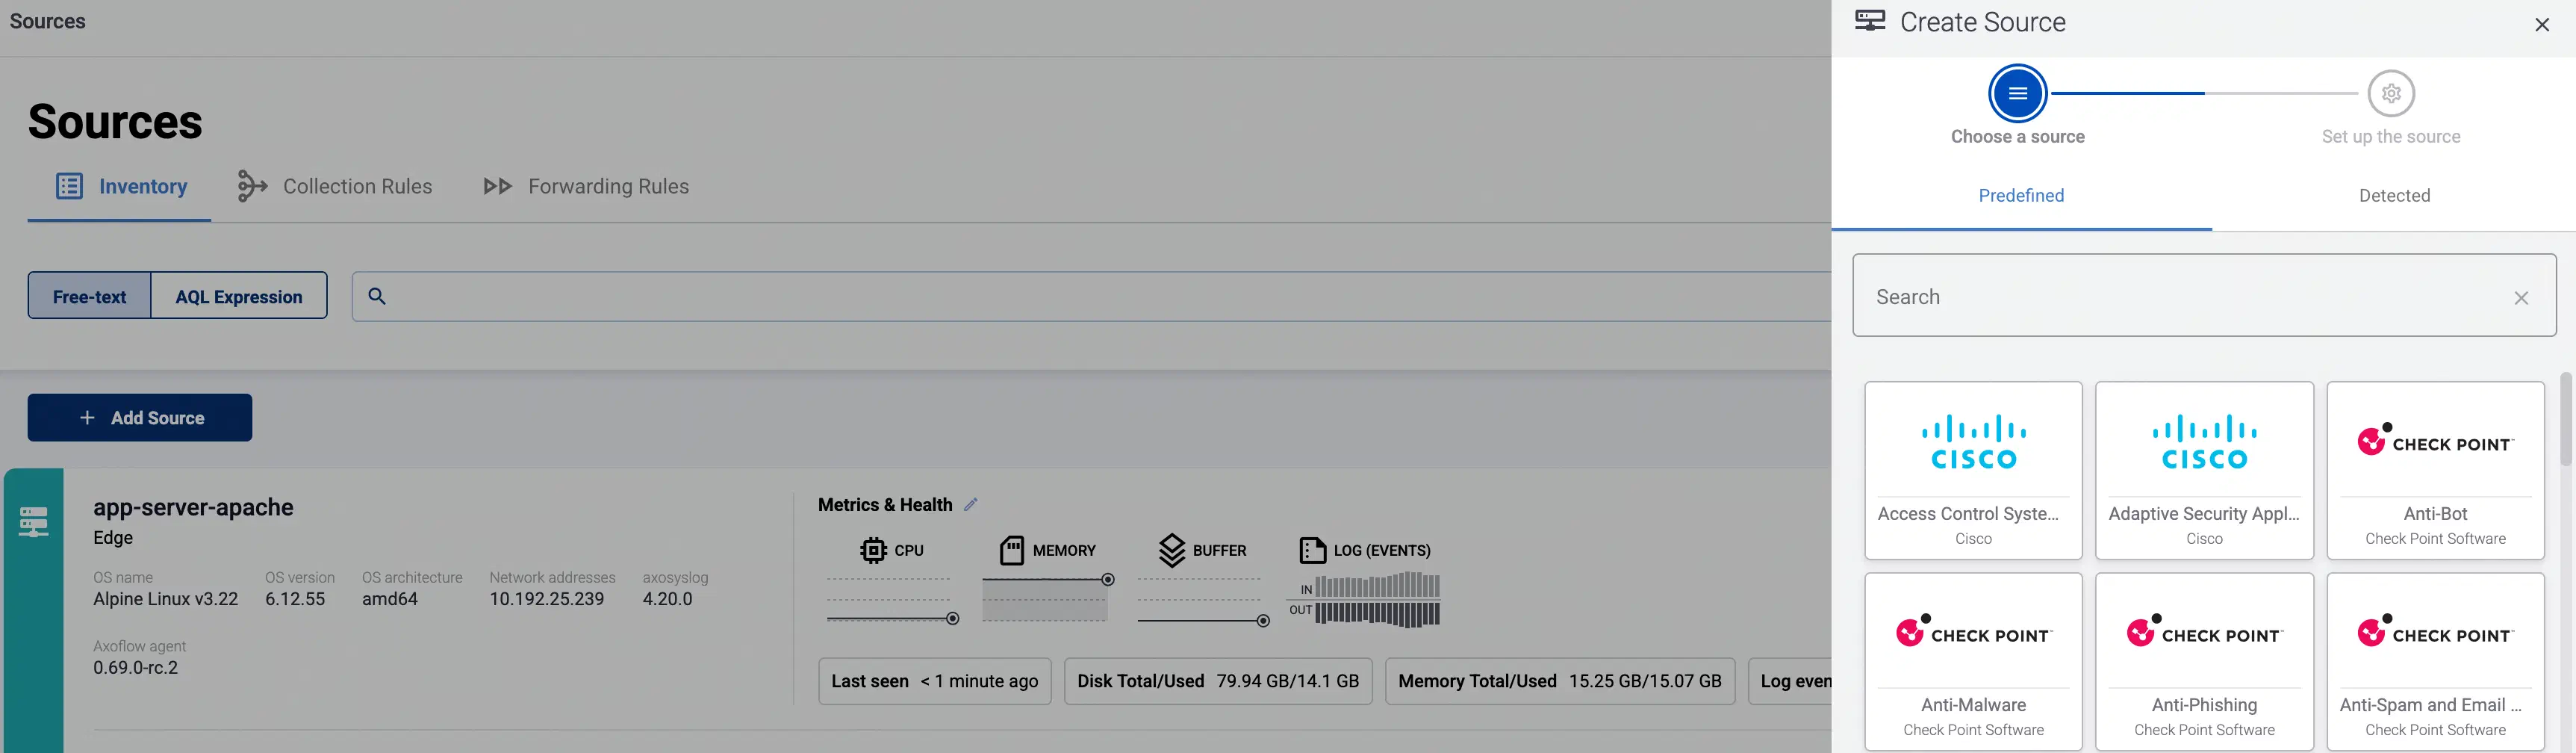
-
If the source is actively sending data to an AxoRouter instance, select Detected, then select your source(s) and select Add Selected Source(s).
-
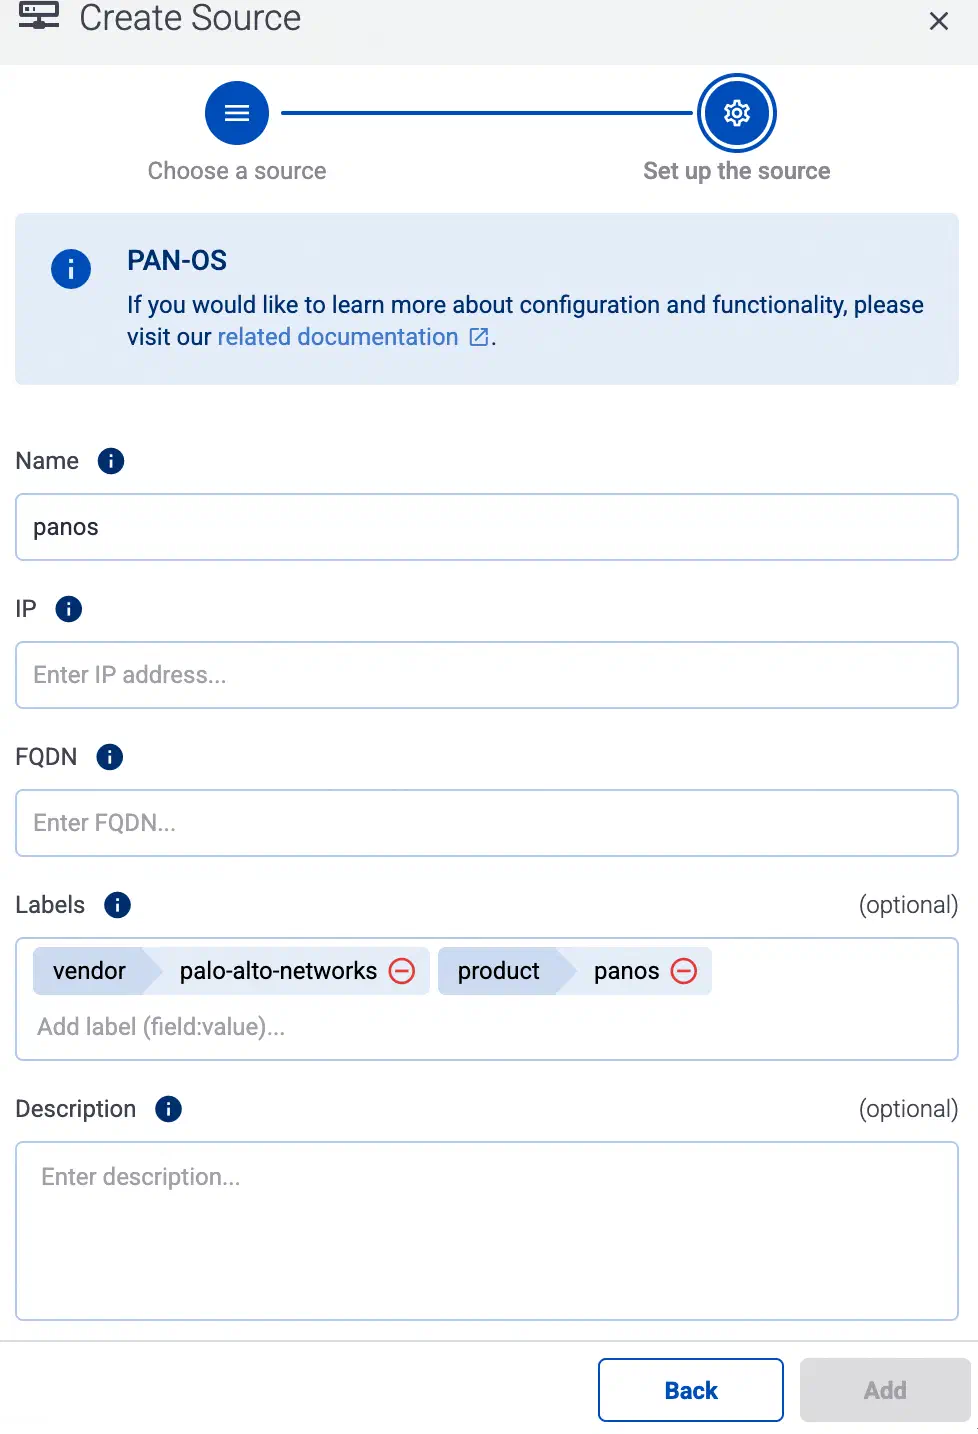
Otherwise, select the vendor and product corresponding to your source from the Predefined sources, then enter the parameters of the source, like IP address and FQDN.
Note During log tapping, you can add hosts that are actively sending data to an AxoRouter instance by clicking Register source. -
-
(Optional) Add custom labels as needed.
-
Select Add.
-
(Optional) Add Path manually. That’s needed only when AxoConsole can’t detect the path based on the IP address and the FQDN, and you haven’t yet configured the source to send data to the router.
-
Labels
Axoflow automatically adds the following labels to data collected from this source:
| Analytics label | Message field | Value |
|---|---|---|
vendor |
meta.vendor |
fortinet |
product |
meta.product |
fortigate |
service |
meta.service.name |
fortigate |
You can use the labels as:
- Filter labels on the Analytics page,
- in the Filter By Label field during log tapping.
You can use the message fields
- in Flow Processing steps, for example, in the Query field of Select Messages steps,
- in AQL expressions in the search bars.
Sending data to Splunk
When sending the data collected from this source to Splunk, Axoflow uses the following sourcetype and index settings:
| sourcetype | index |
|---|---|
fortigate_event |
netops |
fortigate_traffic |
netfw |
fortigate_utm |
netfw |
Tested with: Fortinet FortiGate Add-On for Splunk technical add-on
If the Axoflow classification doesn’t set the source field for the message automatically, and you haven’t set it in a flow processing step manually (by setting the meta.destination.splunk.source field), AxoRouter automatically sets the source to the name of the AxoRouter connector that received the message (for example, axorouter-syslog-tcp-514).
Sending data to Google SecOps
When sending the data collected from this source to a dynamic Google SecOps destination, Axoflow sets the following log type: FORTINET_FIREWALL.
Sending data to Microsoft Sentinel
When sending the data collected from this source to a Microsoft Sentinel destination, Axoflow normalizes the data and sends it to the following table: Syslog.