Host metrics
The Metrics & health page of a source or an AxoRouter host shows the history of the various metrics Axoflow collects about the host.
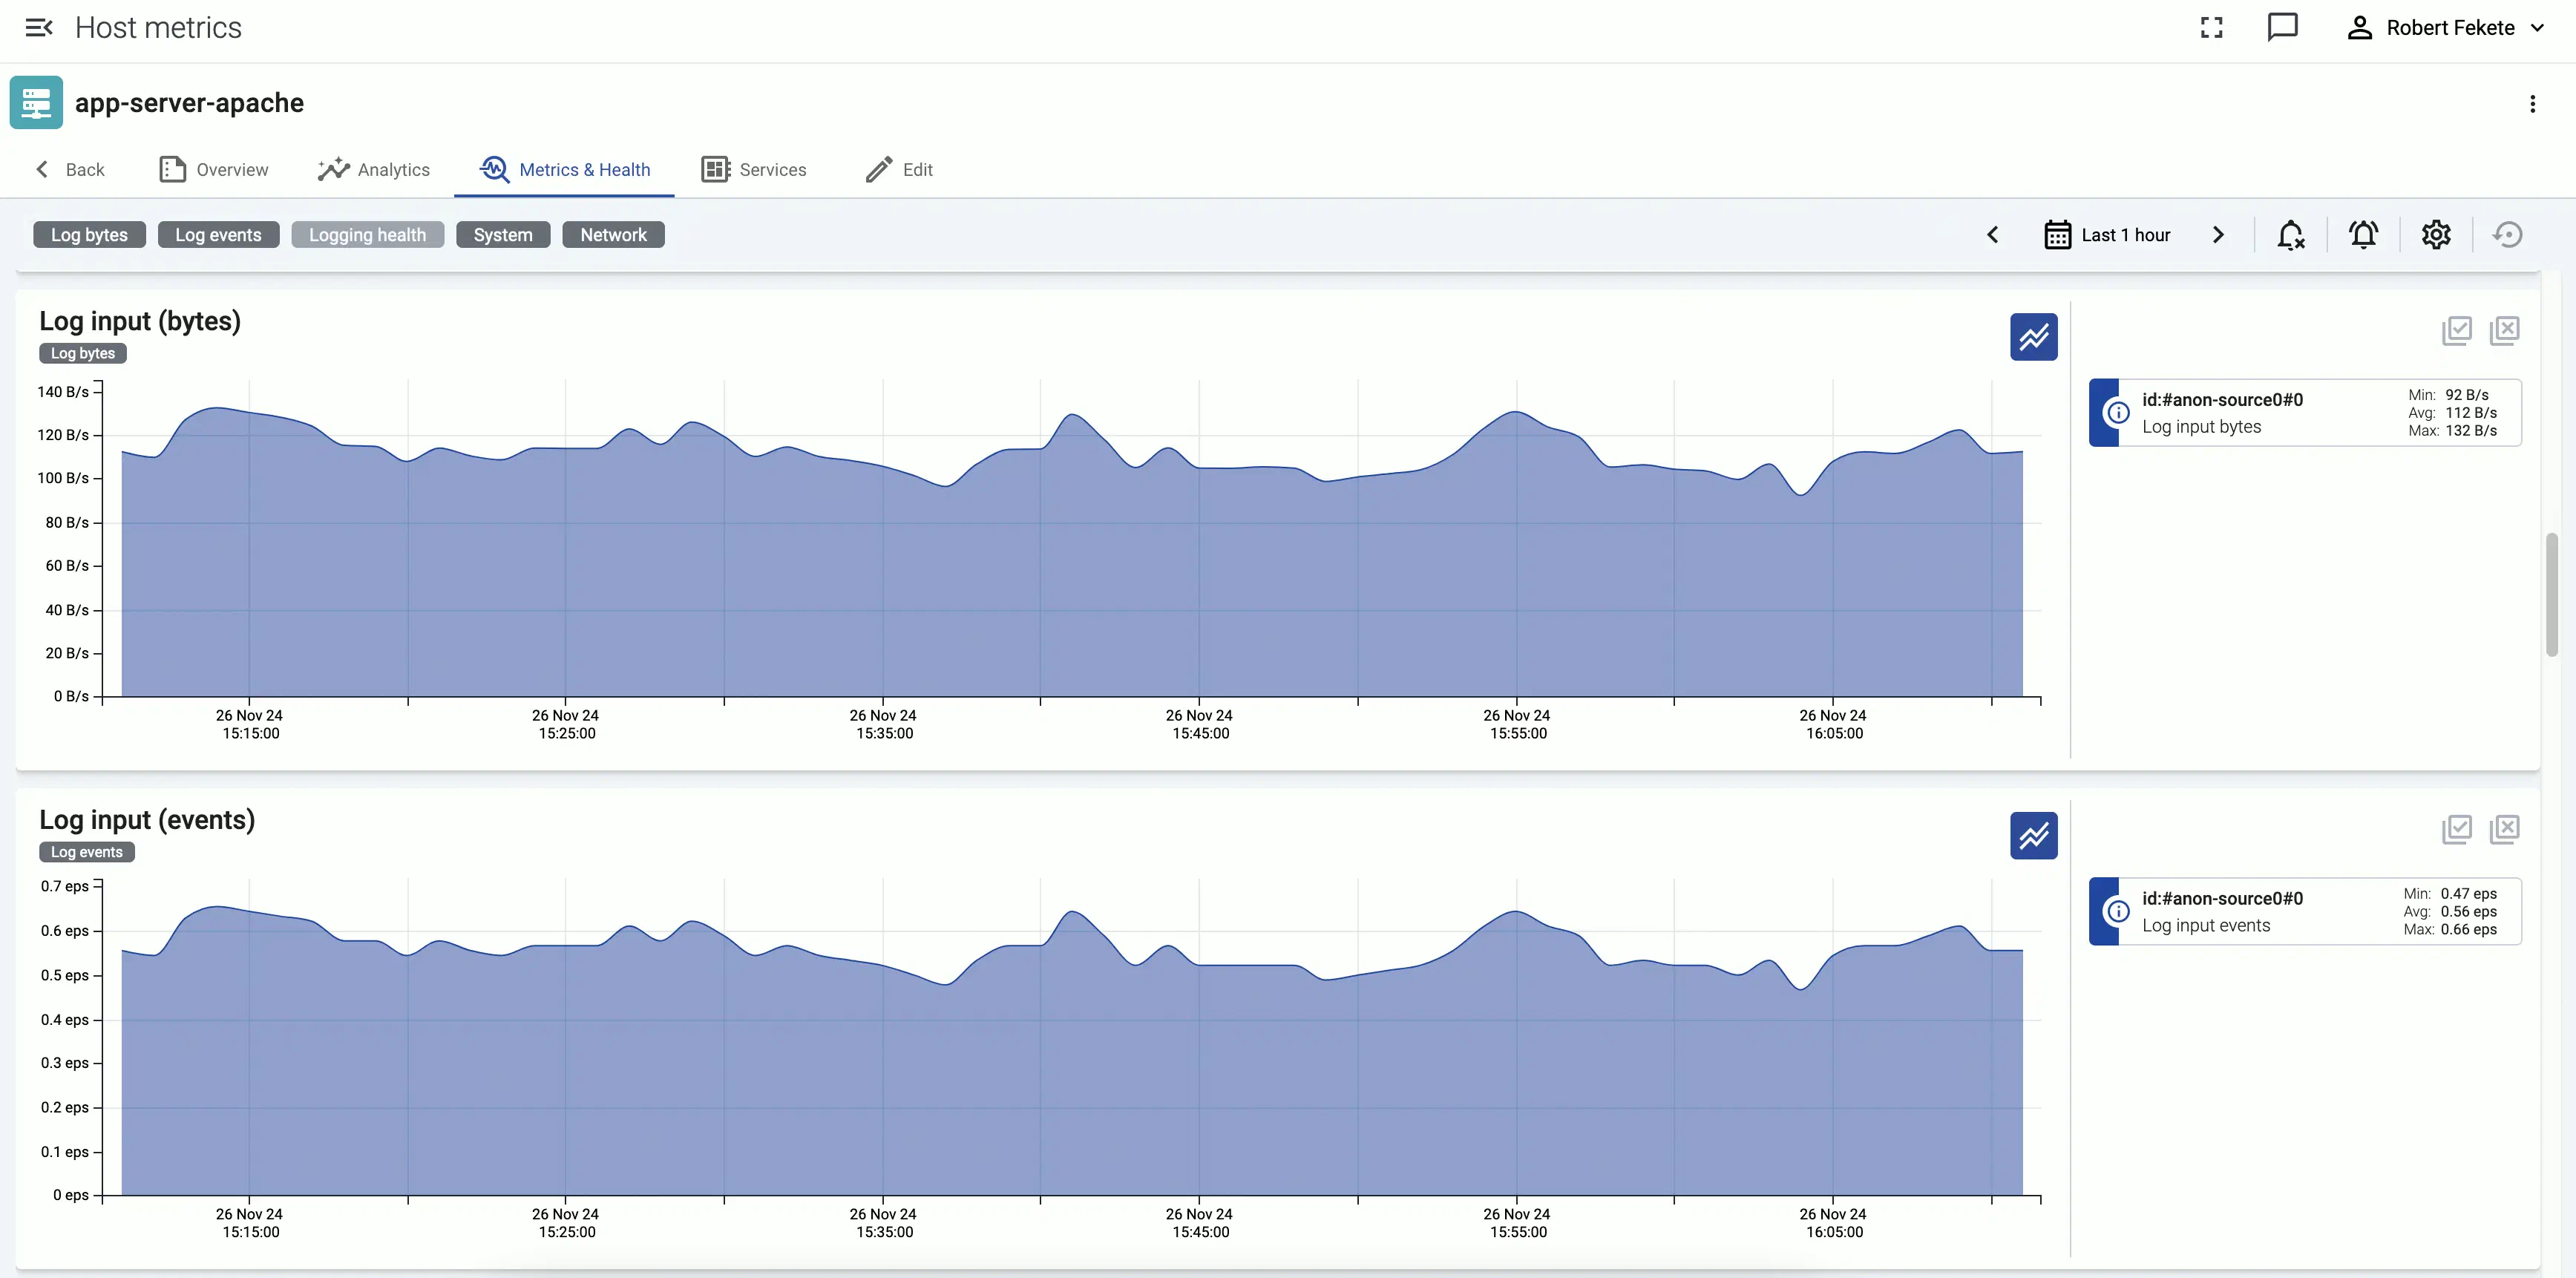
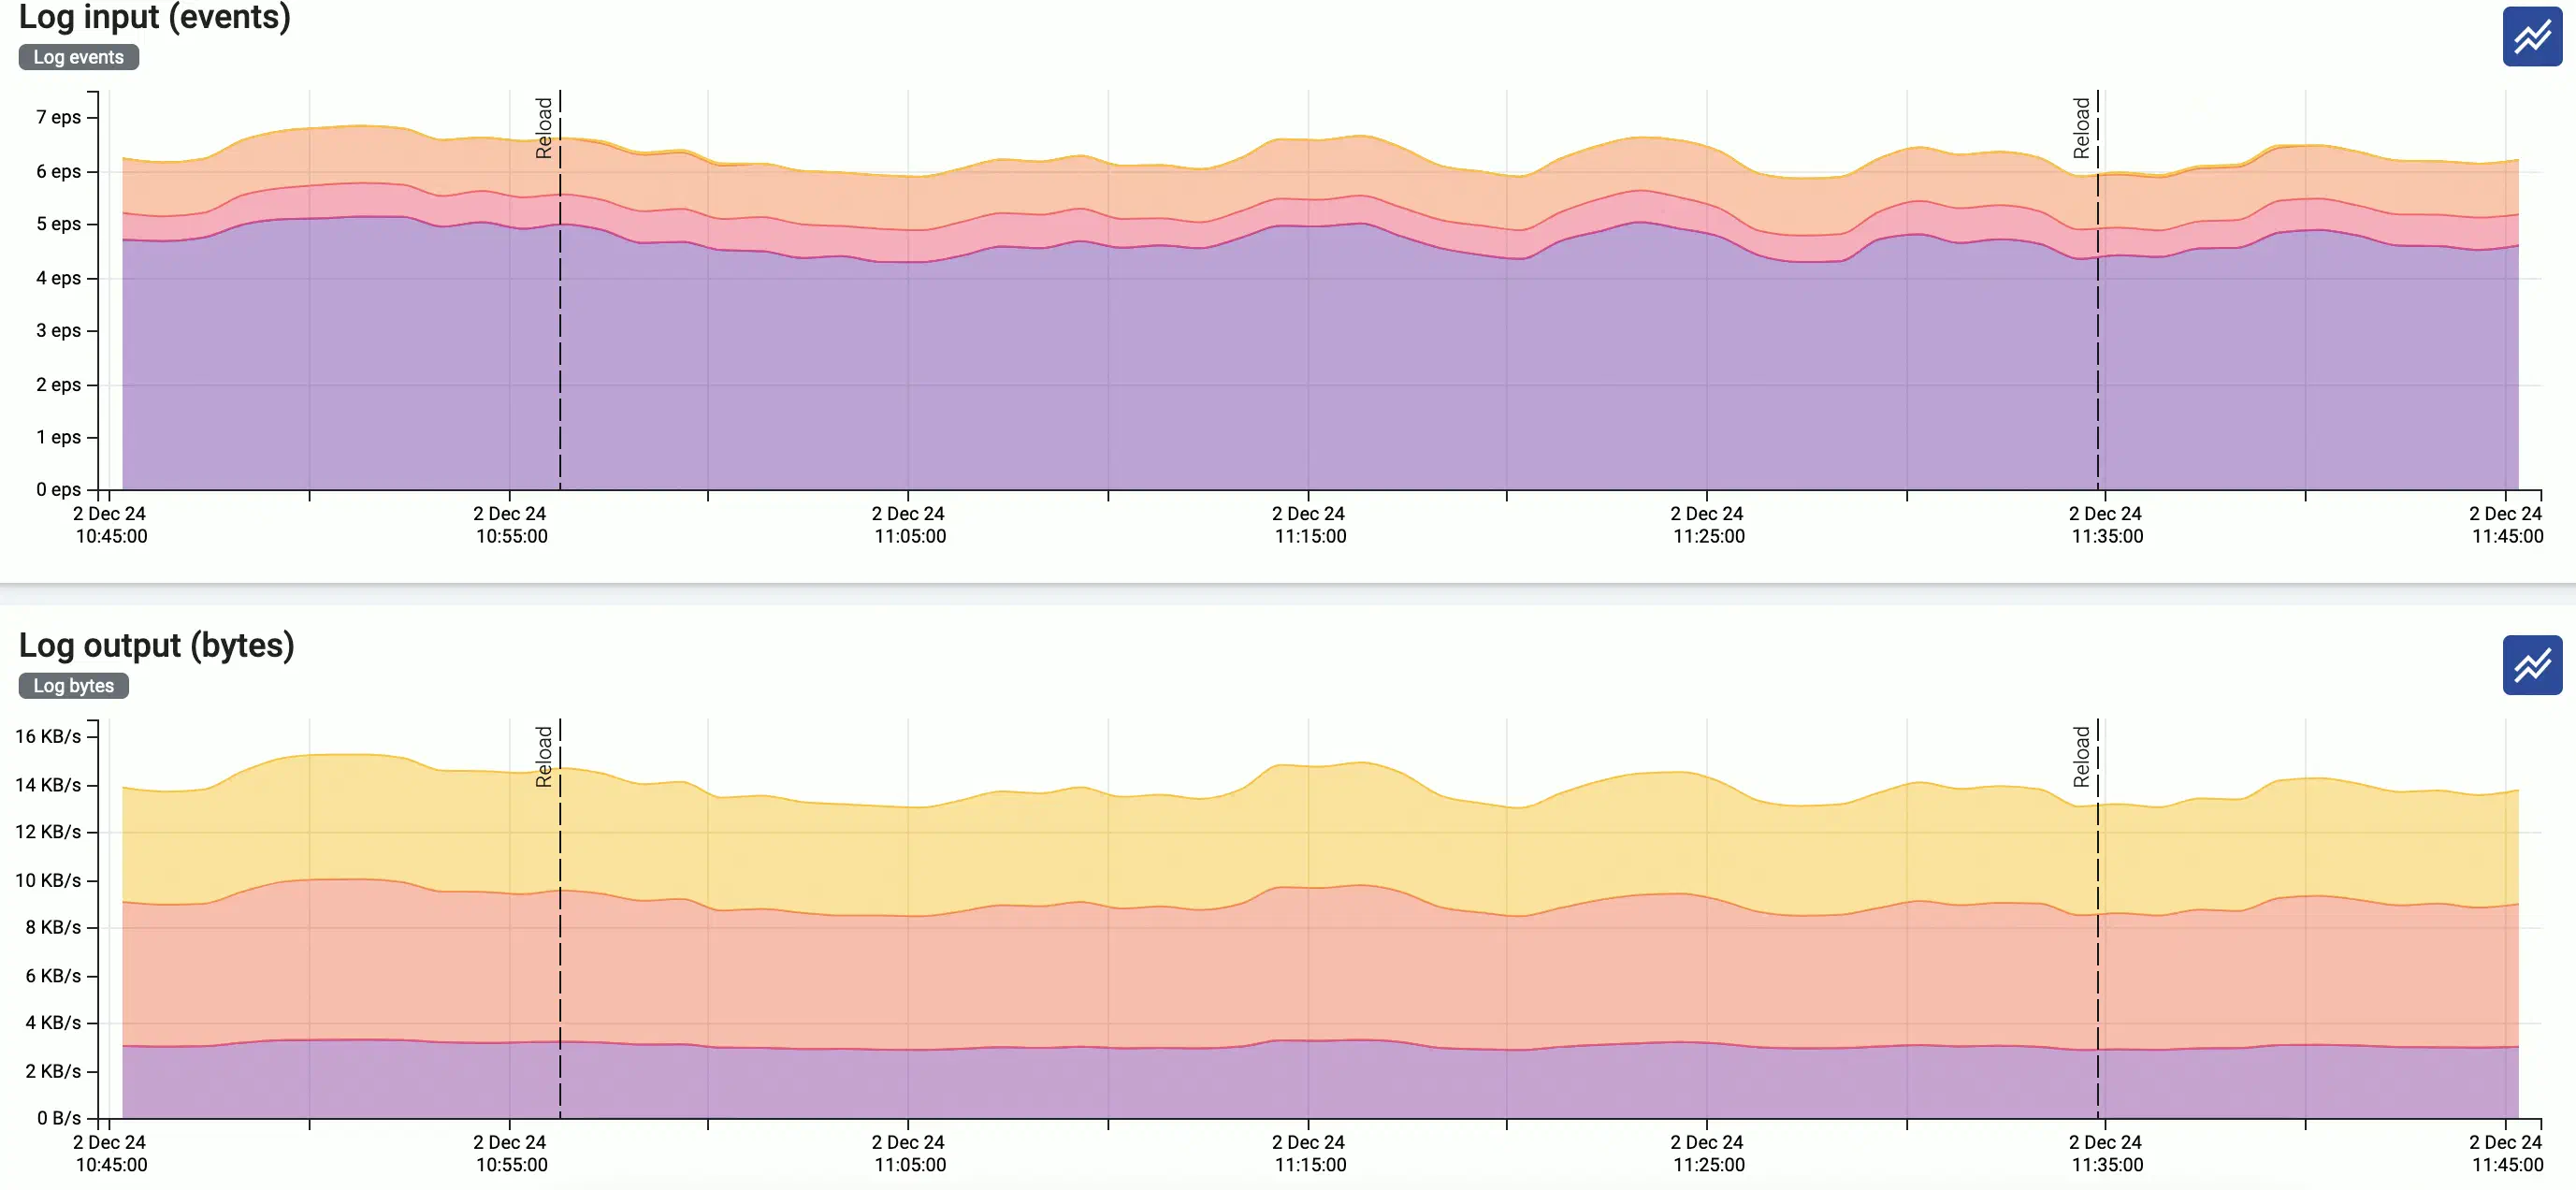
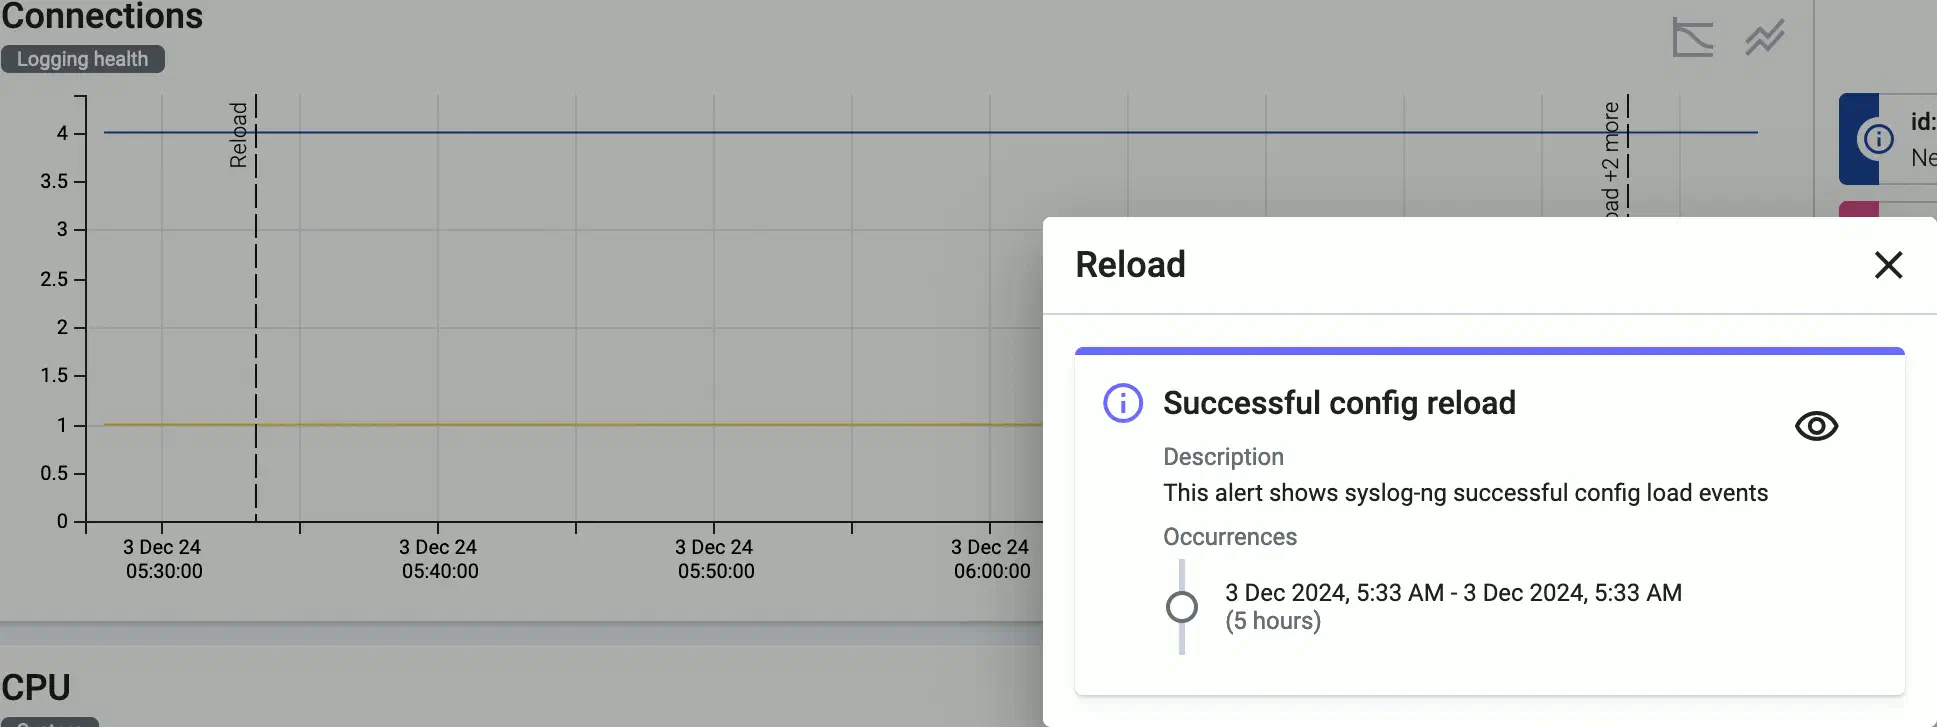
Events of the hosts (for example, configuration reloads, or alerts affecting the host) are displayed over the metrics.
Interact with metrics
You can change which metrics are displayed and for which time period using the bar above the metrics.

-
Metrics categories: Temporarily hide/show the metrics of that category, for example, System. The category for each metric is displayed under the name of the chart. Note that this change is just temporary: if you want to change the layout of the metrics, use the icon.
-
: Use the calendar icon to change the time period that’s displayed on the charts. You can use absolute (calendar) time, or relative time (for example, the last 2 days).
Axoflow stores all dates in Coordinated Universal Time (UTC), and automatically converts it to the timezone of set in your browser/operating system.
Note By default, Axoflow stores metrics for 30 days, unless specified otherwise in your support contract. Contact us if you want to increase the data retention time.To quickly zoom in on a period, click and drag to select the period to display on any of the charts. Every chart will be updated for the selected period. (To return to the previous state, click the Back button of your browser.)
-
/ : Hide/show the alerts and other events (like configuration reloads) of the host. These event are overlayed on the charts by default.
-
: Shows the number of active alerts on the host for that period.
-
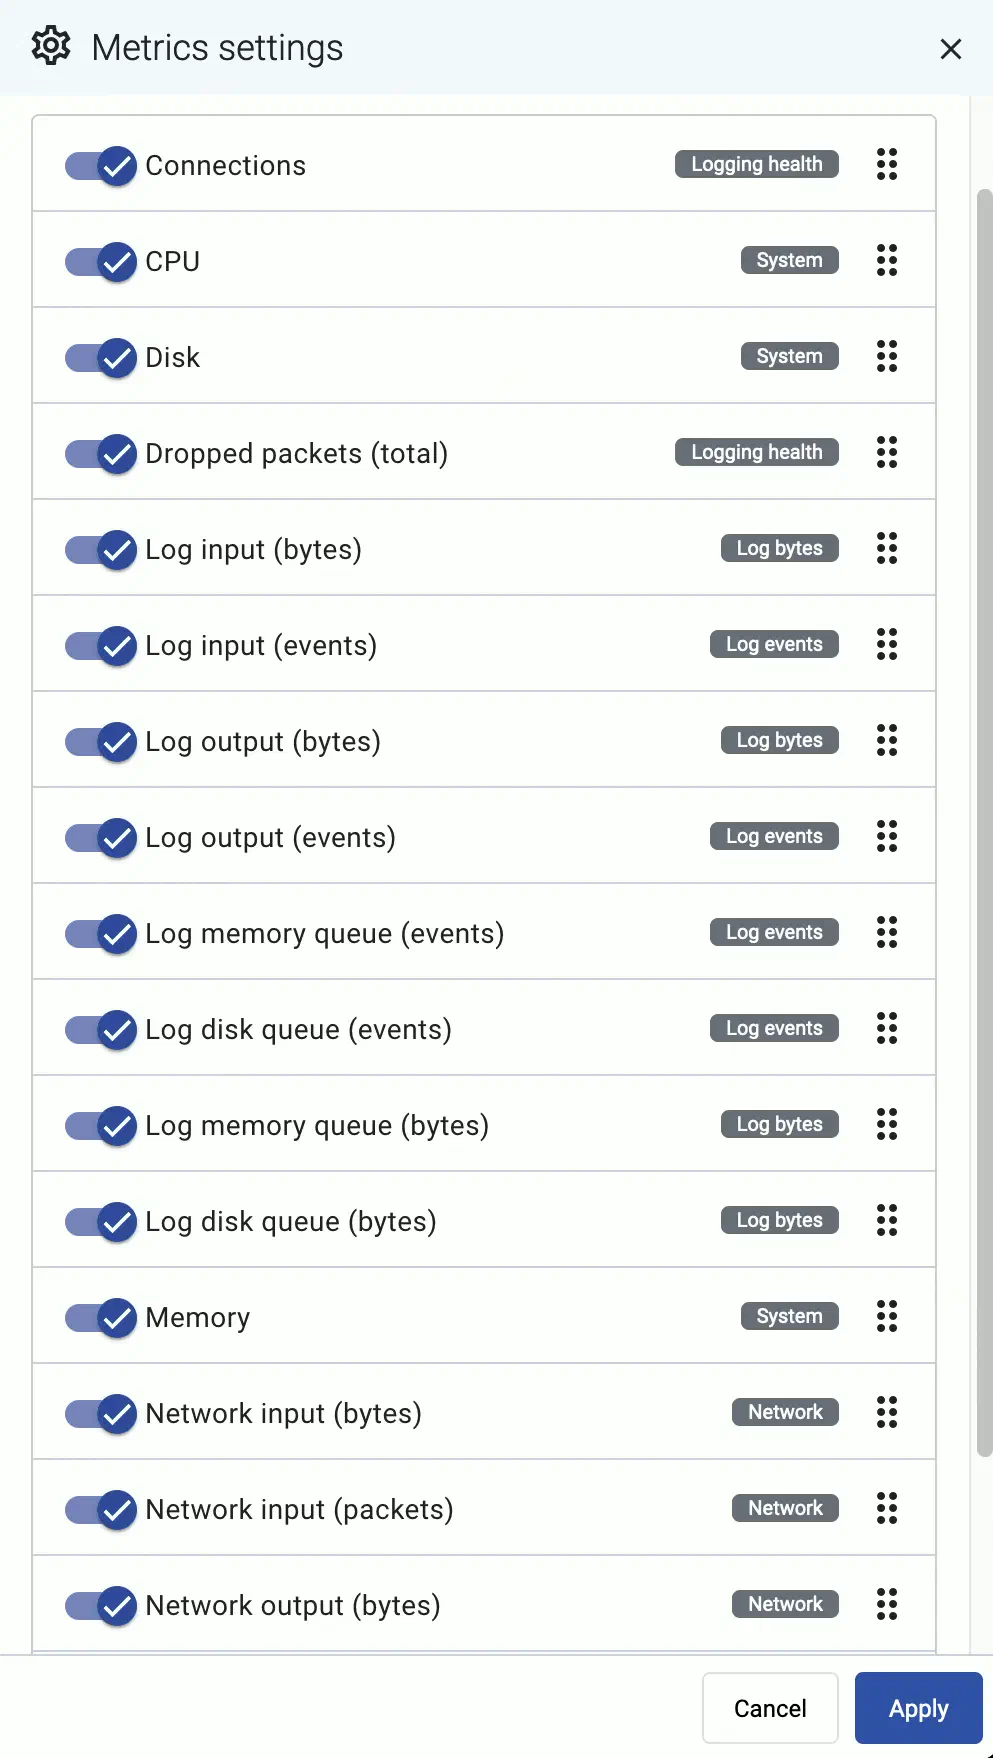
The allows you to change the order of the metrics, or to hide metrics. These changes are persistent and stored in your profile.
The settings of the filter bar change the URL parameters of the page, so you can bookmark it, or share a specific view by sharing the URL.
Interact with a chart
In addition to the possibilities of the top bar, you can interact with the charts the following way:
-
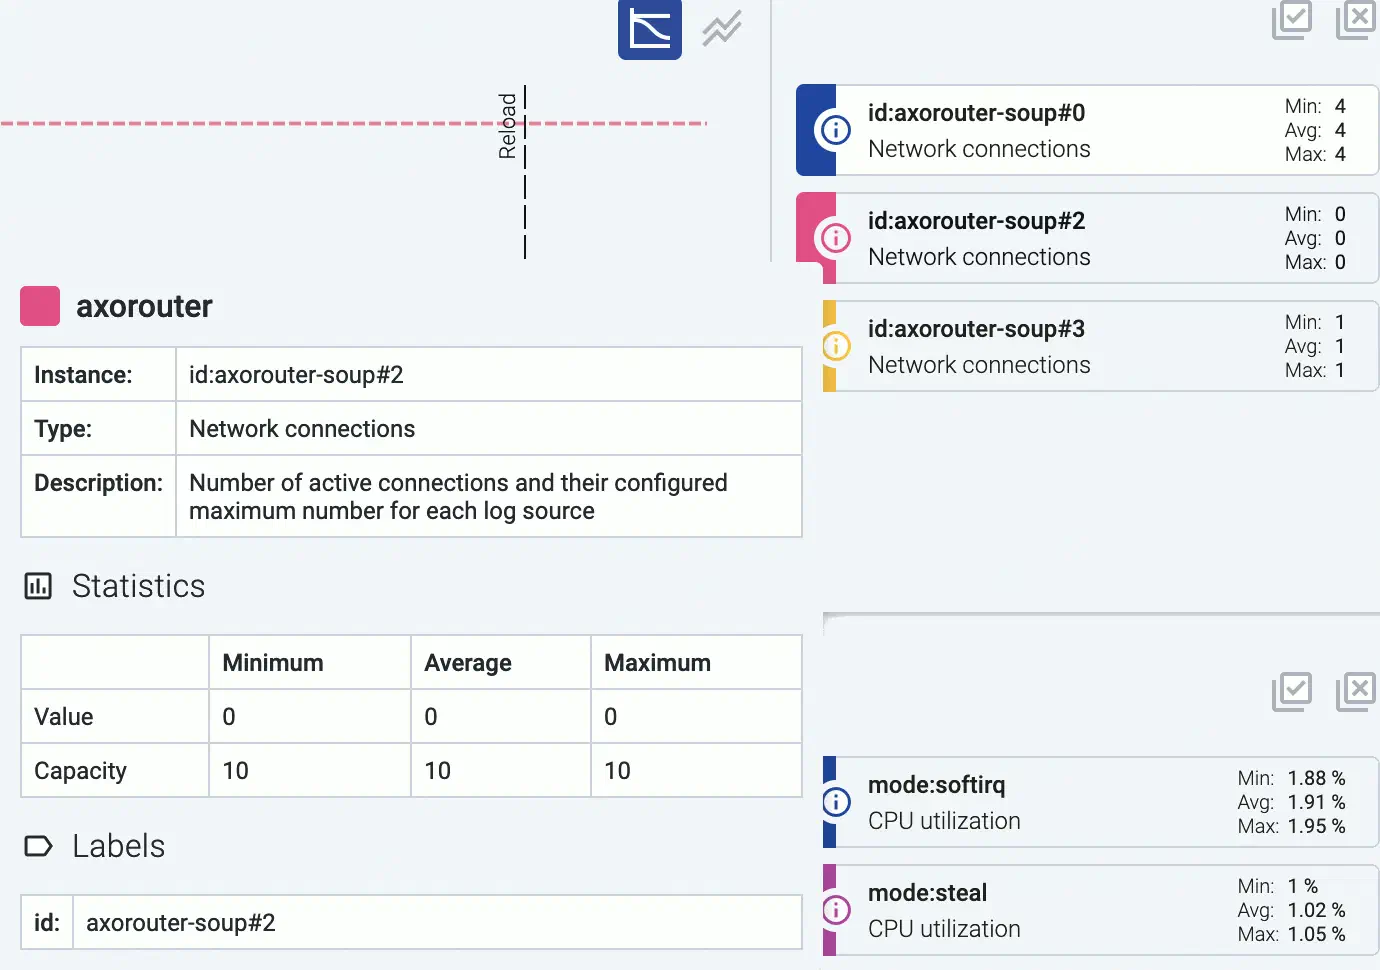
Hover on the icon on a colored metric card to display the definition, details, and statistics of the metric.
-
Click on a colored card to hide the related metric from the chart. For example, you can hide unneeded sources on the Log input charts.
-
Click on an event (for example, an alert or configuration reload) to show its details.
-
To quickly zoom in on a period, click and drag to select the period to display on any of the charts. Every chart will be updated for the selected period. (To return to the previous state, click the Back button of your browser.)
Metrics reference
For managed hosts, the following metrics are available:
-
Connections: Number of active connections and the maximum permitted number of connections for each connector.
-
CPU: Percentage of time a CPU core spent on average in a non-idle state within a window of 5 minutes.
-
Disk: Effective storage space used and available on each device (an overlap may exist between devices identified).
-
Dropped packets (total): This chart shows different metrics for packet loss:
- Dropped UDP packets: Number of UDP packets dropped by the OS before processing per second averaged within a time window of 5 minutes.
- Dropped log events: Number of events dropped from event queues within a time window of 5 minutes.
-
Log input (bytes): Incoming log messages processed by each connector, measured in bytes per second, averaged for a time window of 5 minutes.
-
Log input (events): Number of incoming log messages processed by each connector per second, averaged for a time window of 5 minutes.
-
Log output (bytes): Log messages sent to each log destination, measured in bytes per second, averaged for a time window of 5 minutes.
-
Log output (events): Number of log messages sent to each log destination per second, averaged for a time window of 5 minutes.
-
Log memory queue (bytes): Total bytes of data waiting in each memory queue.
-
Log memory queue (events): Number of messages waiting in each memory queue by destination.
-
Log disk queue (bytes): This chart shows the following metrics about disk queue usage:
- Disk queue bytes: Total bytes of data waiting in each disk queue.
- Disk queue memory cache bytes: Amount of memory used for caching disk-based queues.
-
Log disk queue (events): Number of messages waiting in each disk queue by destination.
-
Memory: Memory usage and capacity reported by the OS in bytes (including reclaimable caches and buffers).
-
Network input (bytes): Incoming network traffic in bytes/second reported by the OS for each network interface averaged within a time window of 5 minutes.
-
Network input (packets): Number of incoming network packets per second reported by the OS for each network interface averaged within a time window of 5 minutes.
-
Network output (bytes): Outgoing network traffic in bytes/second reported by the OS for each network interface averaged within a time window of 5 minutes.
-
Network output (packets): Number of outgoing network packets per second reported by the OS for each network interface averaged within a time window of 5 minutes.
-
Event delay (seconds): Latency of outgoing messages.