Flow tapping
Flow tapping allows you to sample the data flowing in a Flow and see how it processes the logs. It’s useful to test the flow when you’re configuring or adjusting Processing Steps.
Prerequisites
Flow tapping works only on flows that have been deployed to an AxoRouter instance. This means that if you change a processing step in a flow, you must first Save the changes (or select Save and Test).
If you want to experiment with a flow, we recommend that you clone ( ) the flow and configure it to use the /dev/null destination, then redo adjusting the final processing steps in the original flow.
Tap into a flow
To tap into a Flow, complete the following steps.
-
Open AxoConsole and select Flows.
-
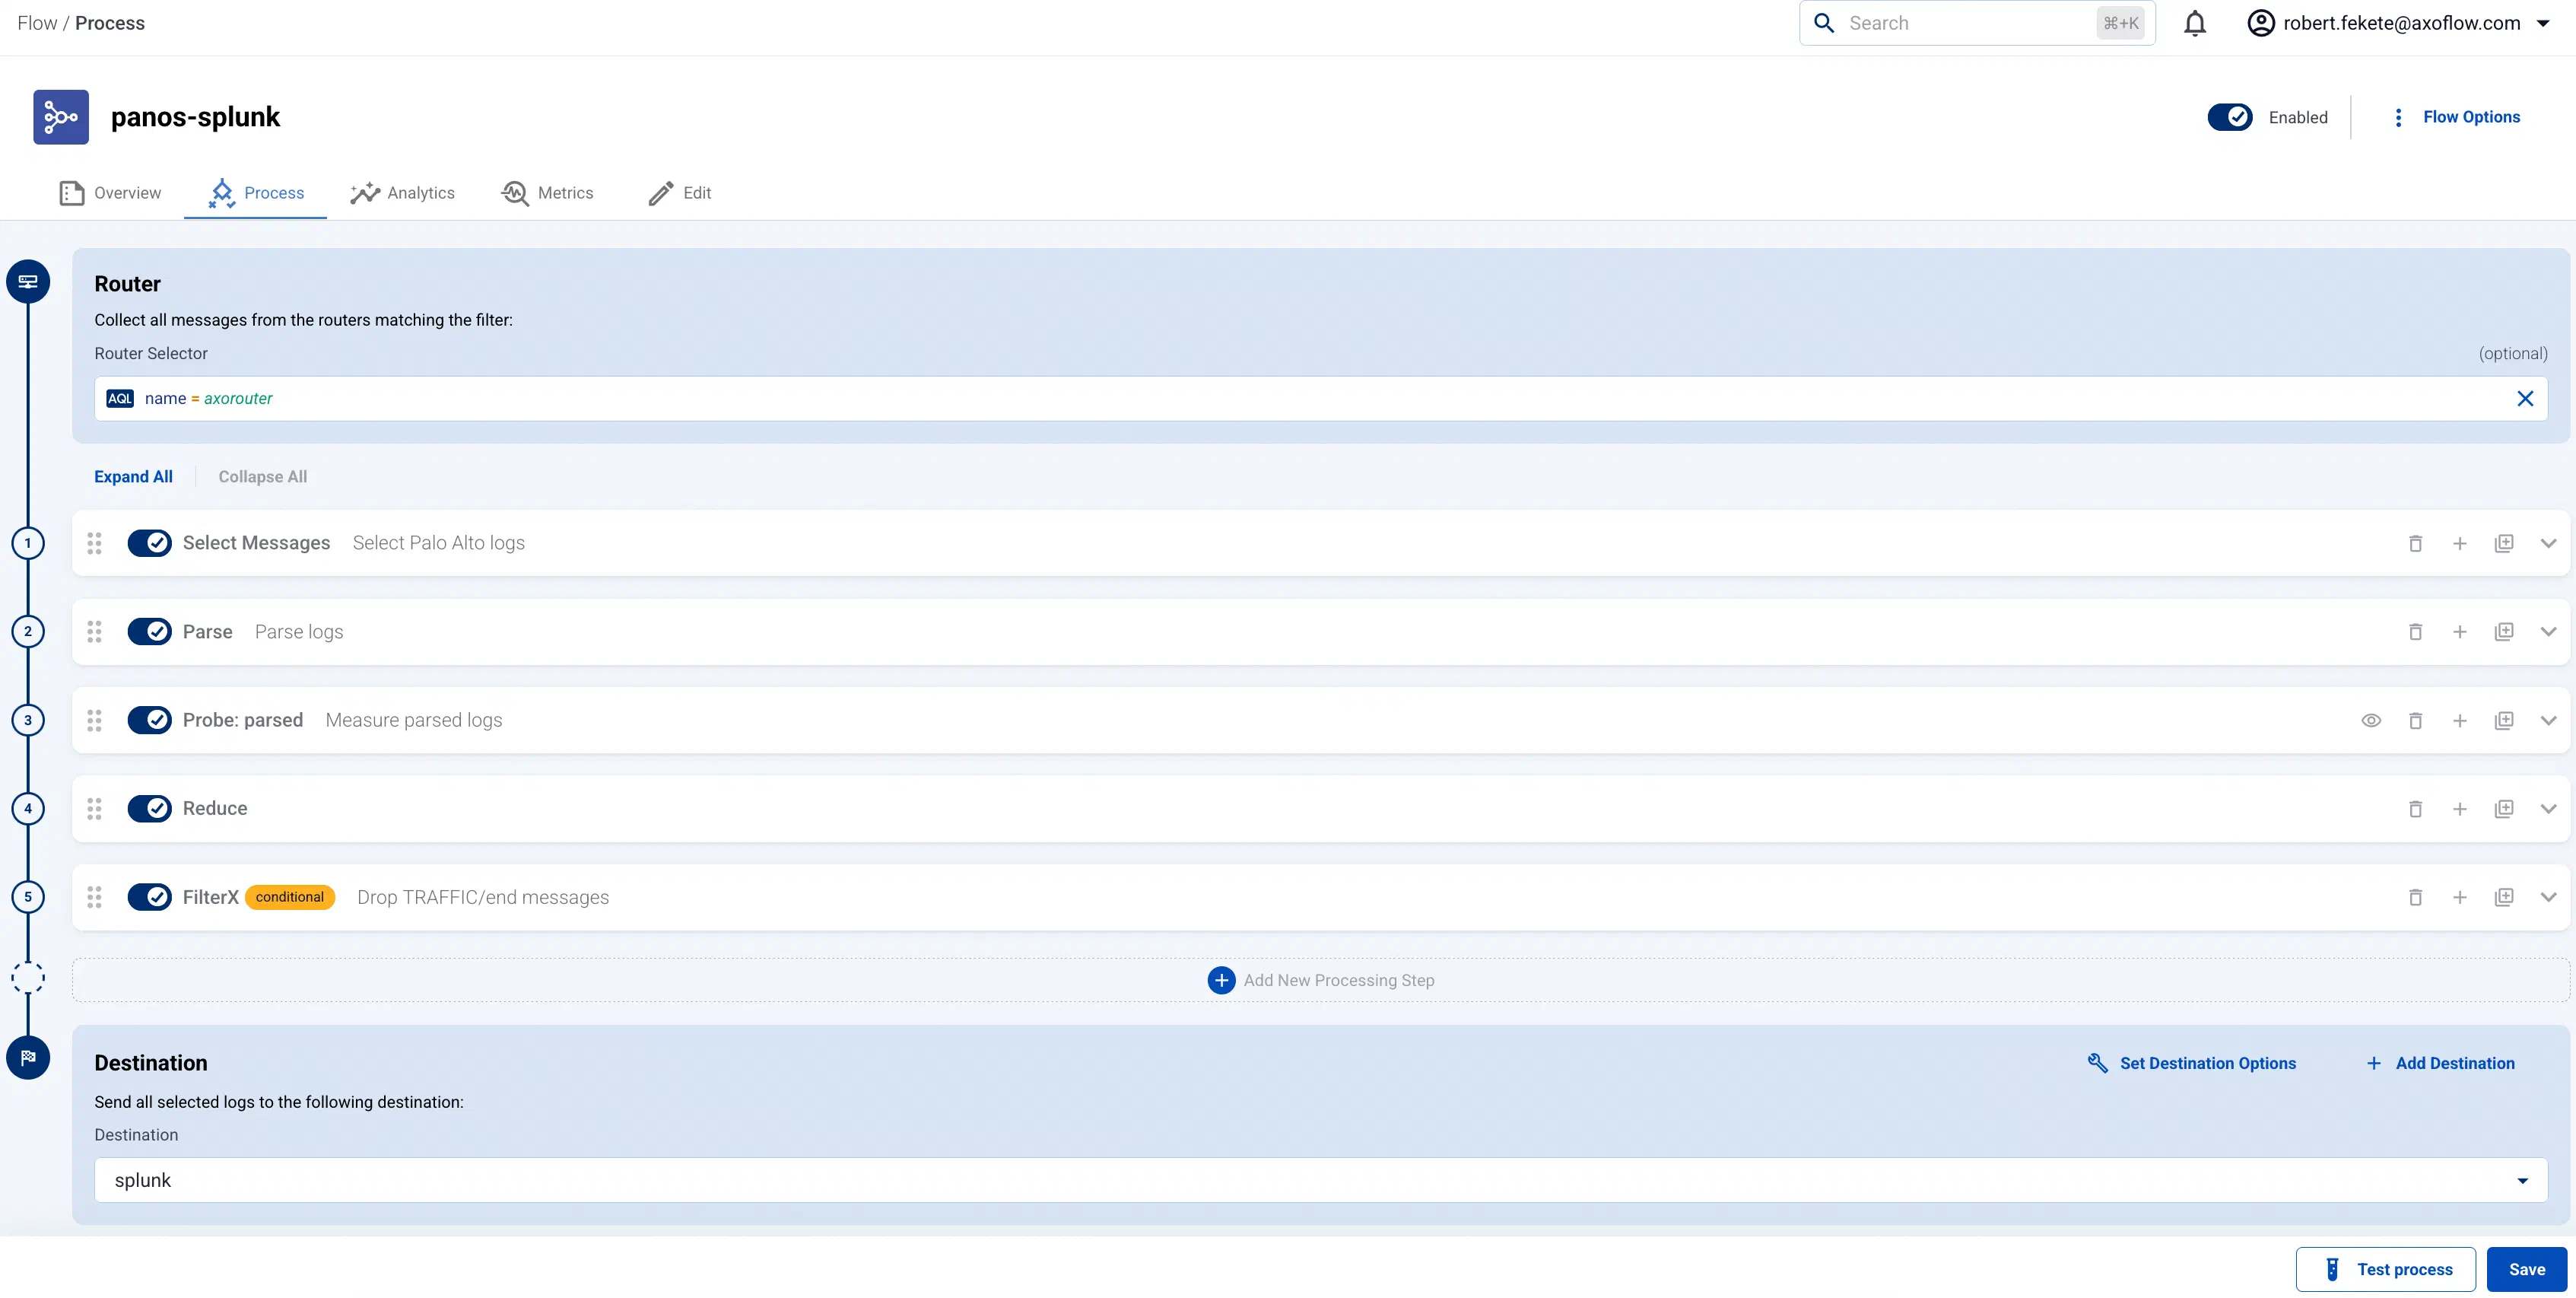
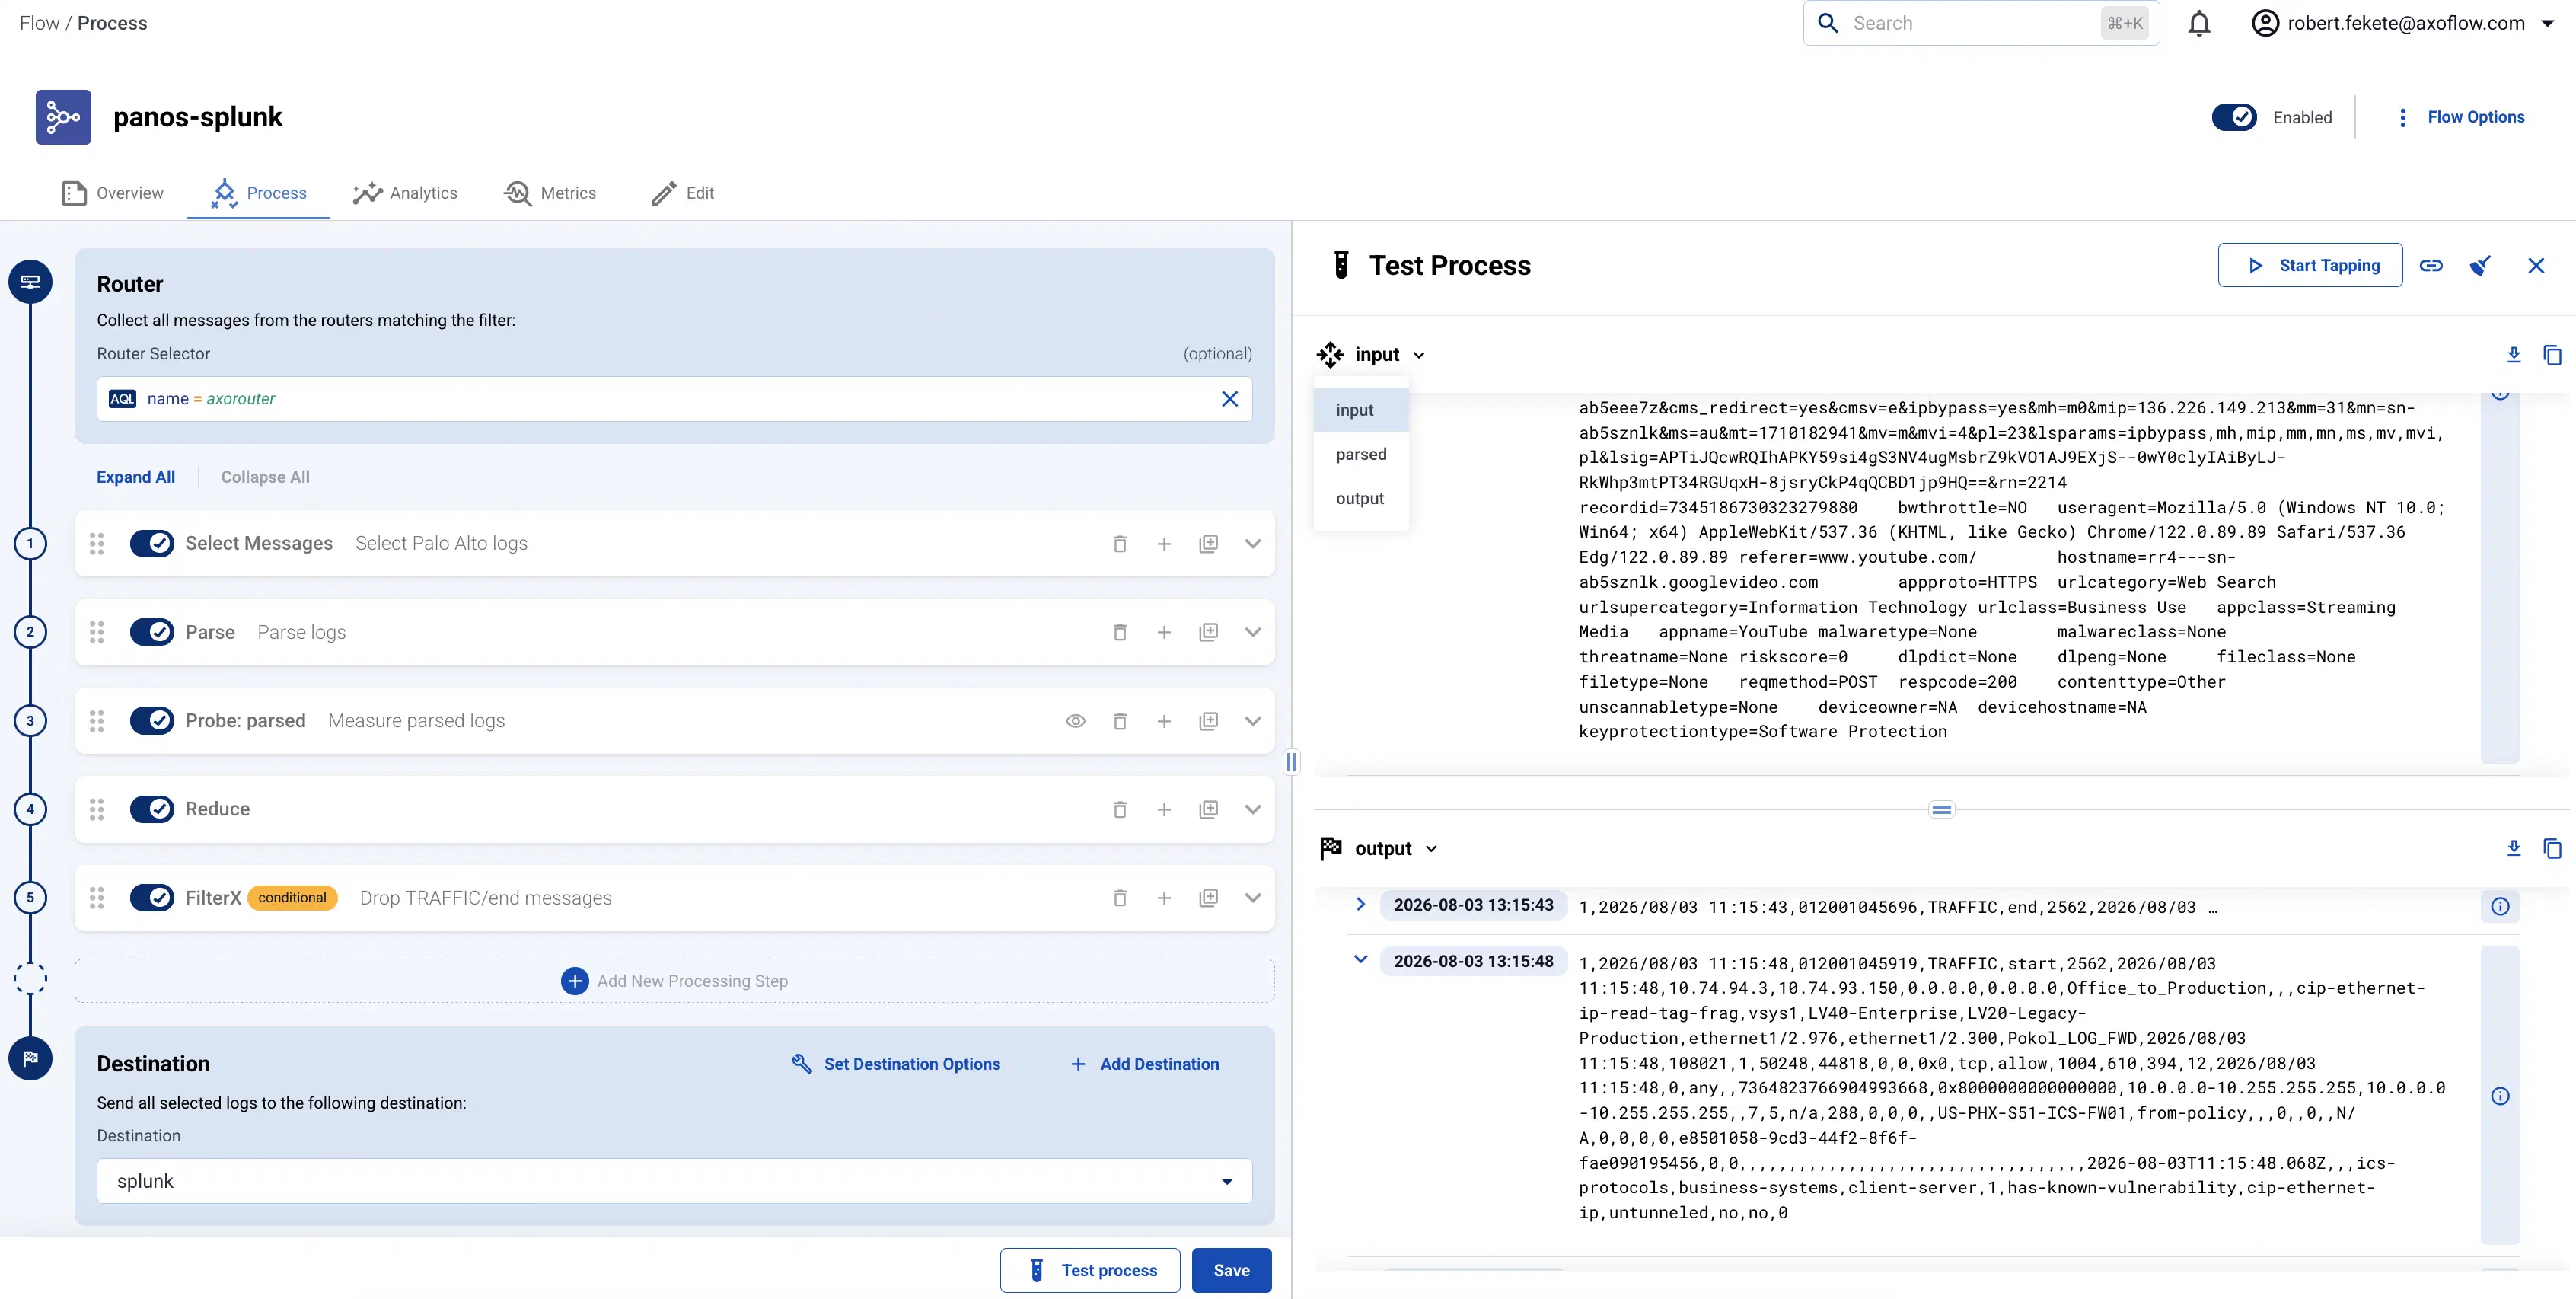
Select the flow you want to tap into, then select Process > Test process.
-
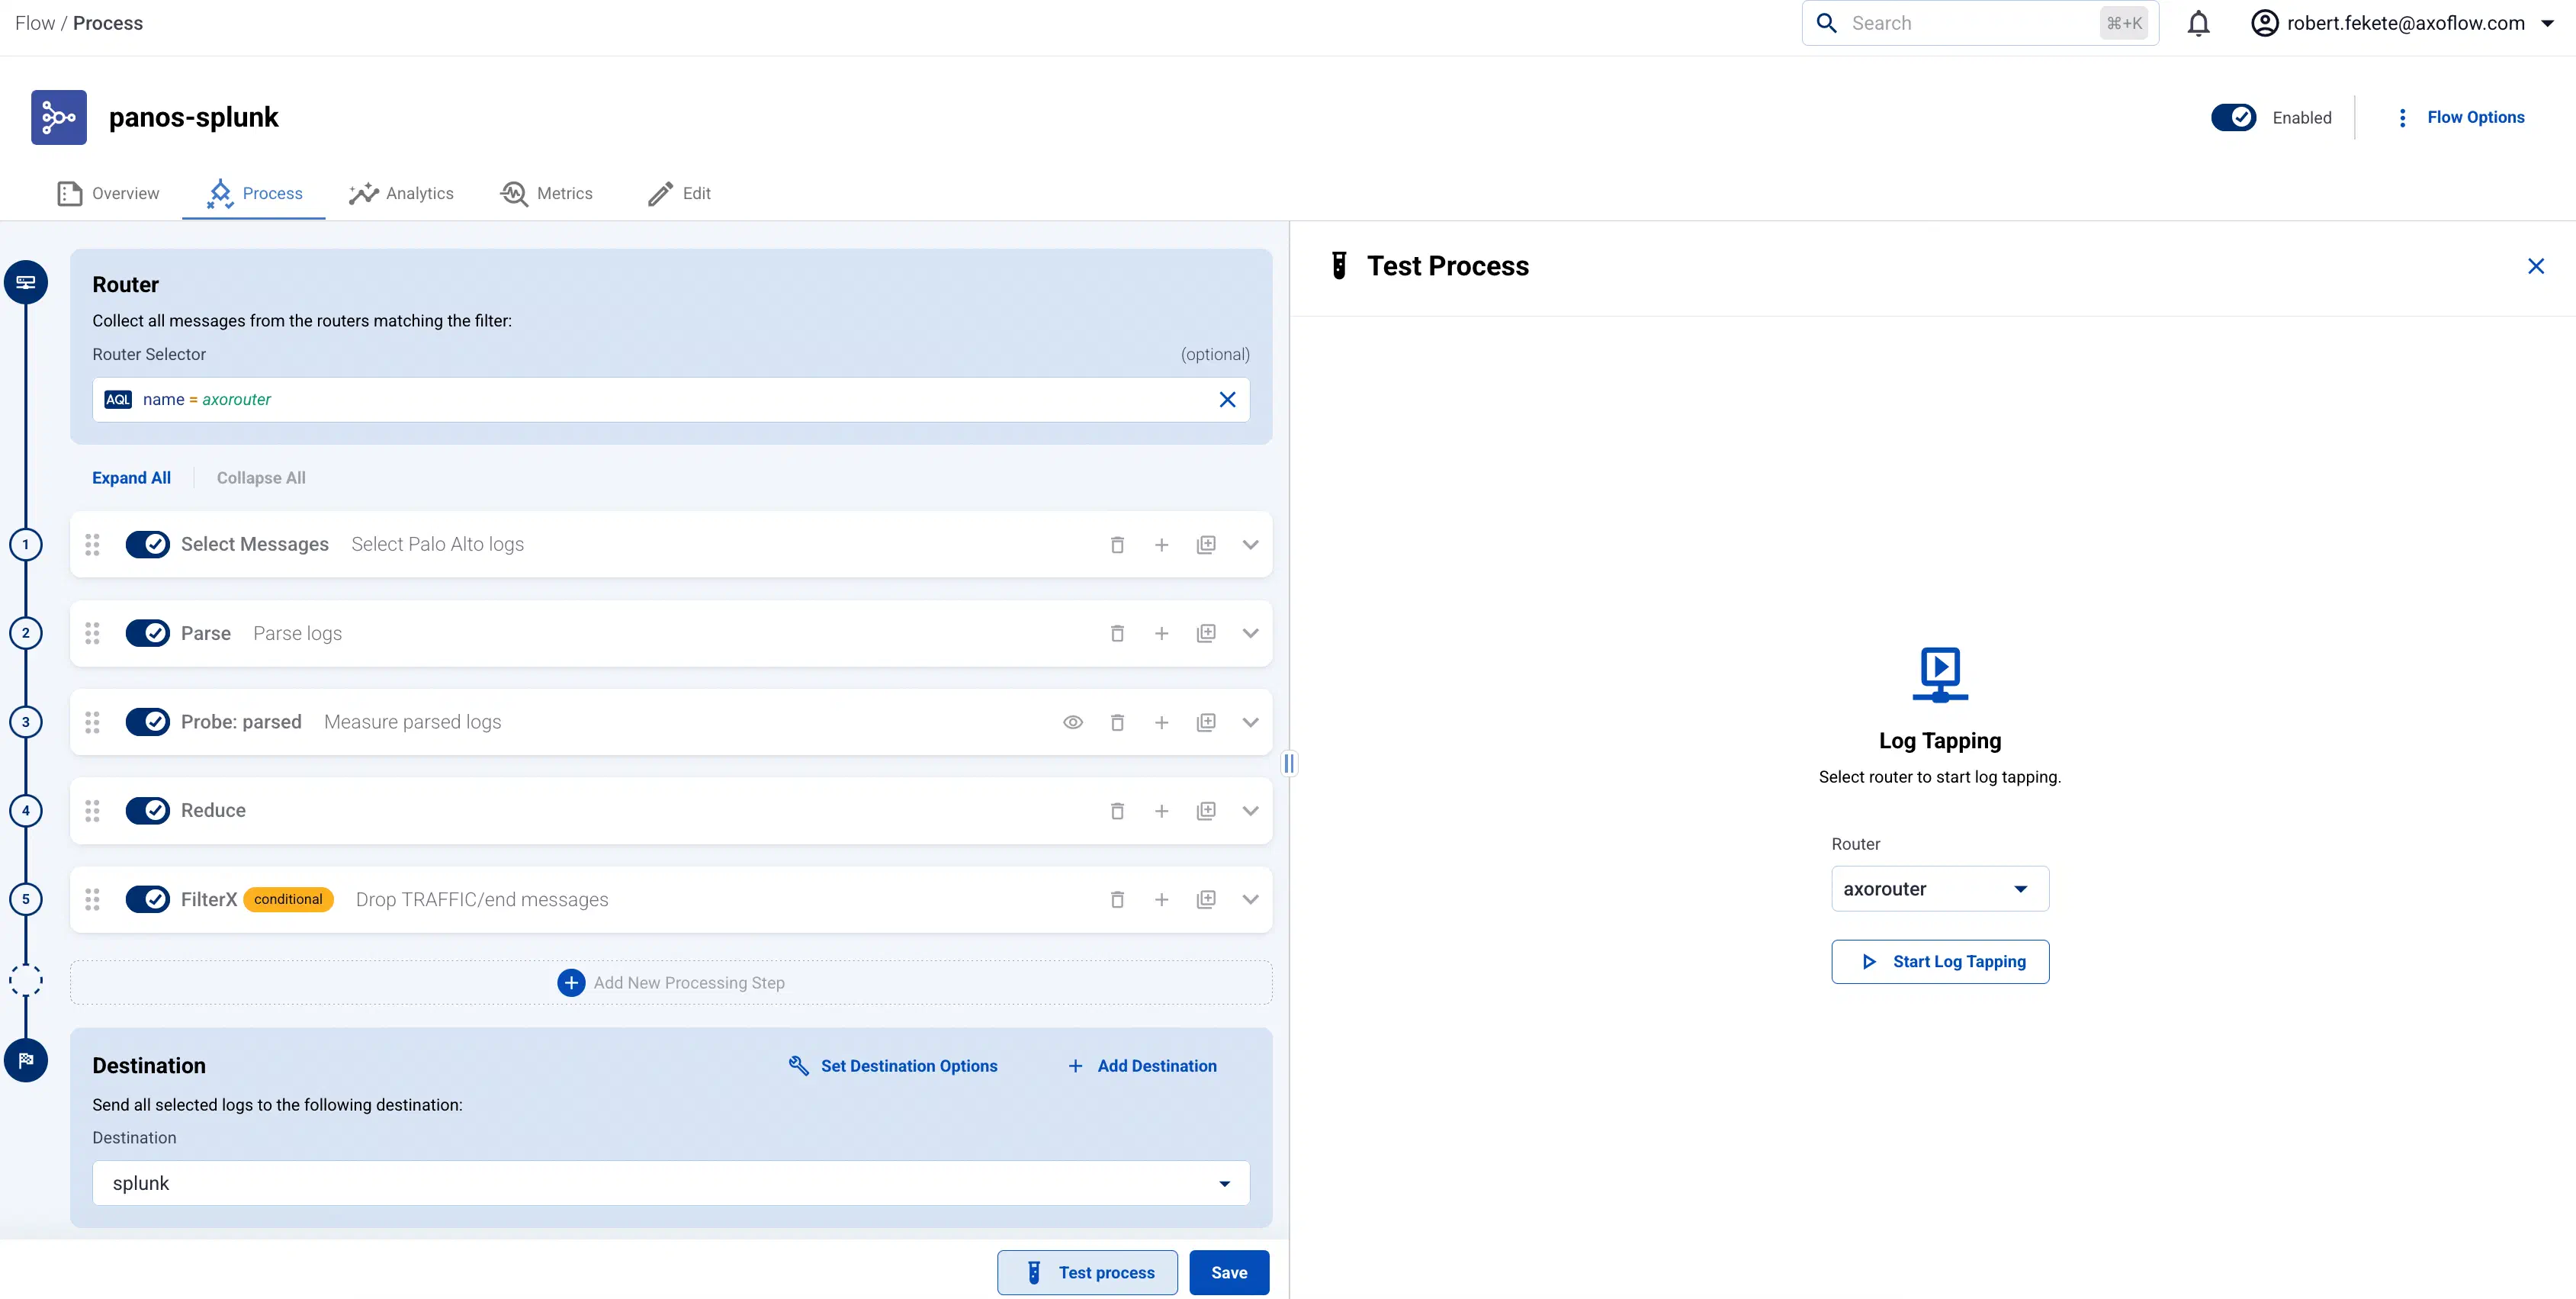
Select the router where you want to tap into the flow, then click Start Log Tapping.
-
AxoConsole displays a sample of the logs from the data flow in matched pairs for the input and the output of the flow.
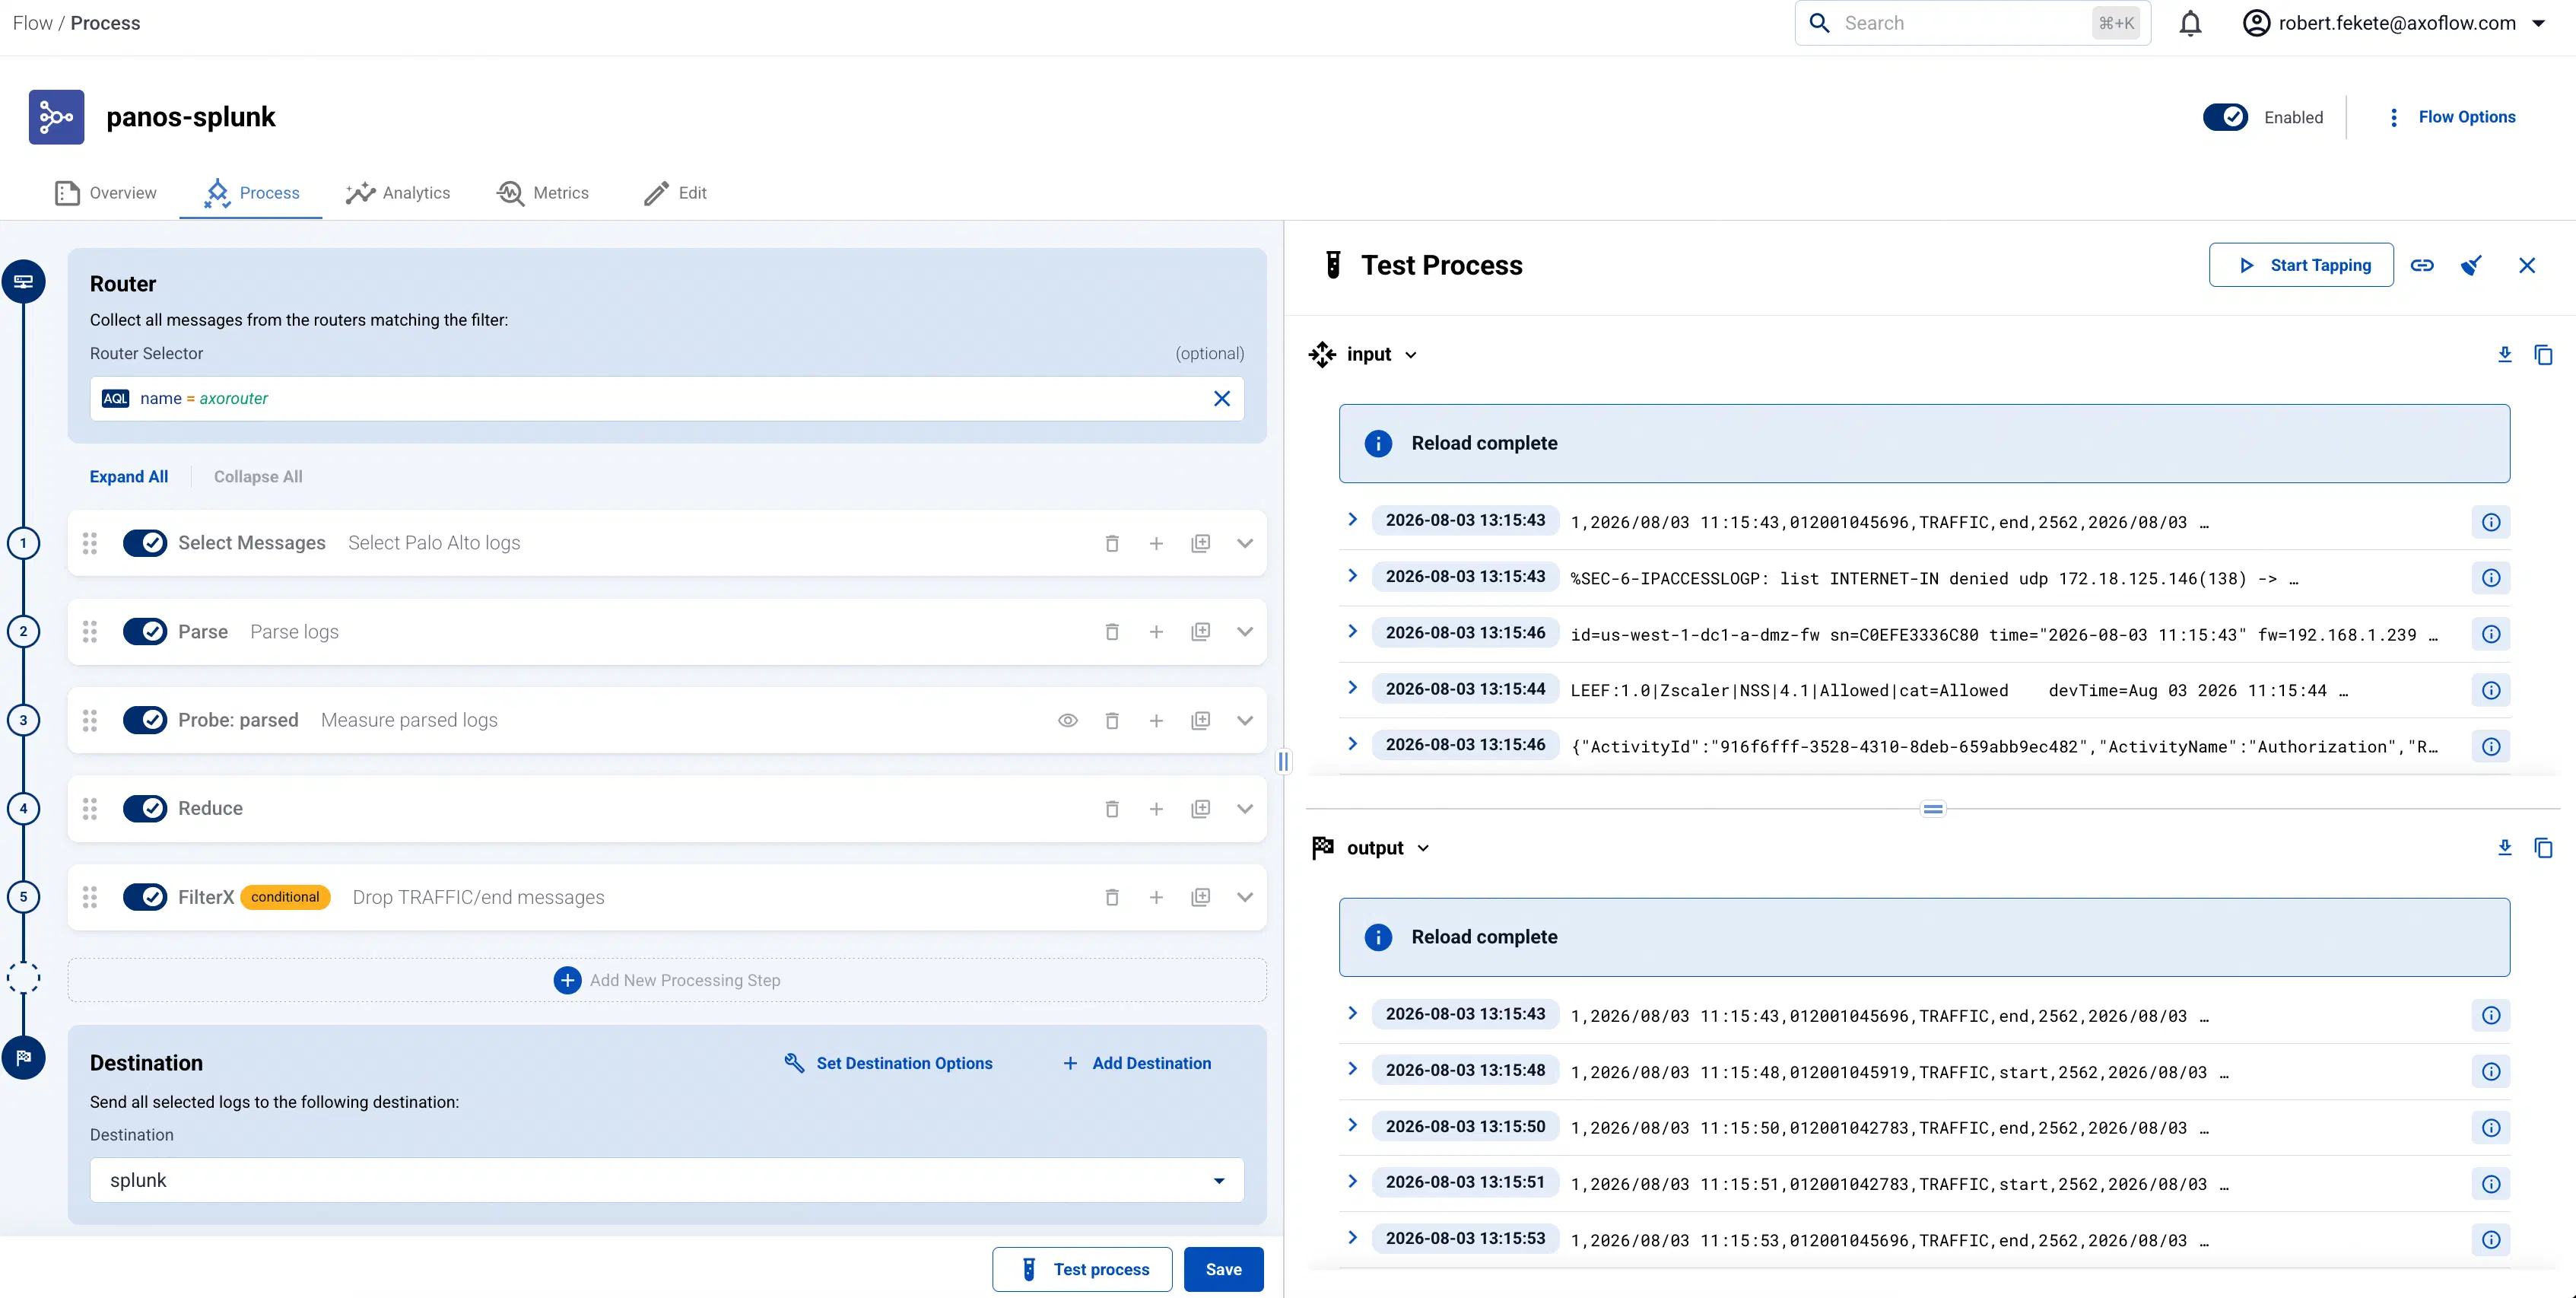
The input point is after the source connector finished processing the incoming message (including parsing and classification performed by the connector).
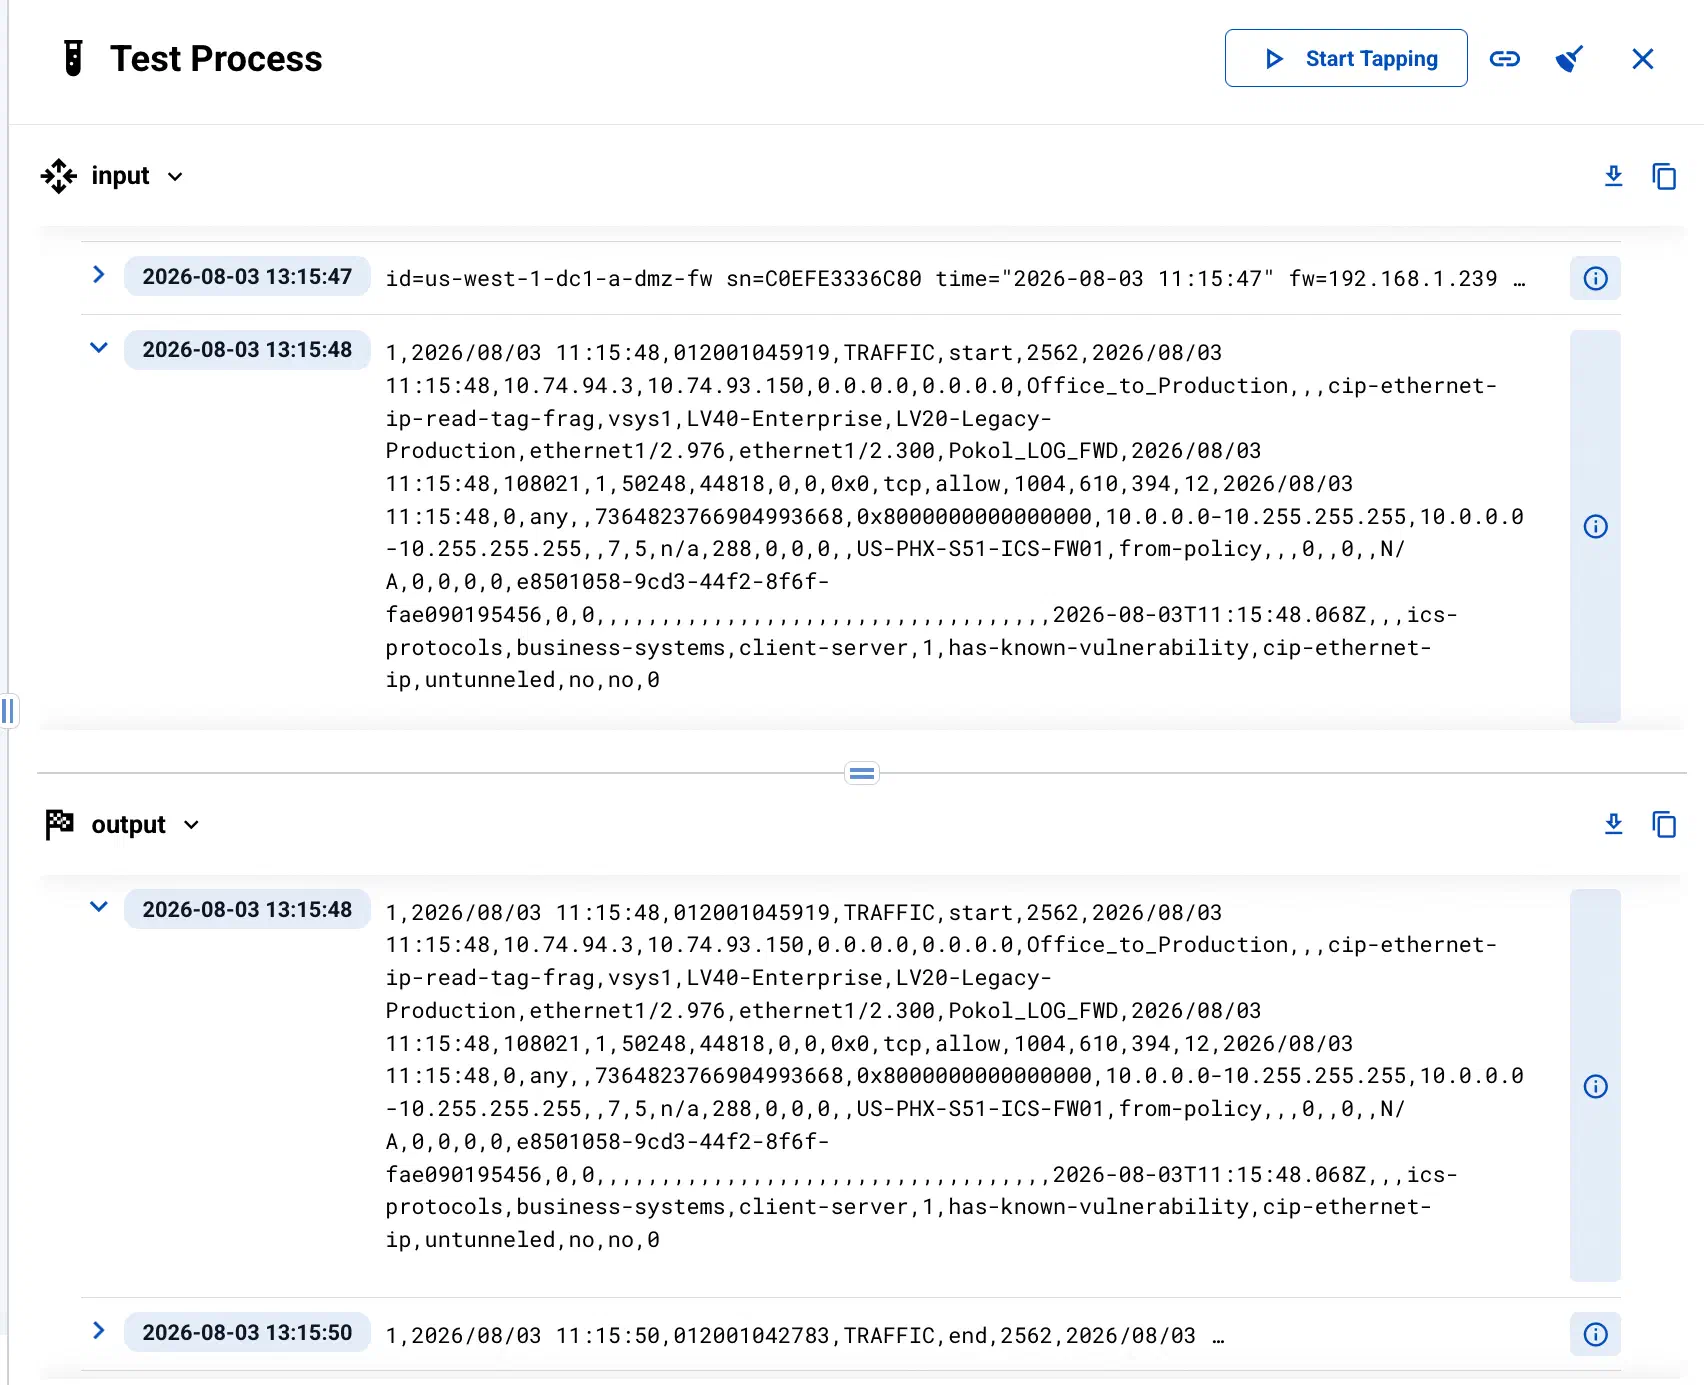
The output shows the messages right before they are formatted according to the specific destination’s requirements. By default, the messages are linked: opening the details of a message in the output automatically opens the details of the message input window, and vice versa (provided the message you clicked exists in both windows). If you want to compare a message with other messages, click to disable linking.
-
If the flow contains one or more Probe steps, you can select the probe as the tapping point. That way you can check how the different processing steps modify your messages. You can change the first and the second tapping point by clicking and , respectively.
-
When the logs you’re interested in show up, select Pause Tapping, then click the icon next to a log message to see its details.
The Event Details panel allows you to inspect a specific event. For details on the available fields and their structure, see Message schema reference.
-
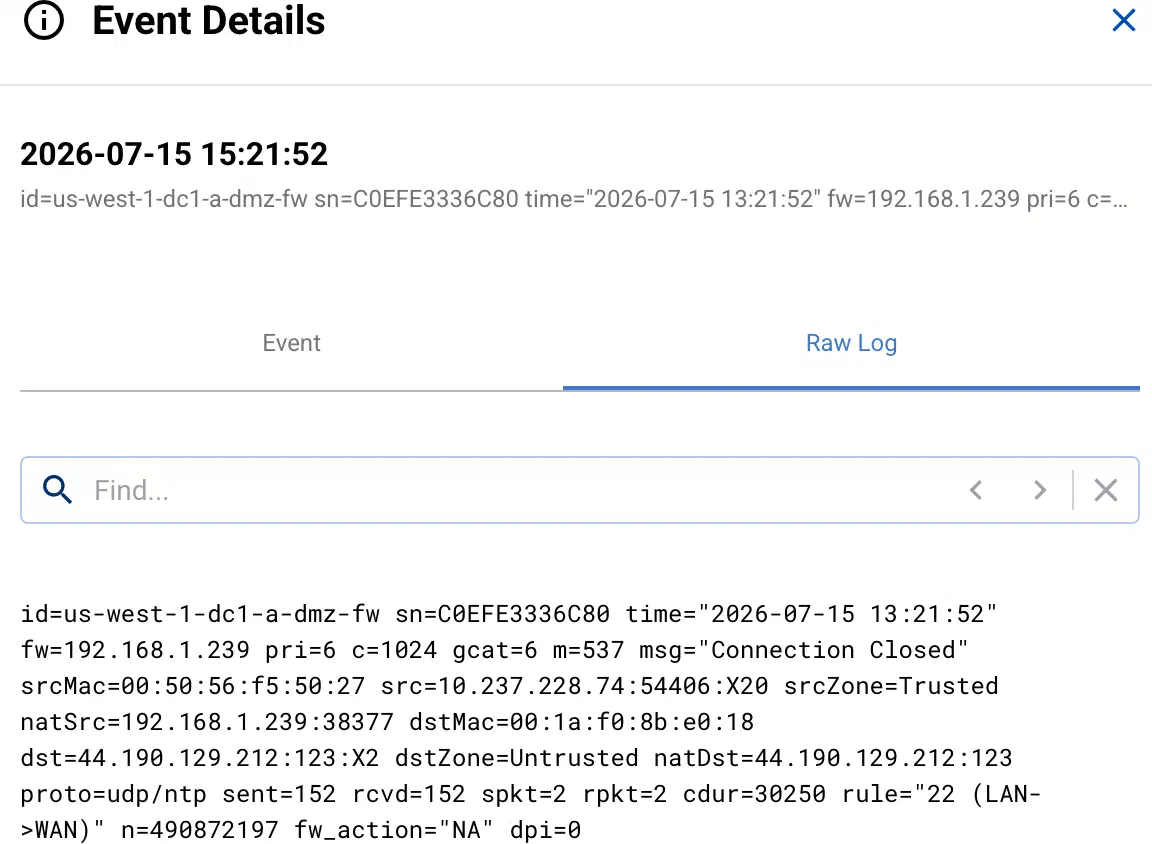
To display the original log message, select Raw Log.
-
To copy the entire event as JSON to the clipboard, select Copy as JSON.
-
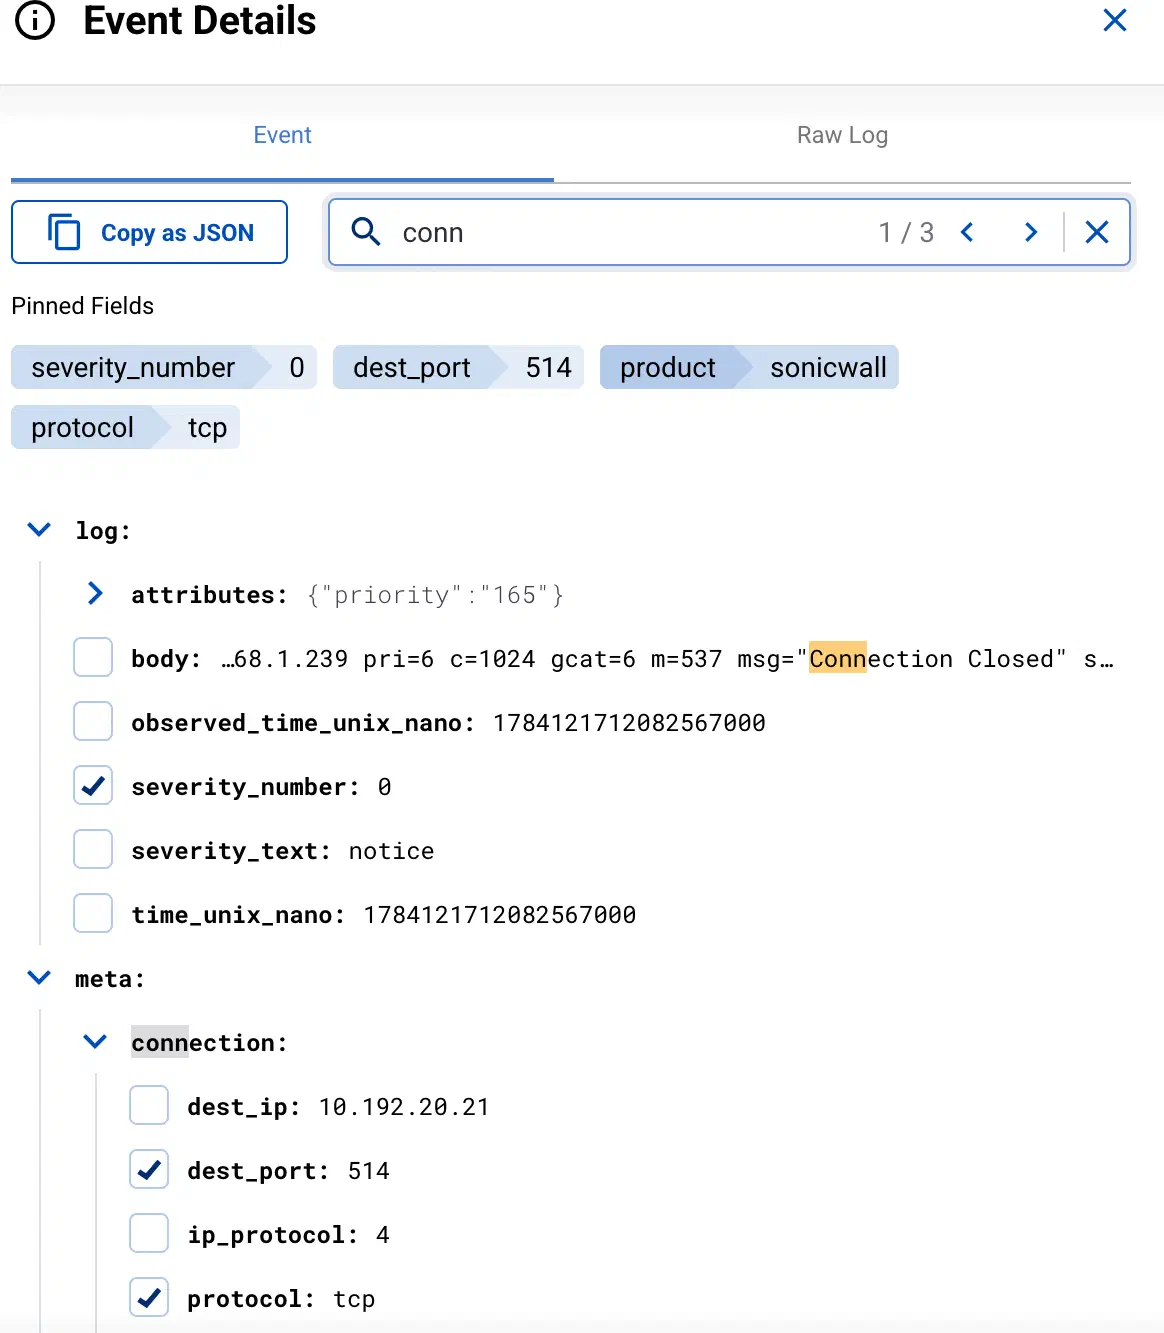
To search the event body and metadata, enter a search keyword into the Find field. This searches for the string on the Event Details panel, including the log, metadata, or label names and values.
-
To add a field to the Pinned Fields and display it for every event, click the checkbox before the field. Pinned fields show up in the event details, and also in the list of the events, making it easy to get a quick glance on the distribution of the field values. They’re included as separate fields when you Export the search results into a CSV file.
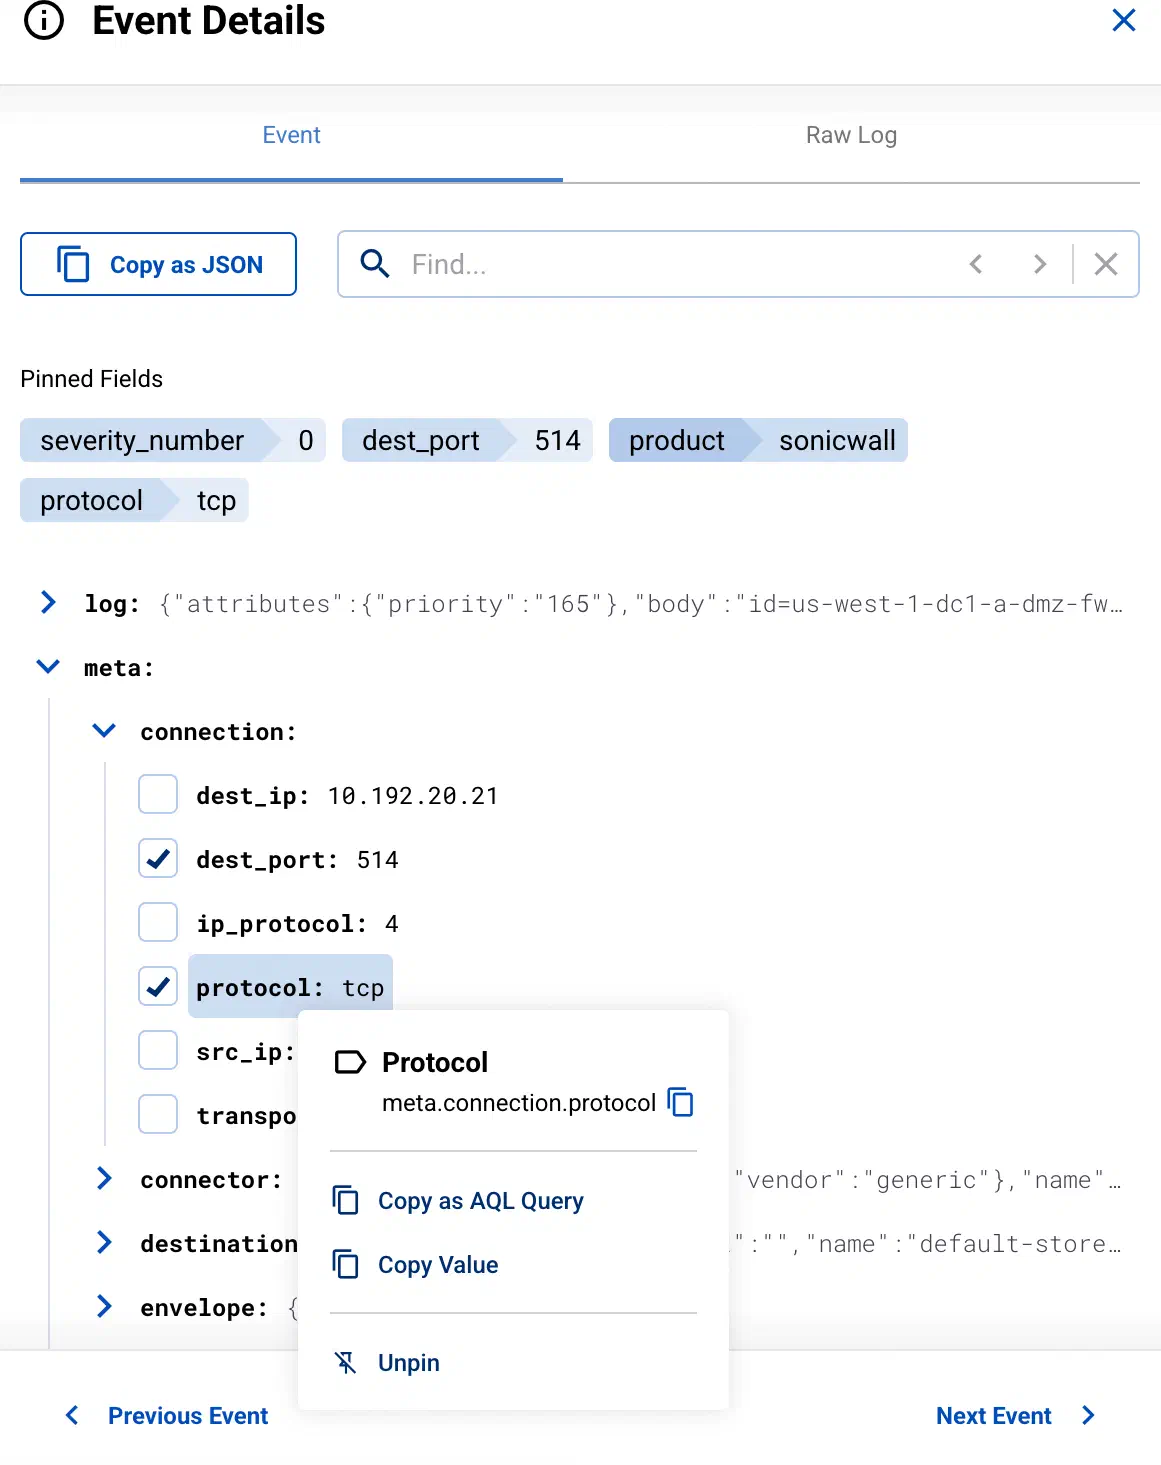
To unpin a field, select the field in any of the events, then select Unpin from the local menu.
-
To copy the name or the value of a field, select the name of the field, then select or Copy Value.
-
To copy an AQL query that matches this field and its current value, select the name of the field, then select Copy as AQL Query. You can paste this query into the AQL search field, and use it for filtering.
-
If the field refers to a pipeline element in Axoflow (for example, a flow in the
meta.flowfield, a store, or an AxoRouter), you can jump to the page of the related element.
-
-
Diff view. To display the line-by-line difference between the state of a message at two stages of processing, open the event details and select Diff.
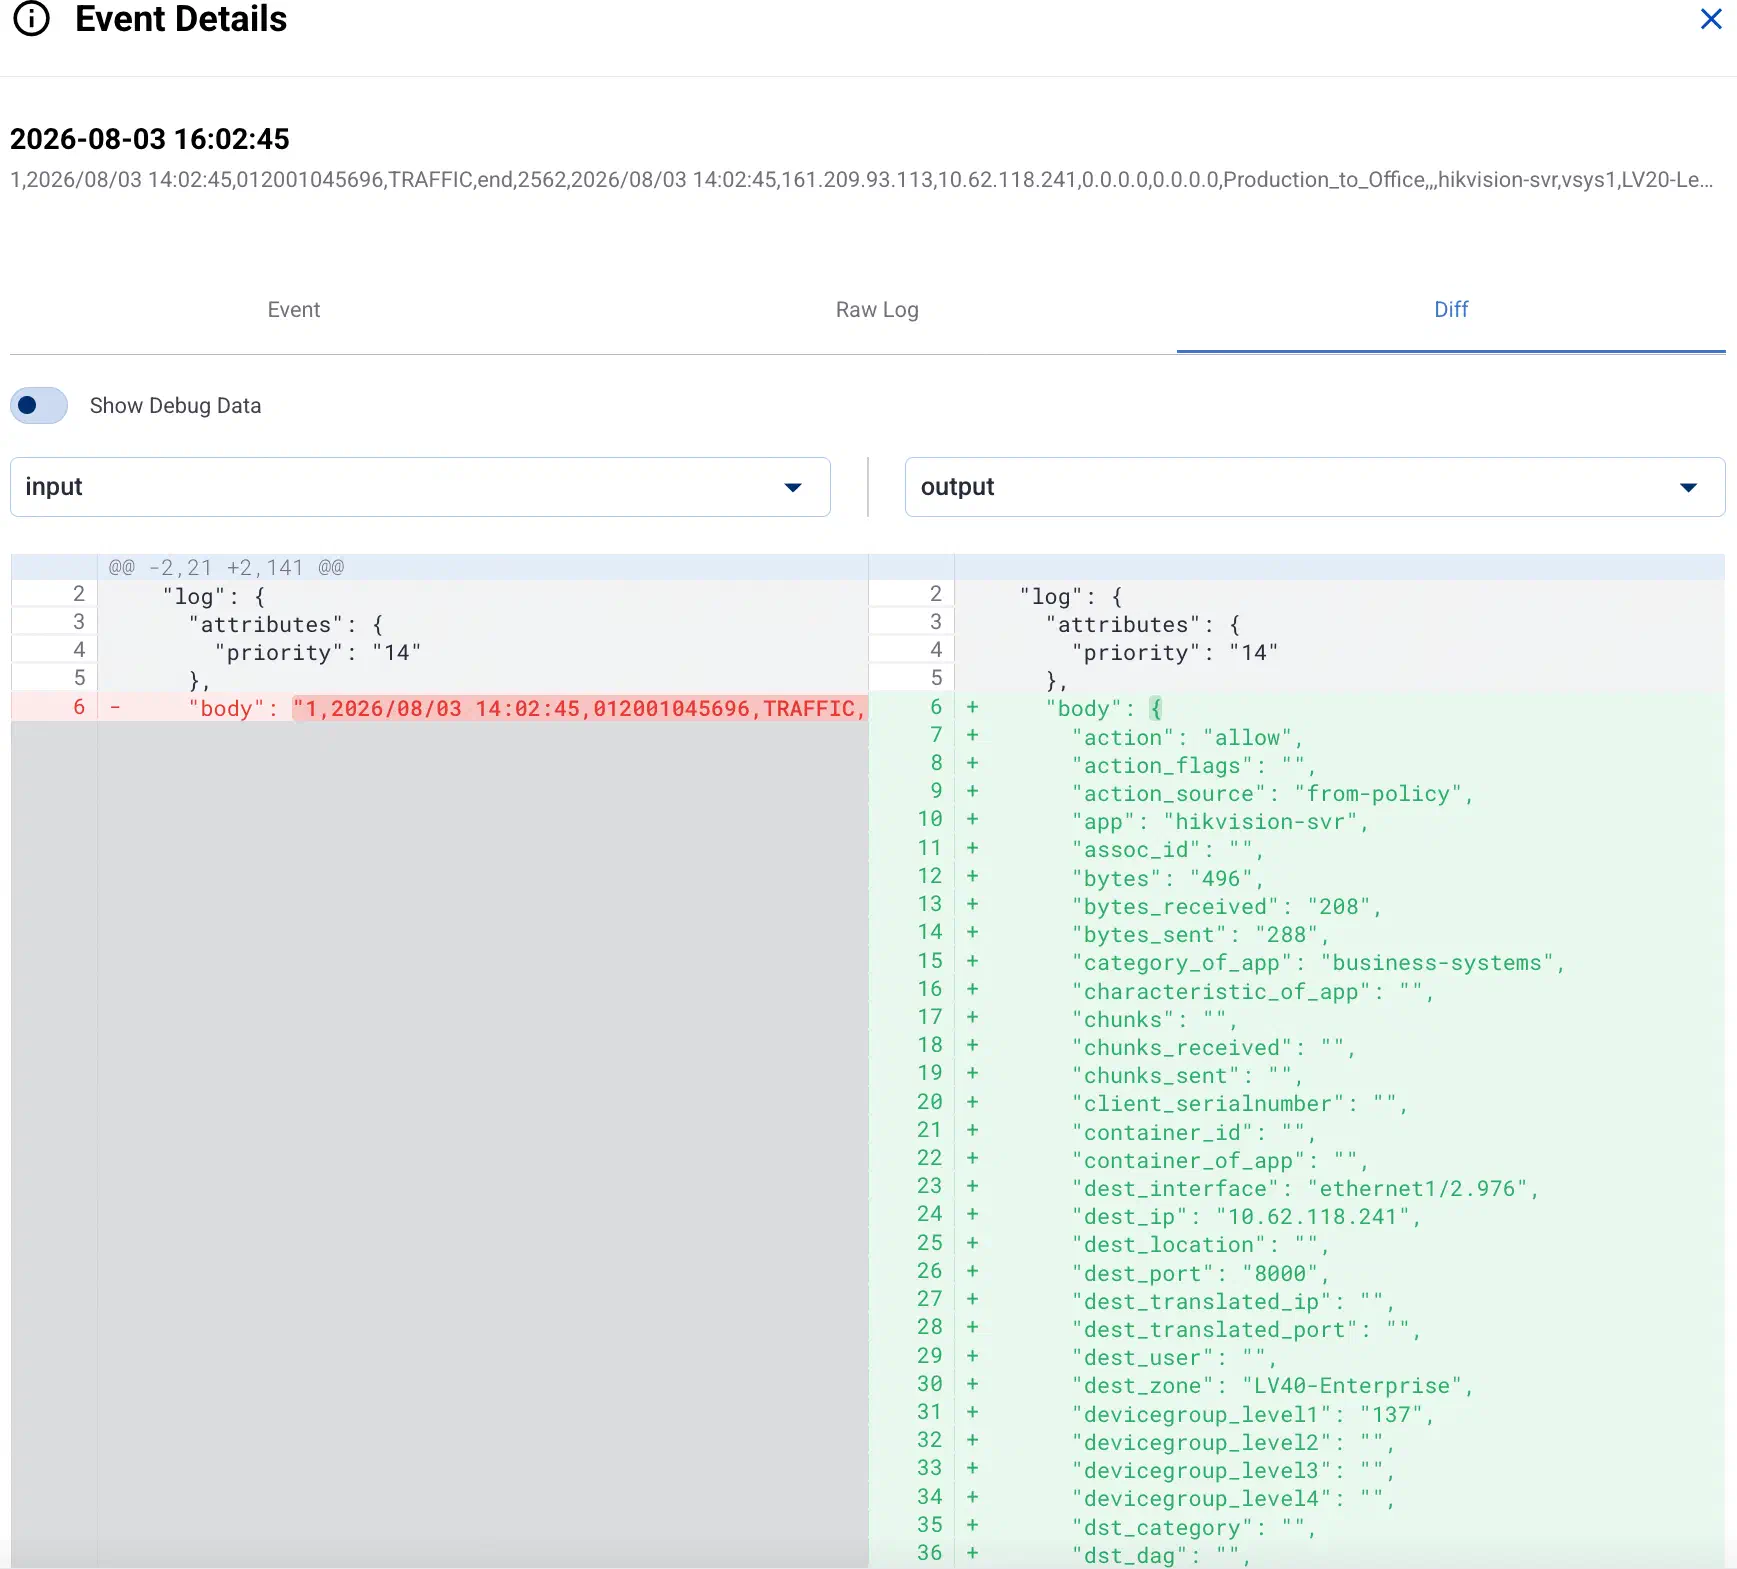
The internal JSON representation of the message and its metadata is displayed, compared to the previous probe of the flow.
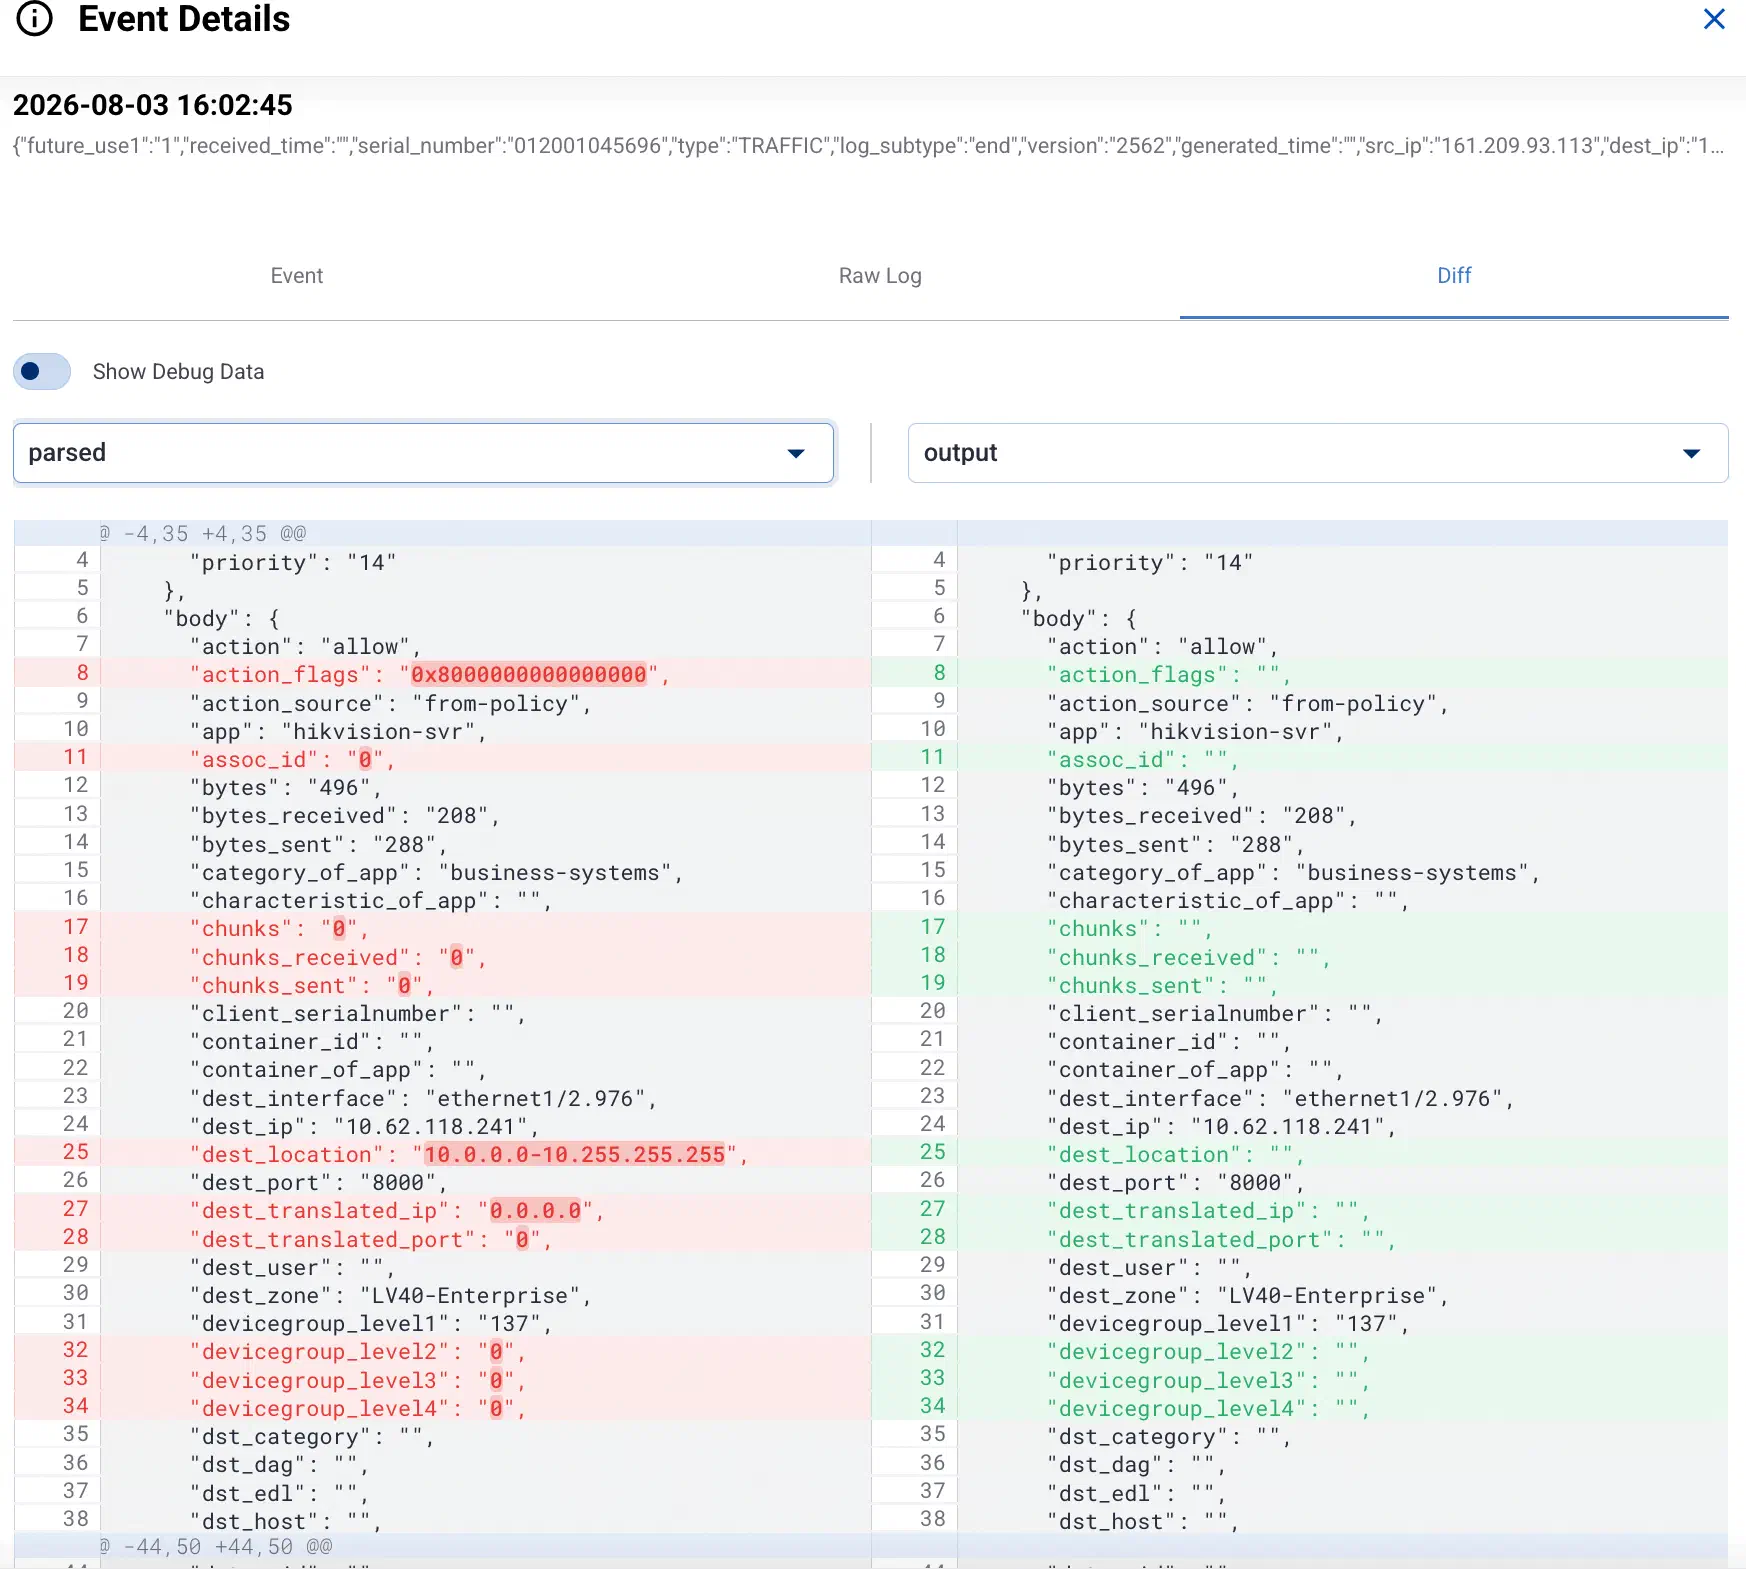
You can change the probe in the right-hand pane, and the left side automatically switches to the previous probe in the flow. For example, the following screenshot shows a message after parsing. You can see that the initial string representation of the message body has been replaced with a structured JSON object.
Service status messages
While a tapping session is active, AxoConsole shows status messages about the tapped service inline in the log stream, color-coded by severity. These messages don’t come from your data sources. Axoflow inserts them to tell you when the service is restarted or its configuration is reloaded, for example, after you save a change to a flow or a connector rule. That way you can tell whether a change in the messages you see is the result of your configuration change, and notice when applying the new configuration failed.
The following status messages can appear:
| Message | Severity | Meaning |
|---|---|---|
Restarting service |
notice | AxoConsole has started restarting the service. |
Service restart initiated successfully |
notice | The service has accepted the restart request. |
Restart failed: <details> |
error | The service couldn’t be restarted. |
Reload complete |
notice | The service is running with the new configuration. |
Reload failed: <details> |
error | The service couldn’t apply the new configuration, and keeps running with the previous one. Usually this means that the new configuration is invalid, for example, a FilterX processing step contains a syntax error. |
Reload blocked due to missing config files: <details> |
error | The service couldn’t apply the new configuration because a file it references (such as a certificate) isn’t available on the host. |
Show debug data
The details of a tapped message can include a debug field that shows how AxoRouter represents the message internally:
debug.filterxcontains the FilterX variables that are set when the message reaches the tapping point.debug.msgcontains the name-value pairs of the message.
These fields are hidden by default. To display them, open the details of a message, then select Show Debug Data. The switch is available only for messages that have debug data.
Debug data is useful when you’re troubleshooting a processing step that doesn’t behave as you expect, or when Axoflow support asks you for it. For the fields of the message itself, see Message schema reference.