Axoflow architecture
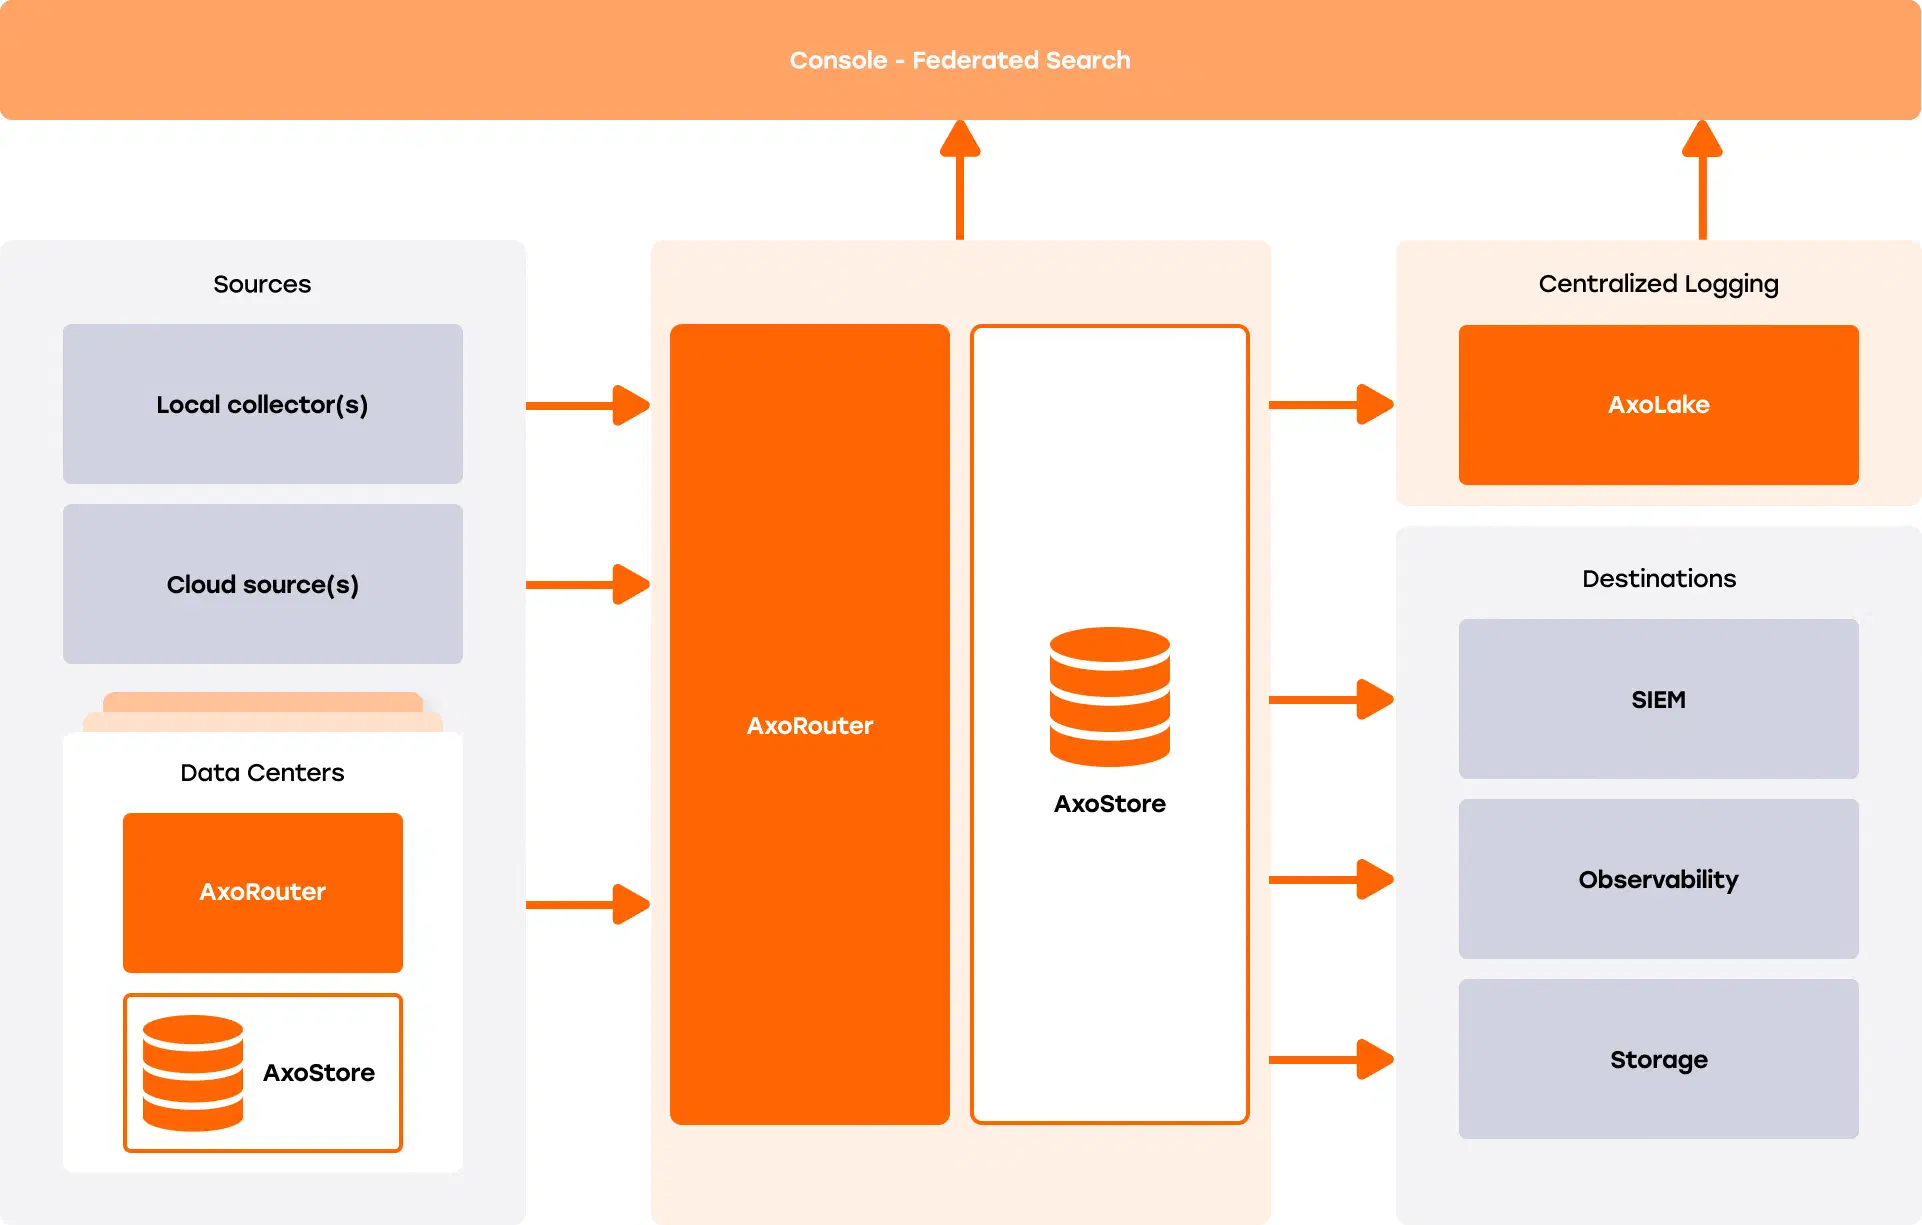
The Axoflow provides an end-to-end pipeline automating the collection, management and loading of your security data in a vendor-agnostic way. The following figure highlights the Axoflow data flow:
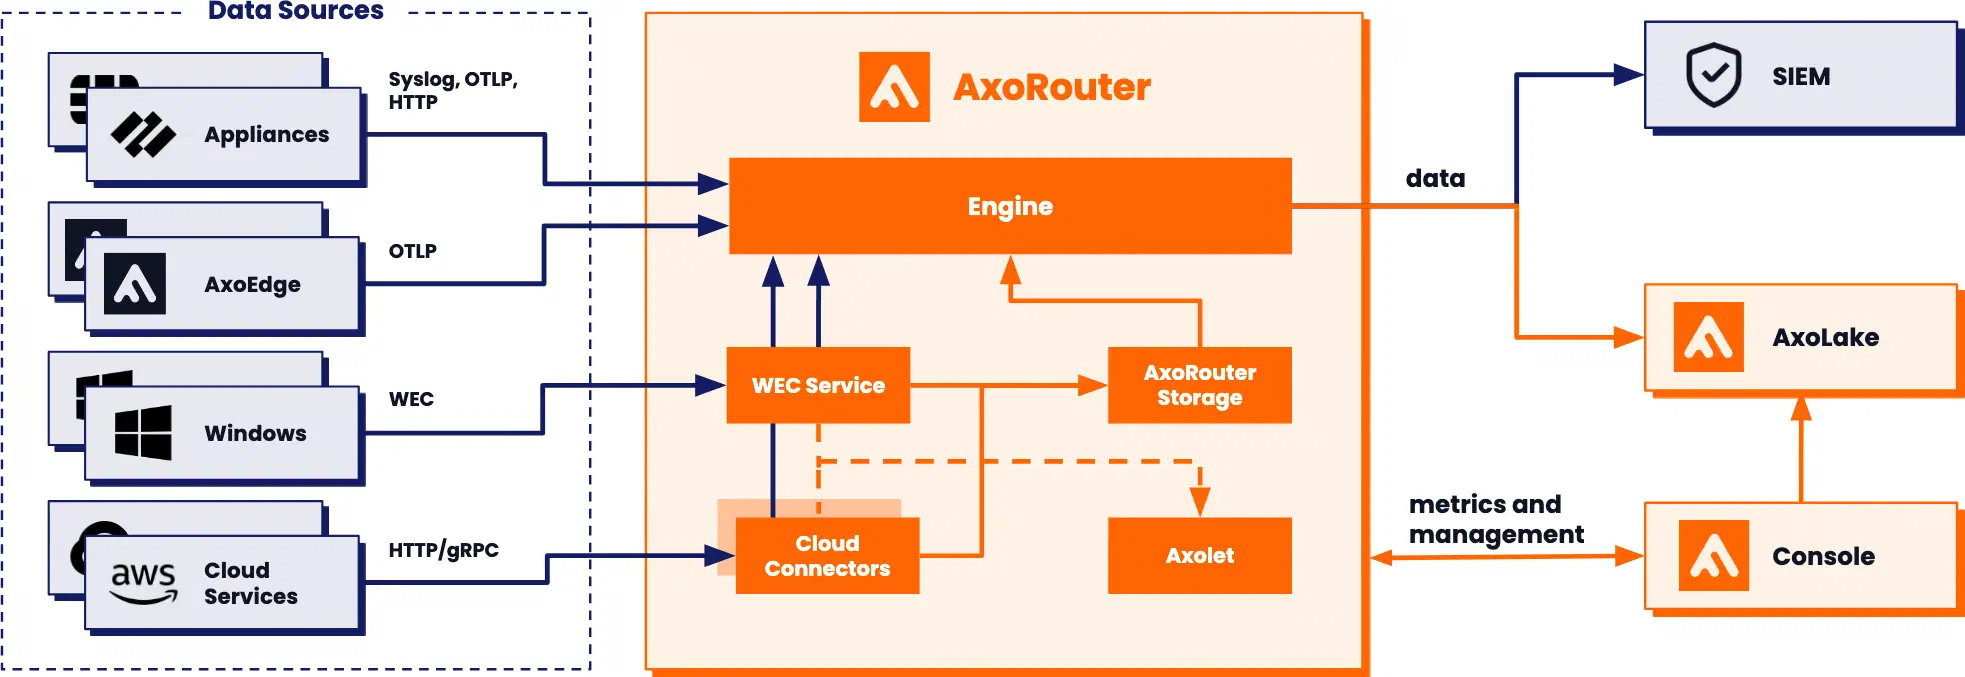
Axoflow architecture
The architecture of Axoflow is comprised of two main elements: the AxoConsole and the Data Plane.
-
The AxoConsole is primarily concerned with highlighting the metadata of each event. This includes the source from which it originated, the size in bytes (and event count over time), its destination, and any other element which describes the data.
-
The Data Plane includes collector agents and processing engines (like AxoRouter) that collect, classify, filter, transform, and deliver telemetry data to its proper destinations (SIEMs, storage), and provide metrics to the AxoConsole. The components of the Data Plane can be managed from the AxoConsole, or can be independent.
Pipeline components
A telemetry pipeline consists of the following high-level components:
-
Data Sources: Data sources are the endpoints of the pipeline that generate the logs and other telemetry data you want to collect. For example, firewalls and other appliances, Kubernetes clusters, application servers can all be data sources. Data sources send their data either directly to a destination, or to a router.
Axoflow provides several log collecting agents and solutions to collect data in different environments, including connectors for cloud services, Kubernetes clusters, Linux servers, and Windows servers.
-
Routers: Router (also called relays or aggregators) collect the data from a set of data sources and transport them to the destinations.
AxoRouter can collect, curate, and enrich the data: it automatically identifies your log sources and fixes common errors in the incoming data. It also converts the data into a format that best suits the destination to optimize ingestion speed and data quality.
-
Destinations: Destinations are your SIEM and storage solutions where the telemetry pipeline delivers your security data.
Your telemetry pipeline can consist of managed and unmanaged components. You can deploy and configure managed components from the AxoConsole. Axoflow provides several managed Axoflow agent components that help you collect or fetch data from your various data sources, or act as routers.
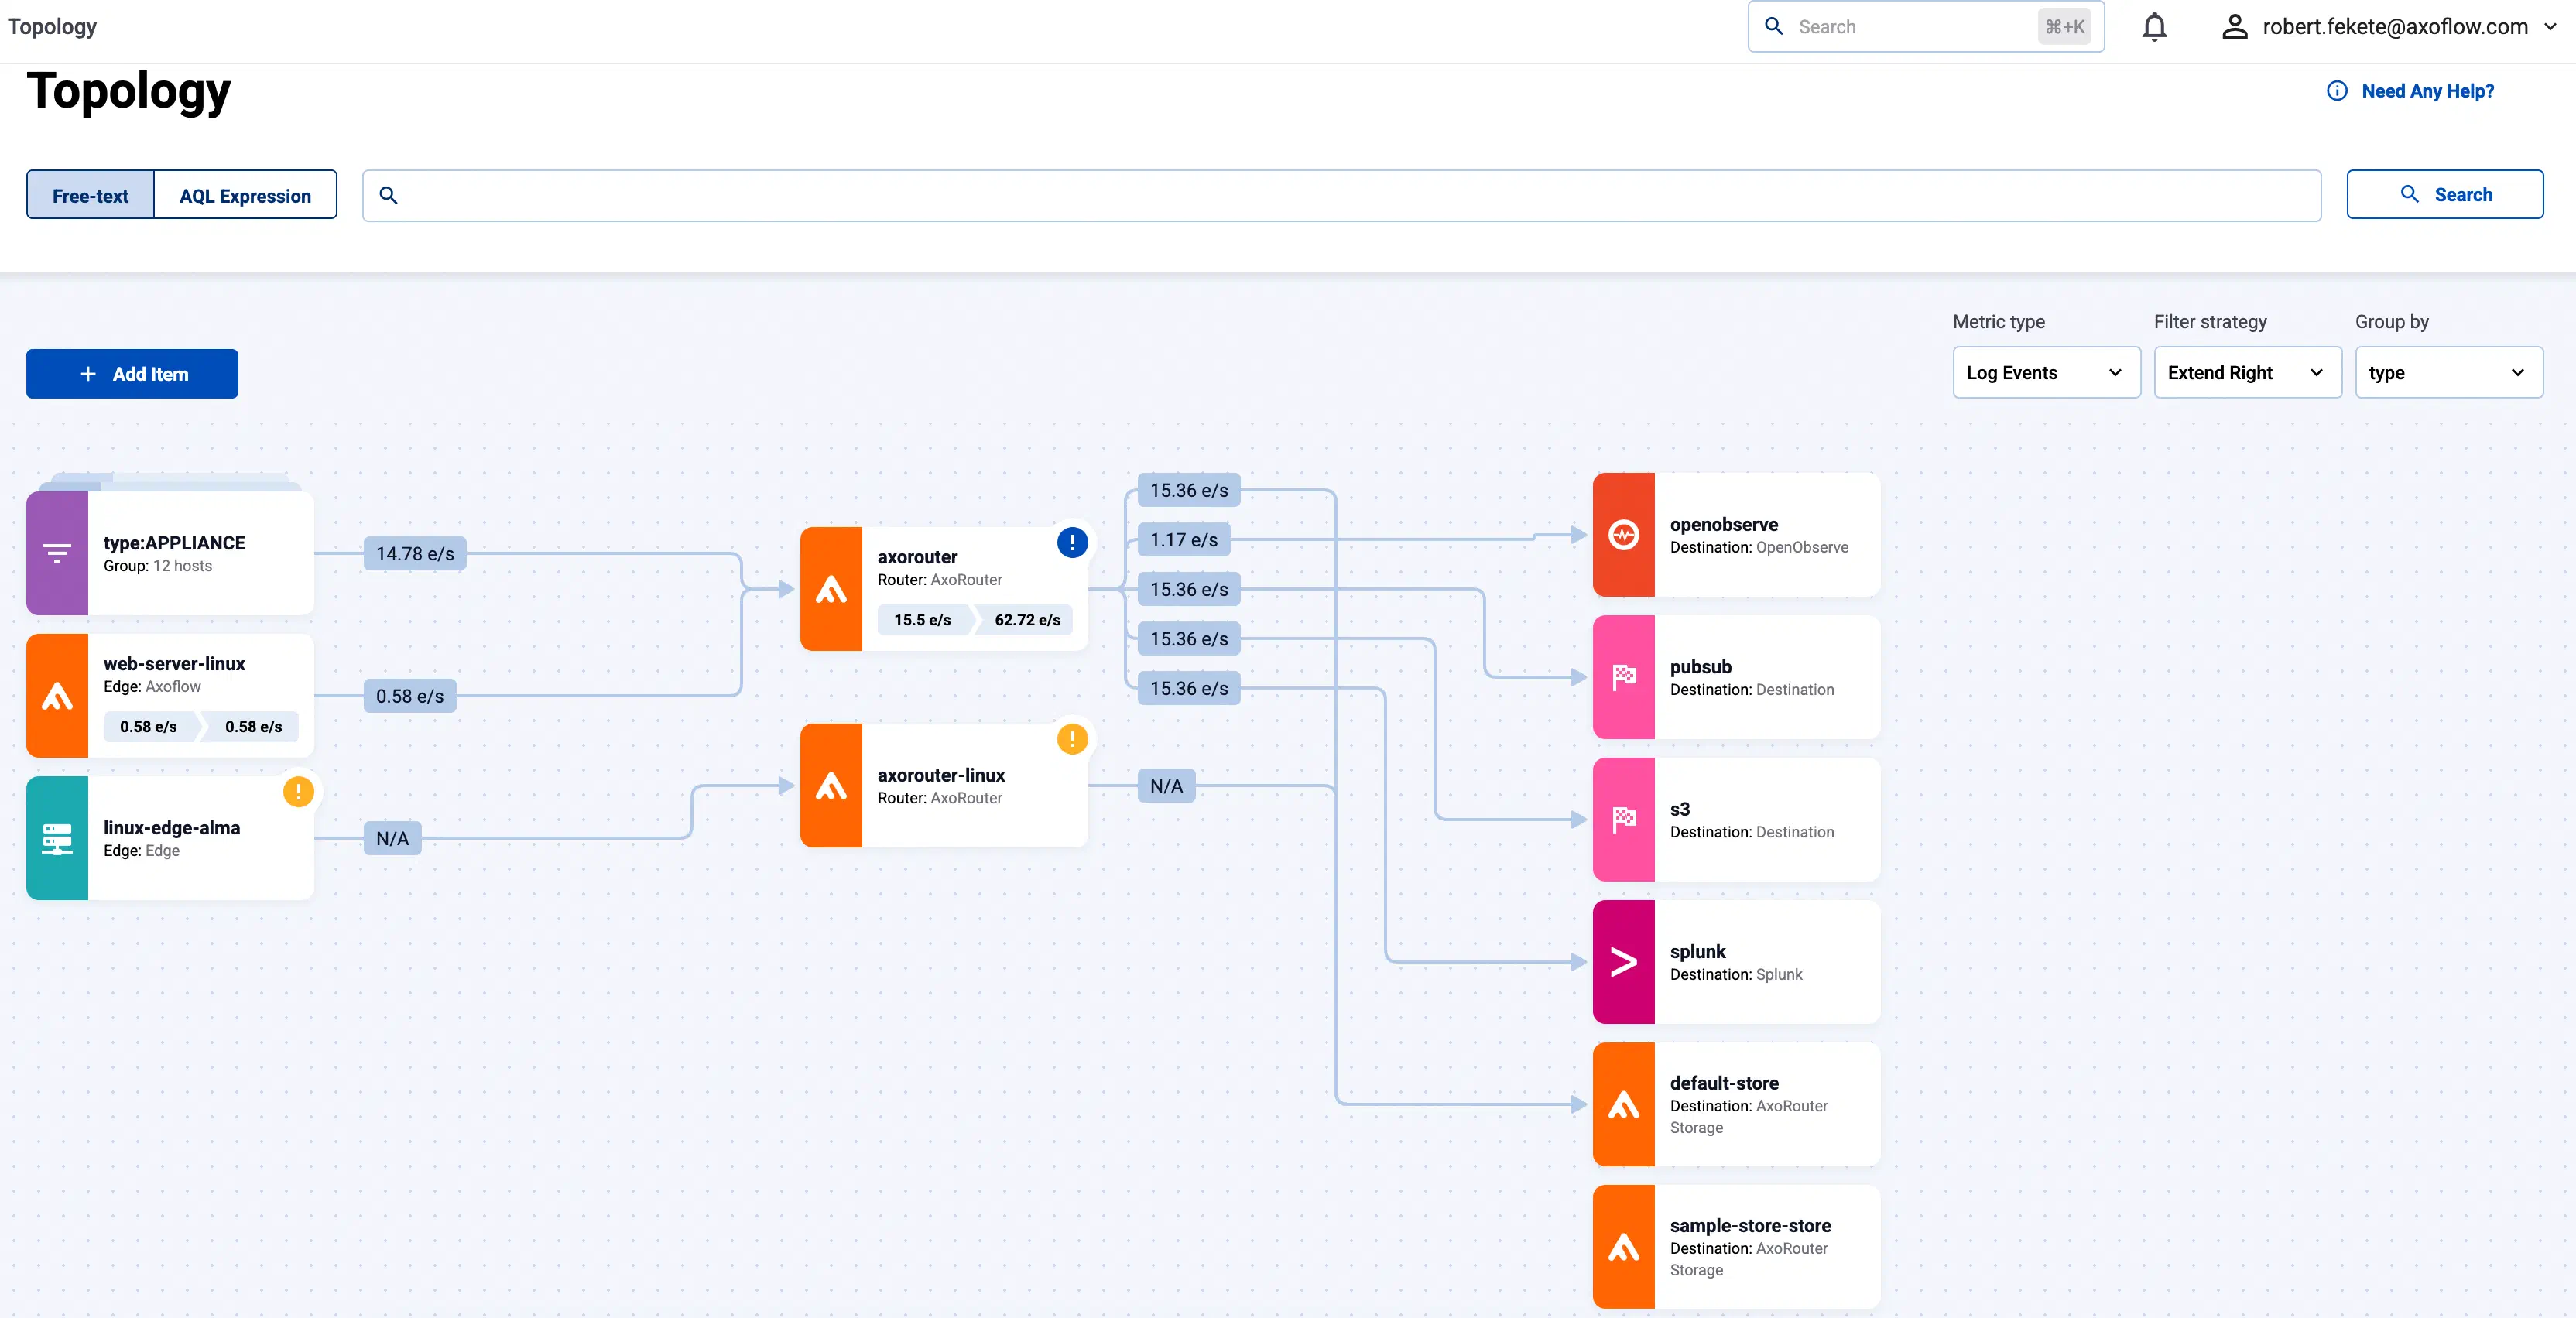
AxoConsole
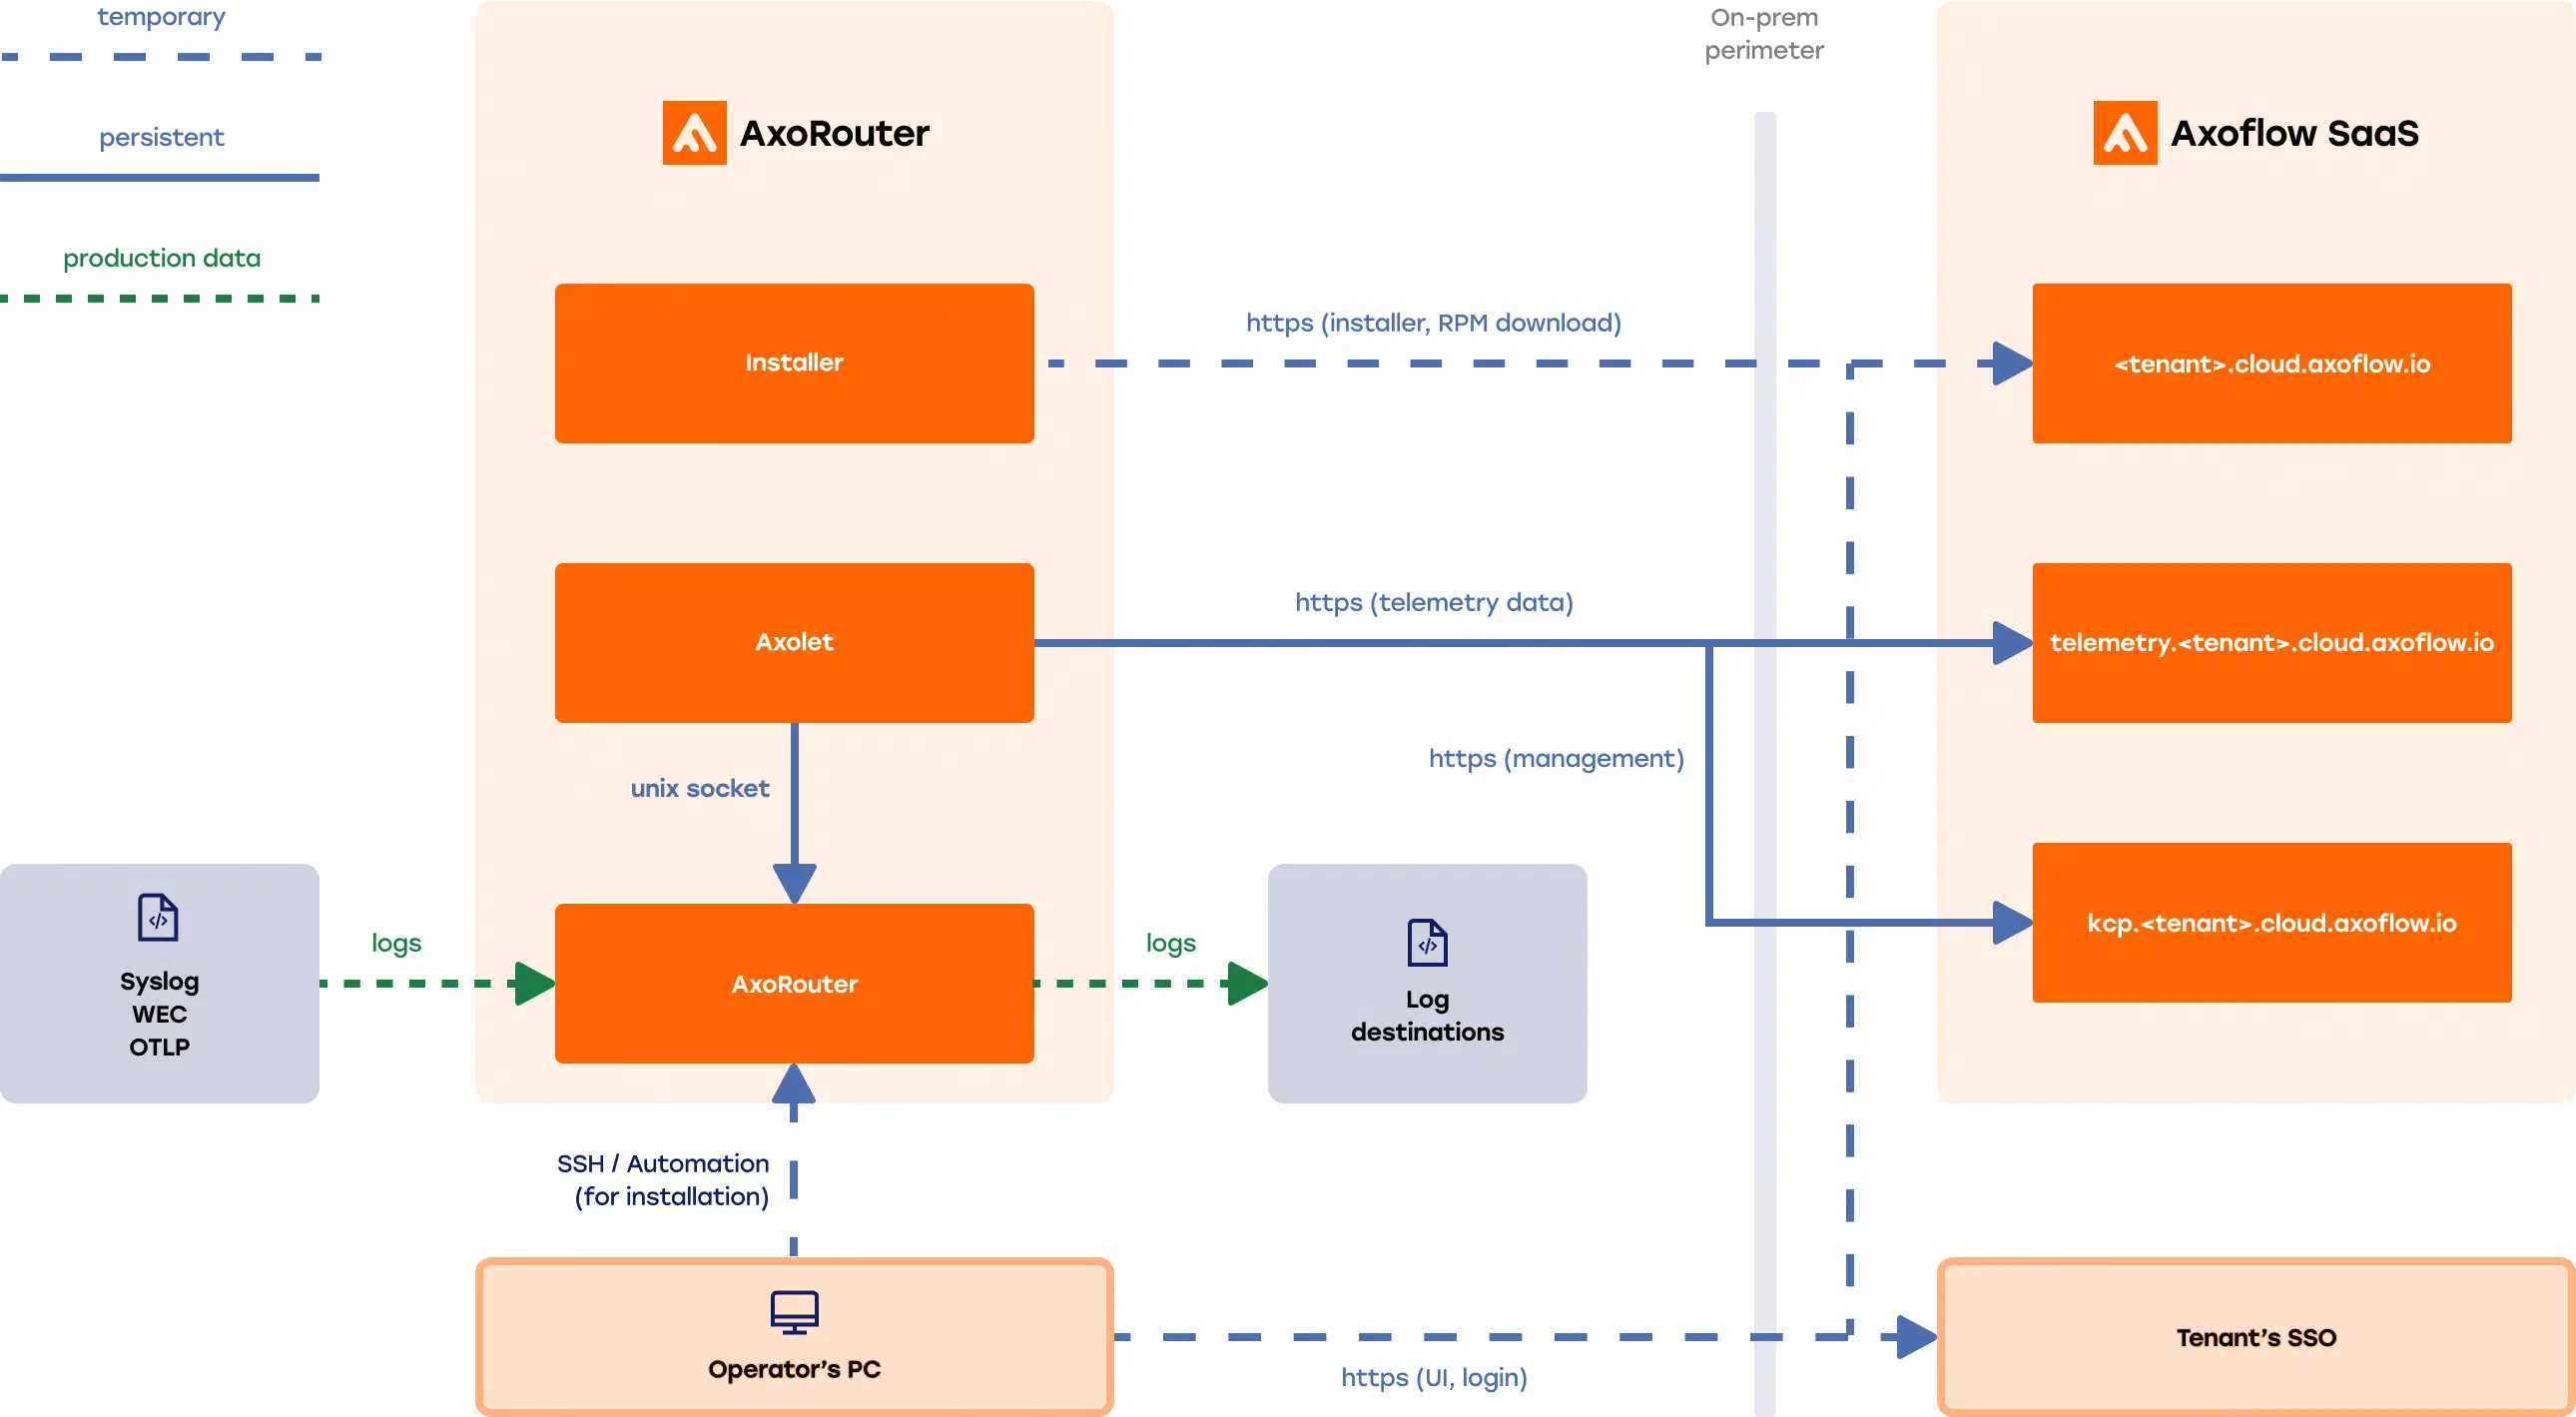
AxoConsole (formerly Axoflow Console) is the data visualization and management UI of Axoflow. Available both as a SaaS and an on-premises solution, including air-gapped and hybrid environments. AxoConsole collects and visualizes the metrics received from the pipeline components to provide insight into the details of your telemetry pipeline and the data it processes. It also allows you to:
- deploy managed components (like Axoflow agent and AxoRouter),
- configure data routing and processing flows that the AxoConsole automatically translates into specific configuration and deploys to the managed pipeline components, and
- troubleshoot your pipeline by tapping real-time into the various data flows and agent logs.
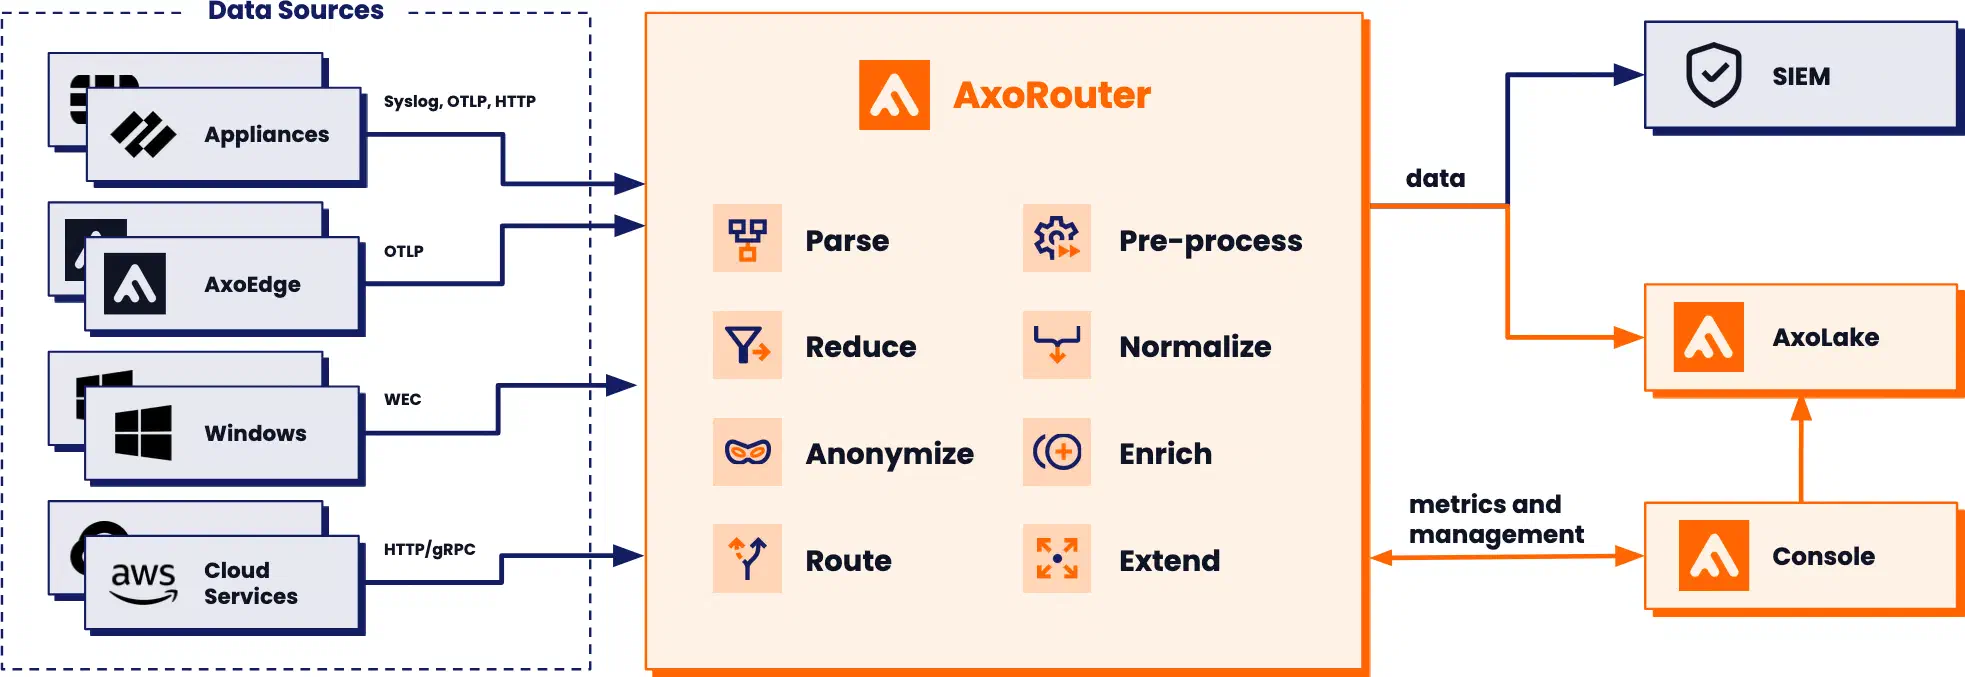
AxoRouter
AxoRouter is a router (aggregator) and data curation engine: it collects all kinds of telemetry and security data and has all the low-level functions you would expect of log-forwarding agents and routers. AxoRouter can also curate and enrich the collected data, it:
- automatically identifies your log sources, recognizing the product that’s sending it, for example, switches, firewalls, and web gateways
- fixes common errors in the incoming data: for example, it corrects missing hostnames, invalid timestamps, formatting errors, and so on
- automatically parses the logs of hundreds of COTS devices
- performs data reduction and normalization to reduce noise and improve data quality.
Before sending your data to its destination, AxoRouter automatically converts the data into a format that best suits the destination to optimize ingestion speed and data quality. For example, when sending data to Splunk, setting the proper sourcetype and index is essential.
Axolet
Axolet is a monitoring and management agent that integrates with the local log collector (like AxoSyslog, Splunk Connect for Syslog, or syslog-ng) that runs on the data source and provides detailed metrics about the host and its data traffic to the AxoConsole. AxoRouter deployments automatically include Axolet.
Storage solutions
In addition to being able to route your data to various storage and SIEM solutions, Axoflow provides a range of storage solutions for your use cases, from small, temporal storage to petabyte-scale long-term data retention.
AxoStore
AxoStore is a lightweight, queryable, temporary storage option that stores data locally on the AxoRouter host. AxoConsole provides federated search for every AxoRouter that has AxoStore deployed, so you can simultaneously run queries on every AxoStore.
AxoStore is automatically available for all Axoflow customers, for each AxoRouter node, with 7 days retention, and up to 1TB of storage. For longer retention time or bigger storage, you need an extended AxoStore subscription. Contact us for the details.
You can retrieve selected data from AxoStore and (rehydrate) it to other destinations for further analysis as needed.
For example, AxoStore allows you to:
- Store debug-level logs for a short time (for example, 24h) to support “what if something happens” scenarios.
- Collect and search data ad-hoc for maintenance or debugging tasks.
- Keep a lightweight local backup of your security data.
- Retrieve selected data from AxoStore and (rehydrate) it to other destinations for further analysis as needed.
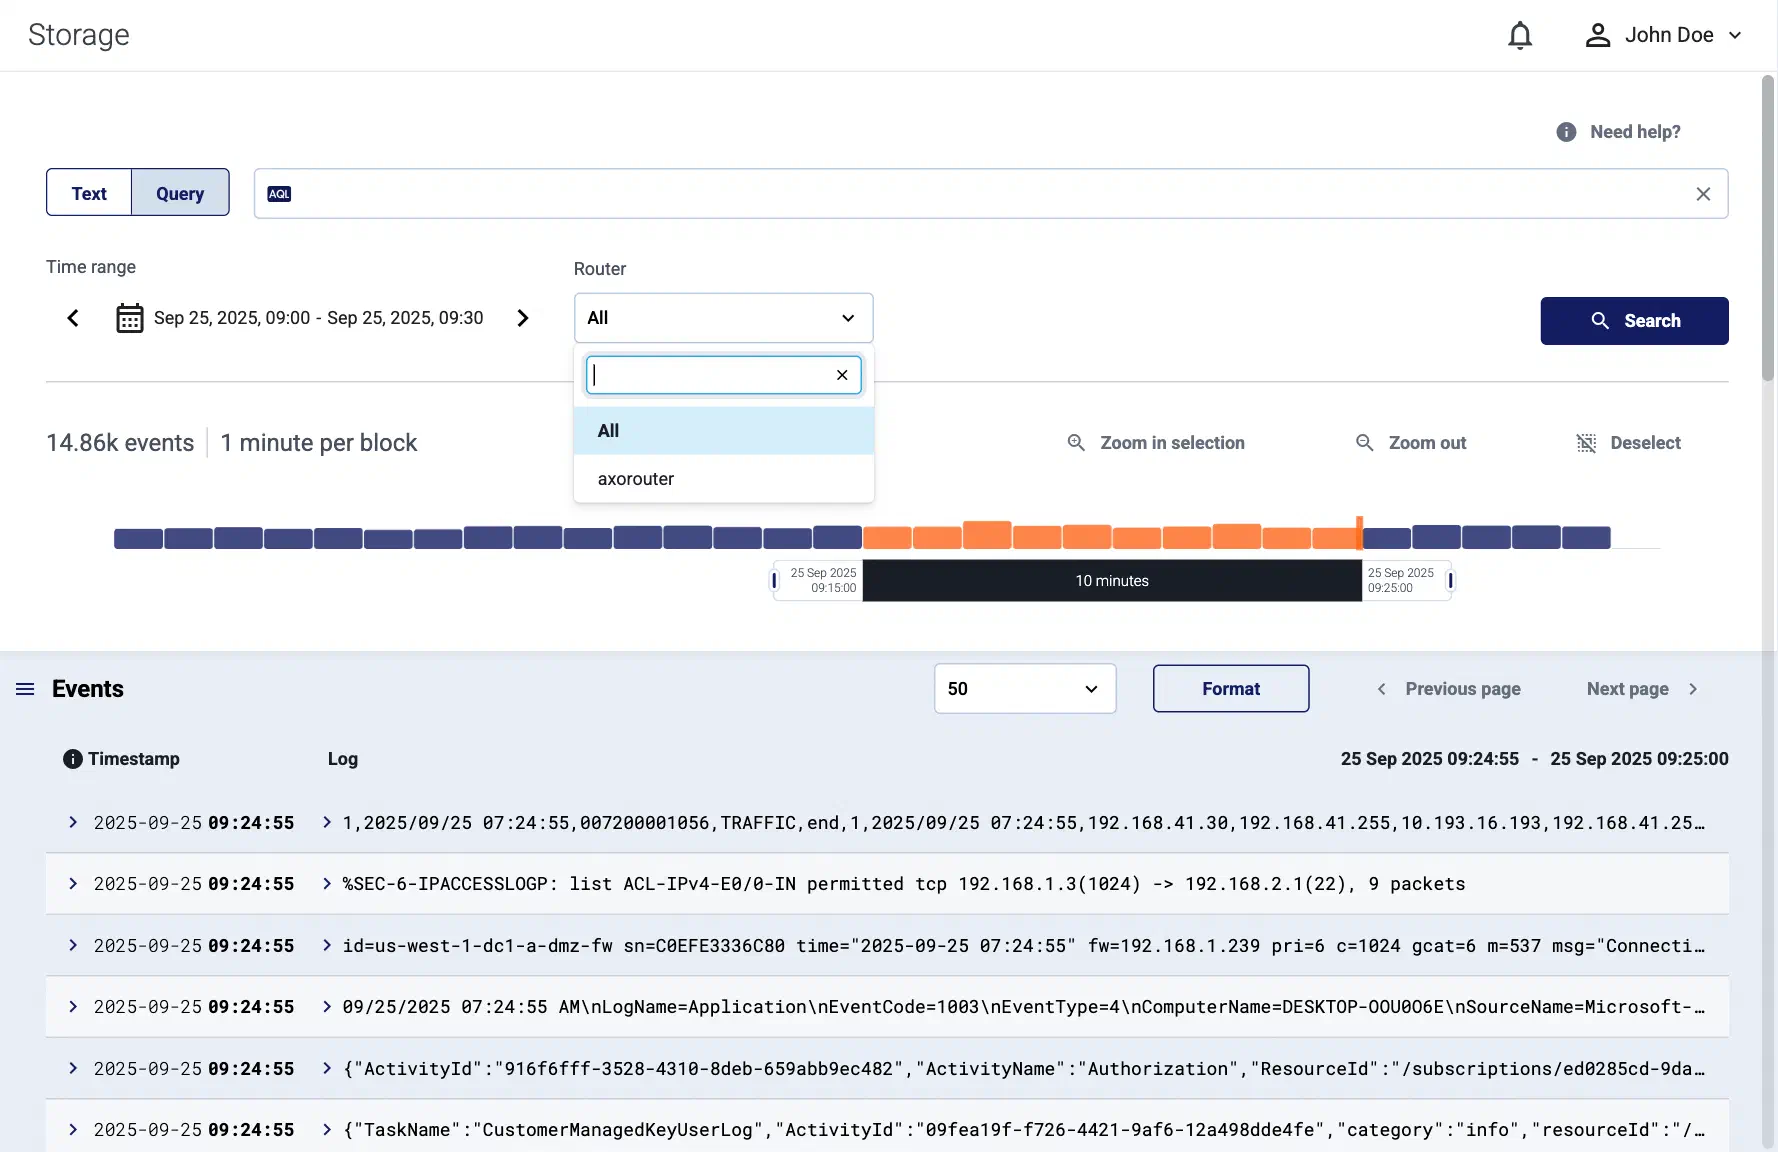
For details, see Storage.
AxoLake
AxoLake is a tiered SaaS security lake with a scalable hot tier for fast queries, and cost-efficient, S3-compatible cloud-based cold tier. You can use high-level, policy-based routing to decide which data goes to cold storage, hot storage, or your SIEM. If you need to work with data from cold storage, you can rehydrate it into hot storage, or even replay it to send it into your SIEM. Designed for long-term retention, open access, and integration with SIEMs and security analytics.
AxoLake provides cheap, long-term archive storage, while making hot data available for detection and analytics.
For details and pricing, see the AxoLake product page, or contact us.

Axoflow agents and collectors
Axoflow provides the following agents and collectors:
- AxoRouter is the main collector and data processing engine for push-based protocols, such as Syslog, OTLP, HTTP, and WEC.
- Axoflow agent (AxoEdge) is a collection of managed agents for Linux, Kubernetes, and Microsoft Windows. They collect local data from the host they’re deployed on, send it to an AxoRouter instance, and provide metadata for AxoConsole. Axoflow agent provides file and journald collectors on Linux and Event log and Event trace collectors on Windows.
- Axoflow Cloud Connectors are pull-based collectors built on top of OpenTelemetry that integrate with all modern Cloud Services (for example, AWS CloudWatch, Amazon S3, GCP Pub/Sub, Azure Event Hub), API and streaming sources (CrowdStrike, Kafka) and legacy methods (SQL) for enterprise log collection use cases. In addition to the existing sources, Axoflow Cloud Connectors can consume events from a vast amount of HTTP or streaming APIs and can be extended by the Axoflow team to support any custom pull based HTTP or streaming API source. A few specific examples:
Receiver Cloud source awscloudwatchreceiverAWS CloudWatch Logs awsfirehosereceiverKinesis Firehose awss3receiverS3 log storage awslambdareceiverLambda telemetry azureblobreceiverAzure Blob Storage azureeventhubreceiverAzure Event Hub cloudflarereceiverCloudflare Logpush cloudfoundryreceiverCloud Foundry logs googlecloudpubsubreceiverGCP Pub/Sub kafkareceiverKafka log streams lokireceiverLoki / Promtail fluentforwardreceiverFluentd / Fluent Bit syslogreceiverSyslog (cloud services)