Windows Event Log
Collect logs from the Event Log of the host.
Prerequisites
This collector can be deployed to edge hosts running Axoflow agent for Windows.
Add new Event Log Collector
To create a new Collection Rule that collects data from files on edge hosts, complete the following steps:
-
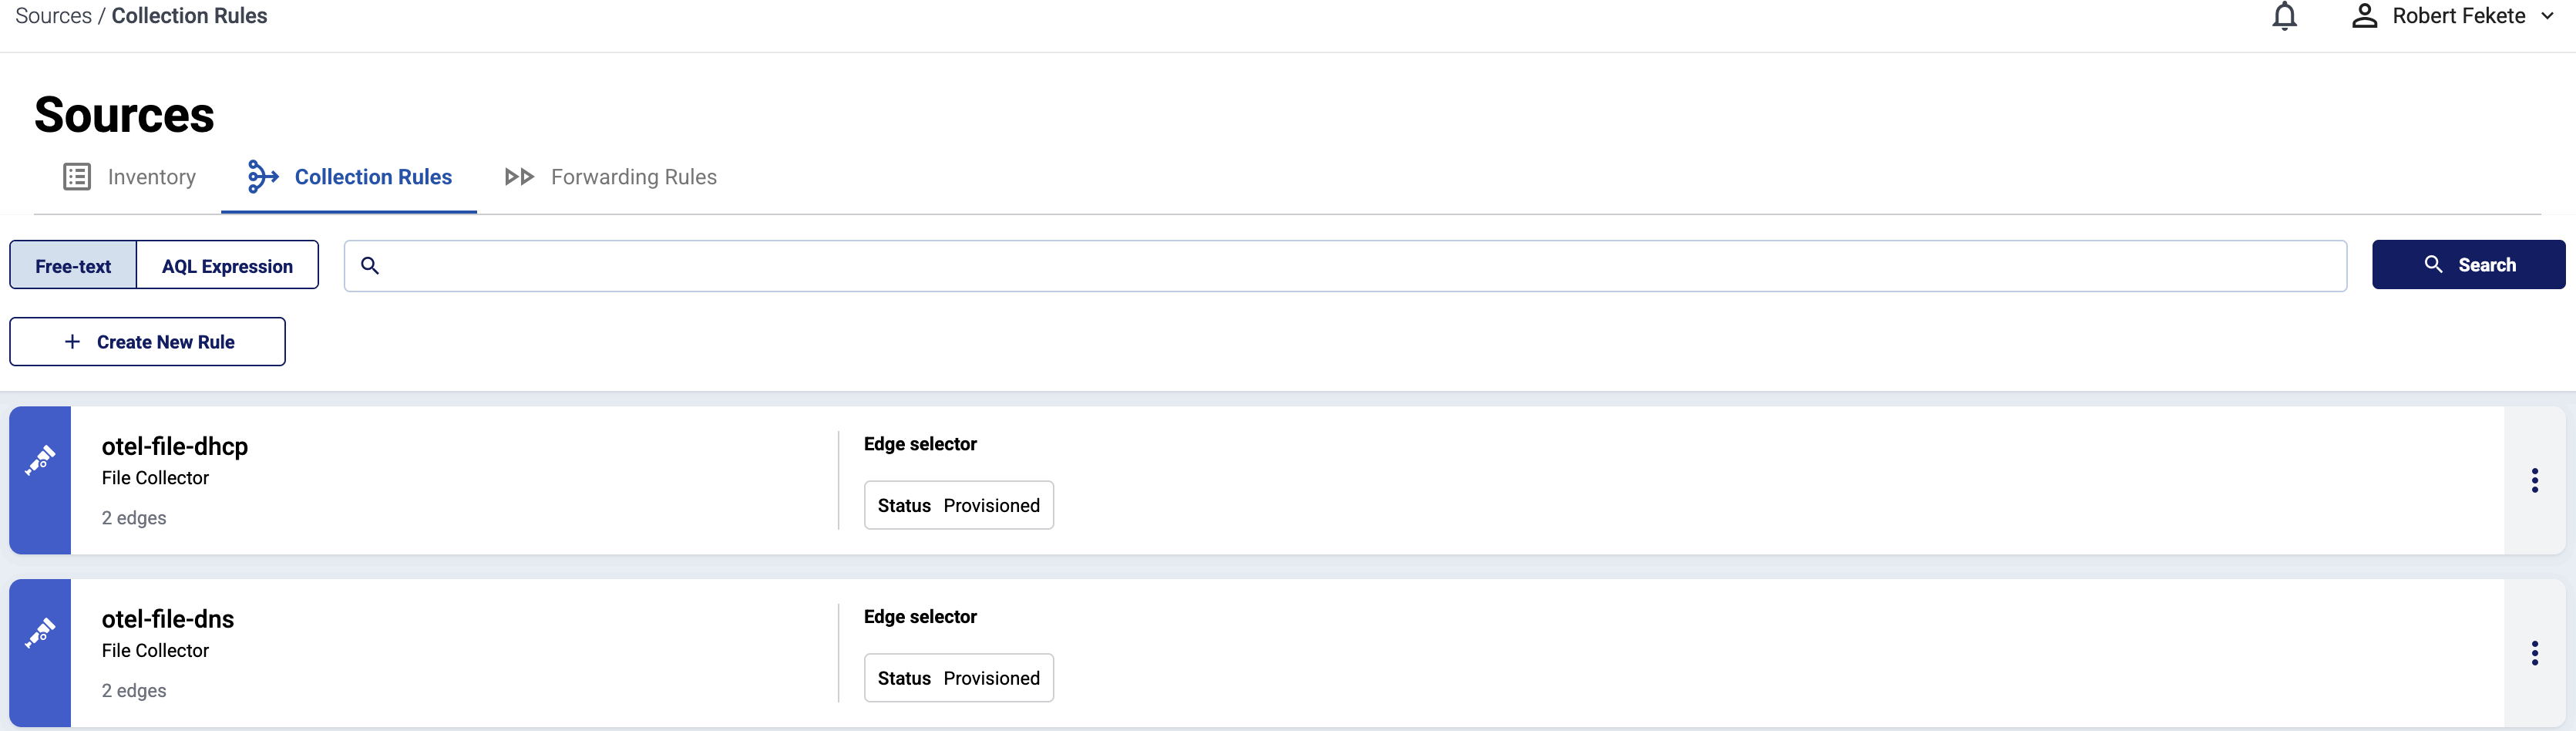
Select Sources > Collection Rules > Add Rule. (Alternatively, you can select Add Collector > Create a collection rule on the Collectors page of an edge host.)
-
Select Windows Event Log.
-
Configure the connector rule.
-
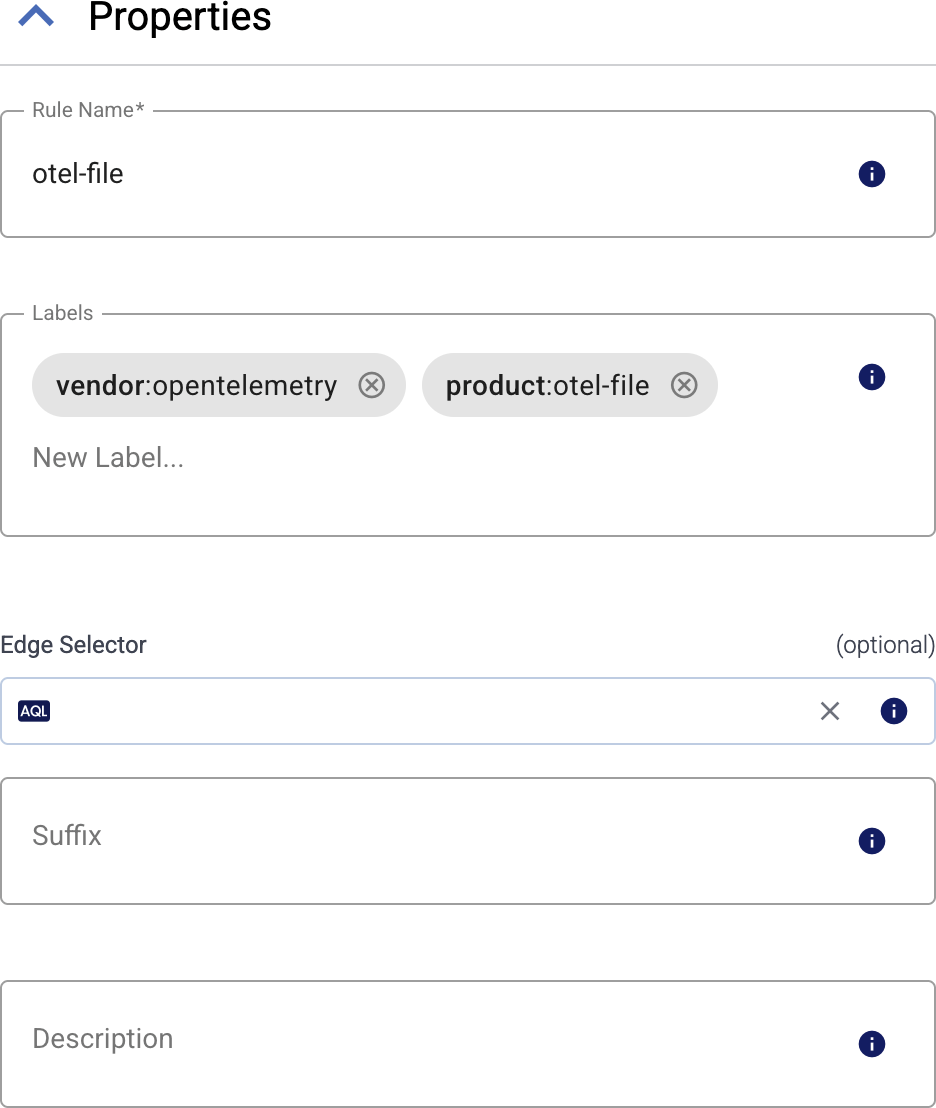
Enter a name for the collection rule into the Rule Name field.
-
(Optional) Add labels to the collection rule.
You can use these metrics labels as:
- Filter labels on the Analytics page
- in the Filter By Label field during log tapping
- in Flow Processing steps, for example, in the Query field of Select Messages steps.
-
Set the Edge Selector for the collection rule. The selector determines which edge hosts will have a collector based on this collection rule.
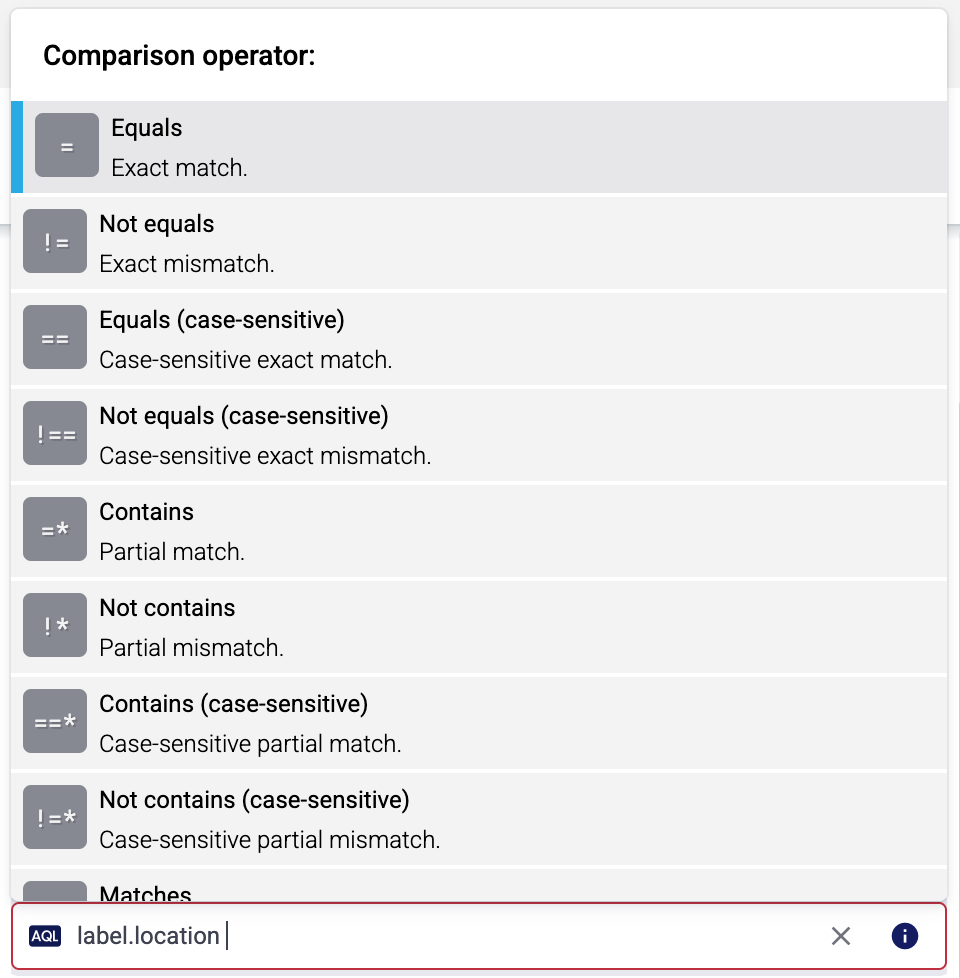
- Only edge hosts will match the rule.
- If you leave the Edge Selector field empty, the rule will match every edge host.
- To select only a specific host, set the
namefield to the name of the host as selector. - If you set multiple fields in the selector, the collection rule will apply only to edge hosts that match all elements of the selector. (There in an AND relationship between the fields.) For example,
label.location = us-east-1 AND label.product = windows
-
(Optional) Enter a Suffix for the collection rule. This suffix will be used in the name of the collector instances created on the edge hosts. For example, if the name of a matching edge host is “my-edge”, and the suffix of the rule is “otel-file-collector”, the collector created for the edge will be named “my-edge-otel-file-collector”.
If the Suffix field is empty, the name of the collection rule is used instead.
-
(Optional) Enter a description for the rule.
-
-
Set how to collect the event logs:
-
To collect data from the following channels, select Channels, then the channels you want to collect data from: Application, System, Security, Setup, ForwardedEvents.
-
Alternatively, select Query and set a custom XML query to collect the data, for example:
<QueryList>
    <Query Id="0">
        <Select Path="Application">
            *[System[(Level <= 3) and
            TimeCreated[timediff(@SystemTime) <= 86400000]]]
        </Select>
        <Suppress Path="Application">
            *[System[(Level = 2)]]
        </Suppress>
        <Select Path="System">
            *[System[(Level=1  or Level=2 or Level=3) and
            TimeCreated[timediff(@SystemTime) <= 86400000]]]
        </Select>
    </Query>
</QueryList>
-
-
(Optional) If needed, set advanced options under More options.
-
Select Add. Based on the collection rule, Axoflow automatically creates collectors on the edge hosts that match the Edge Selector.
CAUTION:
Make sure to configure Data Forwarding Rules for your edge hosts to transfer the collected data to the OpenTelemetry connector of an AxoRouter.
Related metrics
You can use these metrics labels as:
- Filter labels on the Analytics page
- in the Filter By Label field during log tapping
- in Flow Processing steps, for example, in the Query field of Select Messages steps.
| label | value |
|---|---|
| edge_connector_name | The name of the collector that collected the message. |
| edge_connector_type | windowsEventLog |
| edge_connector_label_ | Labels set by the collector. By default: vendor:microsoft, product:windows-event-log |
| edge_connector_rule_id | The ID of the Collector Rule resource in Axoflow that created the collector. |
| edge_flow_name | The name of the data forwarding rule that sent the message. |
Advanced options
- Max reads: The maximum number of records to read, before beginning a new batch.
- Poll interval: The duration between filesystem polls, for example:
1s,5m,1h. Default value:200ms - Retry on failure max elapsed time: Maximum time (including retries) to send a log batch to a downstream consumer before discarding it, for example:
1s,5m,1h. Retrying never stops if set to0. Default value0 - Start at: Specifies where to start reading logs on startup:
beginningorendof the file. Default value:beginning - Ignore channel errors: If enabled, the connector keeps working if it cannot open an event log channel.
- Raw: If disabled, the body of the emitted log records will contain a structured representation of the event. If enabled, the body will be the original XML string.
- Include log.record.original: If enabled,
log.record.originalis added to the attributes of the event. This stores the original XML string as configured in Suppress rendering info. - Suppress rendering info: If disabled, additional syscalls may be made to retrieve detailed information about the event. If enabled, some unresolved values may be present in the event.