syslog-ng
Onboarding allows you to collect metrics about the host, display the host on the Topology page, and to tap into the log flow.
Onboarding requires you to modify the host and the configuration of the logging agent running on the host.
- Level 1: Install Axolet on the host. Axolet collects metrics from the host and sends them to the Axoflow Console, so you can check host-level metrics on the Metrics & Health page of the host, and displays the host on the Topology page.
- Level 2: Instrument the configuration of the logging agent to provide detailed metrics about the traffic flow. This allows you to display data about the host on the Analytics page.
- Level 3: Instrument the configuration of the logging agent to allow you to access the logs of the logging agent and to tap into the log flow from the Axoflow Console. The exact steps for this integration step depend on the configuration of your logging agent. Contact us so our professional services can help you with the integration.
To onboard an existing syslog-ng instance into Axoflow, complete the following steps.
-
Install Axolet on the host, then approve its registration on the Provisioning page of the Axoflow Console.
-
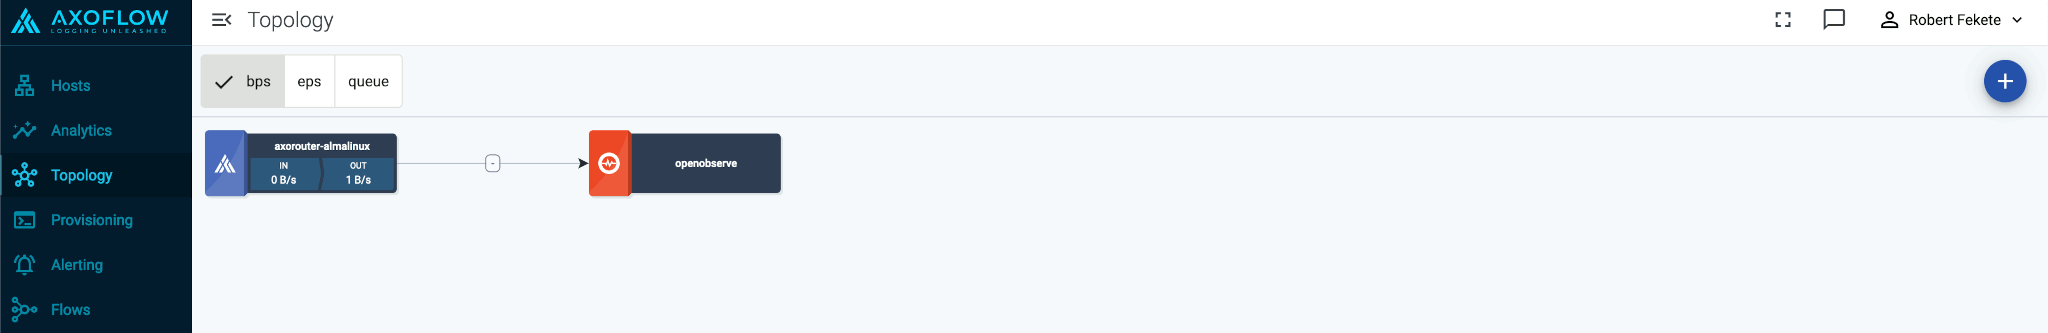
The syslog-ng host is now visible on the Topology page of the Axoflow Console as a source.
-
If you've already added the AxoRouter instance or the destination where this host is sending data to the Axoflow Console, add a path to connect the host to the AxoRouter or the destination.
-
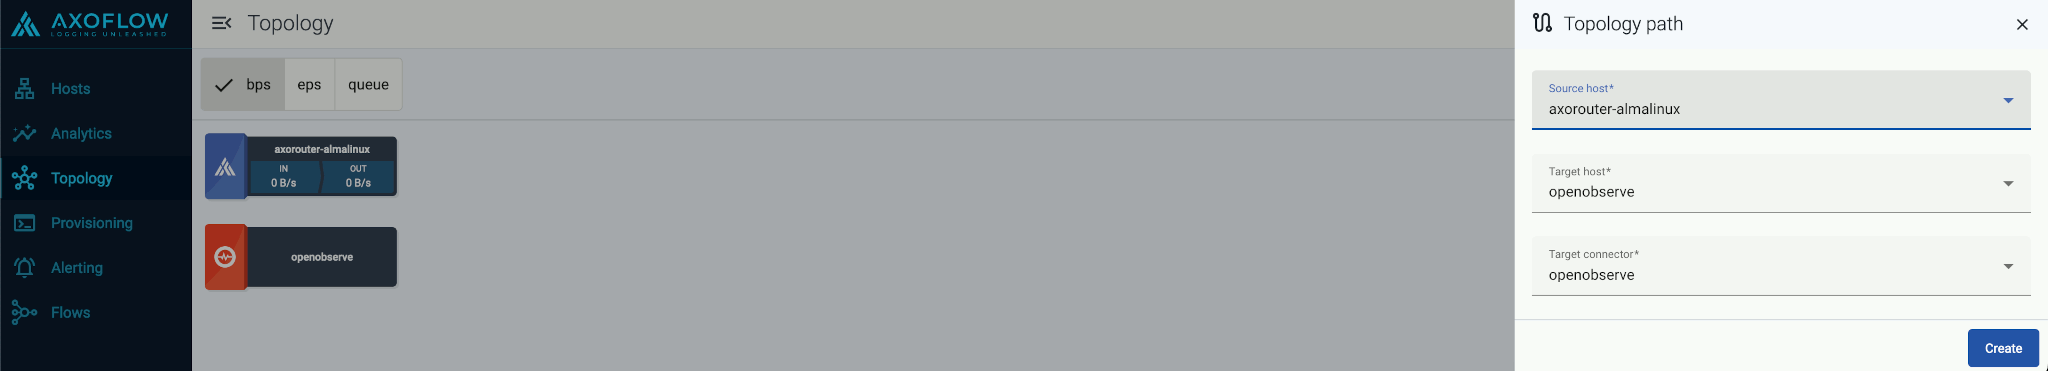
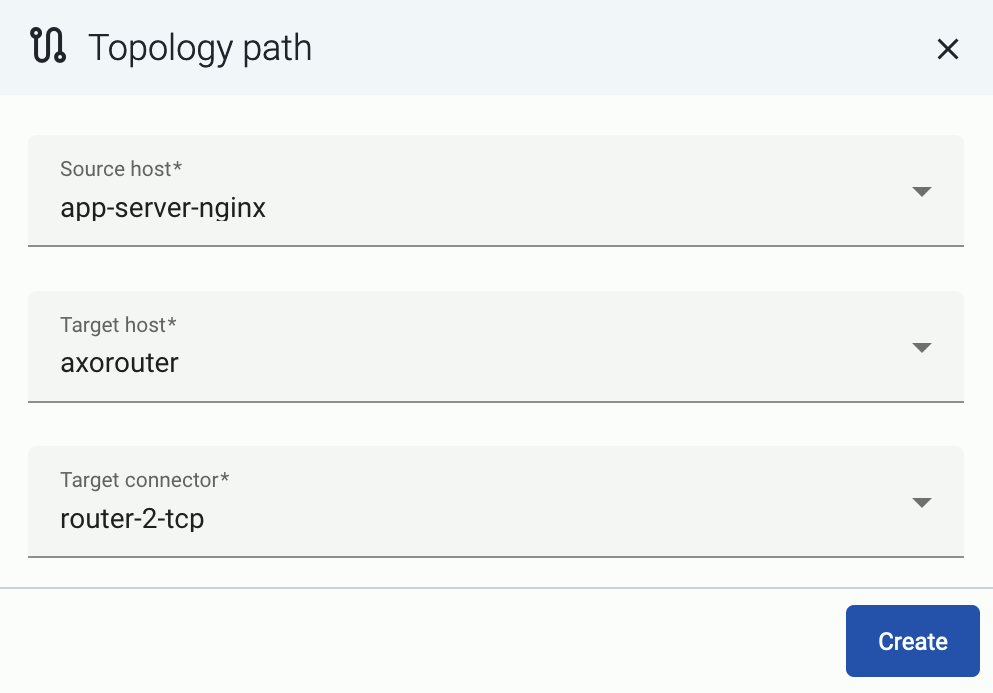
Select Topology > + > Path.
-
Select your data source in the Source host field.
-
Select the target router or aggregator this source is sending its data to in the Target host field, for example,
axorouter. -
Select the Target connector. The connector determines how the destination receives the data (for example, using which protocol or port).
-
Select Create. The new path appears on the Topology page.
-
-
Access the syslog-ng host and edit the configuration of syslog-ng. Set the statistics-related global options like this (if the
optionsblock already exists, add these lines to the bottom of the block):options { stats-level(2); stats-freq(0); # Inhibit statistics output to stdout }; -
(Optional) To get detailed metrics and analytics about the traffic that flows through the host, instrument your syslog-ng configuration as follows:
Note You can use Axolet with an un-instrumented syslog-ng configuration file, but that limits available metrics to host statistics (for example, disk, memory, queue information). You won’t access data about the actual traffic flowing through the host. To collect traffic-related metrics, instrument configuration withmetrics-probe()stanzas. The example below shows how to instrument the configuration to highlight common macros such as$HOSTand$PROTOCOL. If you want to customize the collected metrics or need help with the instrumentation, contact us.-
Download the following configuration snippet to the syslog-ng host, for example, as
/etc/syslog-ng/conf.d/axoflow-instrumentation.conf. -
Include it in at the top of your configuration file:
@version: current @include "axoflow-instrumentation.conf" -
Edit every destination statement to include a
parser { metrics-output(destination(<custom-ID-for-the-destination>)); };line, for example:destination d_file { channel { parser { metrics-output(destination(my-file-destination)); }; destination { file("/dev/null" persist-name("d_s3")); }; }; };
-
-
Reload the configuration of syslog-ng.
systemctl reload syslog-ng