Axoflow is a security data curation pipeline that helps you get high quality, reduced security data, automatically, without coding. Better quality data allows your organization and SOC team to detect and respond to threats faster, use AI, and reduce compliance breaches and costs.
Collect security data from anywhere
Axoflow allows you to collect data from any source, including:
cloud services
cloud-native sources like OpenTelemetry or Kubernetes
traditional sources like Microsoft Windows endpoints (WEC) and Linux servers (syslog)
networking appliances like firewalls
applications.
Shift left
Axoflow deals with tasks like data classification, parsing, curation, reduction, and routing. Except for routing, these tasks are commonly performed in the SIEM, often manually. Axoflow automates all of these processing steps and shifts them left into the data pipeline, so:
it’s automatically applied to all your security data,
all destinations benefit from it (multi-SIEM and storage+SIEM scenarios),
data format is optimized for the specific destination (for example, Splunk, Azure Sentinel, Google Pub/Sub),
unneeded and redundant data can be dropped before having to pay for it, reducing data volume and storage costs.
Curation
Axoflow can automatically classify, curate, enrich, and optimize data right at the edge – limiting excess network overhead and costs as well as downstream manual data-engineering in the analytics tools. Axoflow has over 100 zero-maintenance connectors that automatically identify and classify the incoming data, and apply automatic, device- and source-specific curation steps.
Policy-based routing
Axoflow can configure your aggregator and edge devices to intelligently route data based on the high-level flows you configure. Flows can use labels and other properties of the transferred data as well as your inventory to automatically map your business and compliance policies into configuration files, without coding.
Management
Axoflow gives you a vendor-agnostic management plane for best-in-class visibility into your data pipeline. You can:
automatically discover and identify existing logging infrastructure,
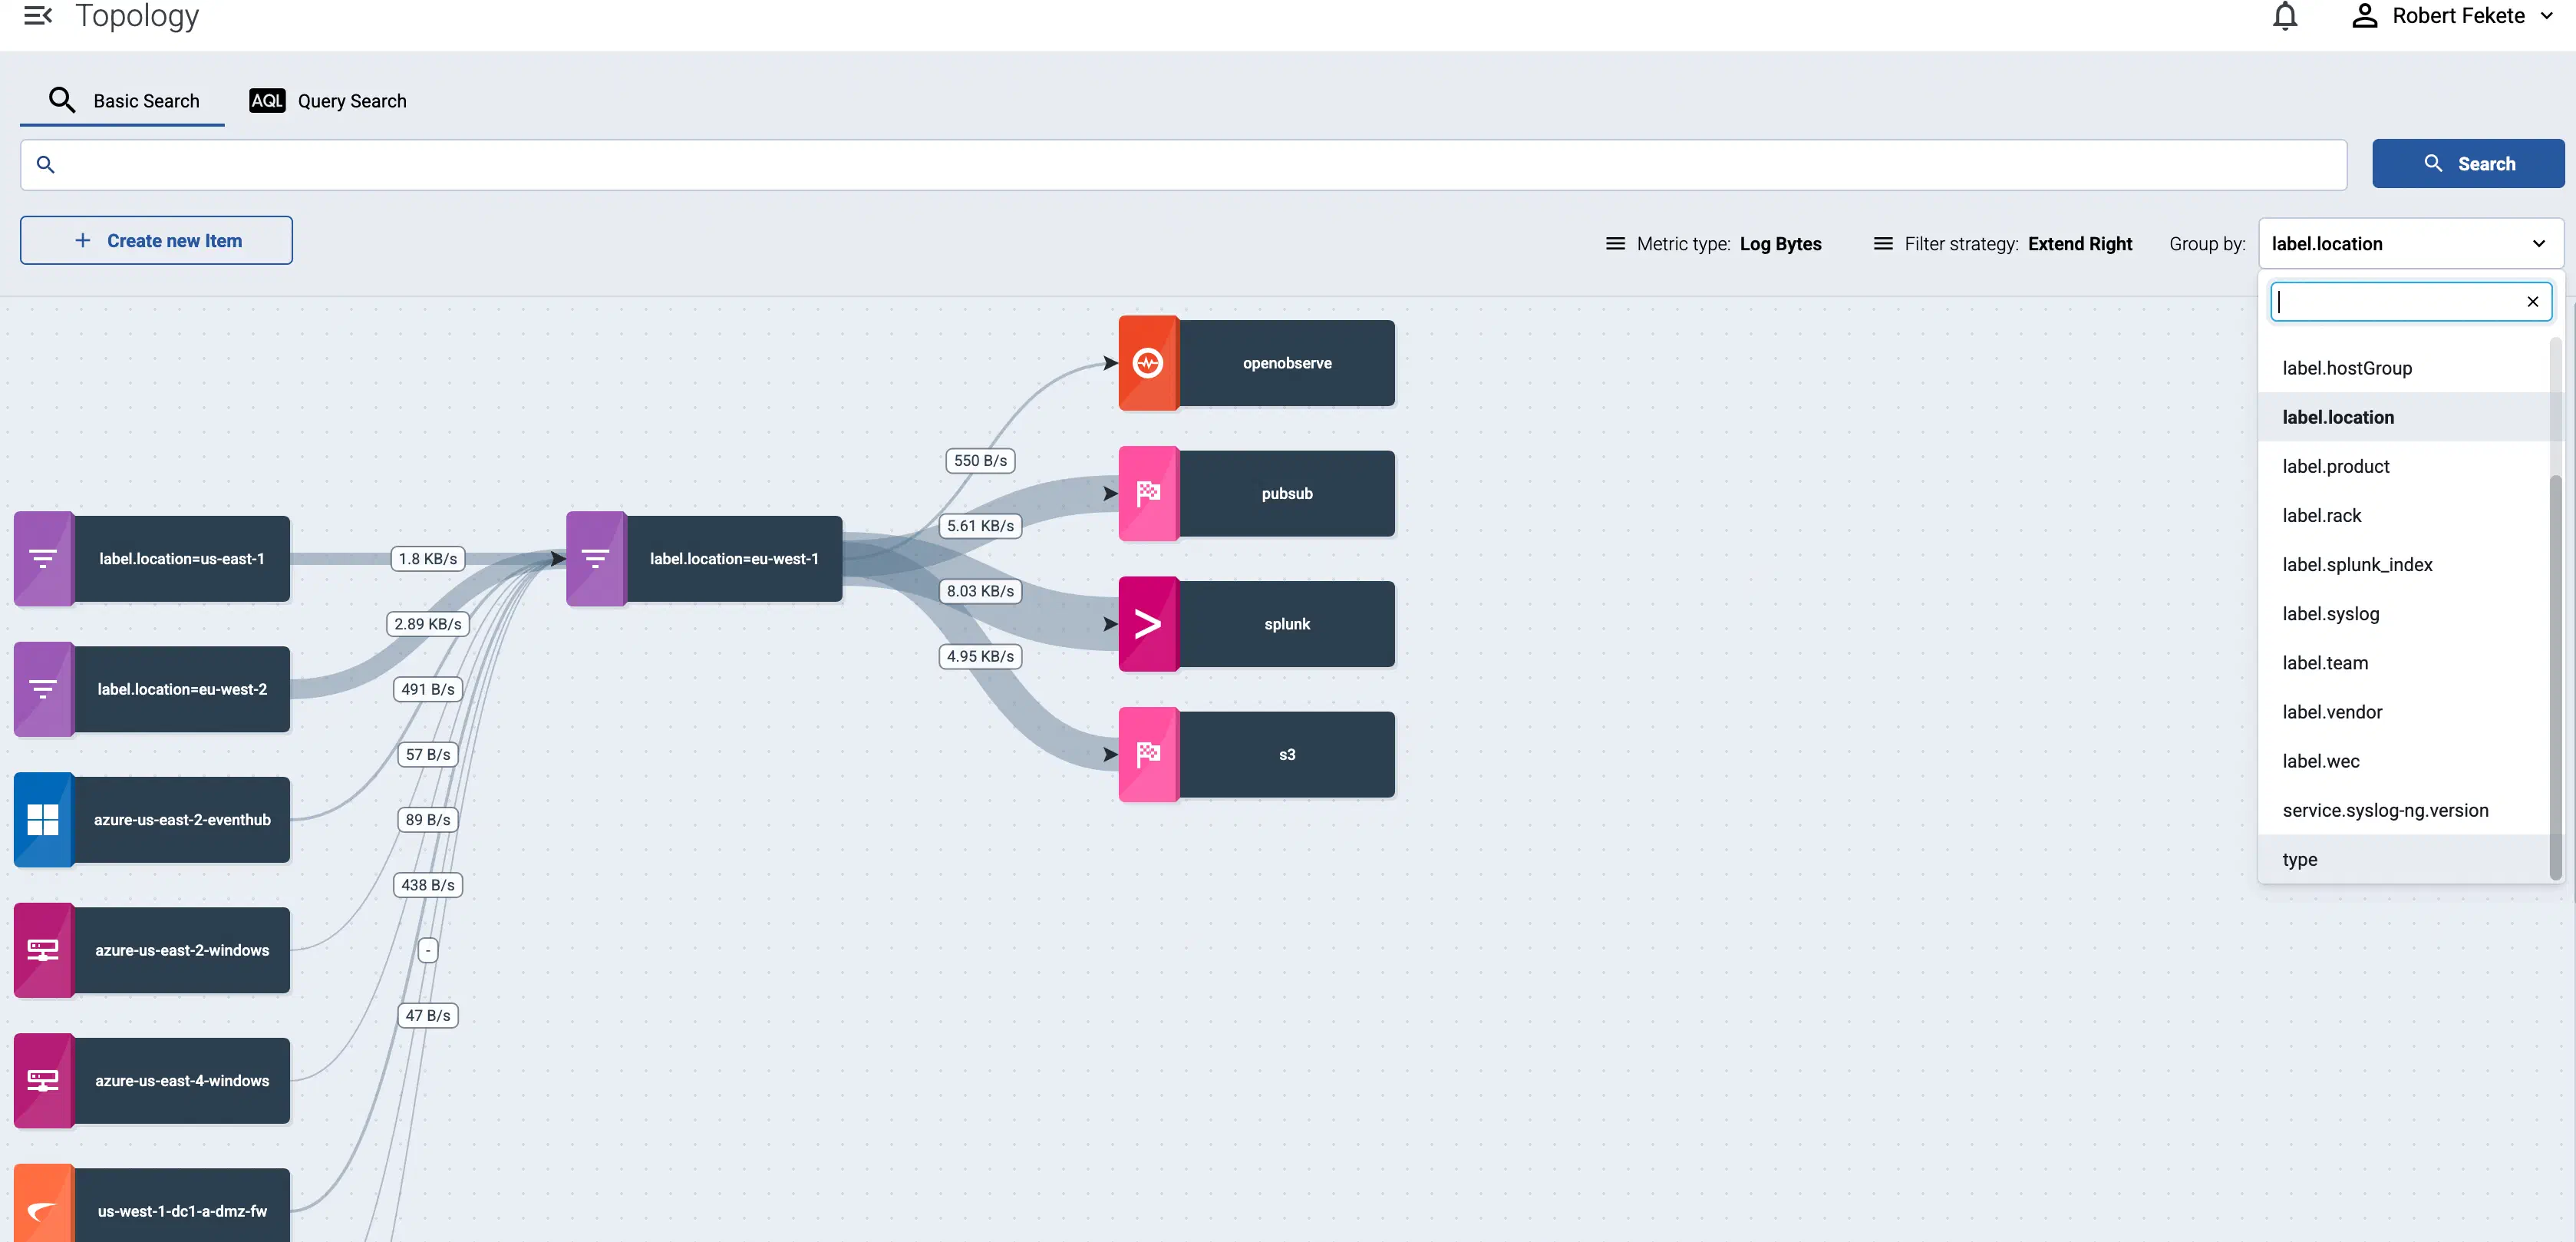
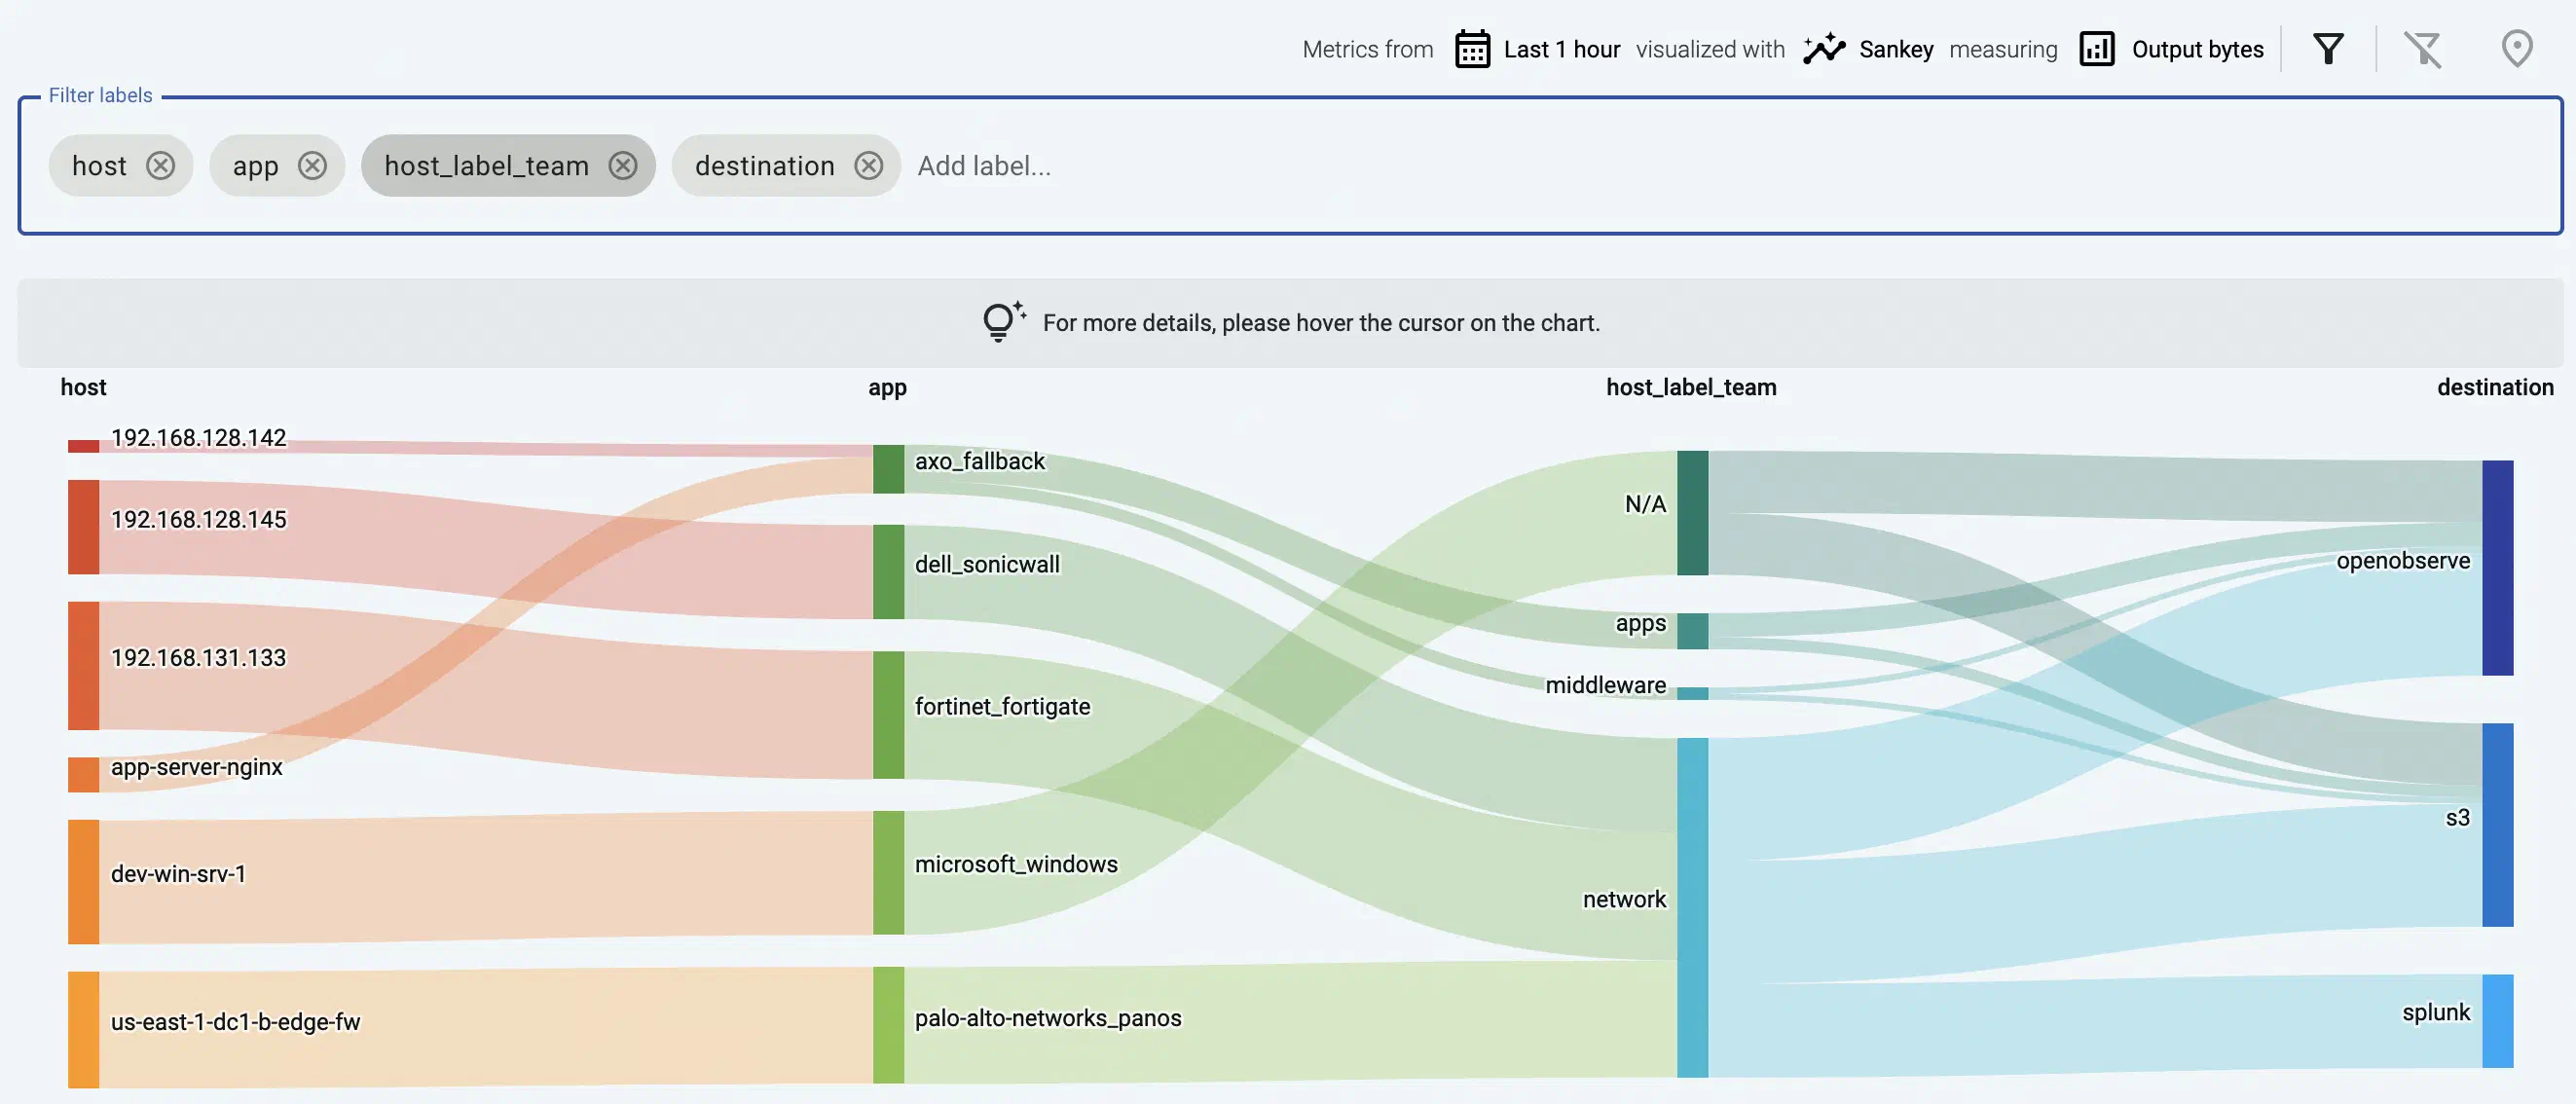
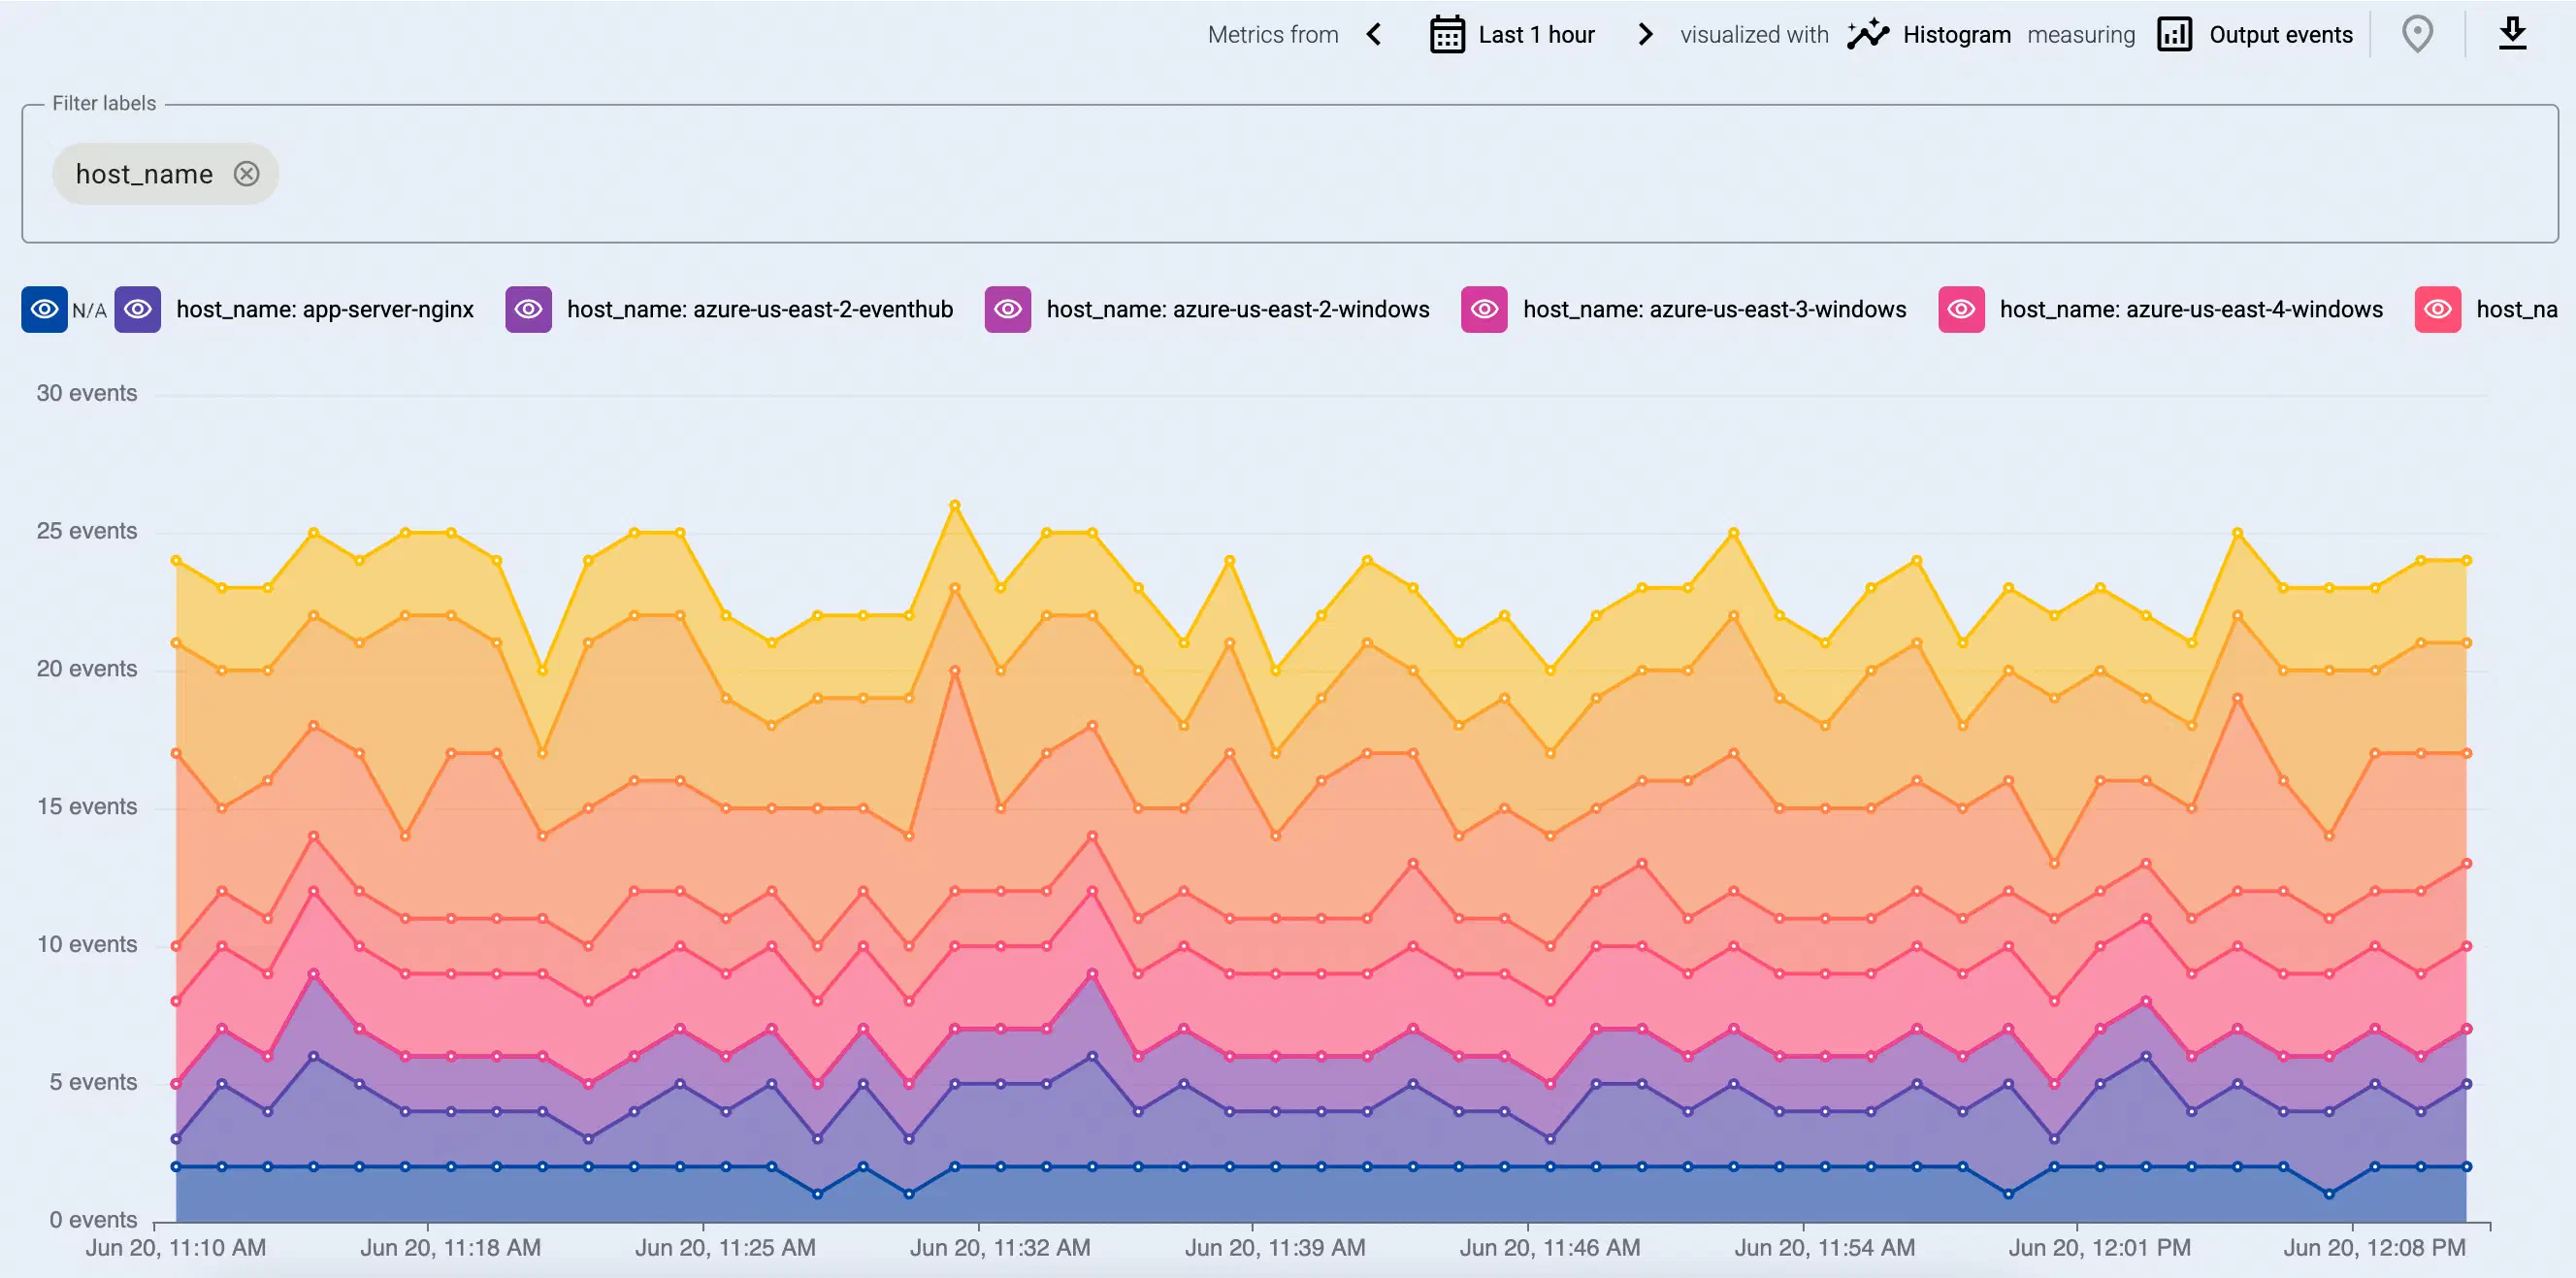
visualize the complete edge-to-edge flow of security data to understand the contribution of sources to the data pipeline, and
monitor the elements of the pipeline and the data flow.
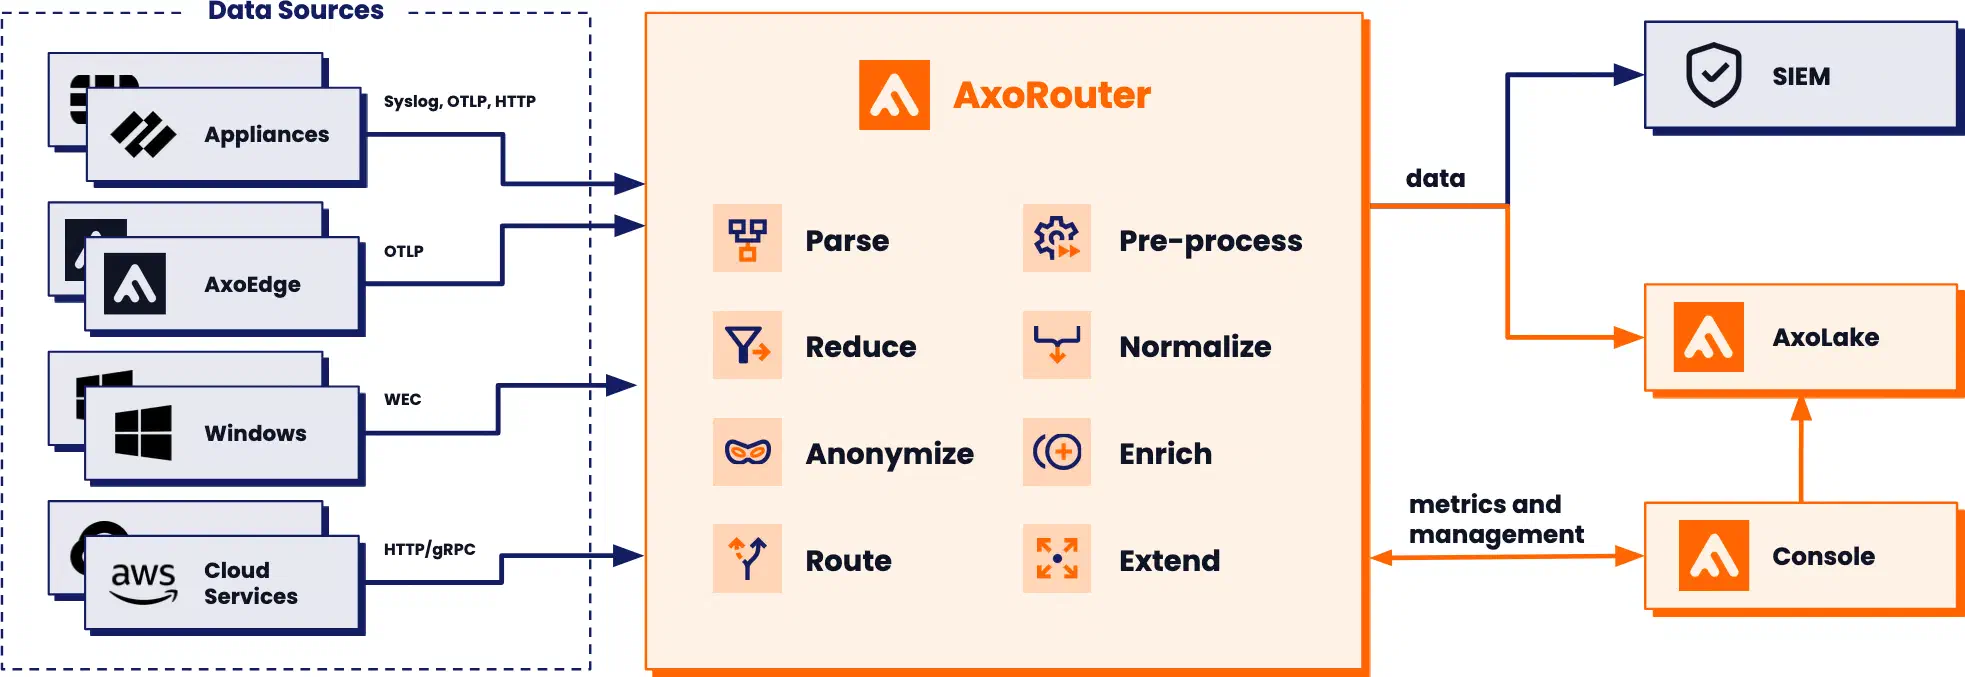
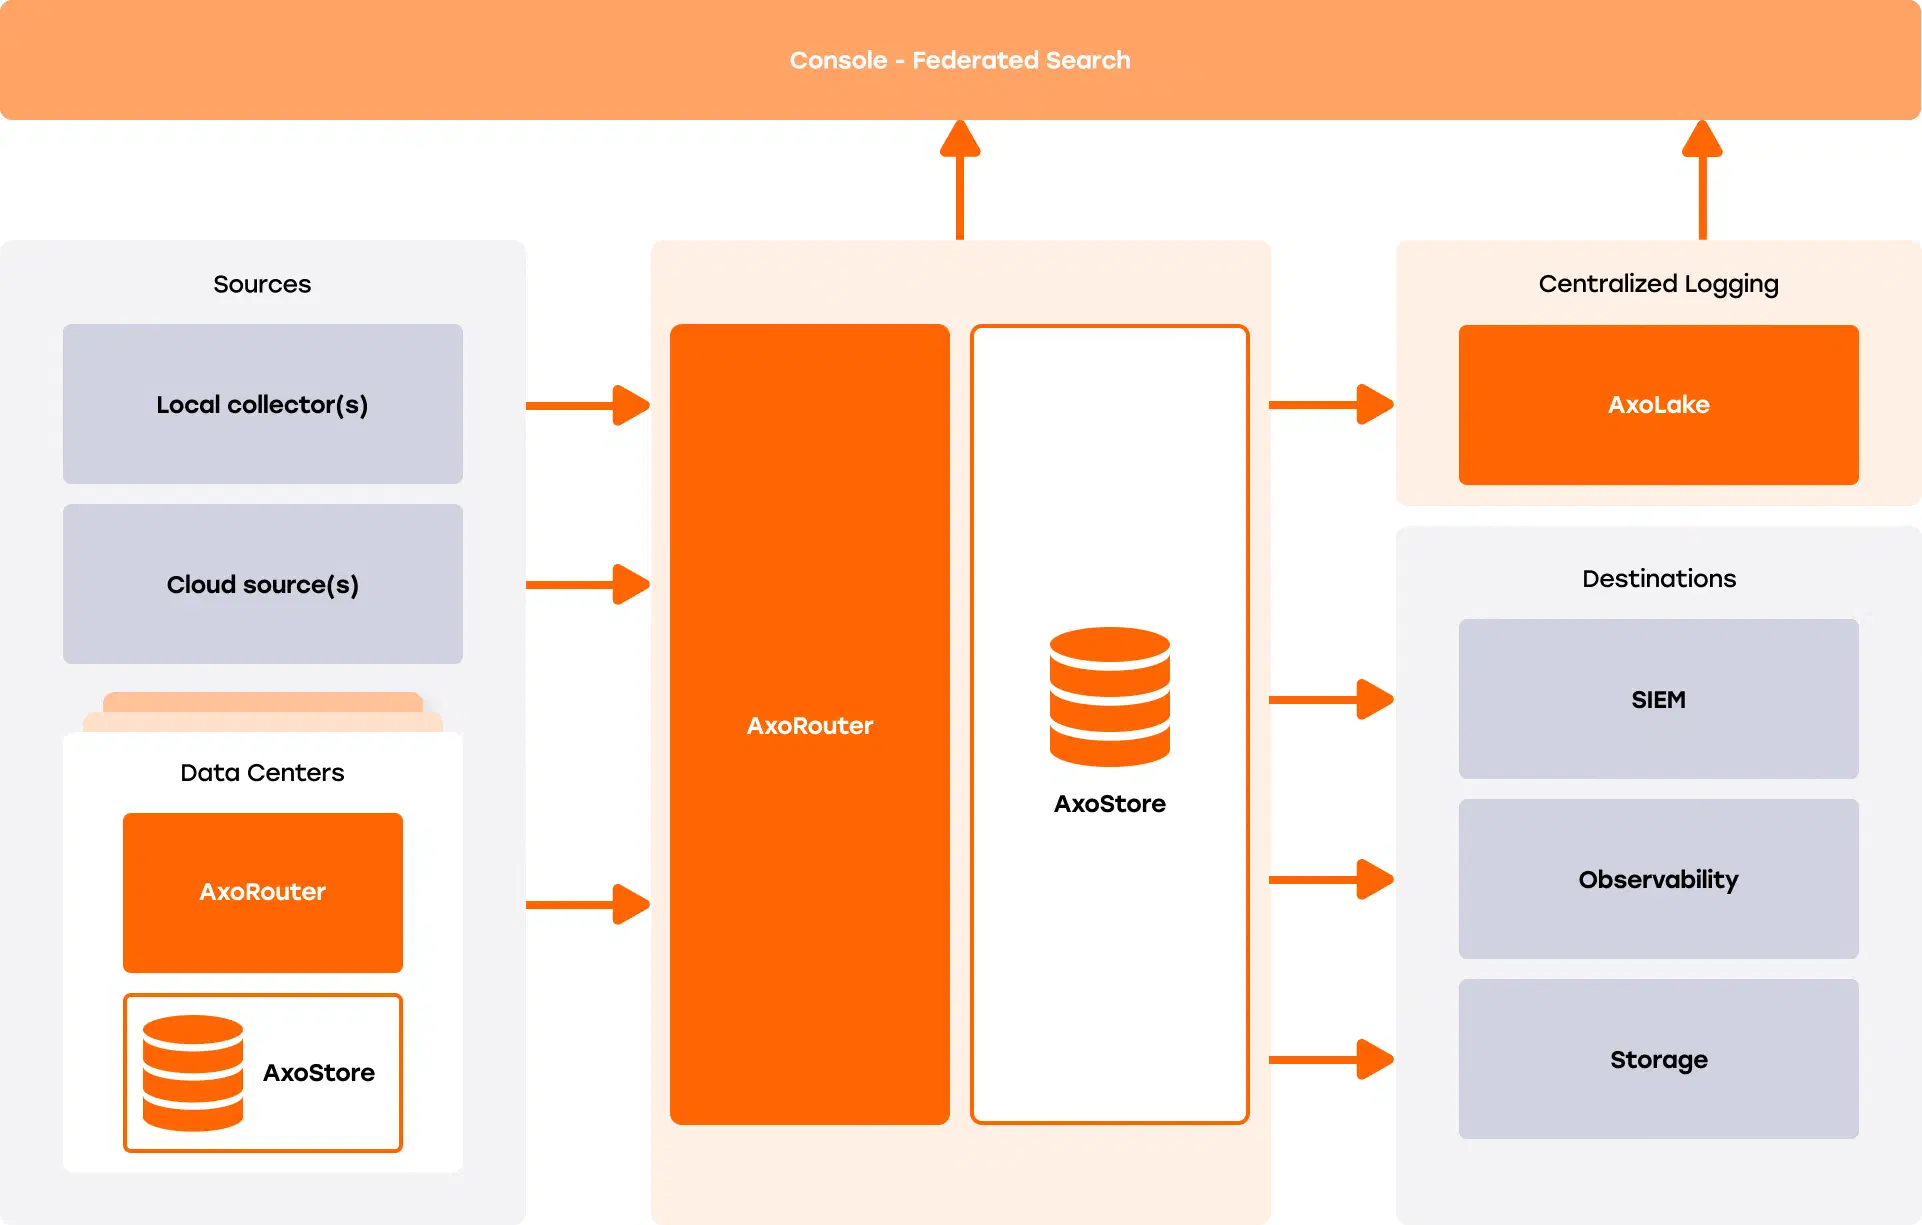
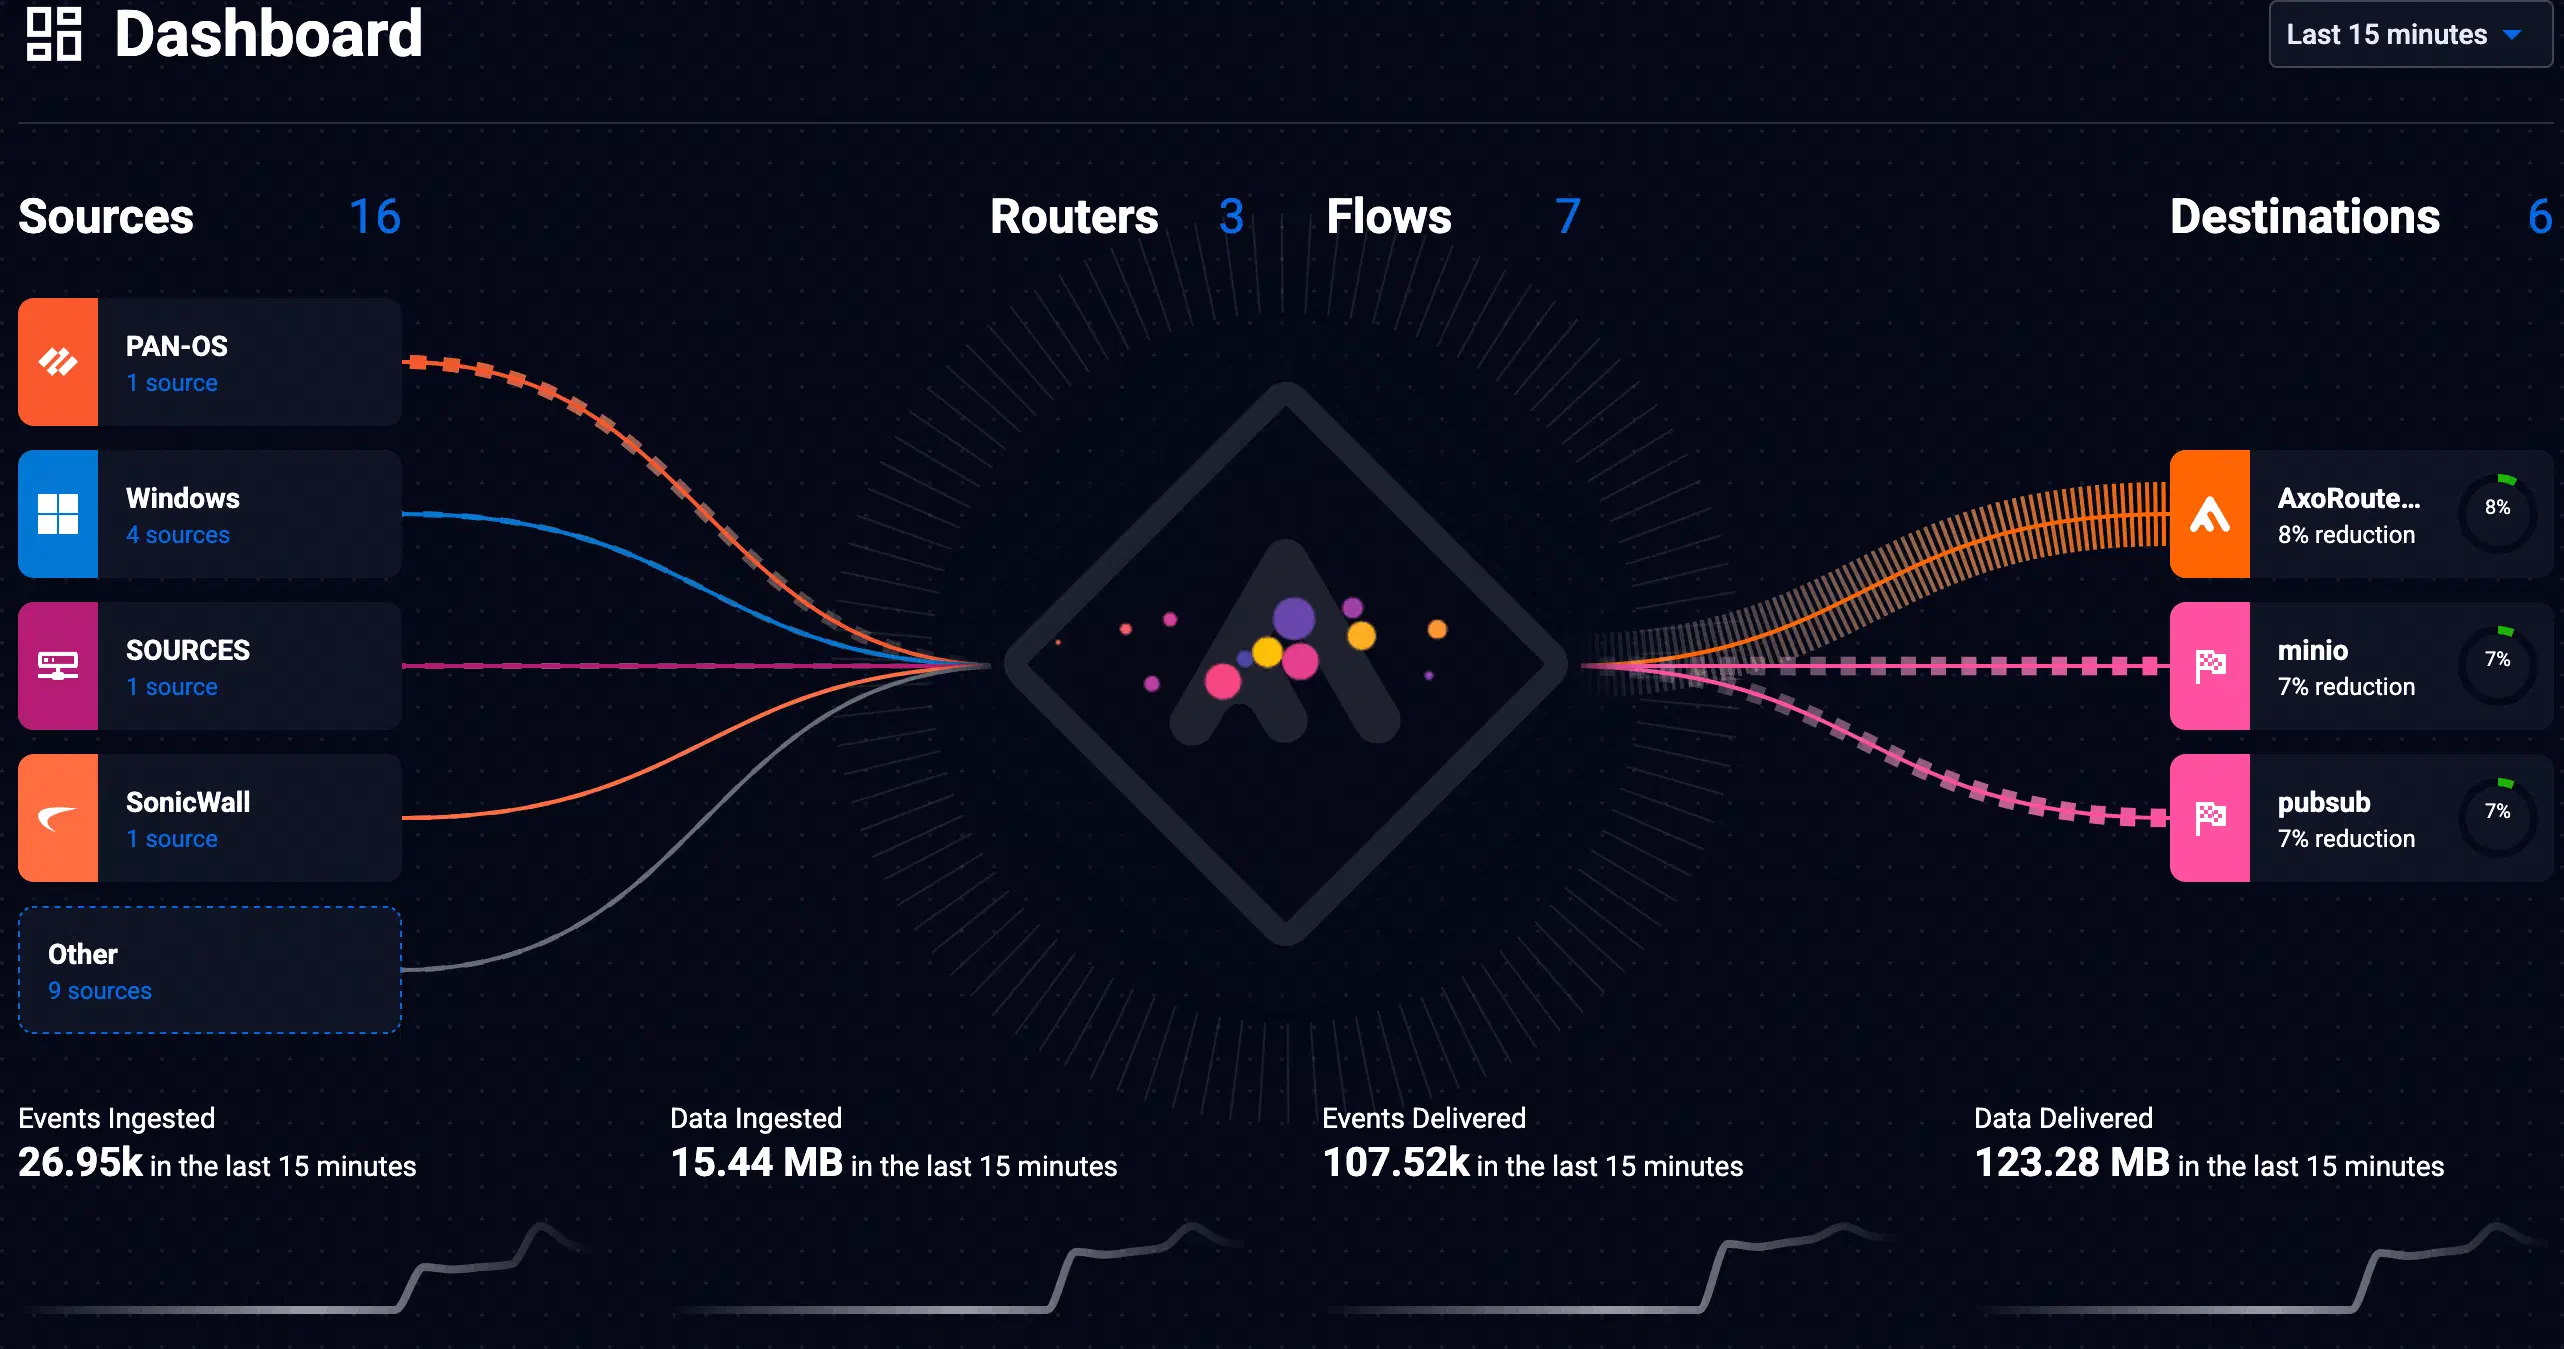
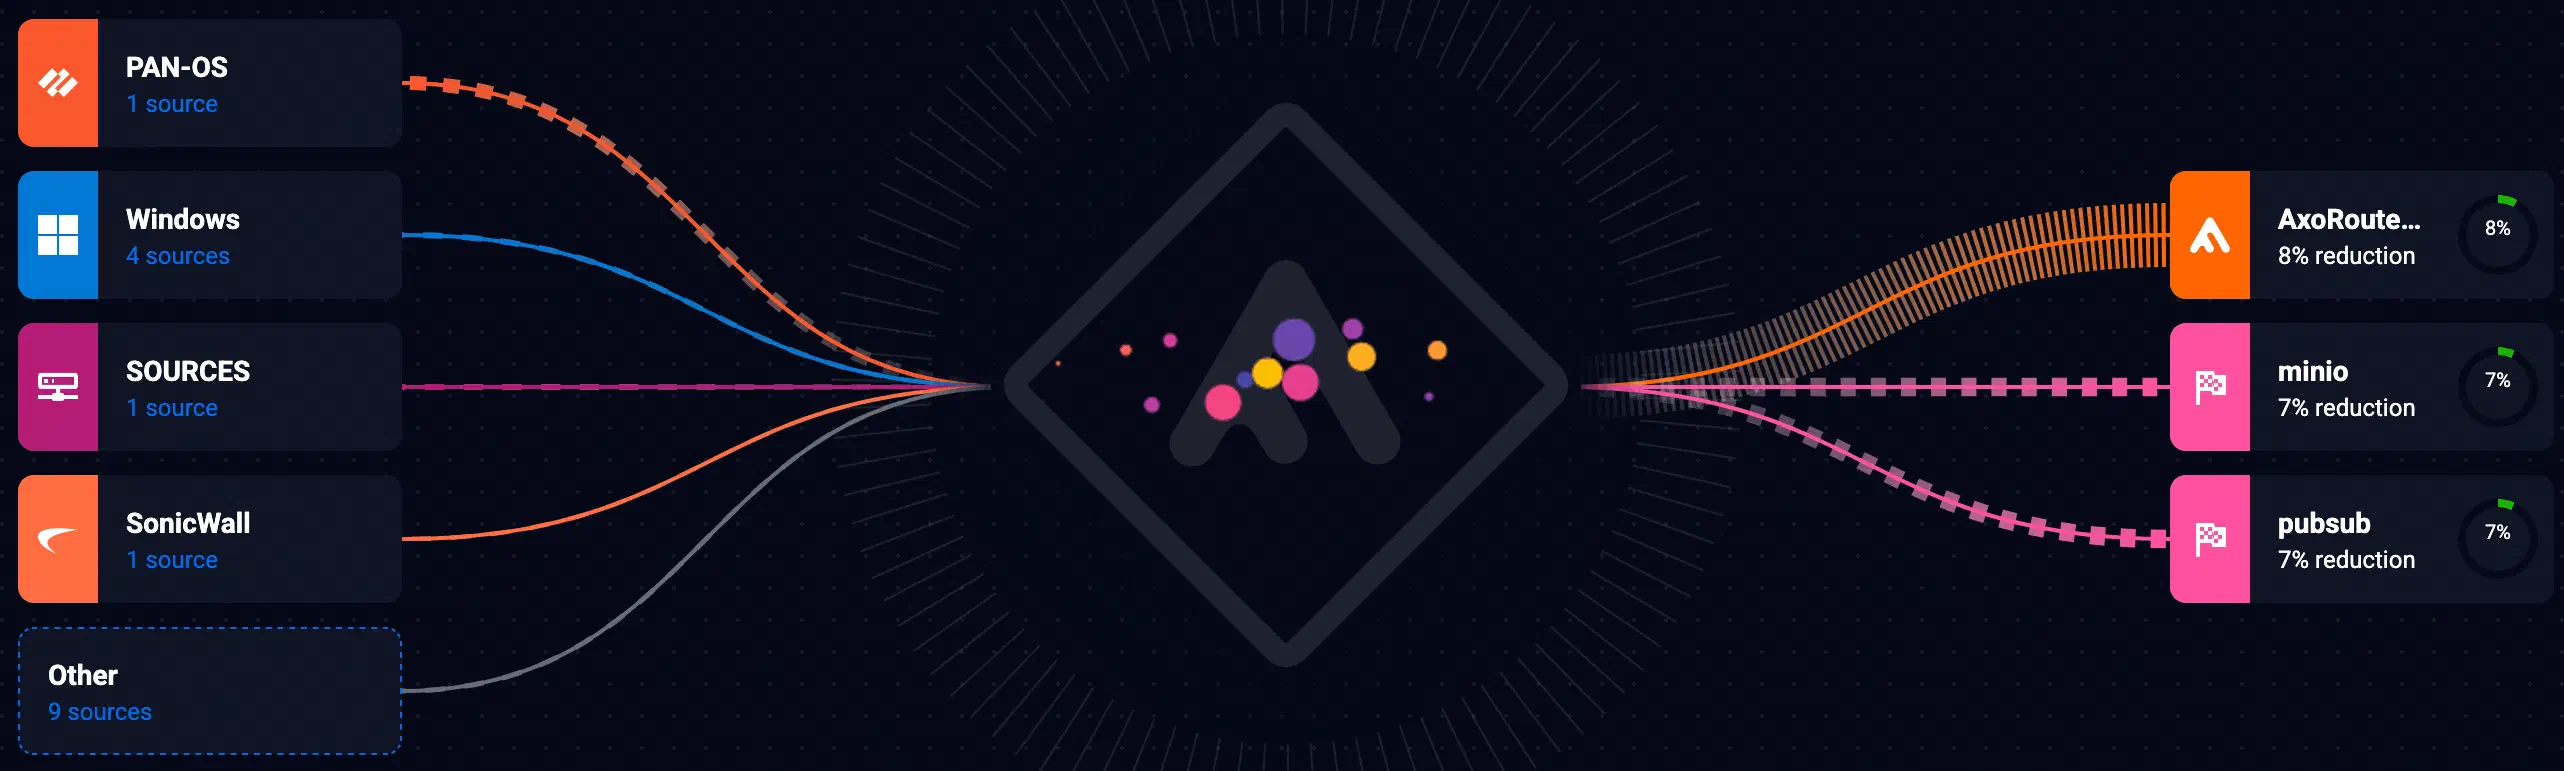
The Axoflow provides an end-to-end pipeline automating the collection, management and loading of your security data in a vendor-agnostic way. The following figure highlights the Axoflow data flow:
Axoflow architecture
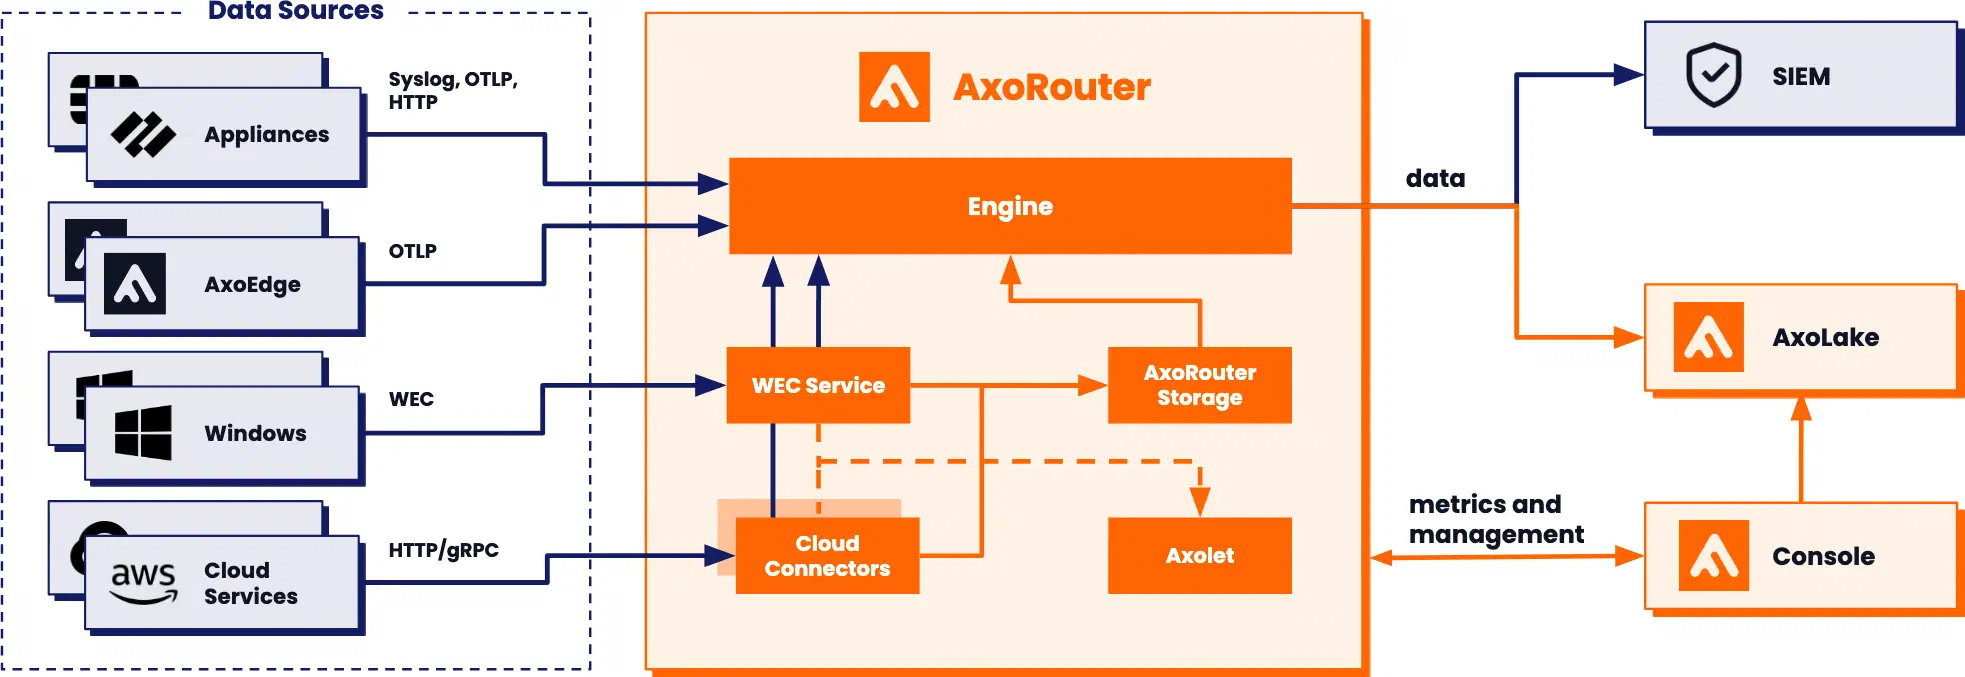
The architecture of Axoflow is comprised of two main elements: the AxoConsole and the Data Plane.
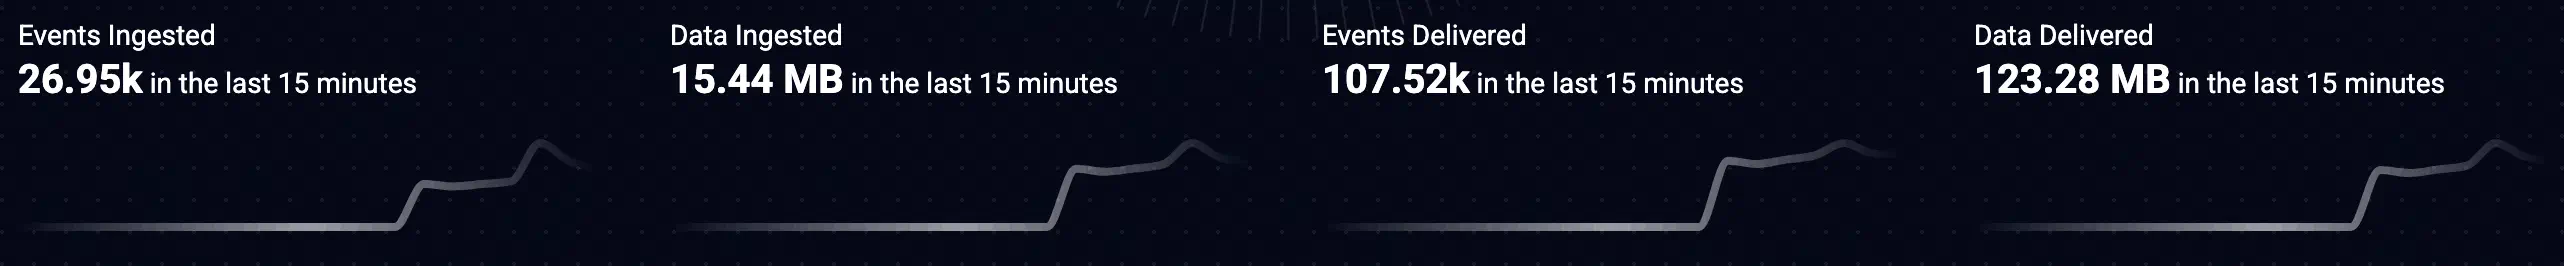
The AxoConsole is primarily concerned with highlighting the metadata of each event. This includes the source from which it originated, the size in bytes (and event count over time), its destination, and any other element which describes the data.
The Data Plane includes collector agents and processing engines (like AxoRouter) that collect, classify, filter, transform, and deliver telemetry data to its proper destinations (SIEMs, storage), and provide metrics to the AxoConsole. The components of the Data Plane can be managed from the AxoConsole, or can be independent.
Pipeline components
A telemetry pipeline consists of the following high-level components:
Data Sources: Data sources are the endpoints of the pipeline that generate the logs and other telemetry data you want to collect. For example, firewalls and other appliances, Kubernetes clusters, application servers can all be data sources. Data sources send their data either directly to a destination, or to a router.
Axoflow provides several log collecting agents and solutions to collect data in different environments, including connectors for cloud services, Kubernetes clusters, Linux servers, and Windows servers.
Routers: Router (also called relays or aggregators) collect the data from a set of data sources and transport them to the destinations.
AxoRouter can collect, curate, and enrich the data: it automatically identifies your log sources and fixes common errors in the incoming data. It also converts the data into a format that best suits the destination to optimize ingestion speed and data quality.
Destinations: Destinations are your SIEM and storage solutions where the telemetry pipeline delivers your security data.
Your telemetry pipeline can consist of managed and unmanaged components. You can deploy and configure managed components from the AxoConsole. Axoflow provides several managed Axoflow agent components that help you collect or fetch data from your various data sources, or act as routers.
AxoConsole
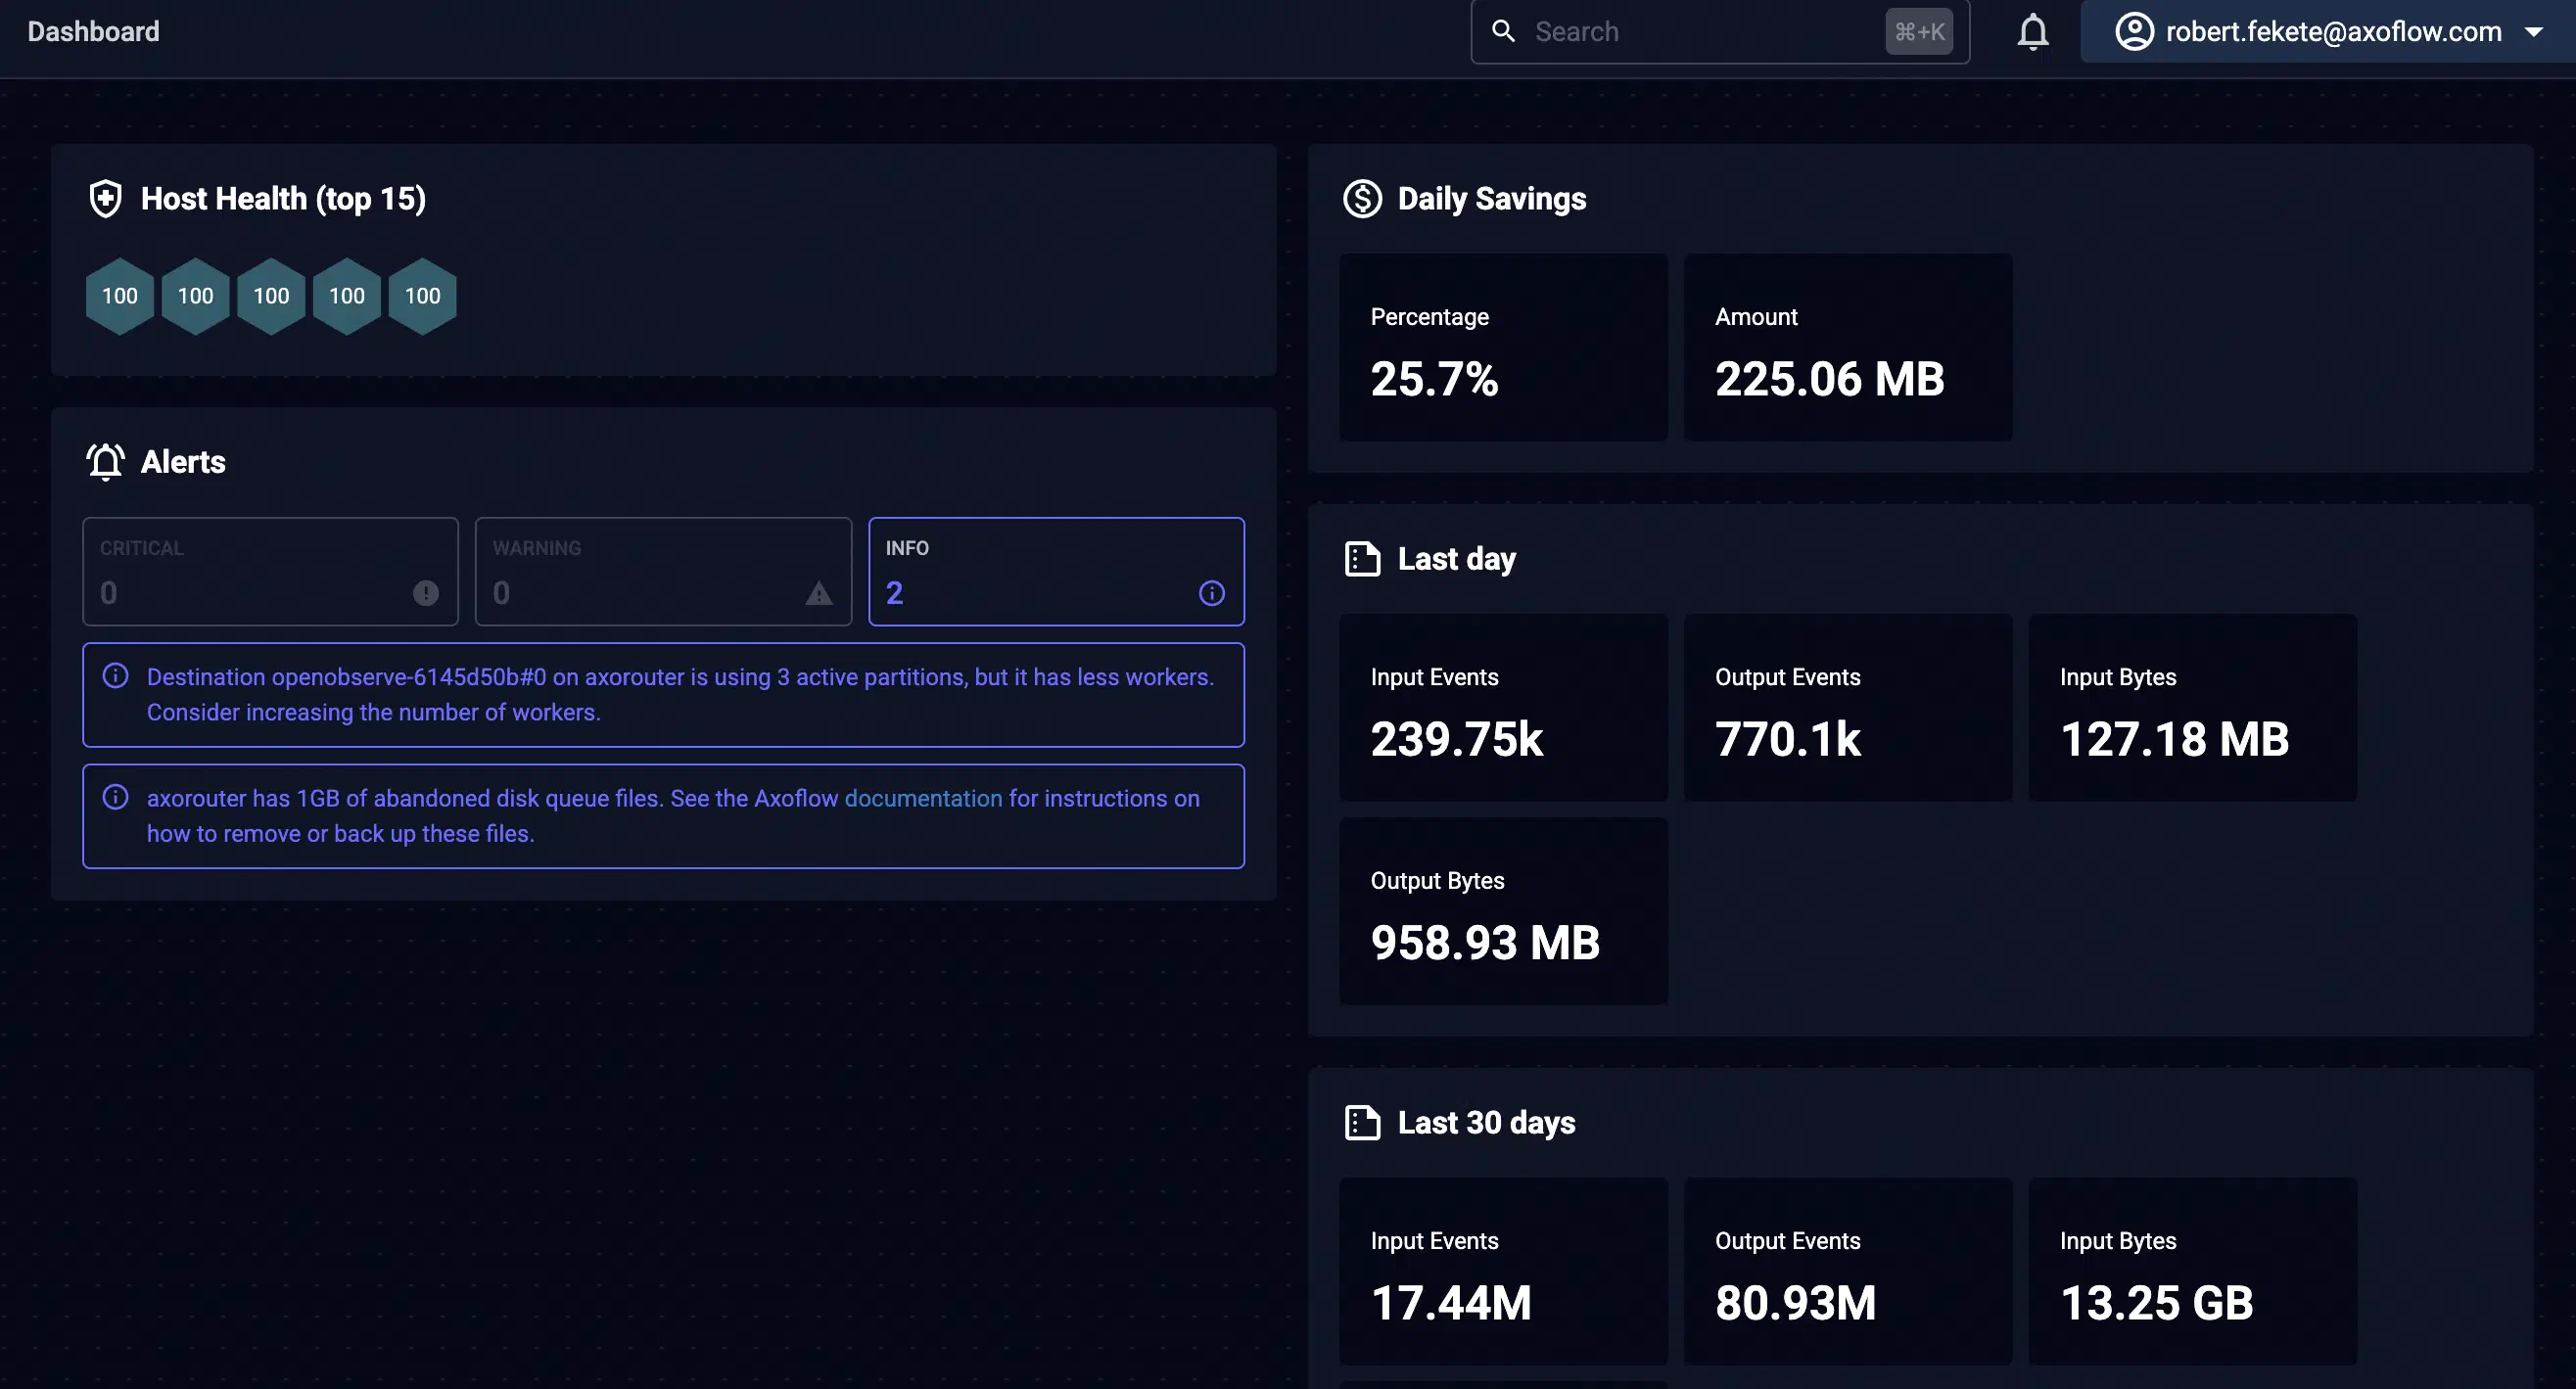
AxoConsole (formerly Axoflow Console) is the data visualization and management UI of Axoflow. Available both as a SaaS and an on-premises solution, including air-gapped and hybrid environments. AxoConsole collects and visualizes the metrics received from the pipeline components to provide insight into the details of your telemetry pipeline and the data it processes. It also allows you to:
AxoRouter is a router (aggregator) and data curation engine: it collects all kinds of telemetry and security data and has all the low-level functions you would expect of log-forwarding agents and routers. AxoRouter can also curate and enrich the collected data, it:
Before sending your data to its destination, AxoRouter automatically converts the data into a format that best suits the destination to optimize ingestion speed and data quality. For example, when sending data to Splunk, setting the proper sourcetype and index is essential.
Note
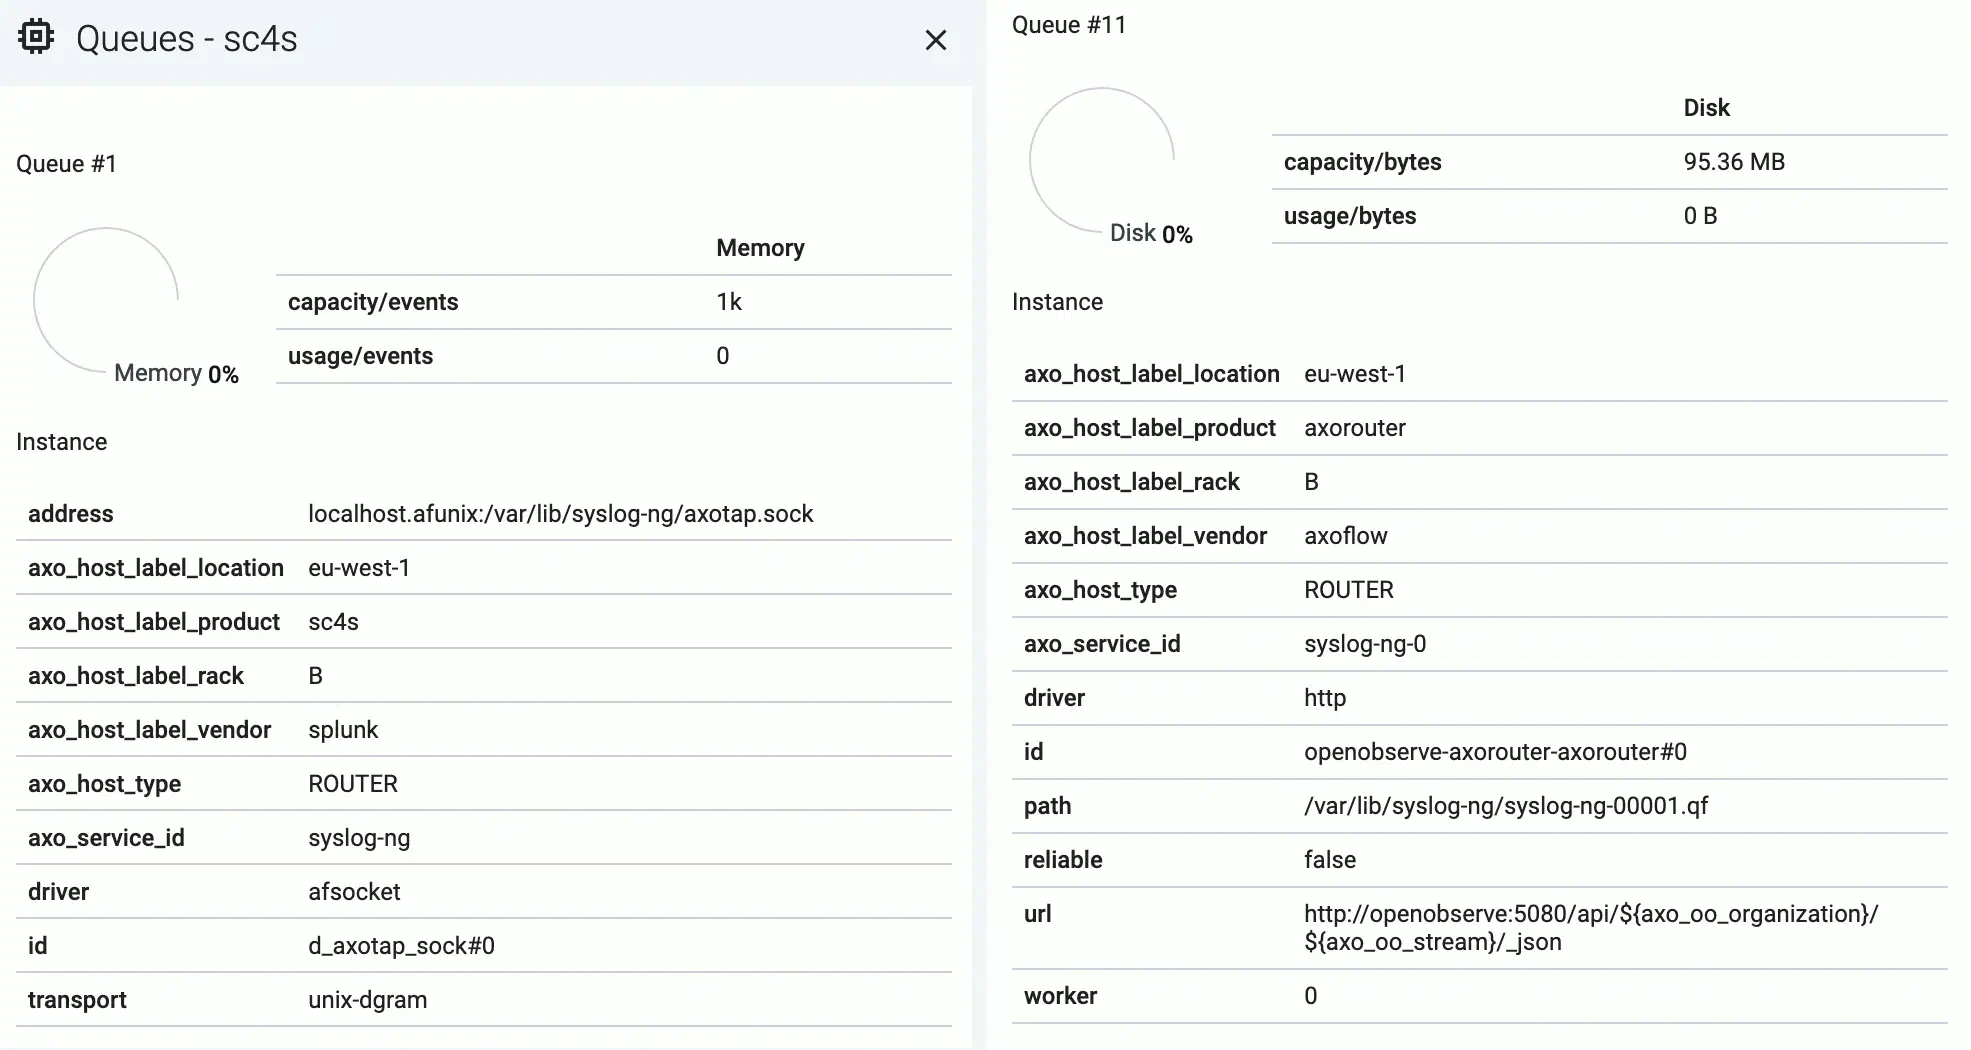
Note that AxoRouter and Axoflow agent collects detailed, real-time metrics about the data-flows – giving you observability over the health of the security data pipeline and its components. Your security data remains in your self-managed cloud or in your on-prem instance where your sources, destinations, Axoflow agents, and AxoRouters are running, only metrics are forwarded to AxoConsole.
Axolet
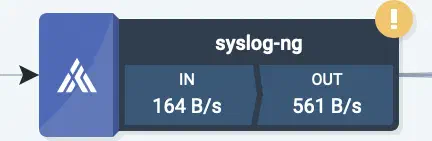
Axolet is a monitoring and management agent that integrates with the local log collector (like AxoSyslog, Splunk Connect for Syslog, or syslog-ng) that runs on the data source and provides detailed metrics about the host and its data traffic to the AxoConsole. AxoRouter deployments automatically include Axolet.
Storage solutions
In addition to being able to route your data to various storage and SIEM solutions, Axoflow provides a range of storage solutions for your use cases, from small, temporal storage to petabyte-scale long-term data retention.
AxoStore
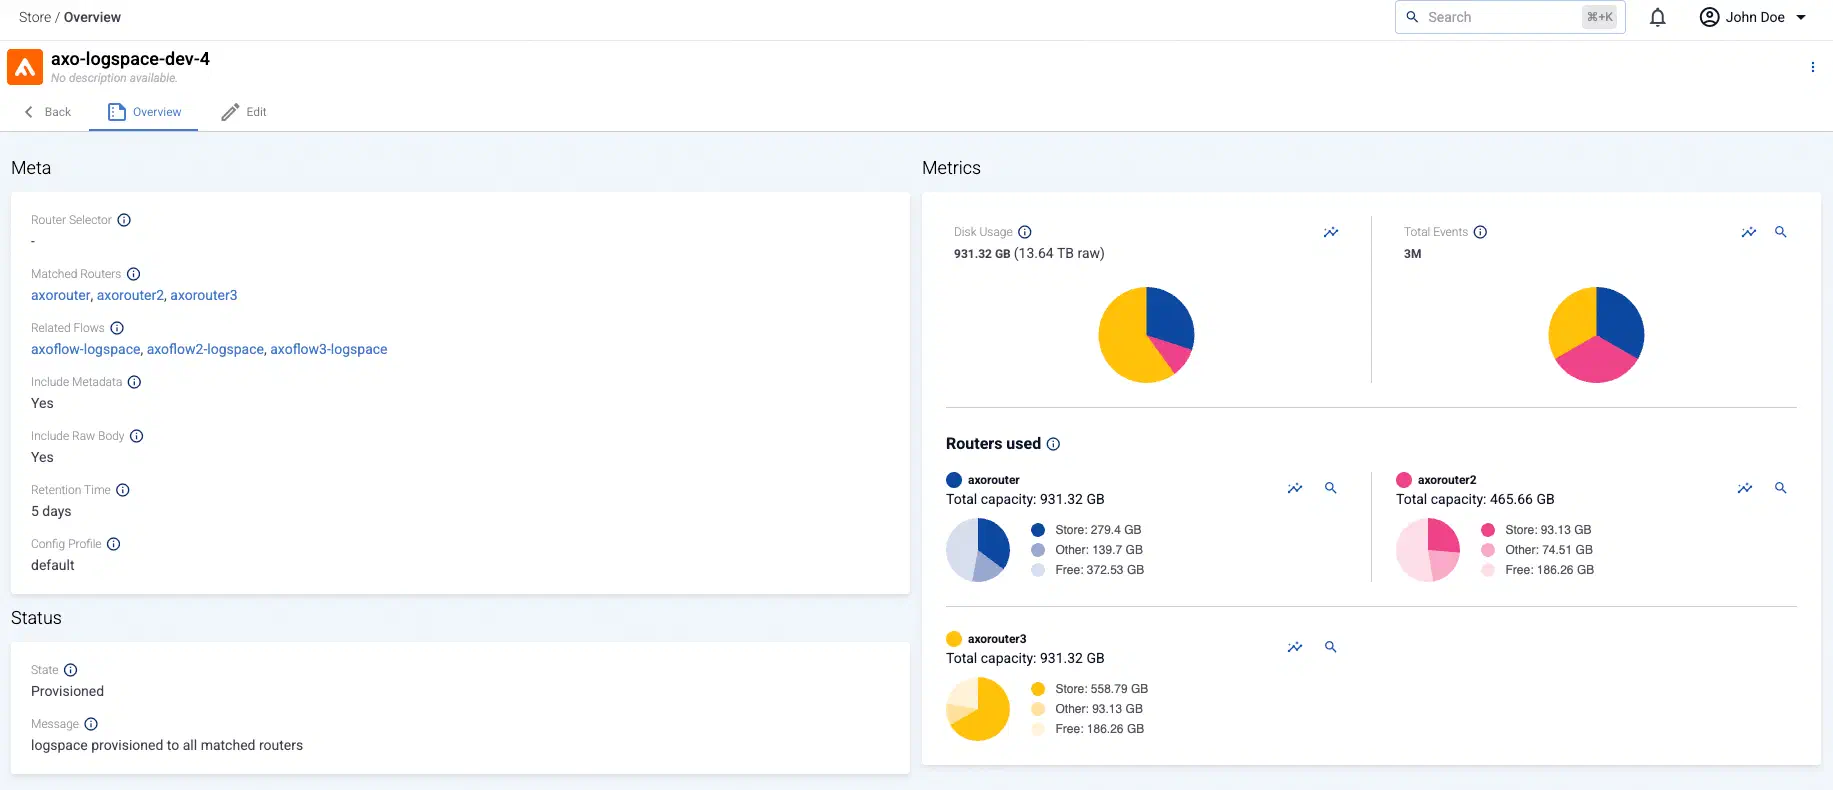
AxoStore is a lightweight, queryable, temporary storage option that stores data locally on the AxoRouter host. AxoConsole provides federated search for every AxoRouter that has AxoStore deployed, so you can simultaneously run queries on every AxoStore.
AxoStore is automatically available for all Axoflow customers, for each AxoRouter node, with 7 days retention, and up to 1TB of storage. For longer retention time or bigger storage, you need an extended AxoStore subscription. Contact us for the details.
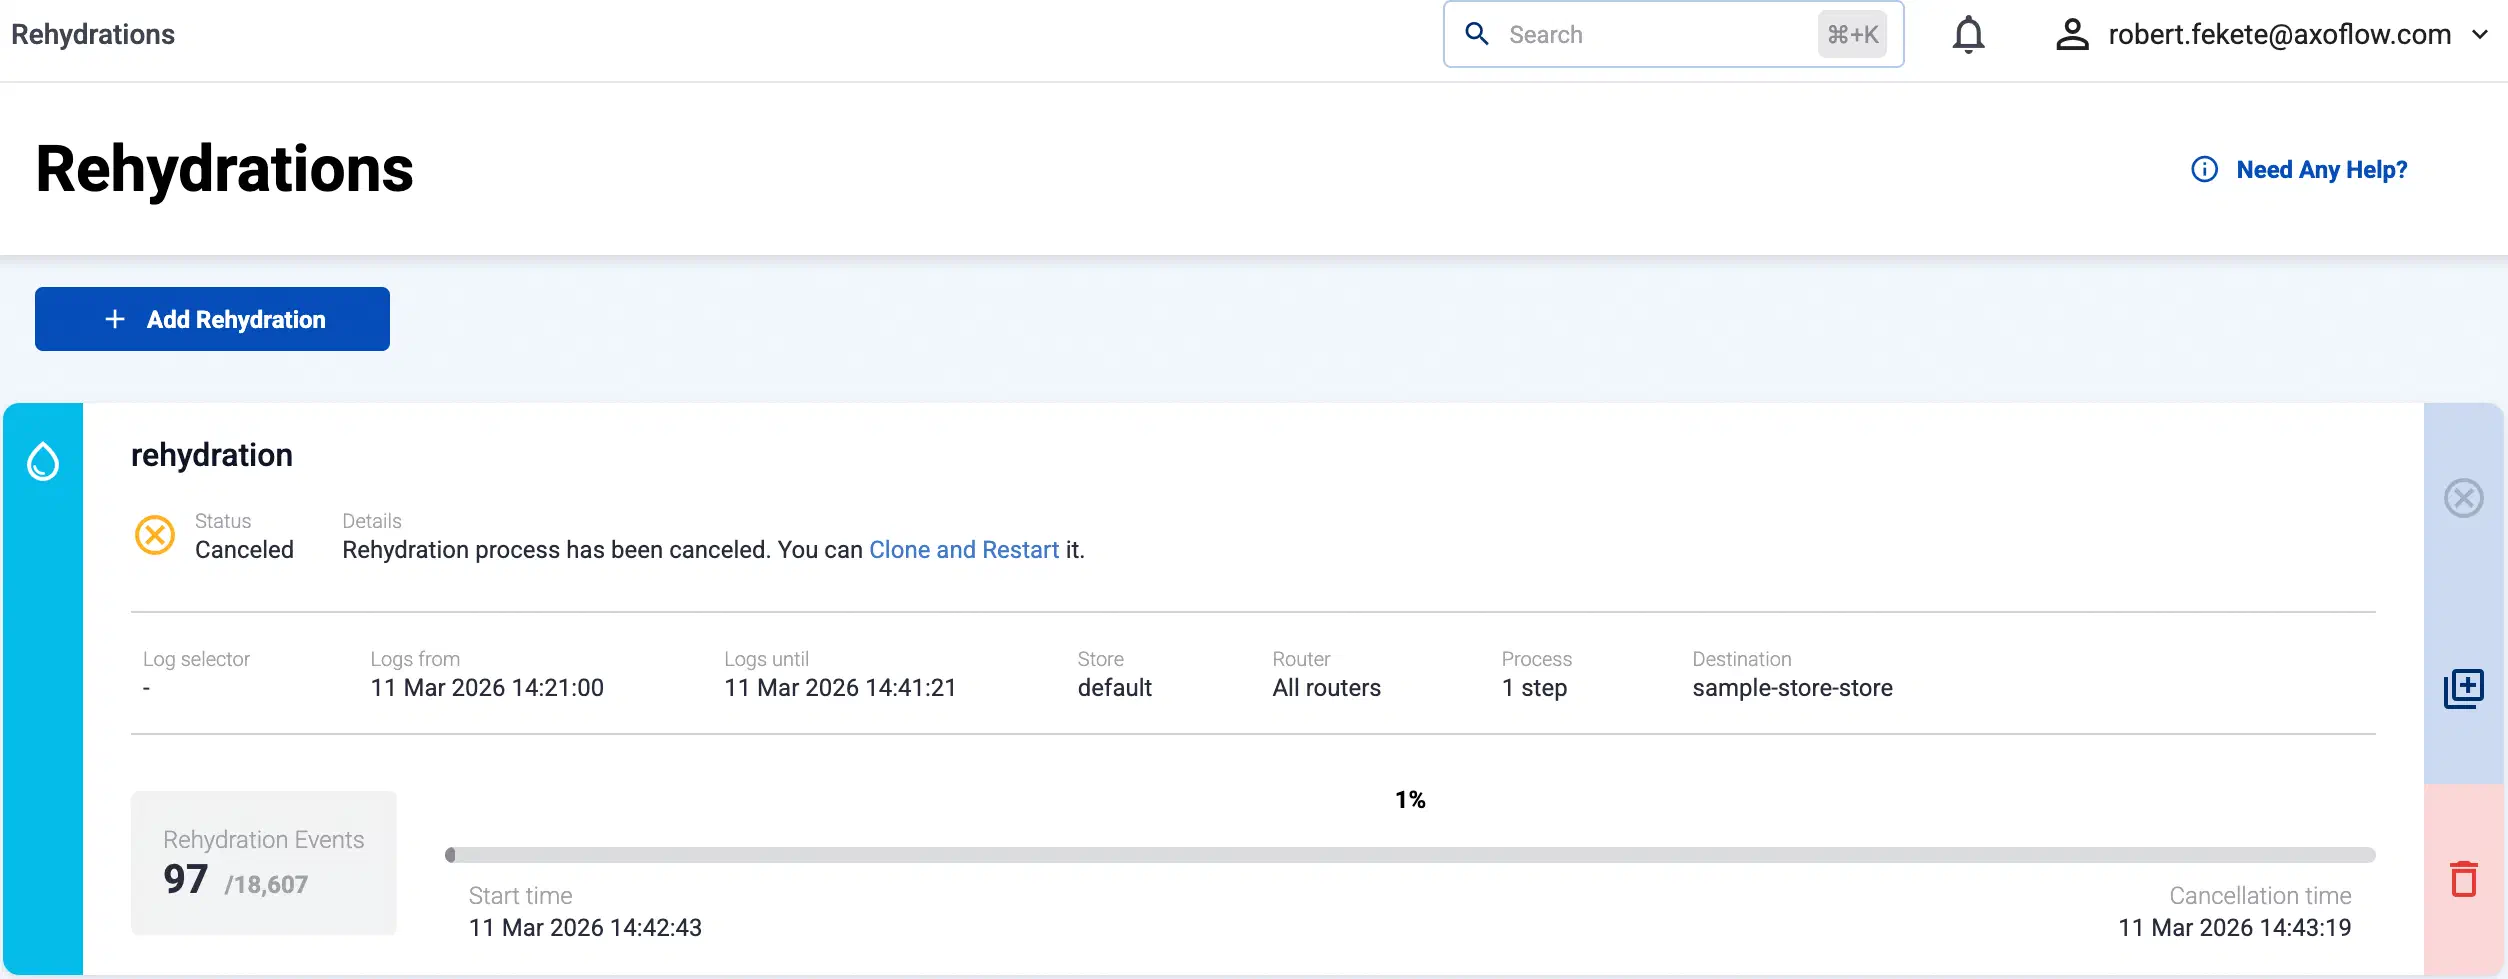
You can retrieve selected data from AxoStore and (rehydrate) it to other destinations for further analysis as needed.
For example, AxoStore allows you to:
Store debug-level logs for a short time (for example, 24h) to support “what if something happens” scenarios.
Collect and search data ad-hoc for maintenance or debugging tasks.
Keep a lightweight local backup of your security data.
Retrieve selected data from AxoStore and (rehydrate) it to other destinations for further analysis as needed.
AxoLake is a tiered SaaS security lake with a scalable hot tier for fast queries, and cost-efficient, S3-compatible cloud-based cold tier. You can use high-level, policy-based routing to decide which data goes to cold storage, hot storage, or your SIEM. If you need to work with data from cold storage, you can rehydrate it into hot storage, or even replay it to send it into your SIEM. Designed for long-term retention, open access, and integration with SIEMs and security analytics.
AxoLake provides cheap, long-term archive storage, while making hot data available for detection and analytics.
Axoflow provides the following agents and collectors:
AxoRouter is the main collector and data processing engine for push-based protocols, such as Syslog, OTLP, HTTP, and WEC.
Axoflow agent (AxoEdge) is a collection of managed agents for Linux, Kubernetes, and Microsoft Windows. They collect local data from the host they’re deployed on, send it to an AxoRouter instance, and provide metadata for AxoConsole. Axoflow agent provides file and journald collectors on Linux and Event log and Event trace collectors on Windows.
Axoflow Cloud Connectors are pull-based collectors built on top of OpenTelemetry that integrate with all modern Cloud Services (for example, AWS CloudWatch, Amazon S3, GCP Pub/Sub, Azure Event Hub), API and streaming sources (CrowdStrike, Kafka) and legacy methods (SQL) for enterprise log collection use cases. In addition to the existing sources, Axoflow Cloud Connectors can consume events from a vast amount of HTTP or streaming APIs and can be extended by the Axoflow team to support any custom pull based HTTP or streaming API source. A few specific examples:
Receiver
Cloud source
awscloudwatchreceiver
AWS CloudWatch Logs
awsfirehosereceiver
Kinesis Firehose
awss3receiver
S3 log storage
awslambdareceiver
Lambda telemetry
azureblobreceiver
Azure Blob Storage
azureeventhubreceiver
Azure Event Hub
cloudflarereceiver
Cloudflare Logpush
cloudfoundryreceiver
Cloud Foundry logs
googlecloudpubsubreceiver
GCP Pub/Sub
kafkareceiver
Kafka log streams
lokireceiver
Loki / Promtail
fluentforwardreceiver
Fluentd / Fluent Bit
syslogreceiver
Syslog (cloud services)
3 - Deployment scenarios
Thanks to its flexible deployment modes, you can quickly insert an Axoflow and its processing node (called AxoRouter) transparently into your data pipeline and gain instant benefits:
Data reduction
Improved SIEM accuracy
Configuration UI for routing data
Automatic data classification
Metrics about log ingestion, processing, and data drops
Analytics about the transported data
Health check, highlighting anomalies
Note
Note that AxoRouter and Axoflow agent collects detailed, real-time metrics about the data-flows – giving you observability over the health of the security data pipeline and its components. Your security data remains in your self-managed cloud or in your on-prem instance where your sources, destinations, Axoflow agents, and AxoRouters are running, only metrics are forwarded to AxoConsole.
After the first step, you can further integrate your pipeline, by deploying Axoflow agents to collect and manage your security data, or onboarding your existing log collector agents (for example, syslog-ng). Let’s see what these scenarios look like in detail.
The AxoConsole provides the UI for accessing metrics and analytics, deploying and configuring AxoRouter instances, configuring data flows, and so on.
3.2 - Transparent router mode
AxoRouter is a powerful aggregator and data processing engine that can receive data from a wide variety of sources, including:
OpenTelemetry,
syslog,
Windows Event Forwarding, or HTTP.
In transparent mode, you deploy AxoRouter in front of your SIEM and configure your sources or aggregators to send the logs to AxoRouter instead of the SIEM. The transparent deployment method is a quick, minimally invasive way to get instant benefits and value from Axoflow, and:
automatically identify the sending device or application,
Note
Note that AxoRouter and Axoflow agent collects detailed, real-time metrics about the data-flows – giving you observability over the health of the security data pipeline and its components. Your security data remains in your self-managed cloud or in your on-prem instance where your sources, destinations, Axoflow agents, and AxoRouters are running, only metrics are forwarded to AxoConsole.
3.3 - Router and edge deployment
Axoflow provides agents to collect data from all kinds of sources:
You can deploy the AxoRouter data aggregator on Linux and Kubernetes.
Using the Axoflow collector agents gives you:
Reliable transport: Between its components, Axoflow transports security data using the reliable OpenTelemetry protocol (OTLP) for high performance, and to avoid losing messages.
Metrics: Detailed metrics from every collector provide unprecedented insight into the status of your data pipeline.
3.4 - AxoRouter high availability
Deploy multiple AxoRouter instances in a high availability cluster, either behind a load balancer or sharing a virtual IP managed by keepalived.
You can deploy multiple AxoRouter instances as a high availability cluster so the data pipeline keeps accepting logs even when an AxoRouter host fails. There are two main approaches: a load balancer in front of the cluster, or a shared virtual IP managed by keepalived.
Load balancer in front of the cluster
Sources connect to a load balancer, which forwards traffic to one of the AxoRouter hosts. If a host fails, the load balancer routes traffic to the remaining healthy hosts.
This approach reuses an existing load balancer if you already have one, but requires the load balancer to support all relevant protocols (for example, syslog over TCP or TLS).
Virtual IP managed by keepalived
Sources connect to a virtual IP address that floats across the AxoRouter hosts. keepalived uses VRRP to elect a primary node, which holds the virtual IP. If the primary node fails, keepalived moves the virtual IP to a backup node, and the sources keep reaching AxoRouter without changing their destination address.
This approach doesn’t depend on external load balancer infrastructure and suits on-prem deployments well.
Cluster sizing and topology
The hosts running AxoRouter can be physical or virtual machines. The recommended layout depends on which you choose:
Physical machines: Install two machines with a dedicated HA link between them to keep the HA traffic separate from the production traffic.
Virtual machines: Set up three VMs with a dedicated (and guaranteed bandwidth) HA link (HA VLAN) spanning across them, to keep the HA traffic separate from the production traffic.
Note
A cluster targeting highly reliable services should ideally consist of at least three nodes to avoid split-brain situations. In a split-brain situation, both nodes think that they are the last surviving node (for example, during a network failure) and bring up their services, leading to several problems.
The setups described here use fewer than the ideal number of nodes for cost reasons. Dedicated HA links provide an additional channel for HA communication independently of the production traffic, and significantly reduce the risk of split-brain scenarios.
If your organization already has a syslog architecture in place, Axoflow provides ways to reuse it. This allows you to integrate your existing infrastructure with Axoflow, and optionally – in a later phase – replace your log collectors with the agents provided by Axoflow.
Managed AxoRouter deployments
In this deployment mode you use the centralized management UI of AxoConsole to manage your AxoRouter instances. This provides the tightest integration and the most benefits, including:
In this mode, you install AxoRouter on the data source to replace its local collector agent, and manage it manually. That way you get the functional benefits of using AxoRouter as an aggregator and data curation engine to collect and classify your data, but can manage its configuration as you see fit. This gives you all the benefits of the read-only mode (since AxoRouter includes Axolet as well), and in addition, it provides:
In this scenario, you install Axolet on the data source. Axolet is a monitoring (and management) agent that integrates with the local log collector and sends detailed metrics about the host and its data traffic to the AxoConsole. This allows you to use the AxoConsole to:
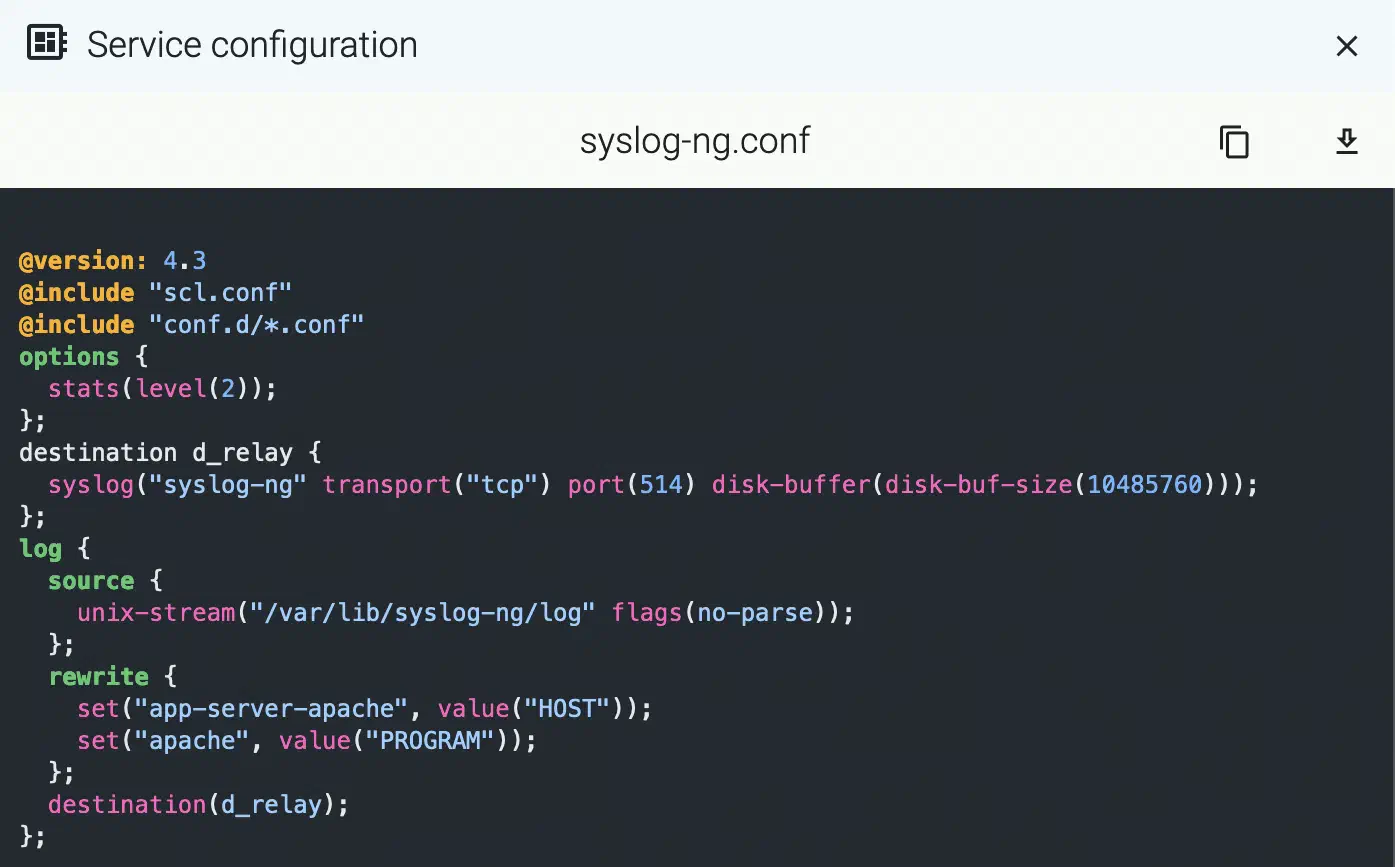
Axoflow integrates with existing syslog-ng (AxoSyslog, Splunk Connect for Syslog (SC4S), or syslog-ng) deployments by running the Axolet agent besides the syslog-ng process on the host. The agent gathers metrics from syslog-ng through the control socket. To extend the built-in metrics, the agent can be instrumented with a minimal configuration change to provide additional metrics about the log flow. With some additional instrumentation, syslog-ng can be extended with log tapping functionality as well.
Note
Axoflow can manage the configuration of AxoRouter and Axoflow agent deployments using AxoConsole. AxoSyslog, SC4S, syslog-ng, or syslog-ng Premium Edition configurations are available centrally in read-only mode. To centrally manage these configurations from AxoConsole upgrade the agents to AxoRouter. (See the Why Enterprises Choose Axoflow Platform vs. syslog‑ng™ Premium Edition? comparison page for details.)
3.6 - Multi-cloud and multi-datacenter scenario
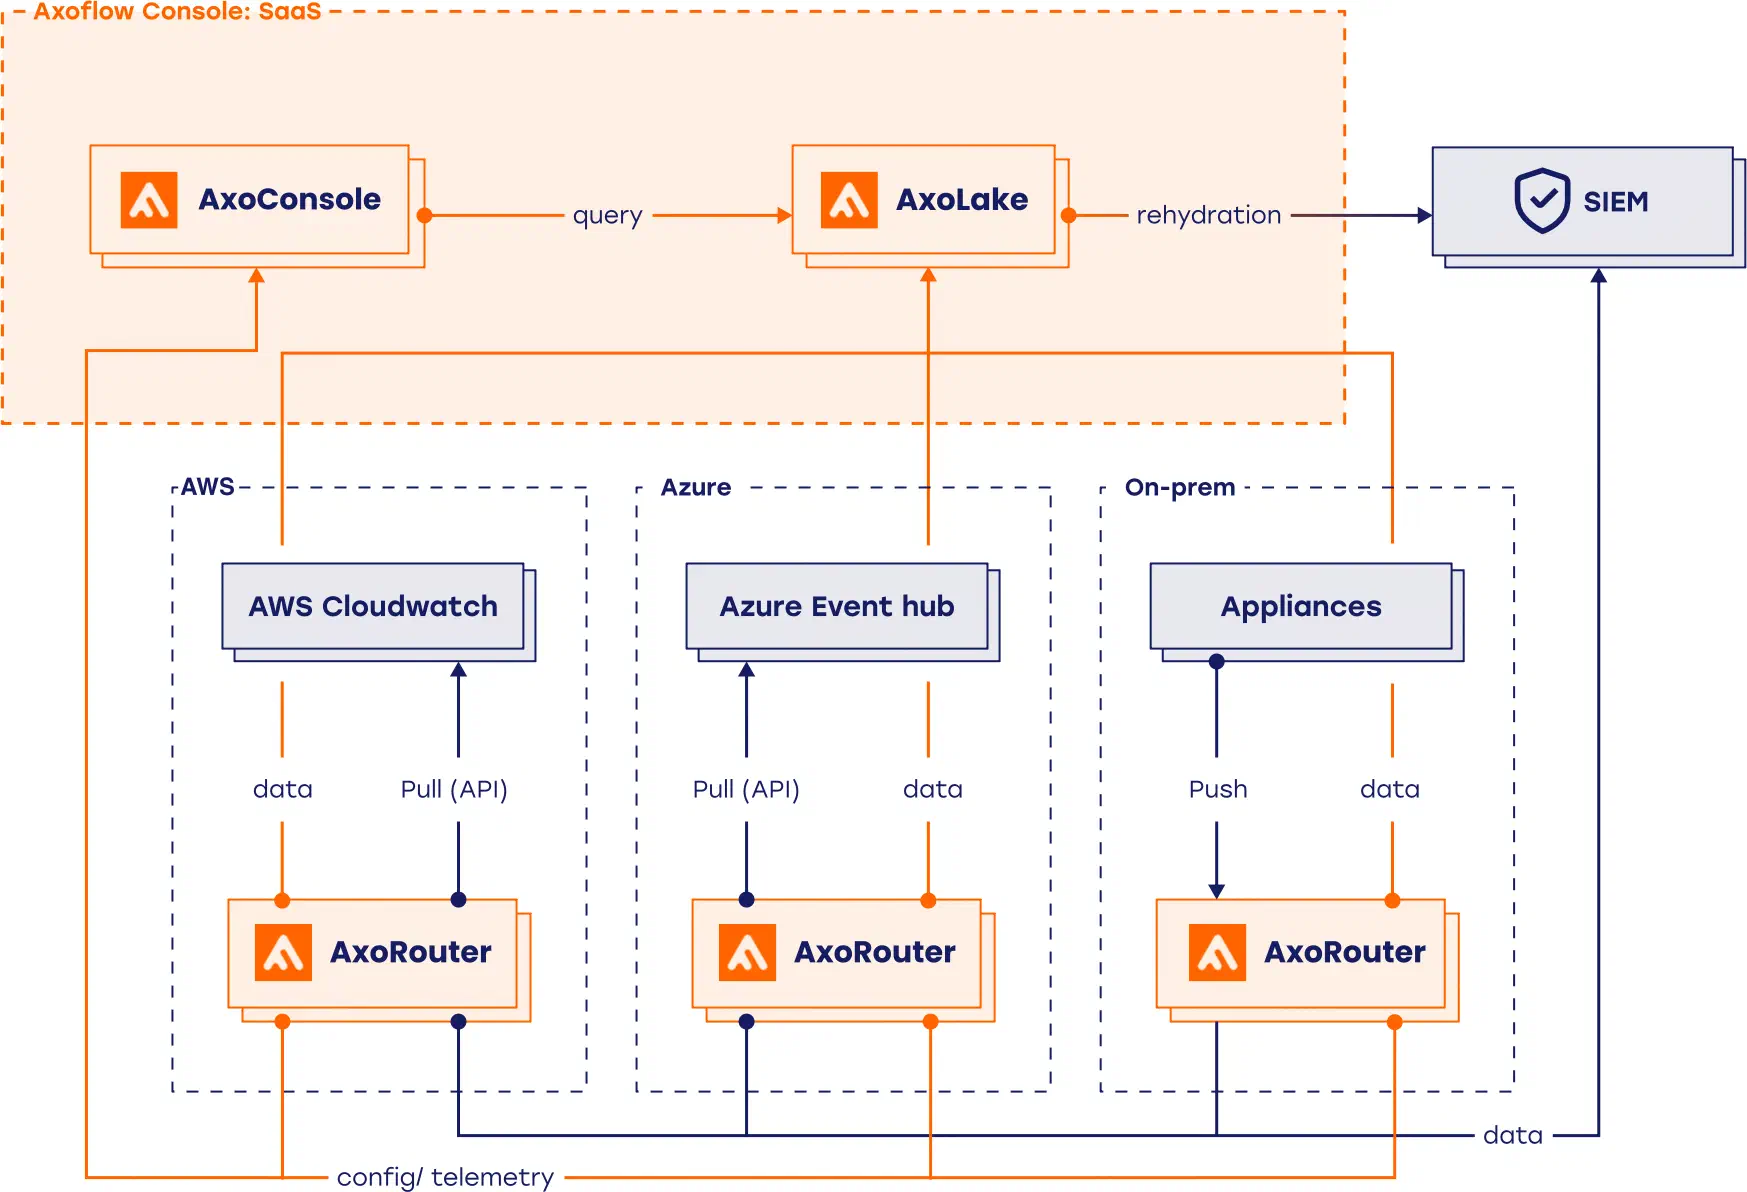
Organizations running workloads across multiple cloud providers (AWS, Azure, GCP) and private datacenters face a common challenge: each environment produces security and observability data in different formats, volumes, and locations, making it hard to collect, normalize, and route it consistently.
Axoflow is designed for exactly this scenario. You deploy Axoflow agent agents and Axoflow Cloud Connectors close to your data sources in each cloud and datacenter. The agents forward data to one or more AxoRouter nodes, which you can place per region to minimize egress costs, or centralize for simpler operations.
This approach gives you:
Single management plane: You configure and monitor all Axoflow agent agents and AxoRouter nodes from the AxoConsole, regardless of which cloud or datacenter they run in.
Local aggregation: AxoRouters automatically filter, enrich, and reduce data before forwarding it, so you only pay cross-cloud or cross-datacenter egress for the data that matters.
Reliable transport: Axoflow uses the OpenTelemetry protocol (OTLP) between components (Axoflow agent to AxoRouter and Axoflow Cloud Connector to AxoRouter), so no messages are lost when crossing network boundaries between environments.
Unified metrics: Every agent and router emits detailed per-component metrics, so you have end-to-end visibility into your data pipeline across all environments.
Flexible routing: You can route data to environment-specific destinations (for example, a regional SIEM or local archive) or aggregate it centrally — or both — using policy-based routing.
3.7 - On-prem or air-gapped deployment
Regulated industries — finance, healthcare, government — and security-sensitive organizations often cannot send data outside their own infrastructure and cannot install software from the internet. In these environments, routing logs and telemetry through a cloud service is not an option, and internet connectivity may be restricted or entirely unavailable.
Axoflow supports fully on-premises deployments, when the AxoConsole, AxoRouter nodes, and Axoflow agent agents all run inside your own datacenter. No data reaches external infrastructure, and the AxoConsole that manages the entire pipeline is also hosted on your own hardware. Air-gapped environments with no internet access are supported.
This approach gives you:
Data sovereignty: all security data stays within your infrastructure. No component in the pipeline requires connectivity to Axoflow’s cloud services.
Air-gapped support: you can deploy and operate Axoflow in environments with no internet access.
Single management plane: the on-premises AxoConsole configures and monitors all Axoflow agent agents and AxoRouter nodes, giving you the same visibility and control as the SaaS offering.
Local aggregation: AxoRouters filter, enrich, and reduce data before it moves between segments of your network, minimizing internal traffic.
Reliable transport: Axoflow uses the OpenTelemetry protocol (OTLP) between Axoflow agent and AxoRouter, so no messages are lost even under network instability.
Unified metrics: every agent and router emits detailed per-component metrics, giving you end-to-end visibility into your data pipeline without leaving your perimeter.
Request a demo sandbox environment. This pre-deployed environment contains a demo pipeline complete with destinations, routers, and sources that generate traffic, and you can check the metrics, use the analytics, modify the flows, and so on to get a feel of using a real Axoflow deployment.
Request a free evaluation version. That’s an empty cloud deployment you can use for testing and PoC: you can onboard your own pipeline elements, add sources and destinations, and see how Axoflow performs with your data!
Request a live demo where our engineers show you how Axoflow works, and can discuss your specific use cases in detail.
5 - Getting started
Select in which scenario you want to start using Axoflow:
This guide shows you how to get started with Axoflow, and use the built-in AxoStore for destination. You’re going to install AxoRouter, and configure or create a source to send data to AxoRouter. You’ll also configure AxoRouter to forward the received data to AxoStore, a temporary storage solution available on the AxoRouter host. The resulting topology will look something like this:
Why use Axoflow
Using the Axoflow security data pipeline automatically corrects and augments the security data you collect, resulting in high-quality, curated, SIEM-optimized data. It also removes redundant data to reduce storage and SIEM costs. In addition, it allows automates pipeline configuration and provides metrics and alerts for your telemetry data flows.
A data source. This can be any host that you can configure to send syslog or OpenTelemetry data to your AxoRouter instance that you’ll install.
A host that you’ll install AxoRouter on. This can be a separate Linux host, or a virtual machine running on your local computer.
AxoRouter should work on most Red Hat and Debian compatible Linux distributions. For production environments, we recommend using Red Hat 9.
Network access
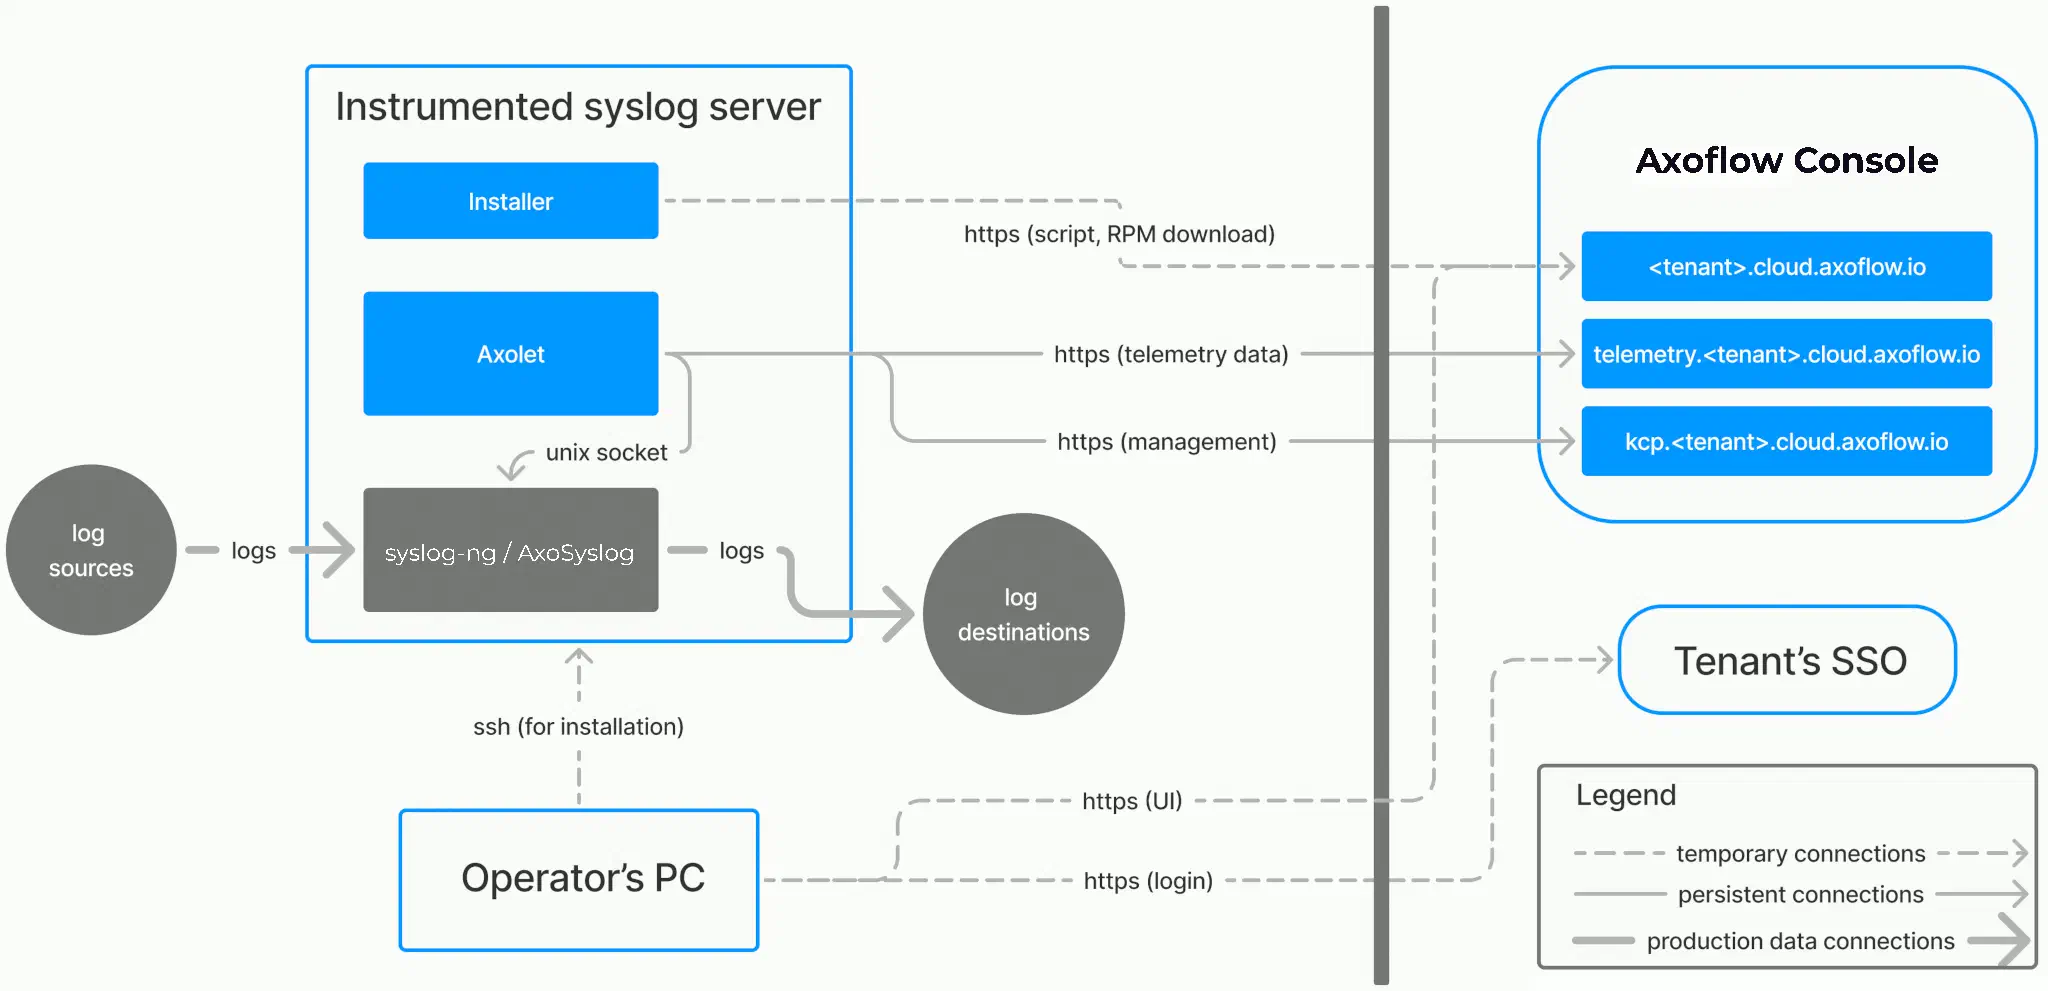
The host must be able to access the following domains related to the AxoConsole:
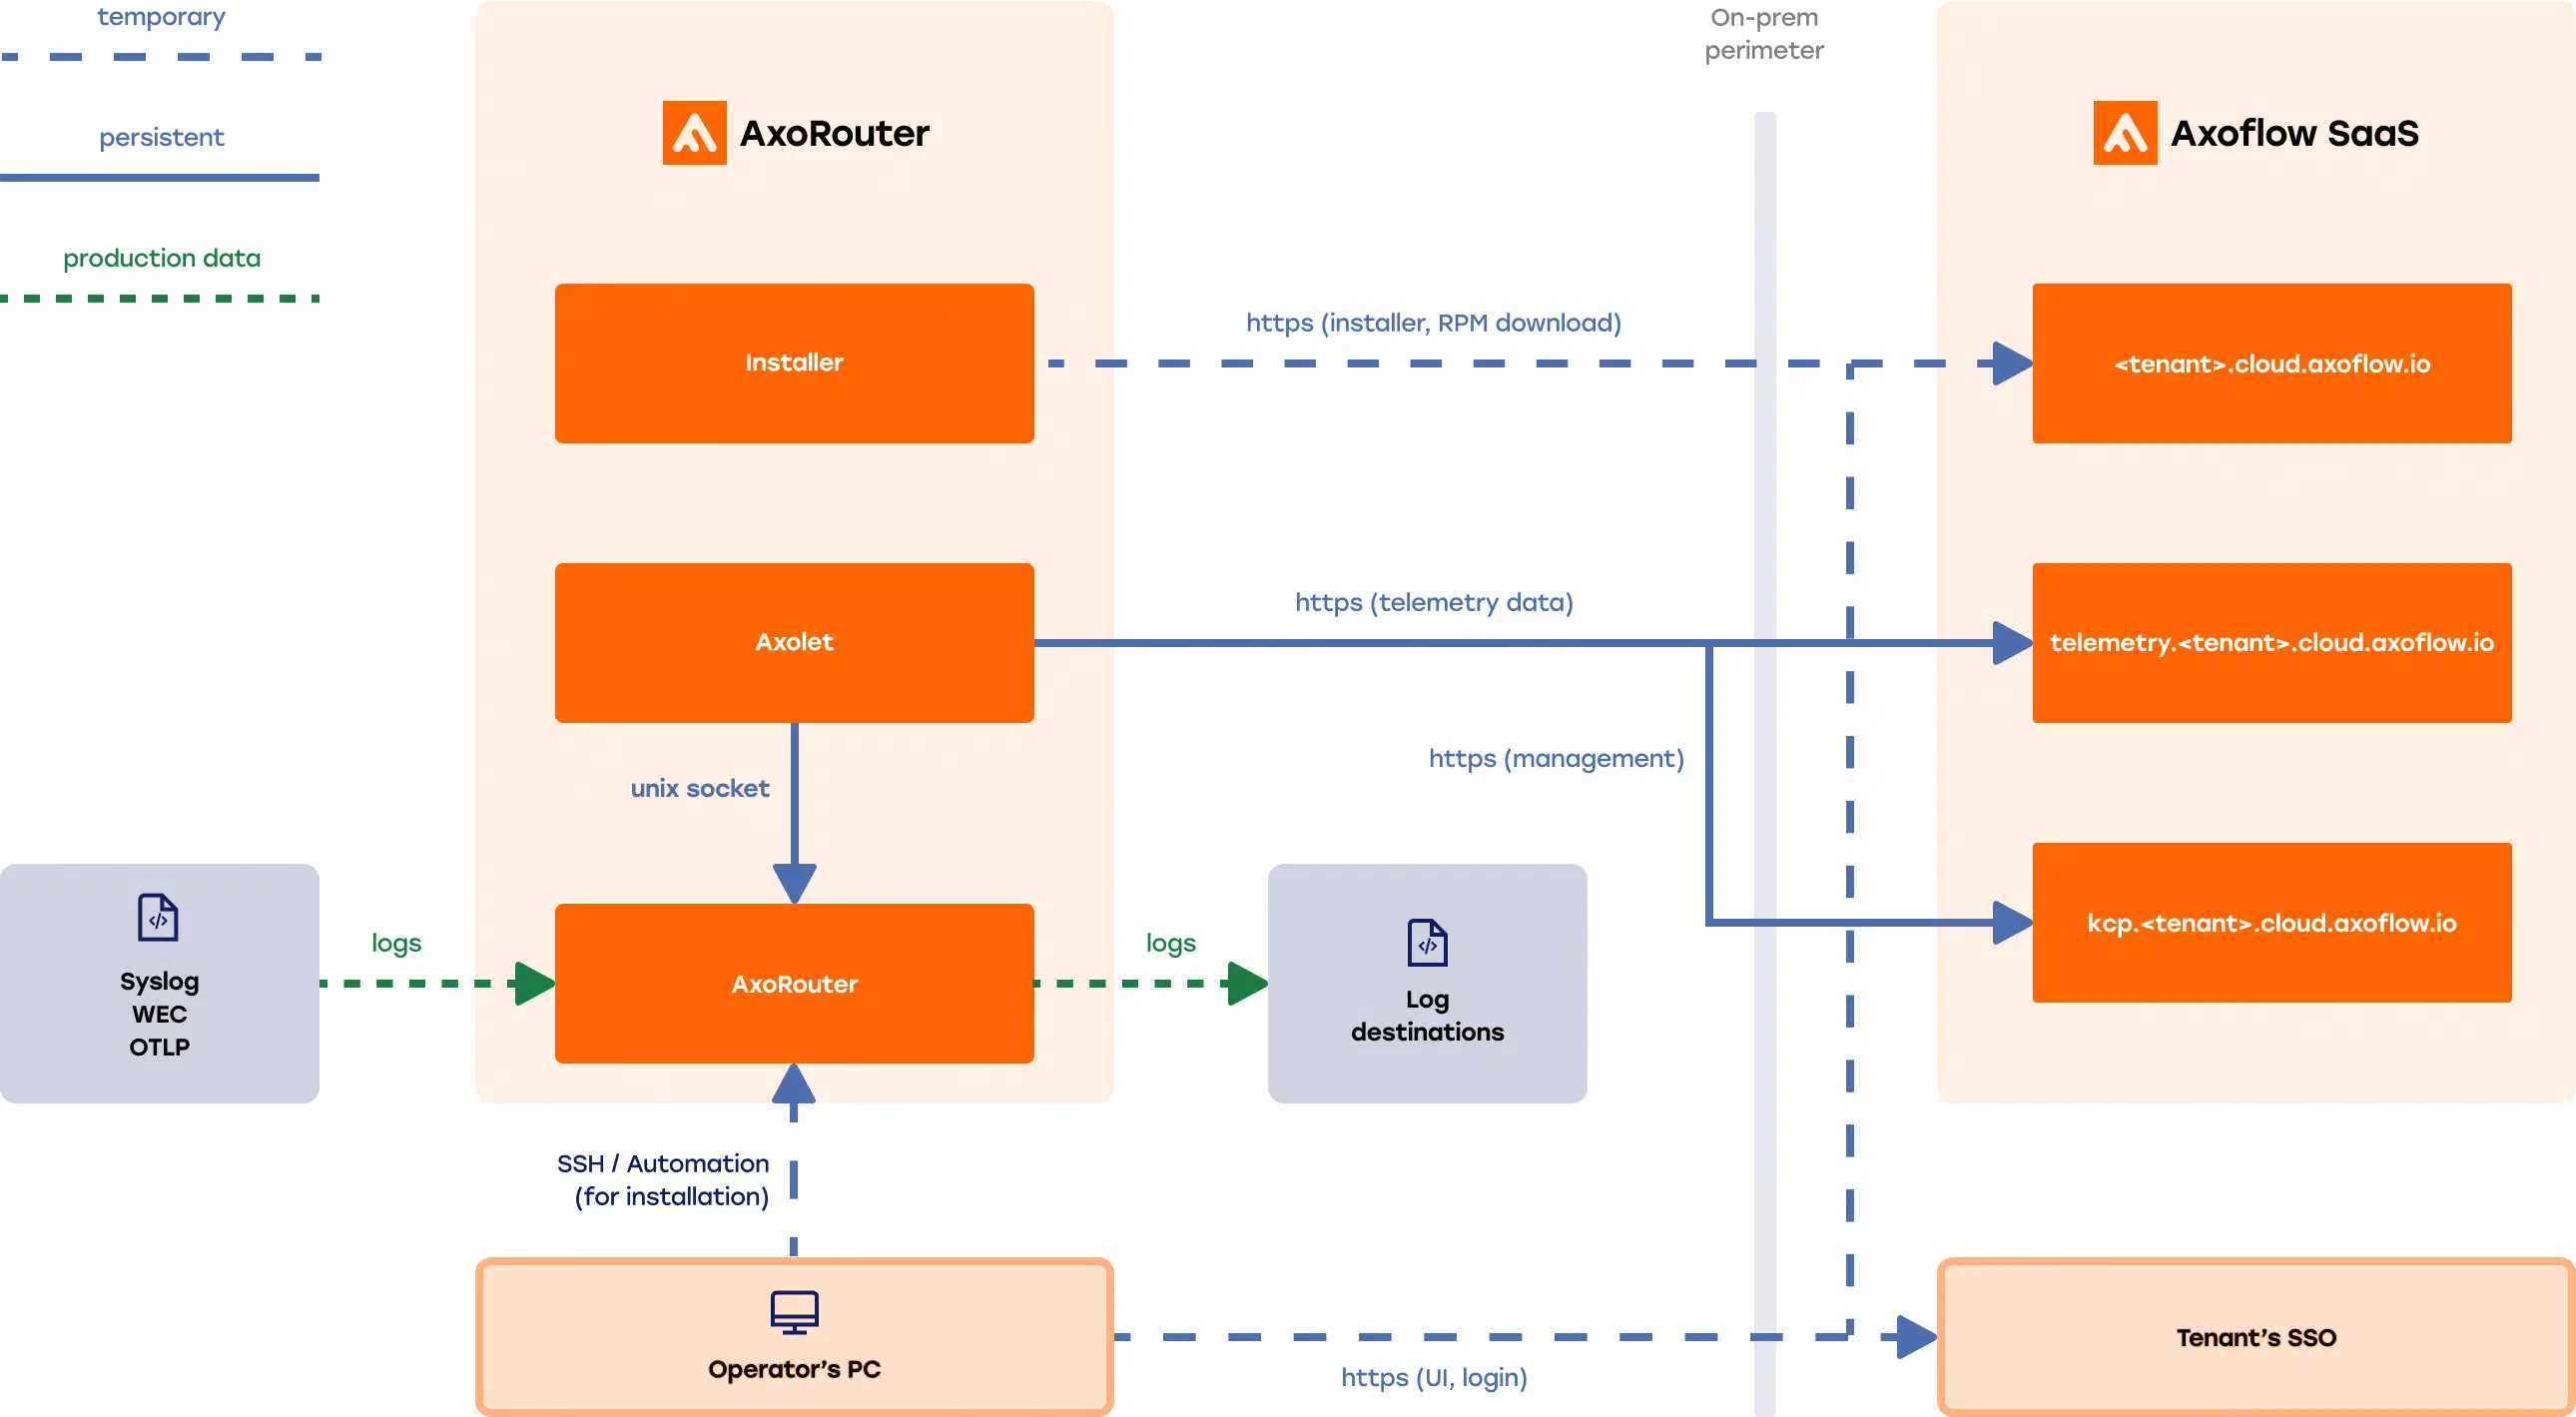
When using AxoConsole SaaS:
<your-tenant-id>.cloud.axoflow.io: HTTPS traffic on TCP port 443, needed to download the binaries for Axoflow software (like Axolet and AxoRouter).
kcp.<your-tenant-id>.cloud.axoflow.io: HTTPS (mutual TLS) traffic on TCP port 443 for management traffic.
telemetry.<your-tenant-id>.cloud.axoflow.io: HTTPS (mutual TLS) traffic on TCP port 443, where Axolet sends the metrics of the host.
us-docker.pkg.dev: HTTPS traffic on TCP port 443, but only if you’re forcing the installation script to pull the container images from the public repository. The Axolet and AxoRouter for Linux installation scripts download the images directly from AxoConsole.
When using an on-premise AxoConsole:
The following domains should point to AxoConsole IP address to access Axoflow from your desktop and AxoRouter hosts:
your-host.your-domain: The main domain of your AxoConsole deployment.
idp.your-host.your-domain: A subdomain for the identity provider.
kcp.your-host.your-domain: A subdomain for management traffic.
telemetry.your-host.your-domain: A subdomain for agent telemetry.
The AxoConsole host must have the following Open Ports:
Port 80 (HTTP)
Port 443 (HTTPS)
When installing Axoflow agent for Windows or Linux:
github.com: HTTPS traffic on TCP port 443, for downloading installer packages.
Log in to the AxoConsole
Verify that you have access to the AxoConsole.
Open https://<your-tenant-id>.axoflow.io/ in your browser.
Log in using Google Authentication.
Deploy an AxoRouter instance
Deploy an AxoRouter instance that will route, curate, and enrich your log data.
Note
Note that AxoRouter and Axoflow agent collects detailed, real-time metrics about the data-flows – giving you observability over the health of the security data pipeline and its components. Your security data remains in your self-managed cloud or in your on-prem instance where your sources, destinations, Axoflow agents, and AxoRouters are running, only metrics are forwarded to AxoConsole.
Deploy AxoRouter on Linux. For other platforms, see AxoRouter.
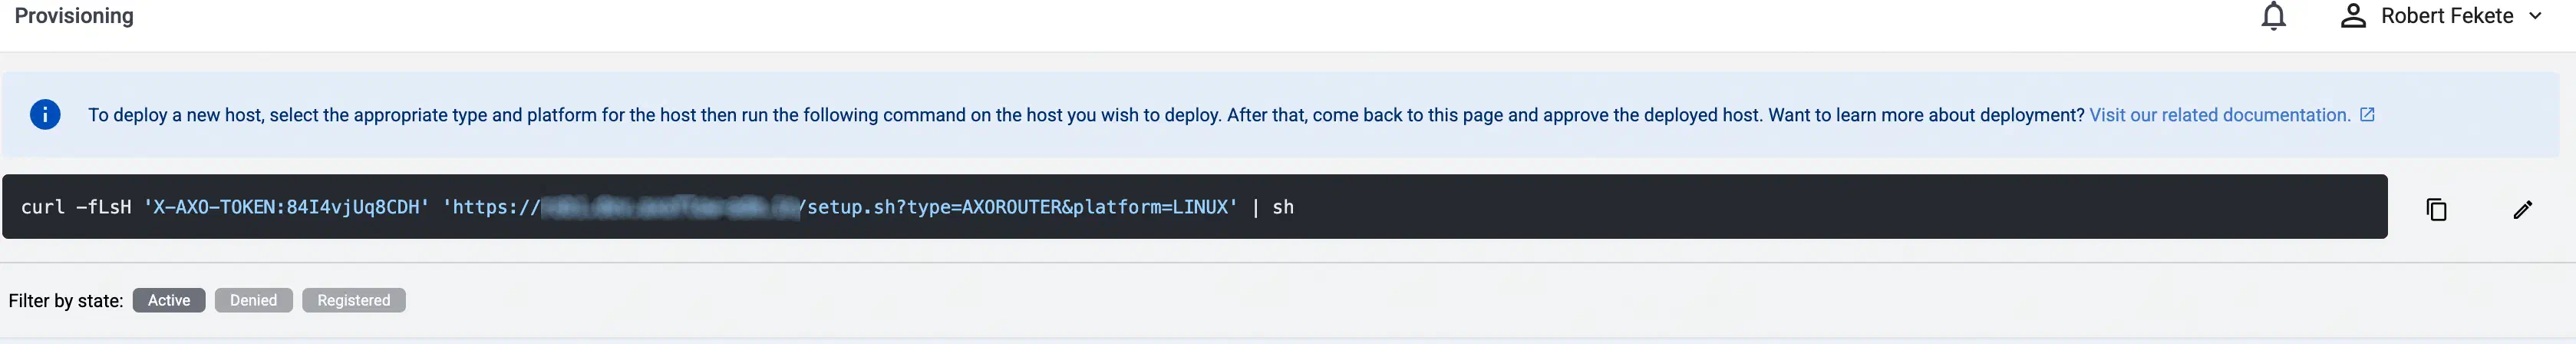
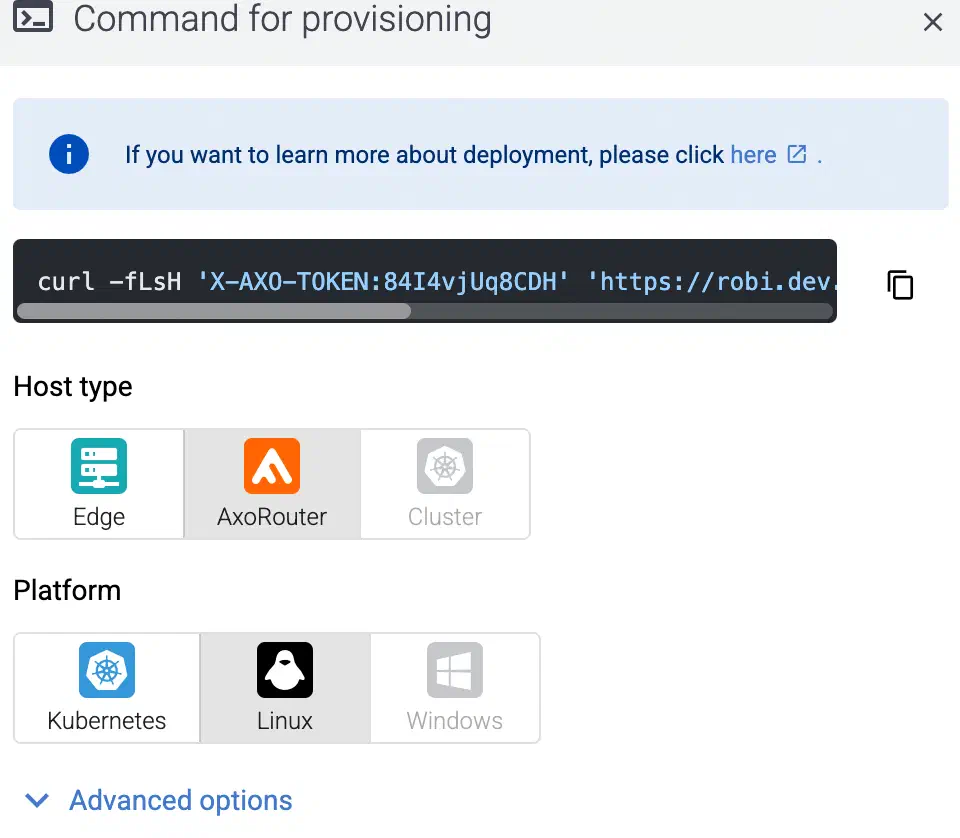
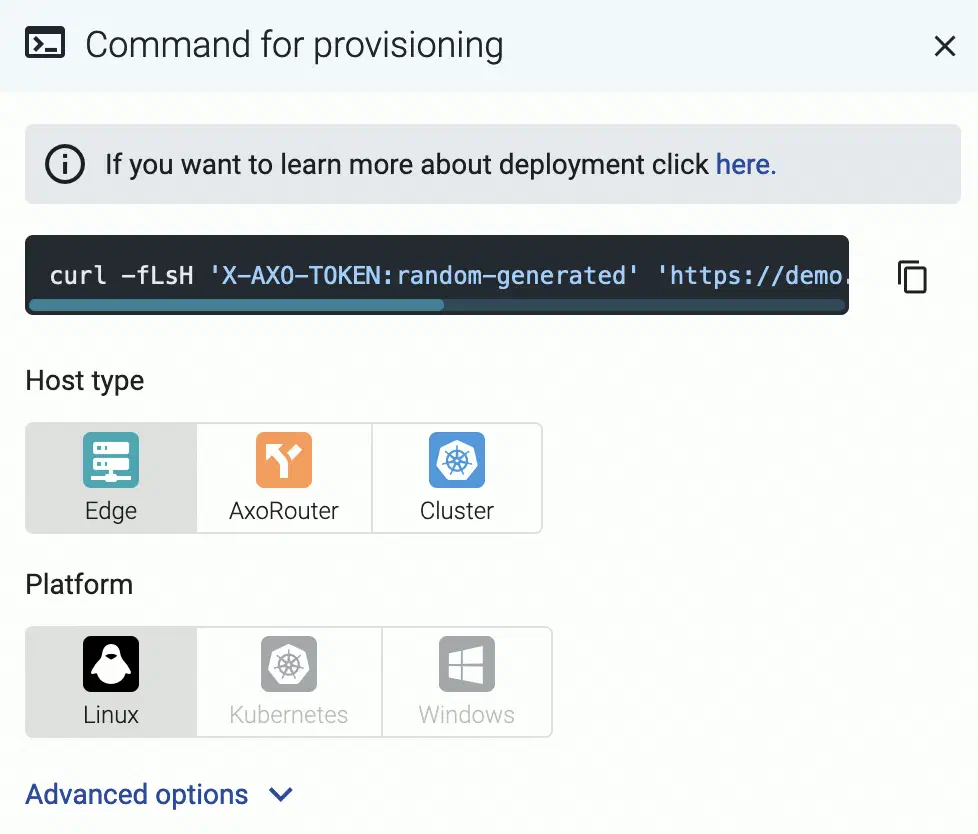
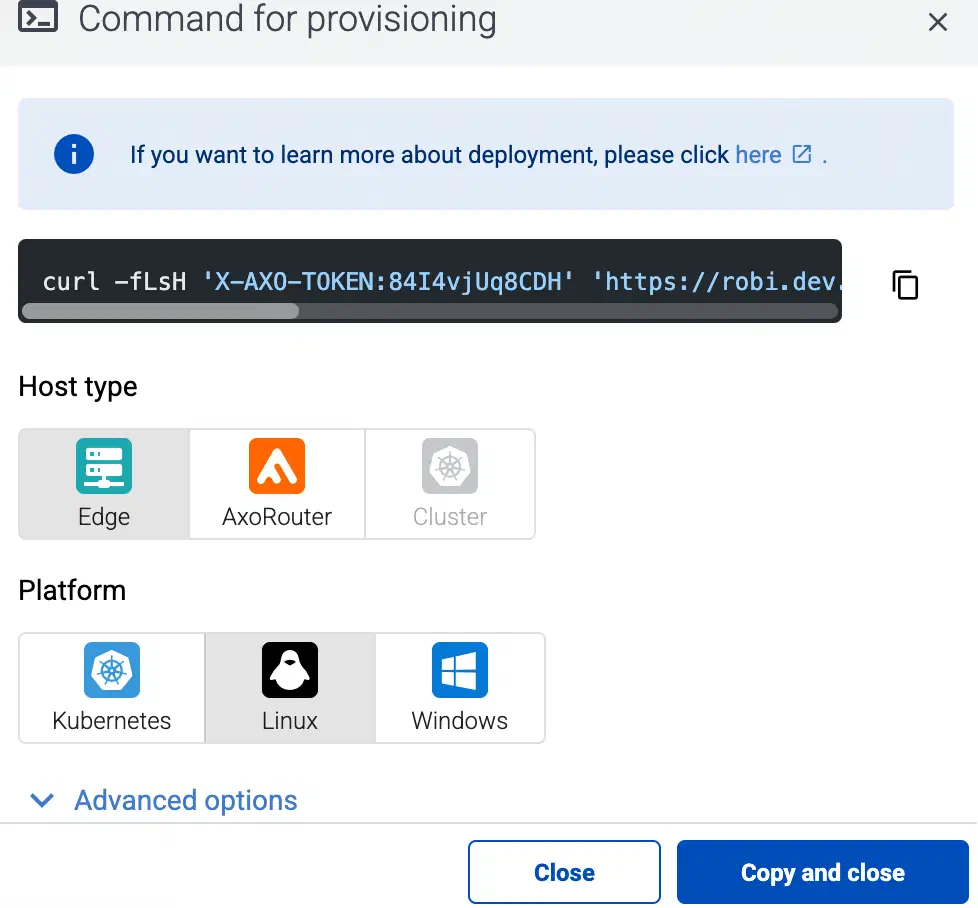
Select Routers > Add Router.
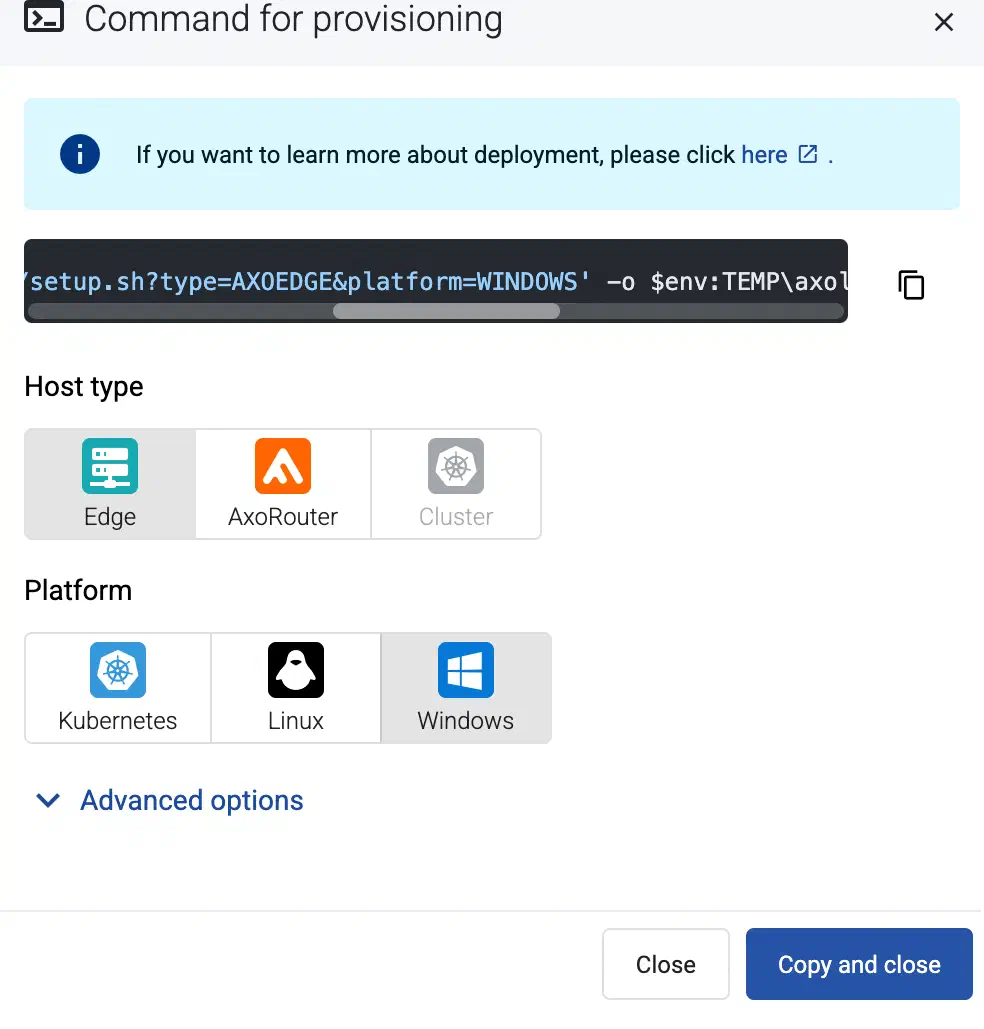
Select the platform (Linux). The one-liner installation command is displayed.
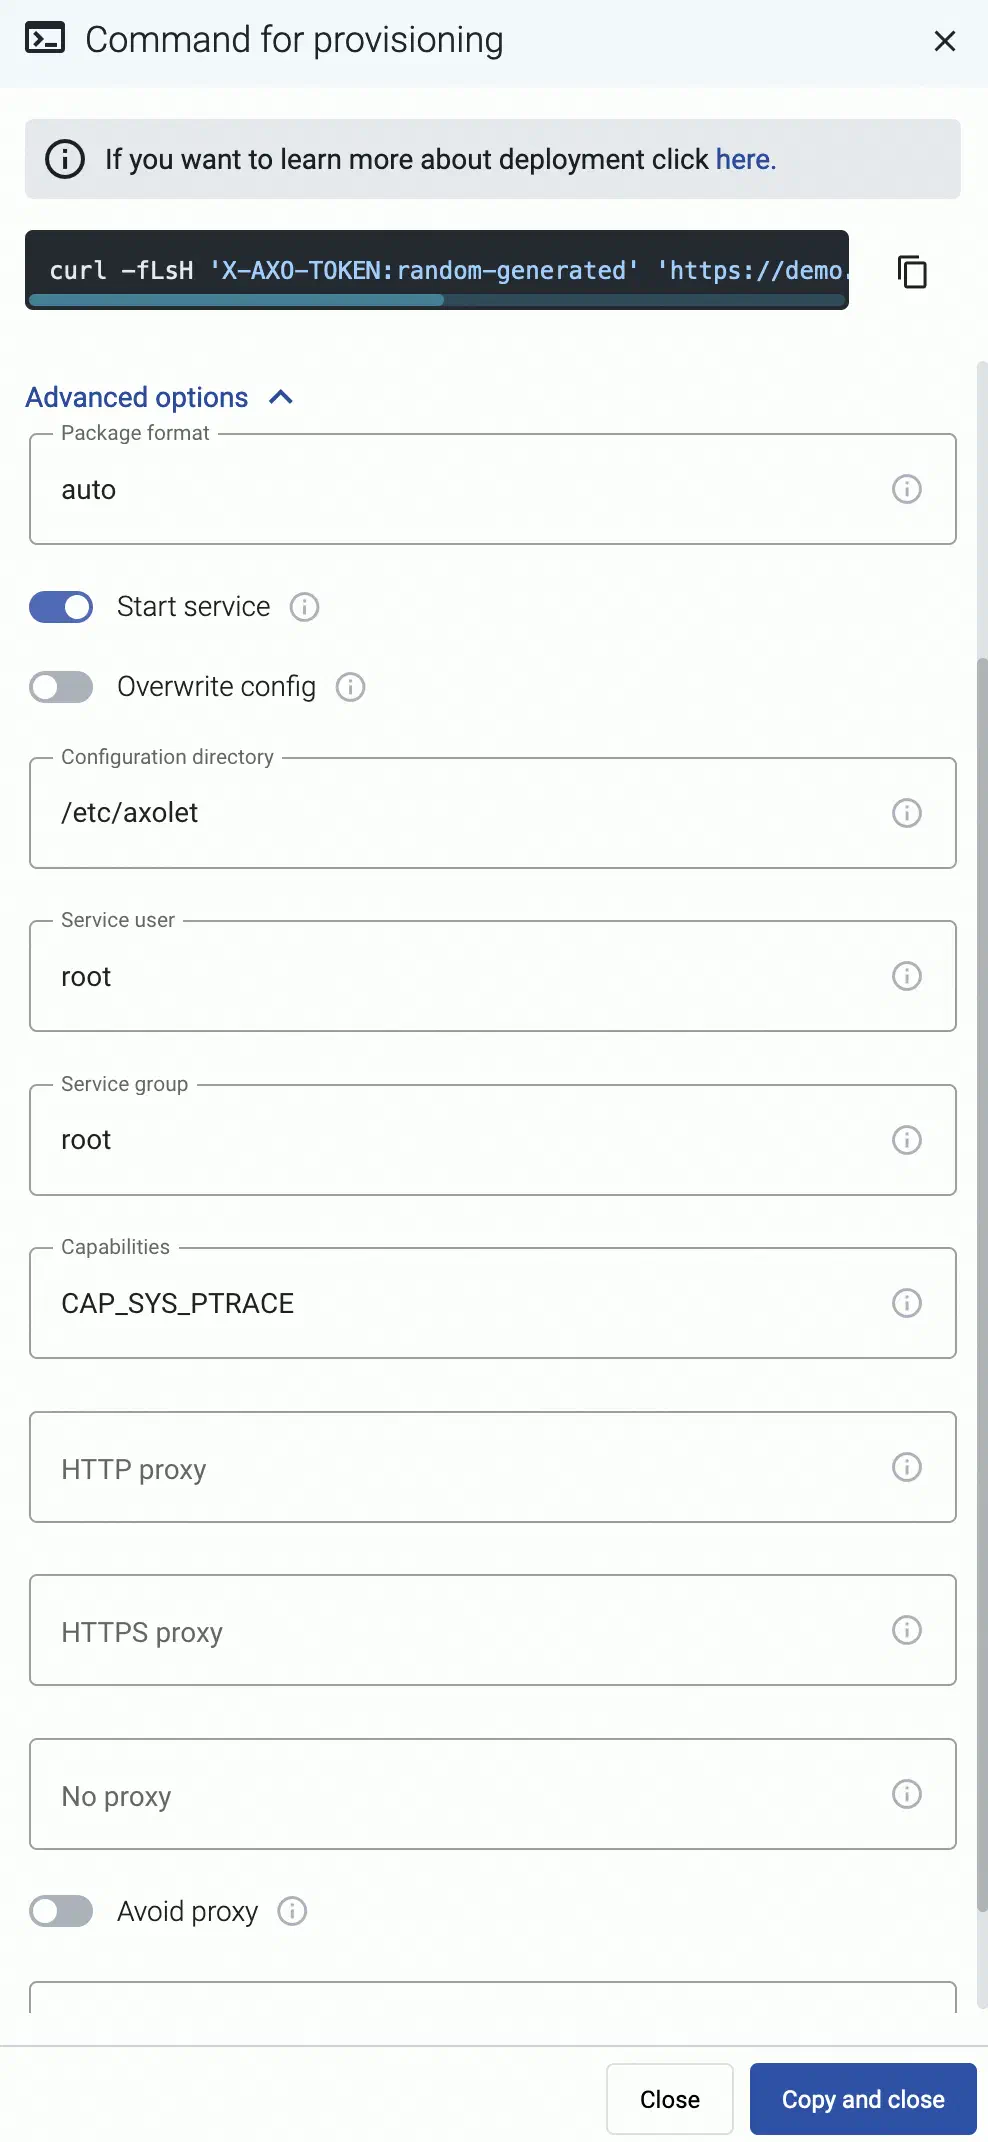
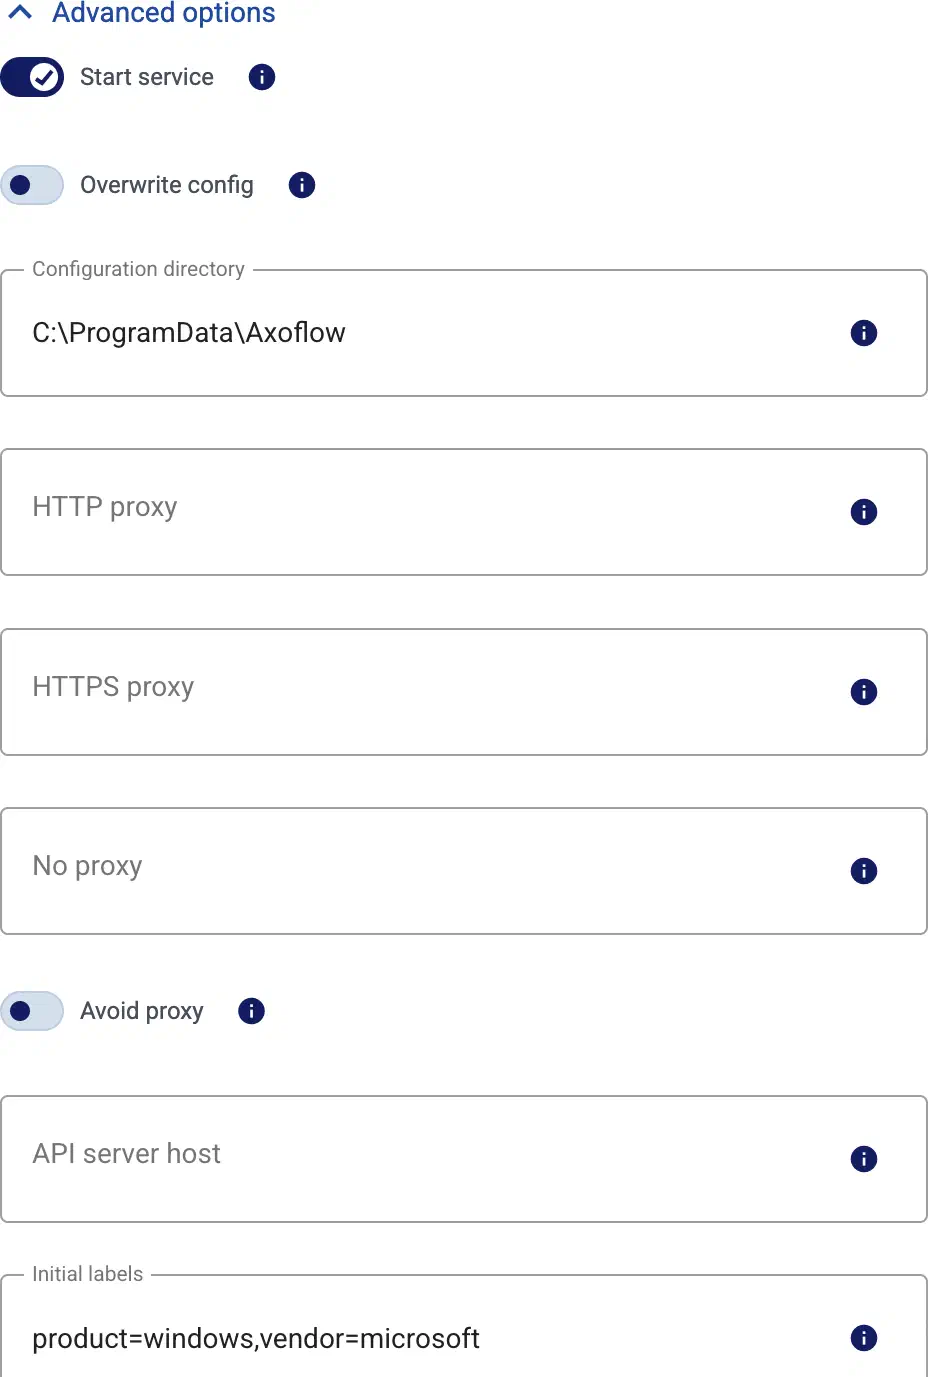
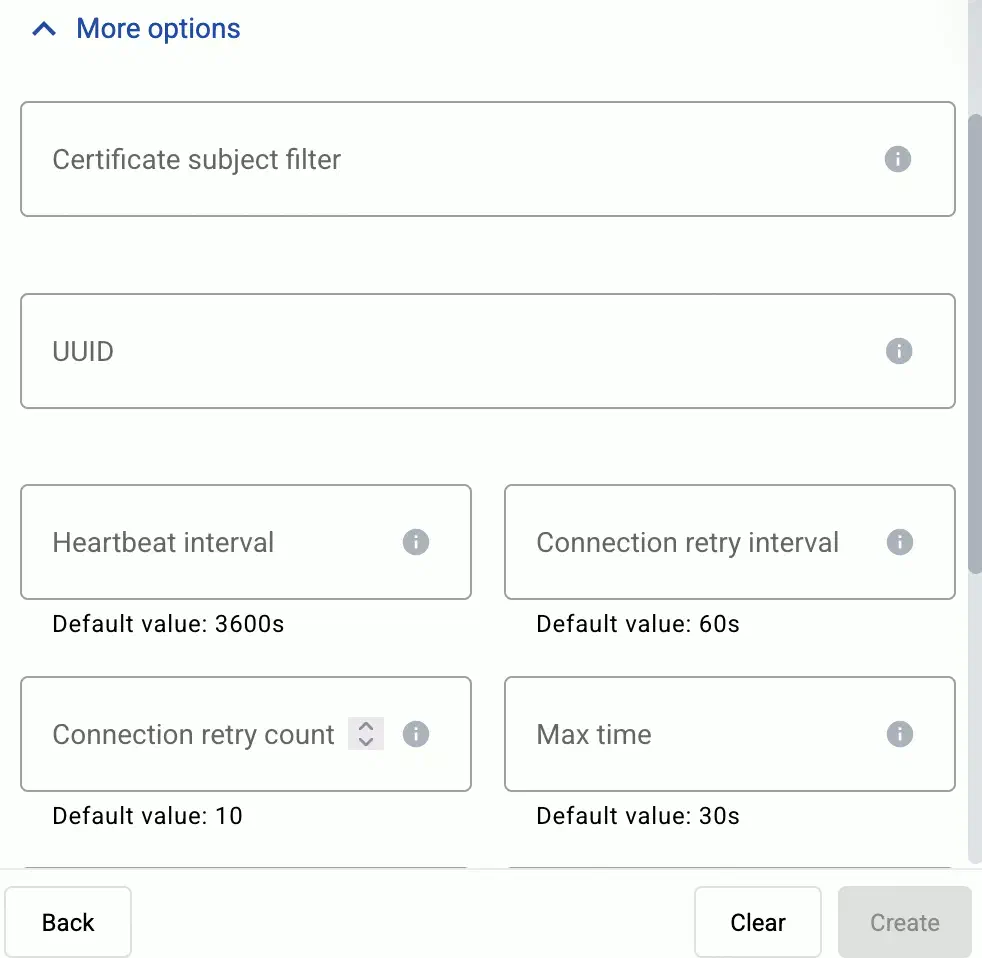
(Optional) If you don’t want to store any logs locally on AxoRouter, disable AxoStore, select Advanced options, scroll down, and deselect Enable AxoStore.
(Optional)
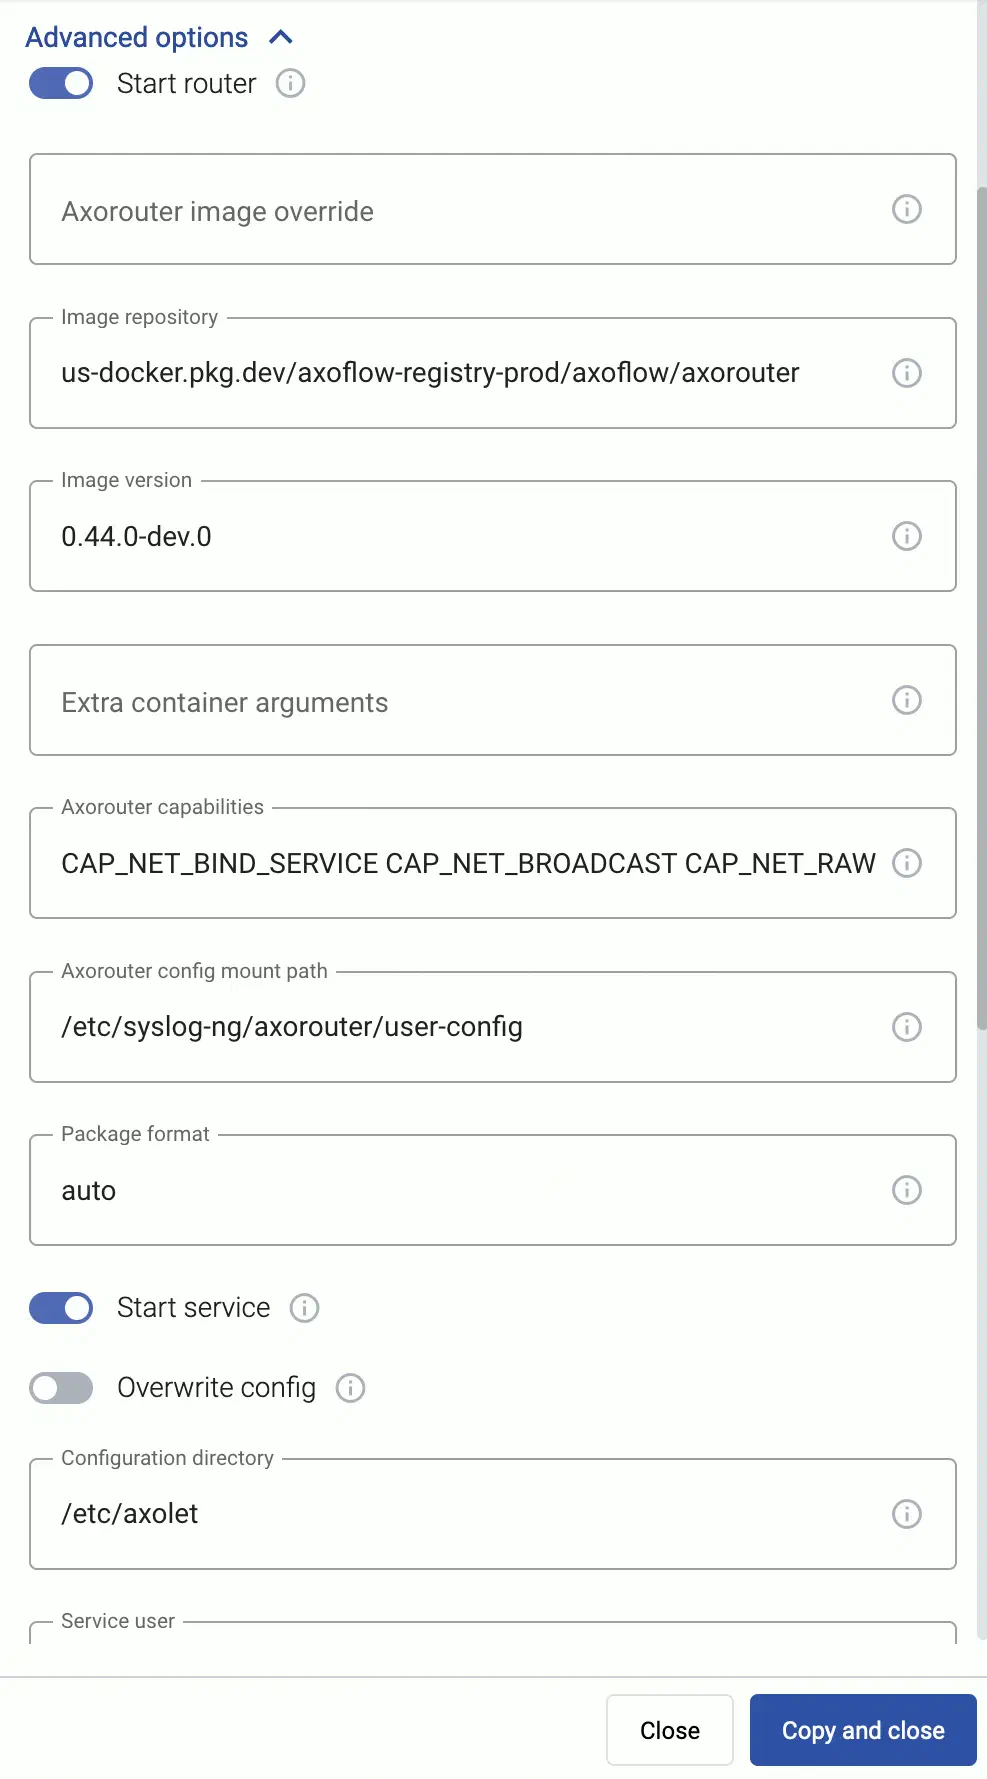
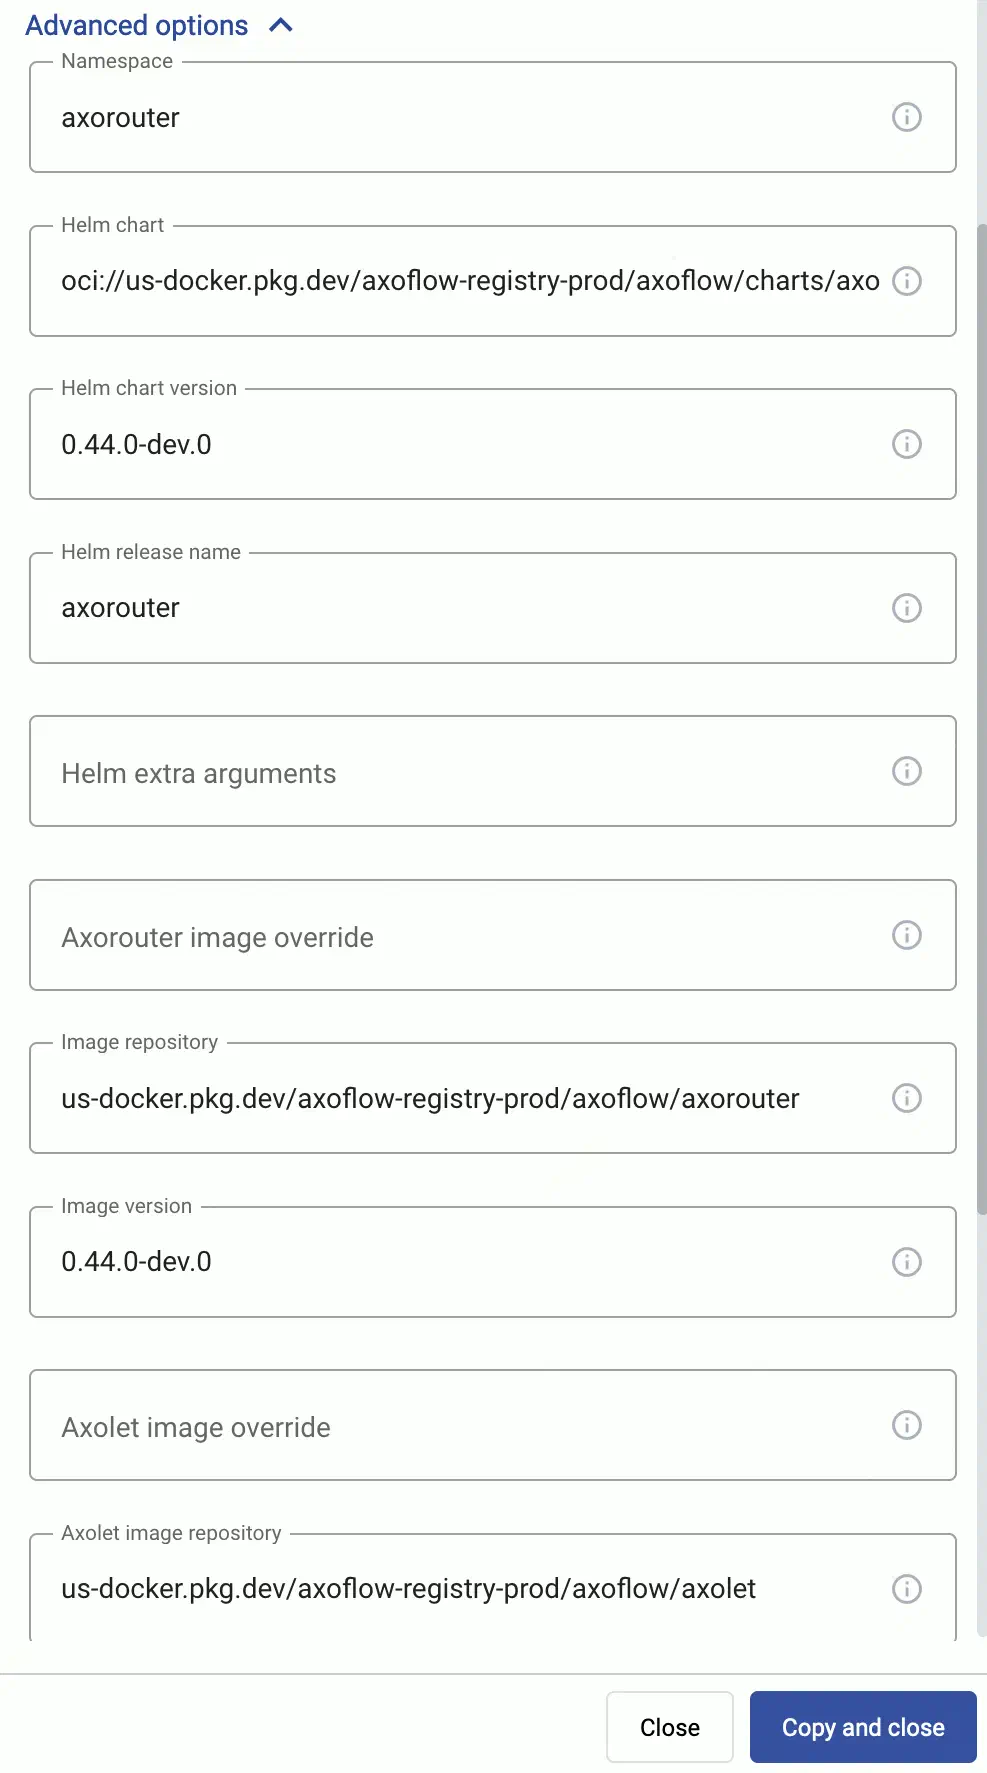
If needed, set the Advanced options (for example, proxy settings, or External image pull in air-gapped environments) to modify the installation parameters. Usually, you don’t have to use advanced options unless the Axoflow support team instructs you to do so.
Open a terminal on the host where you want to install AxoRouter.
Run the one-liner, then follow the on-screen instructions.
Note
Running the provisioning command with sudo would mask environment variables of the calling shell. Either start the whole procedure from a root shell, or let the install script call sudo when it needs to. In other words: don’t add the sudo command to the provisioning command.
Example output:
Do you want to install AxoRouter now? [Y]% Total % Received % Xferd Average Speed Time Time Time Current
Dload Upload Total Spent Left Speed
1005480100548000320760 --:--:-- --:--:-- --:--:-- 33414Selecting previously unselected package axorouter.
(Reading database ... 17697 files and directories currently installed.)Preparing to unpack axorouter.deb ...
Unpacking axorouter (0.66.0) ...
Setting up axorouter (0.66.0) ...
Low maximum socket receive buffer size value detected: 7500000 bytes (7.2MB).
Do you you want to permanently set the net.core.rmem_max sysctl value to 33554432 bytes (32MB) on this system? [Y]net.core.rmem_max =33554432Created symlink '/etc/systemd/system/multi-user.target.wants/axostore.path' → '/etc/systemd/system/axostore.path'.
Created symlink '/etc/systemd/system/multi-user.target.wants/axorouter-wec.path' → '/etc/systemd/system/axorouter-wec.path'.
% Total % Received % Xferd Average Speed Time Time Time Current
Dload Upload Total Spent Left Speed
100 42.9M 100 42.9M 00 28.1M 0 0:00:01 0:00:01 --:--:-- 28.2M
Selecting previously unselected package axolet.
(Reading database ... 17707 files and directories currently installed.)Preparing to unpack axolet.deb ...
Unpacking axolet (0.66.0) ...
Setting up axolet (0.66.0) ...
Created symlink '/etc/systemd/system/multi-user.target.wants/axolet.service' → '/usr/lib/systemd/system/axolet.service'.
Now continue with onboarding the host on the Axoflow web UI.
Note
If you get the following errors:
AXOROUTER_FUSE envvar is not set. It may mean that the /usr/local/bin/setup-axorouter script is called without proper configuration.
Failed to configure AxoRouter.
Failed to deploy the AxoRouter.
Set the following (or equivalent) in the sudoers file on the host, and rerun the installation command.
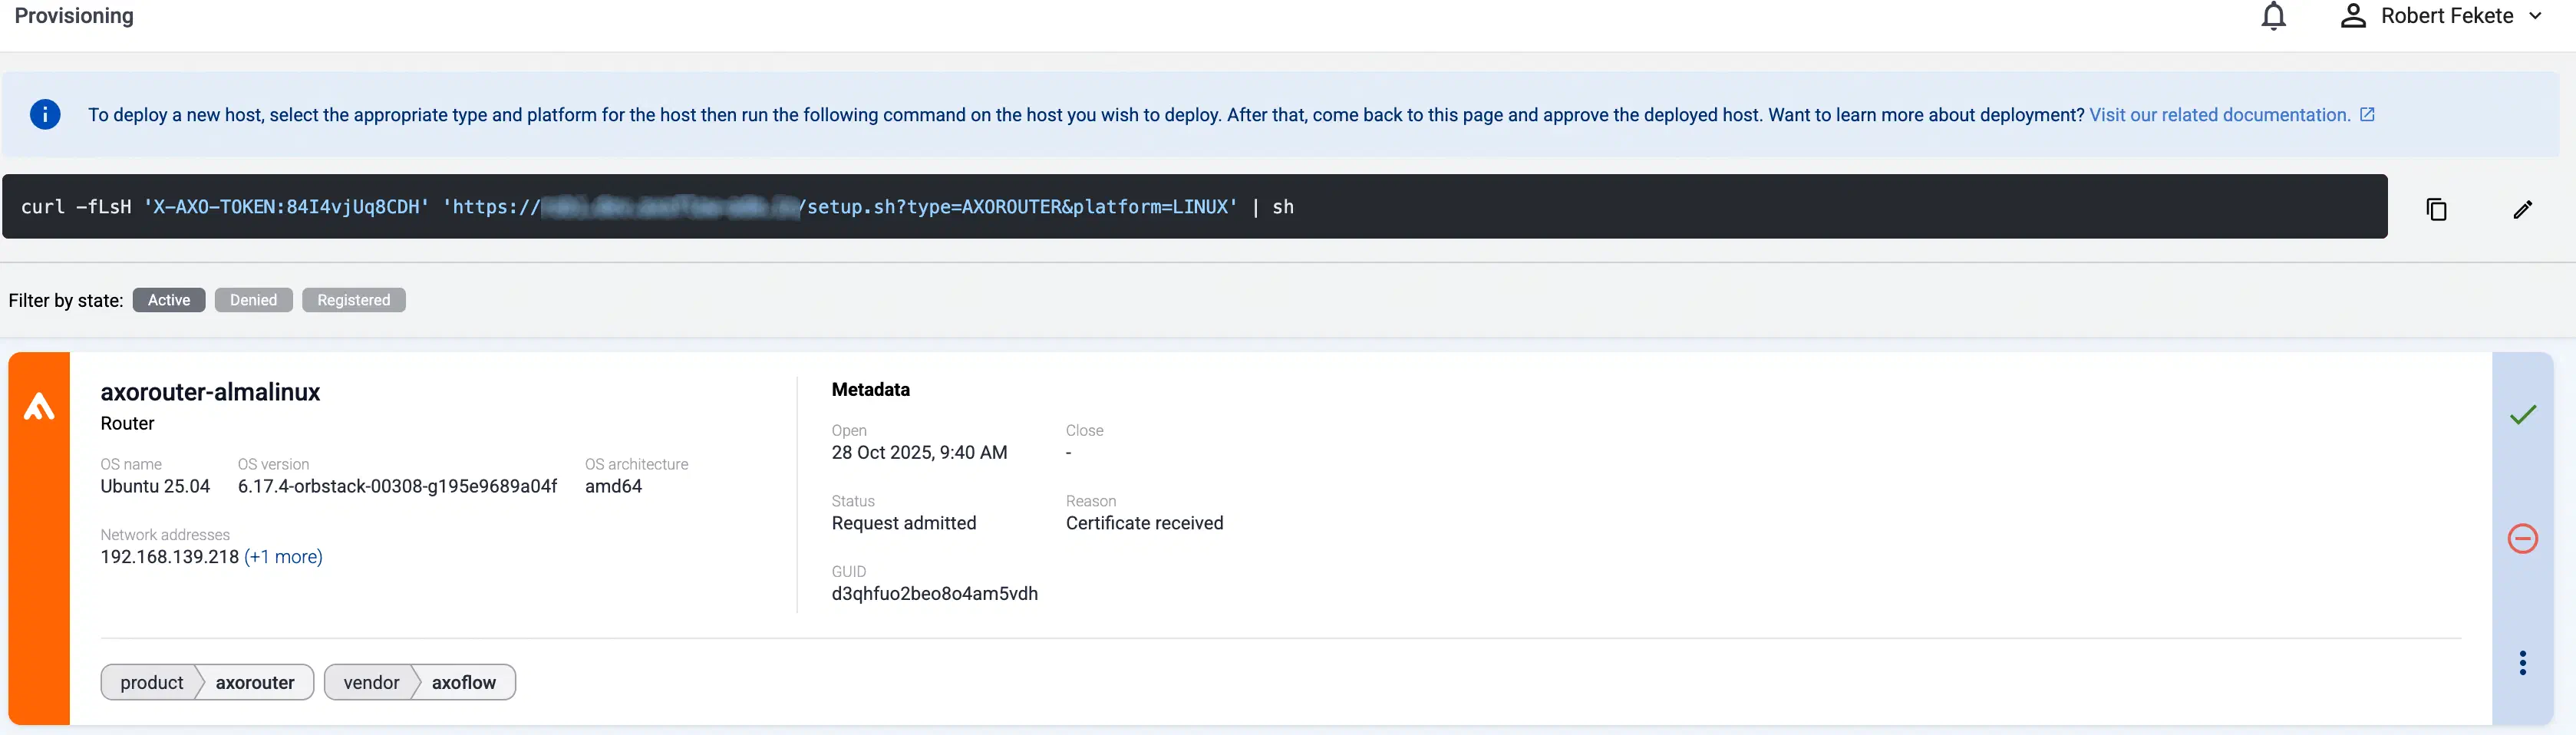
Reload the Provisioning page. There should be a registration request for the new AxoRouter deployment. Select ✓.
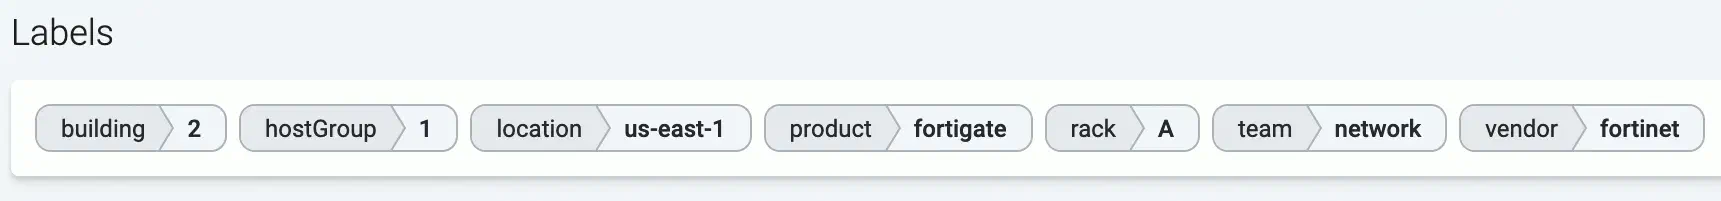
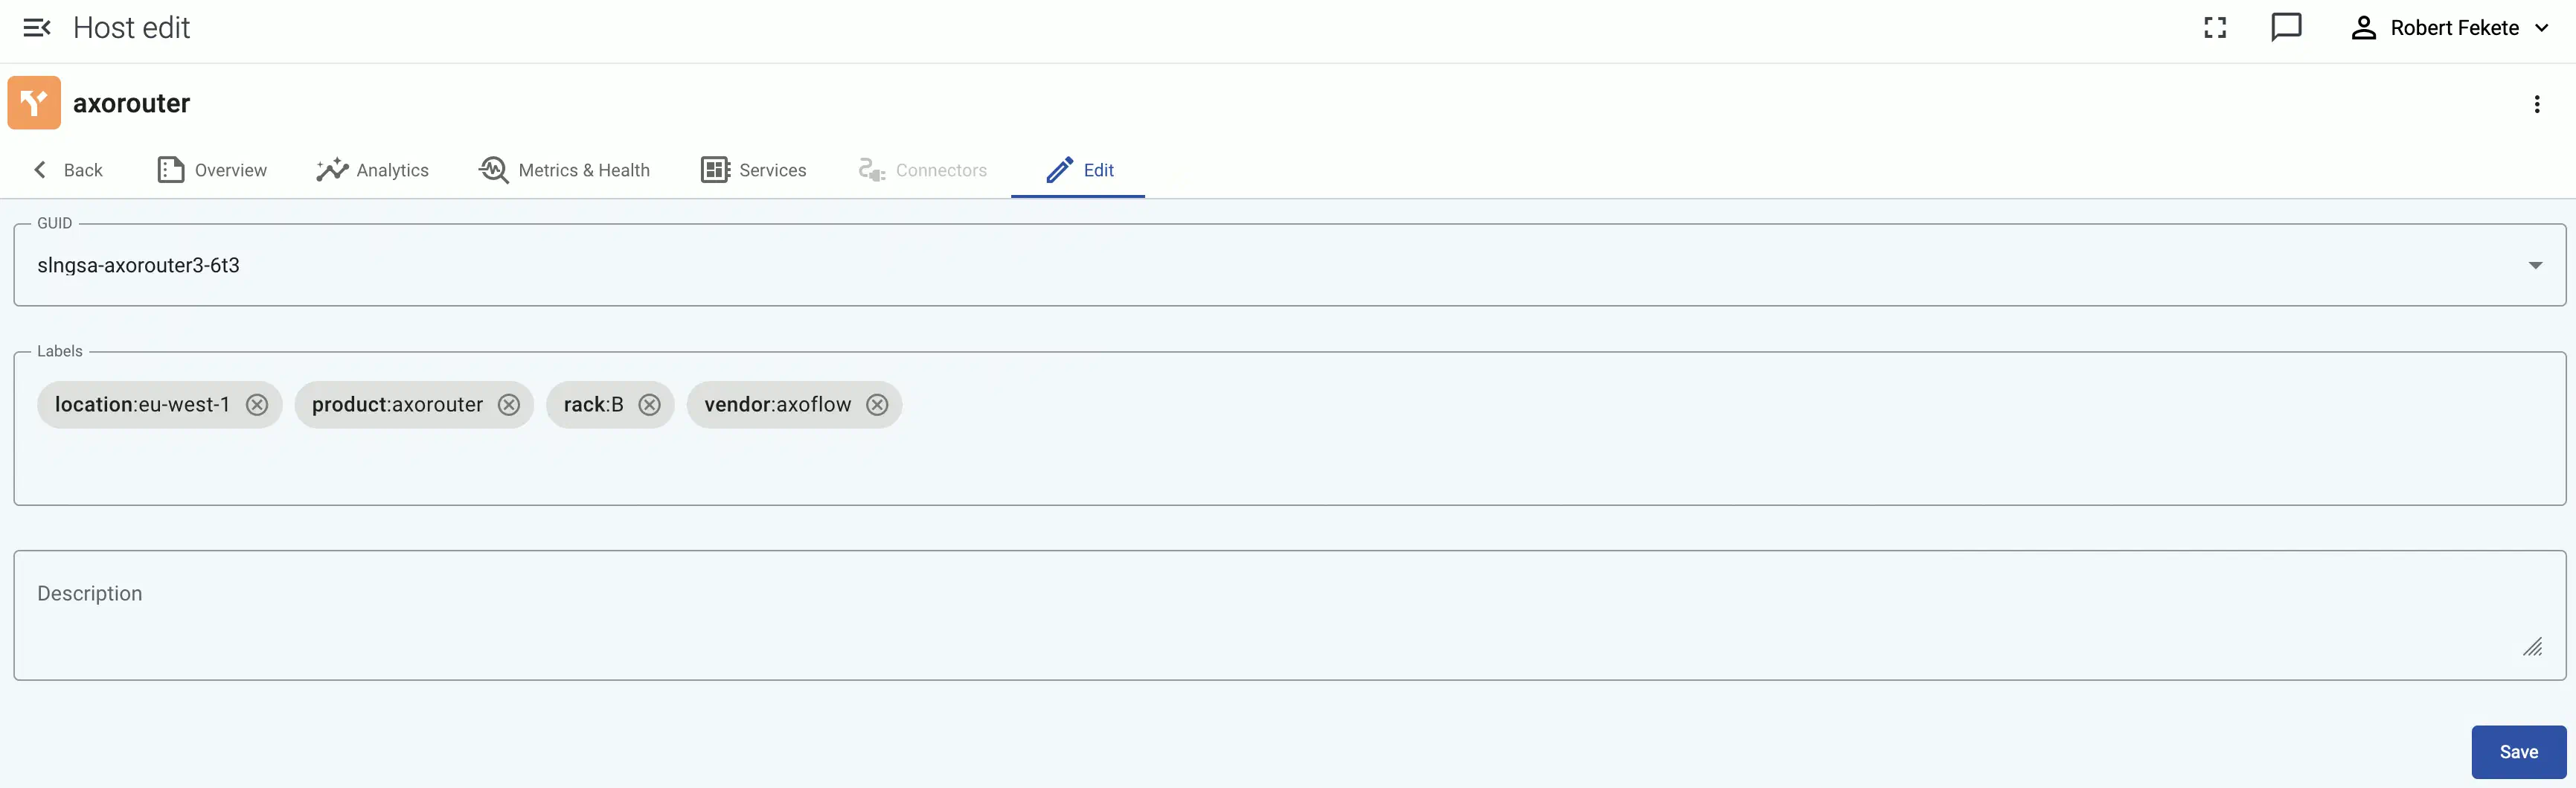
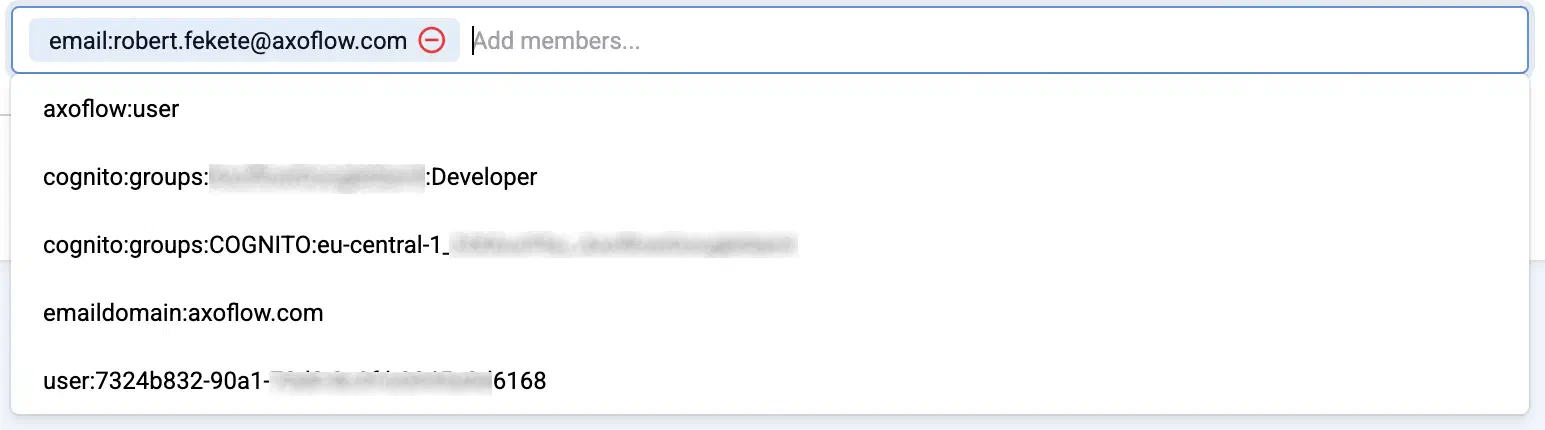
Select Register to register the host. You can add a description and labels (in label:value format) to the host.
If the primary IP address (the first IP address shown in the Network addresses section on the Routers page for each AxoRouter) is not accessible from your edge hosts, set a Network address override (IP address or an FQDN) that’s accessible. Otherwise, data forwarding from edge hosts will fail.
Select the Topology page. The new AxoRouter instance is displayed.
Add a source
Configure a host to send data to AxoRouter.
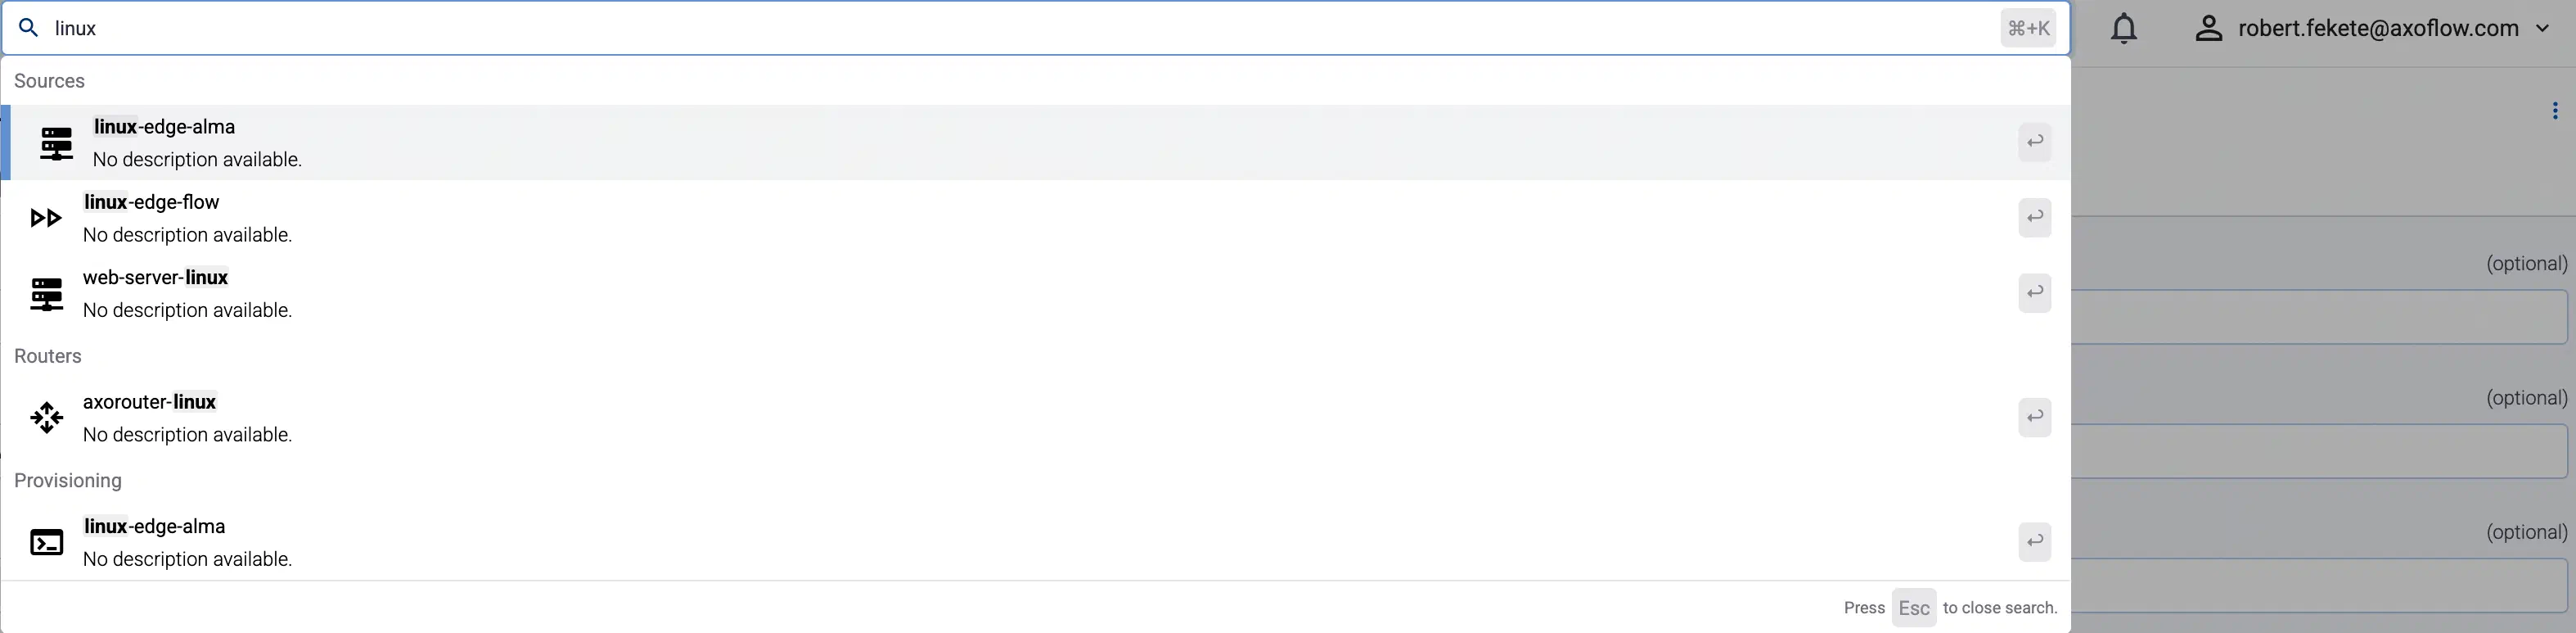
Configure a generic syslog host. For sources that are specifically supported by Axoflow, see Sources.
Log in to your device. You need administrator privileges to perform the configuration.
If needed, enable syslog forwarding on the device.
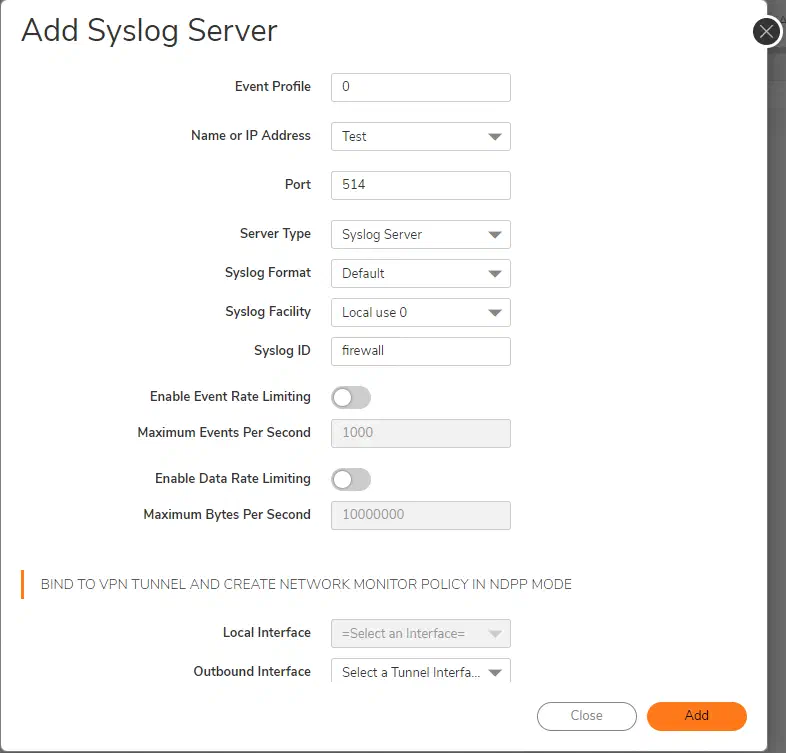
Set AxoRouter as the syslog server. Typically, you can configure the following parameters:
Name or IP Address of the syslog server: Set the address of your AxoRouter.
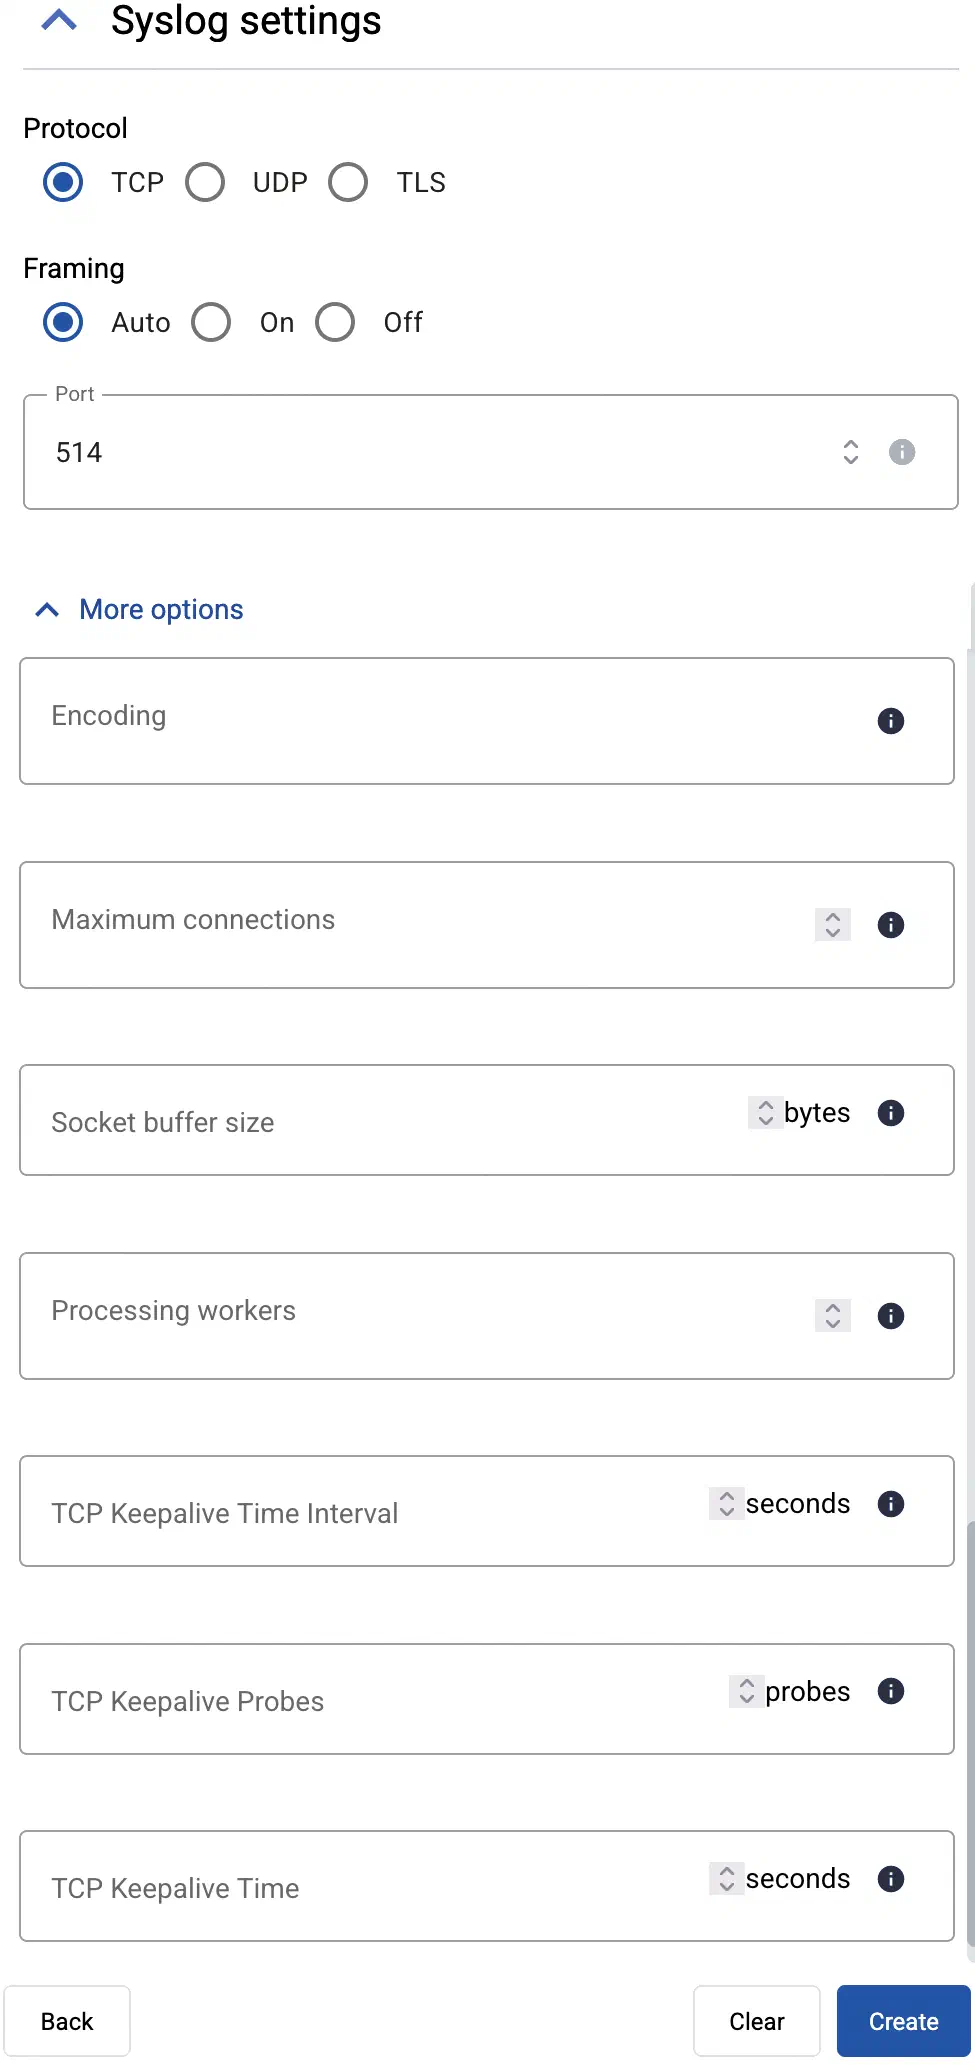
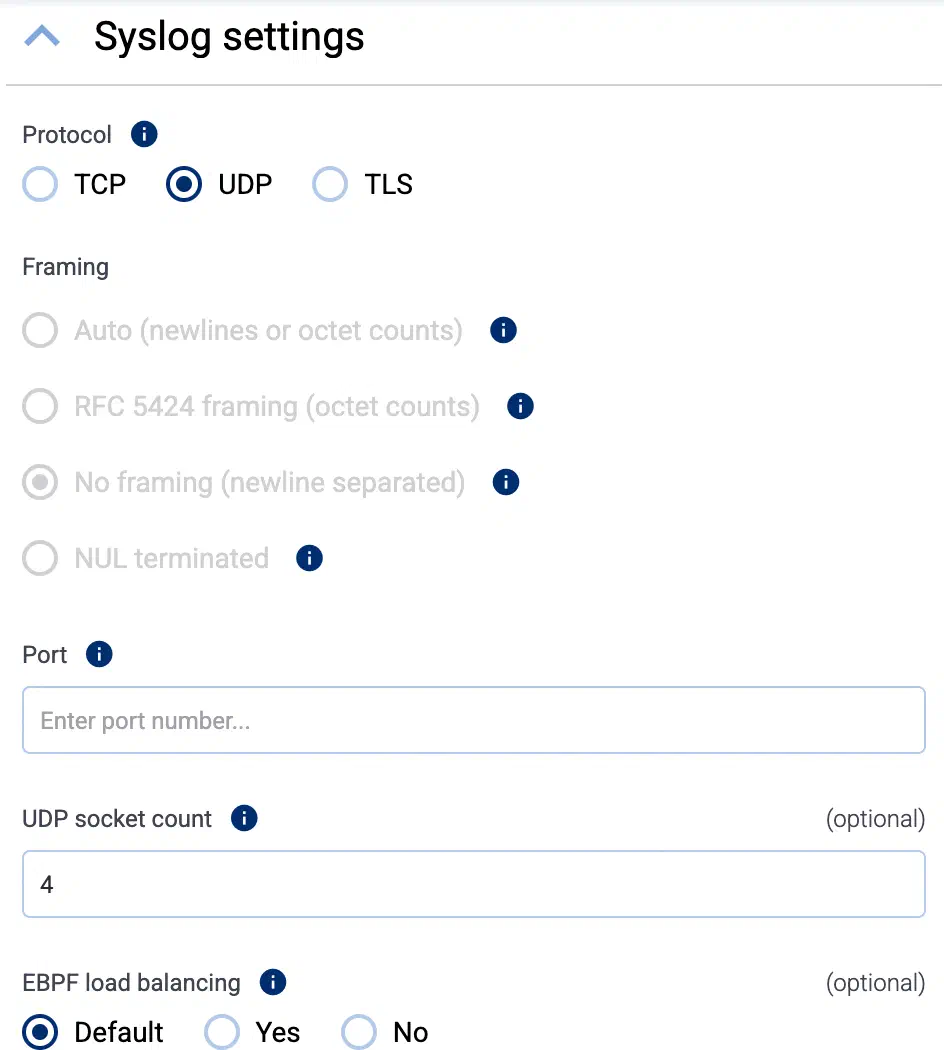
Protocol: If possible, set TCP or TLS.
Note
If you’re sending data over TLS, make sure to configure a TLS-enabled connector rule in Axoflow.
Syslog Format: If possible, set RFC5424 (or equivalent), otherwise leave the default.
Port: Set a port appropriate for the protocol and syslog format you have configured.
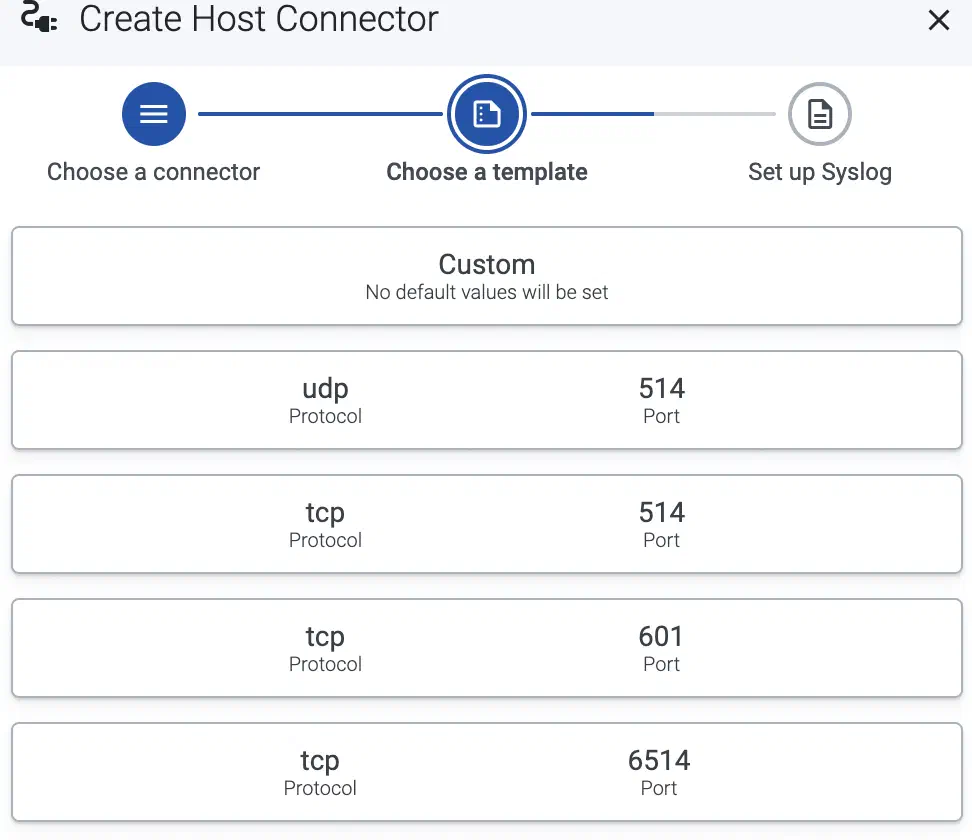
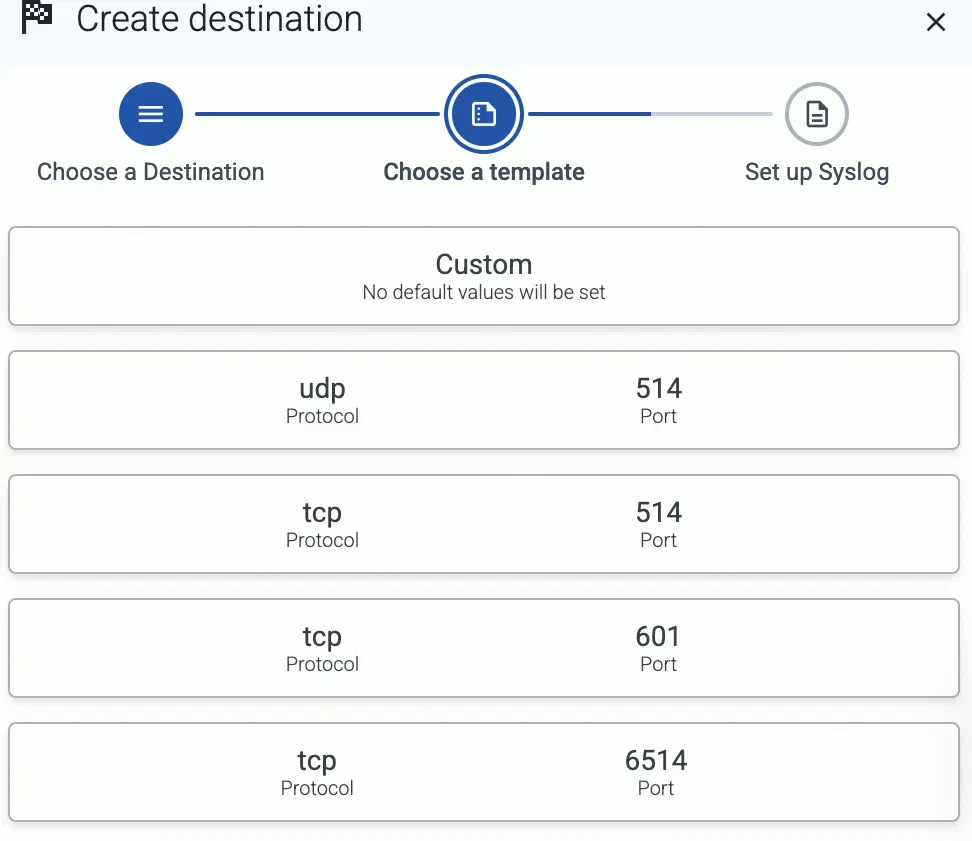
By default, AxoRouter accepts data on the following ports (unless you’ve modified the default connector rules):
514 UDP and TCP for RFC3164 (BSD-syslog) and RFC5424 (IETF-syslog) formatted traffic. AxoRouter automatically recognizes and handles both formats.
601 TCP for RFC5424 (IETF-syslog) and RFC3164 (BSD-syslog) formatted traffic. AxoRouter automatically recognizes and handles both formats.
6514 TCP for TLS-encrypted syslog traffic.
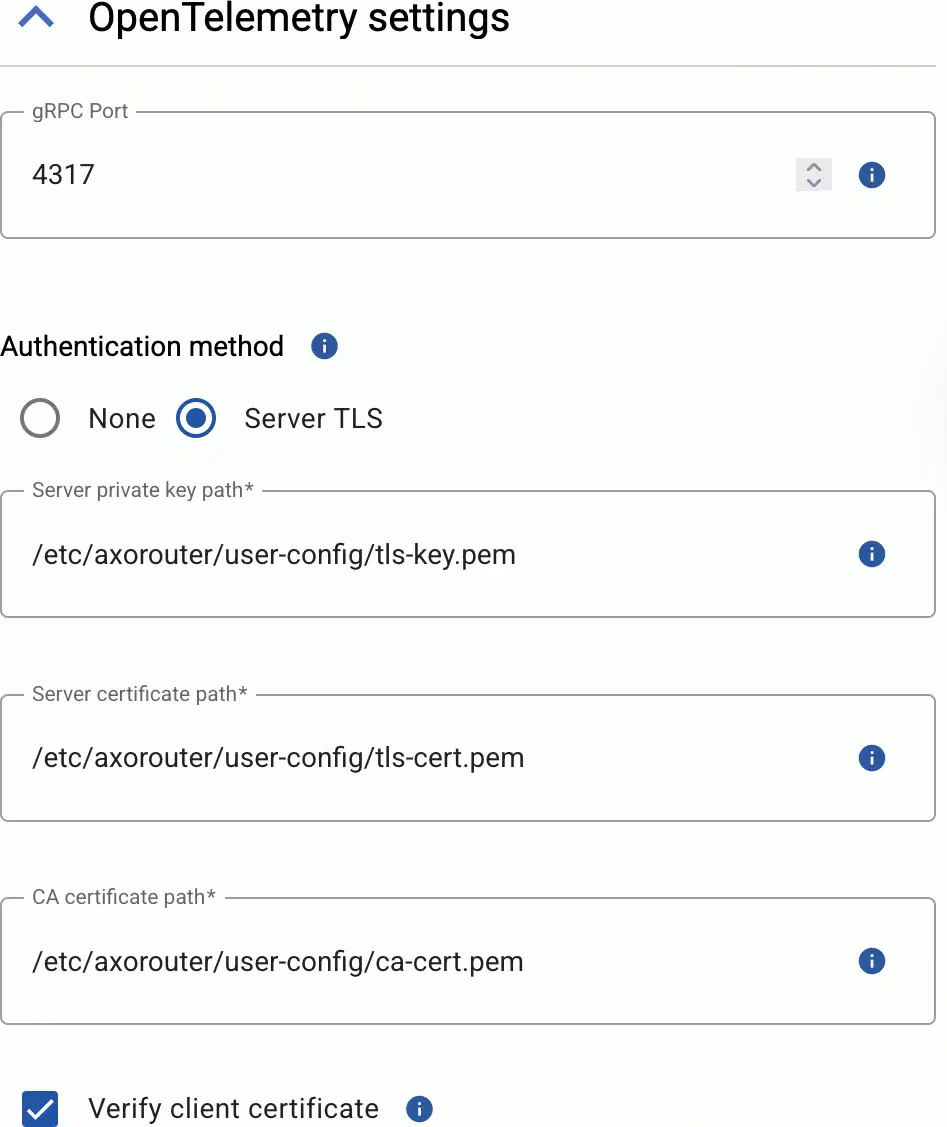
4317 TCP for OpenTelemetry log data.
To receive data on other ports or other protocols, configure other connector rules for the AxoRouter host.
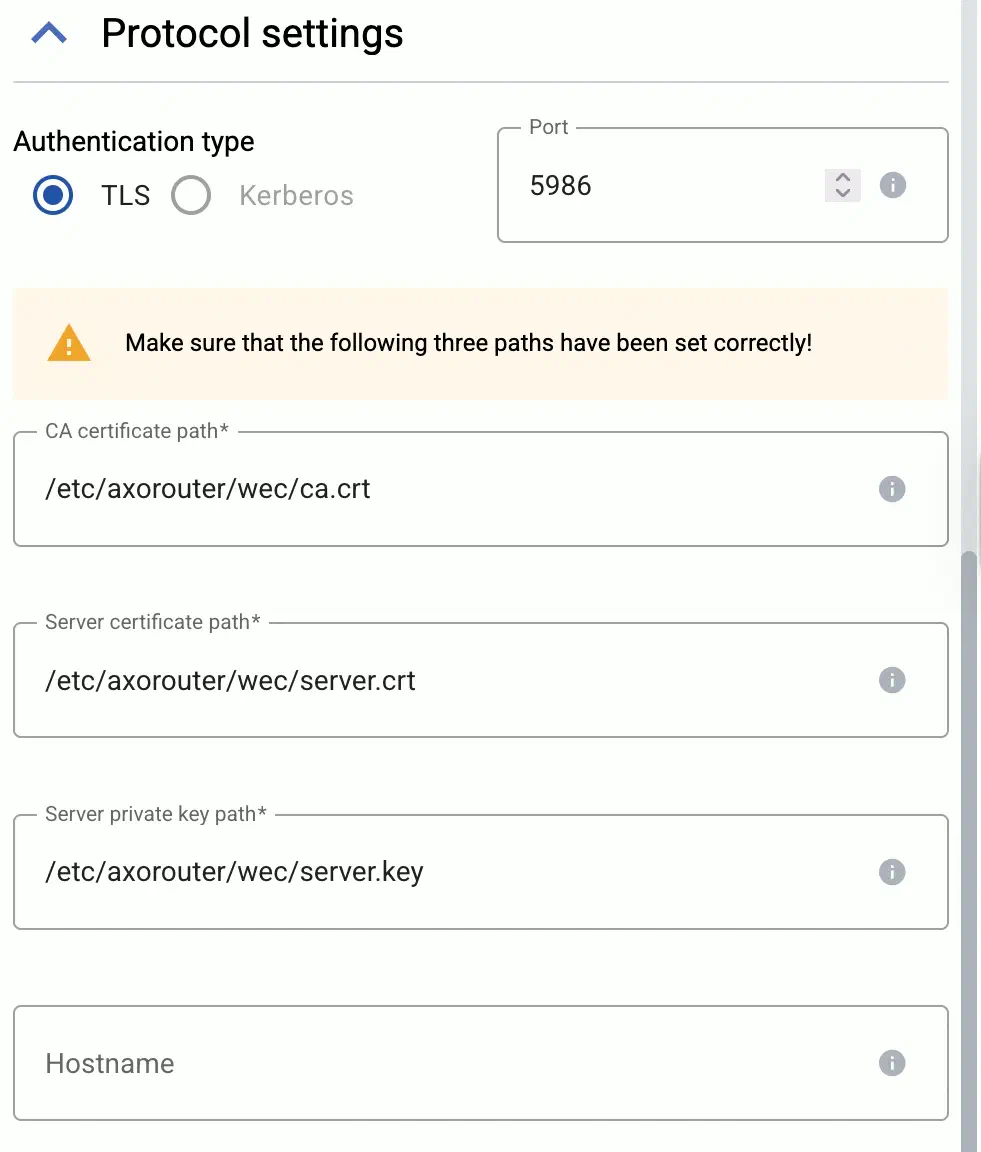
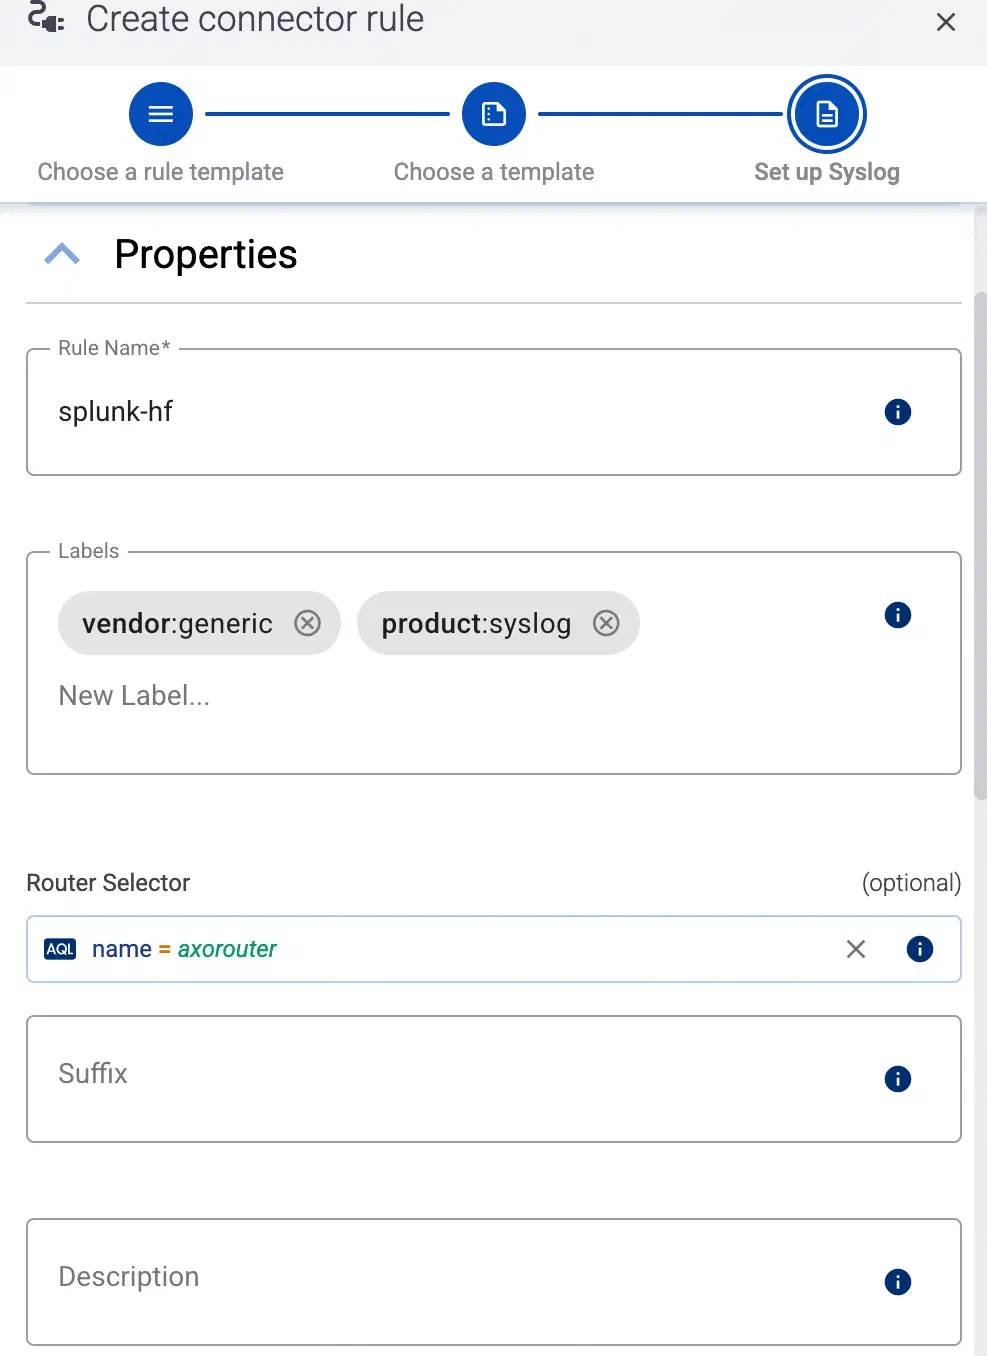
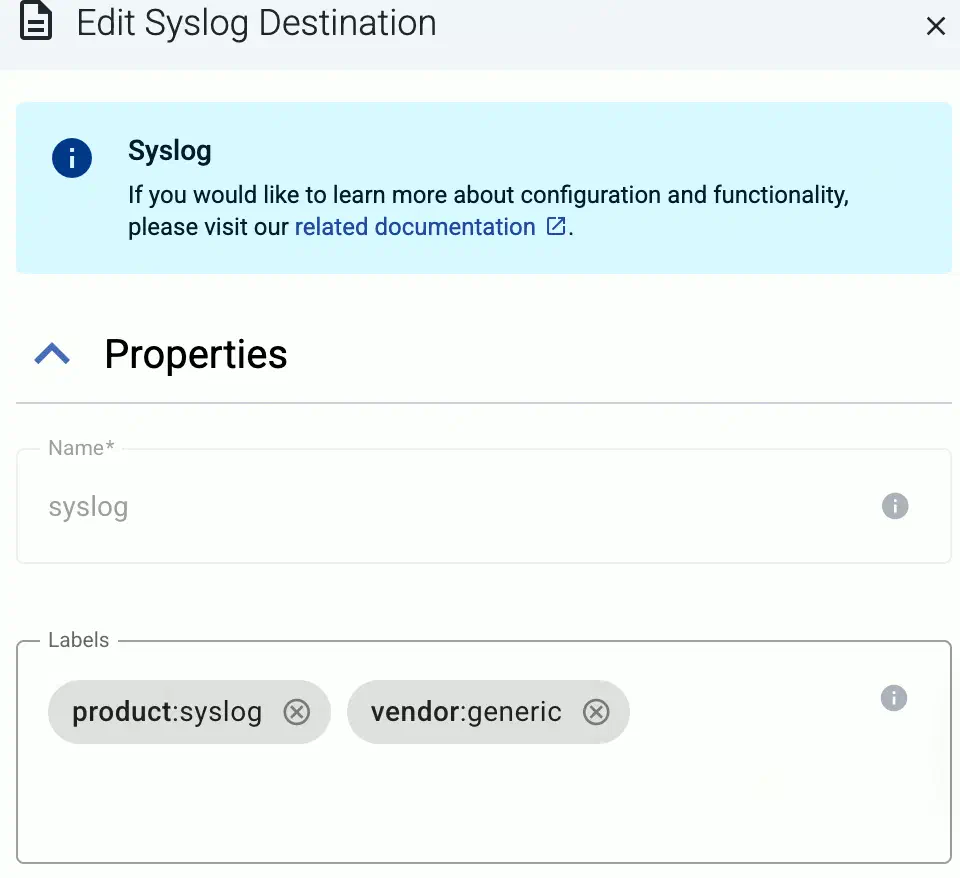
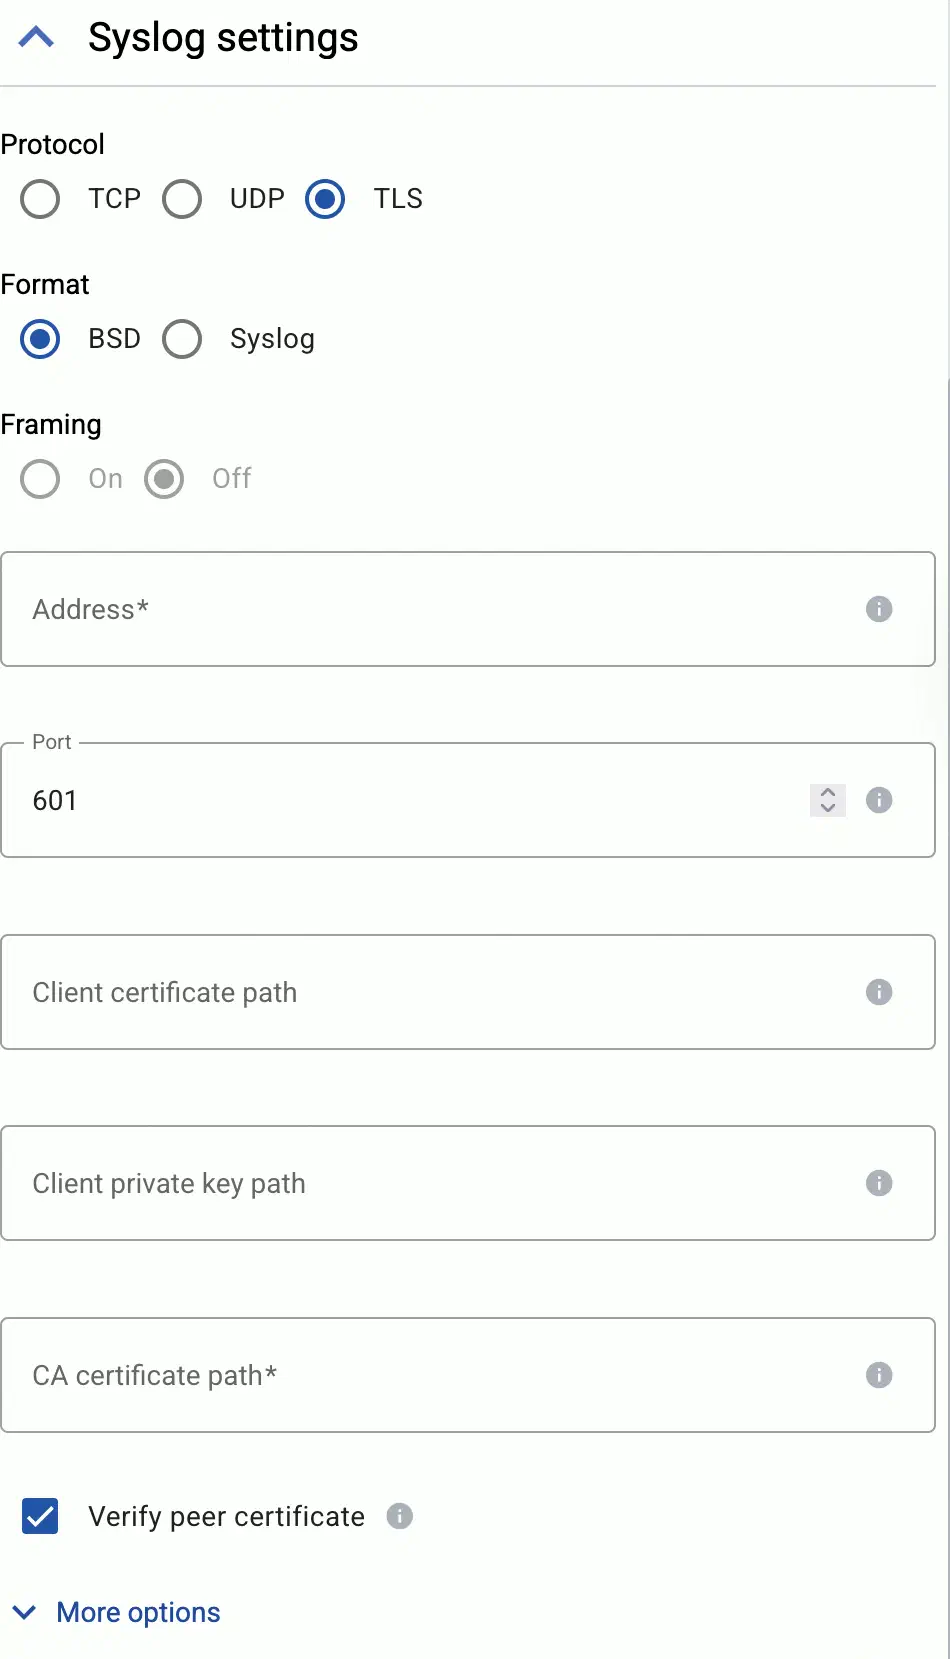
For TLS-encrypted syslog connections, create a new connector rule or edit an existing one, and configure the keys and certificates needed to encrypt the connections. For details, see Syslog.
Note
Make sure to enable the ports you’re using on the firewall of your host.
Add the source to AxoConsole.
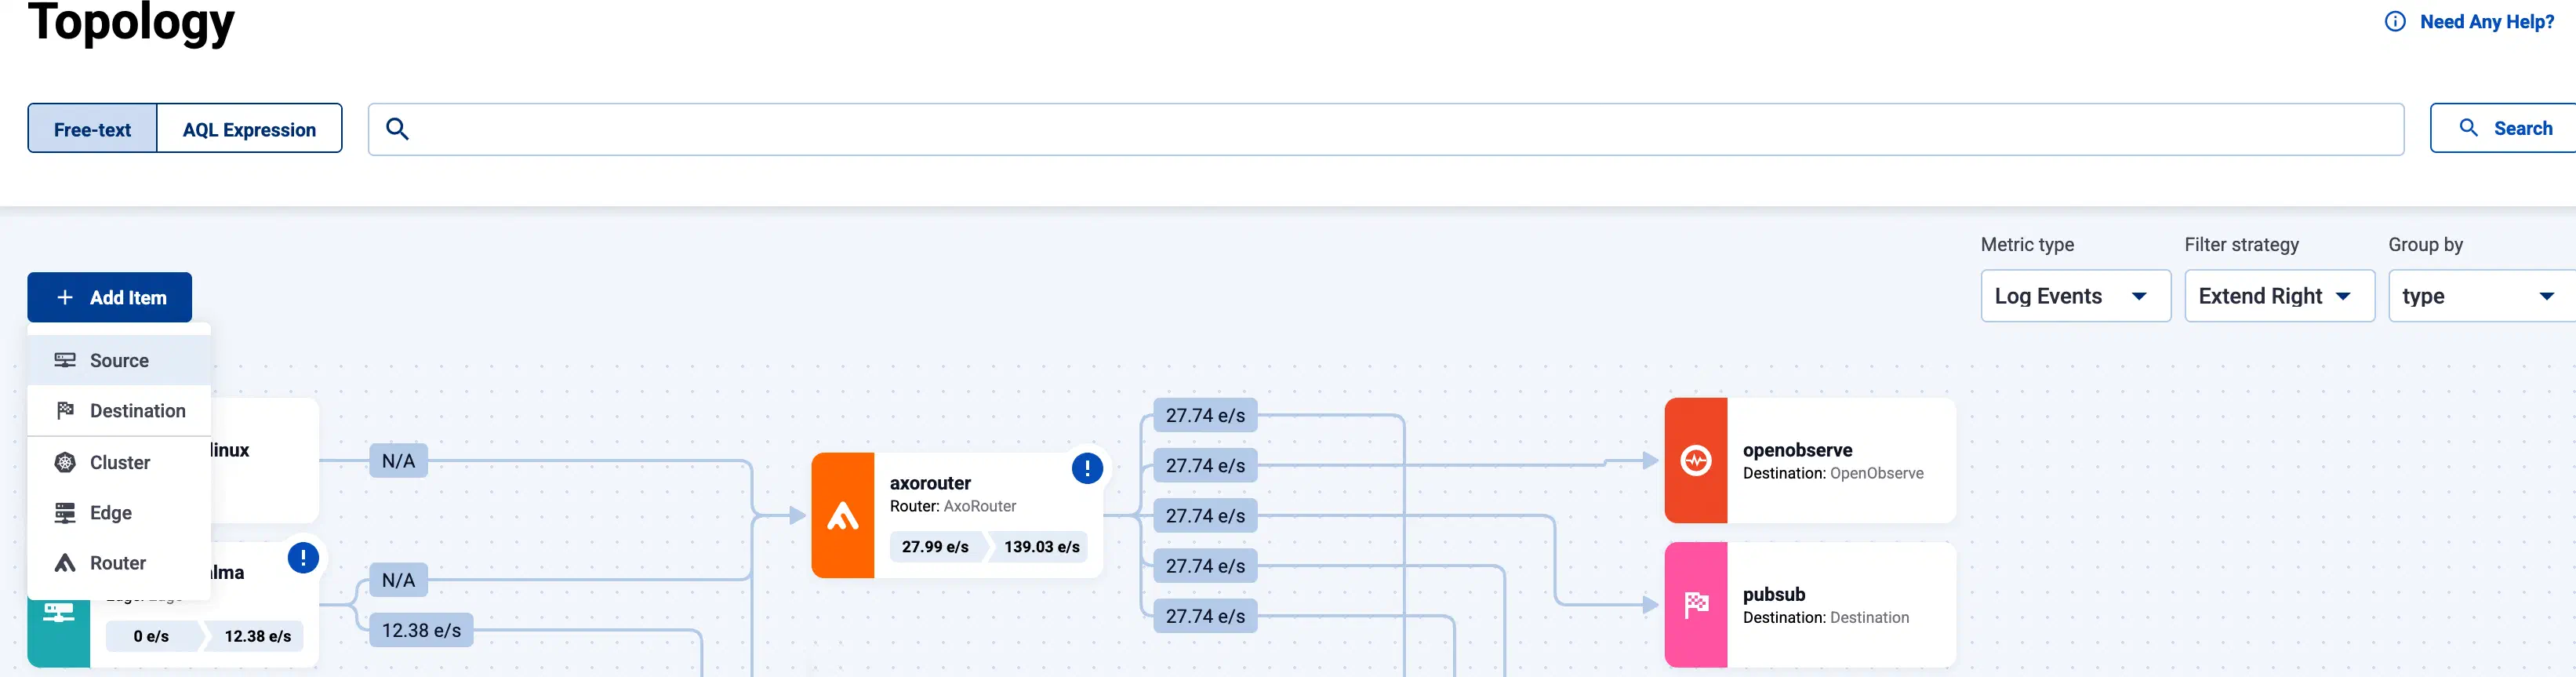
Open the AxoConsole and select Topology.
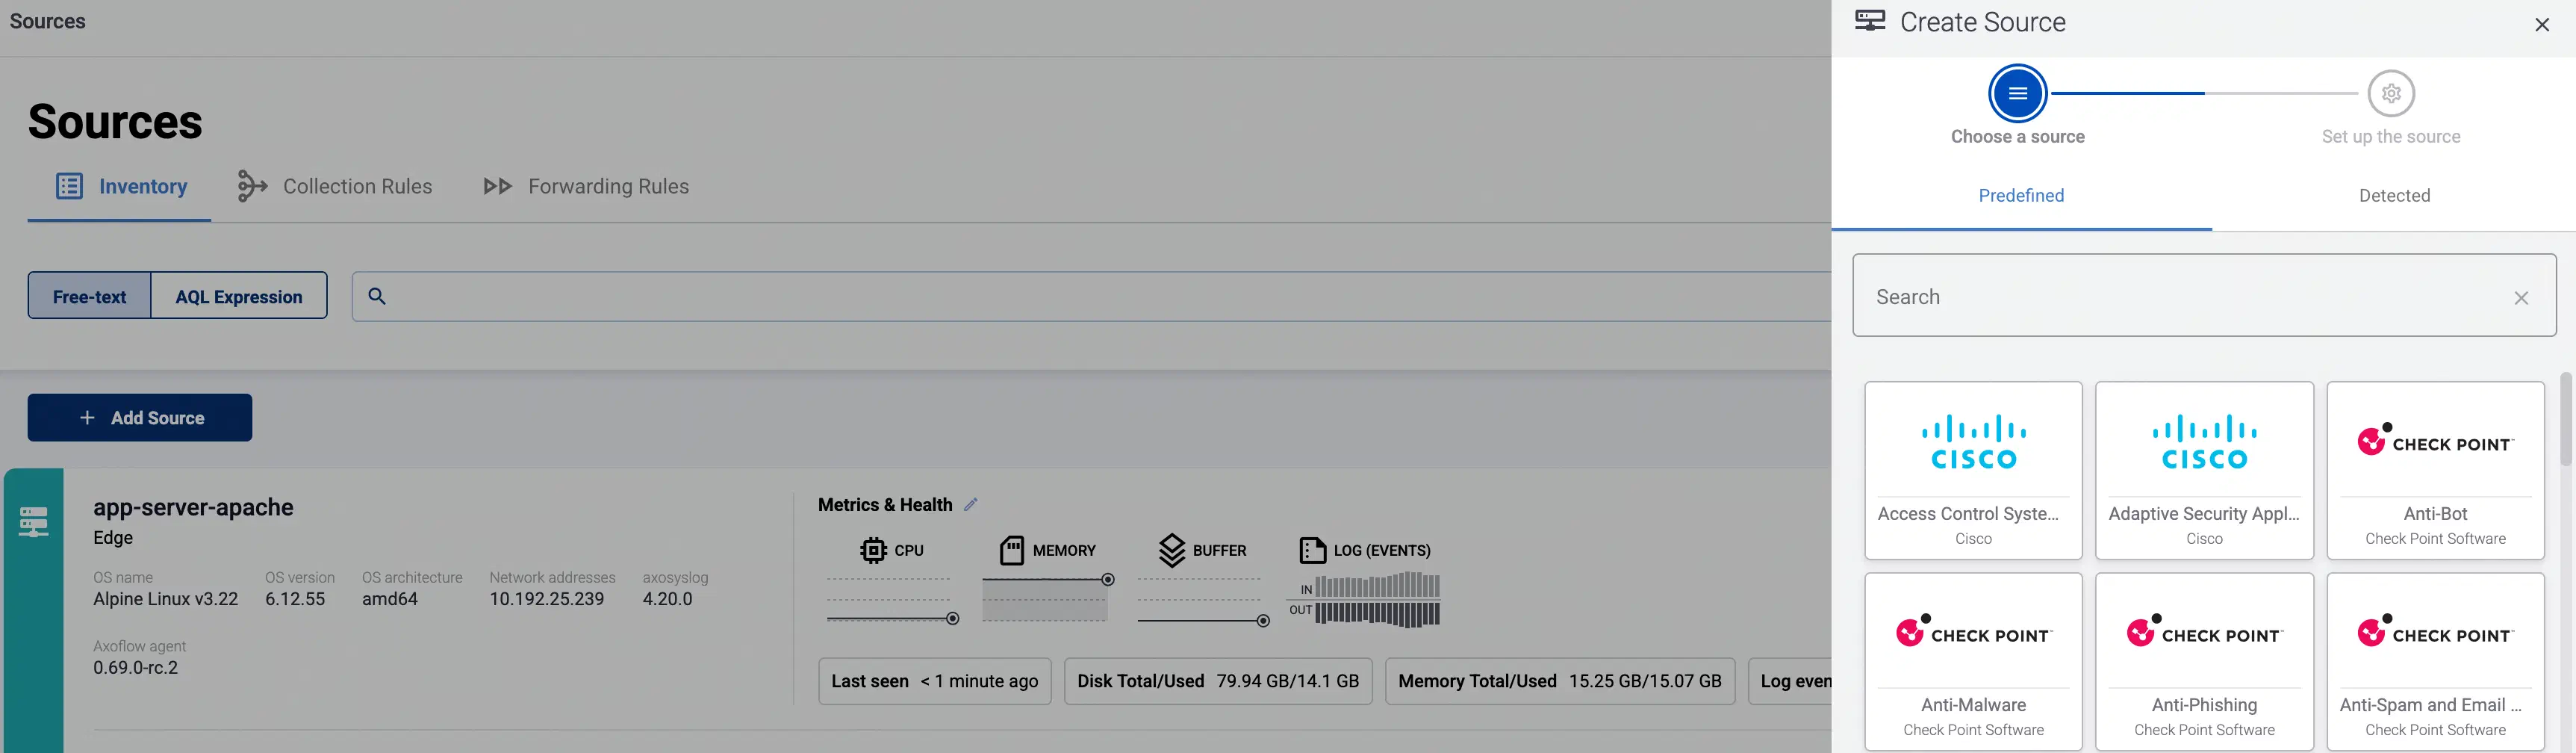
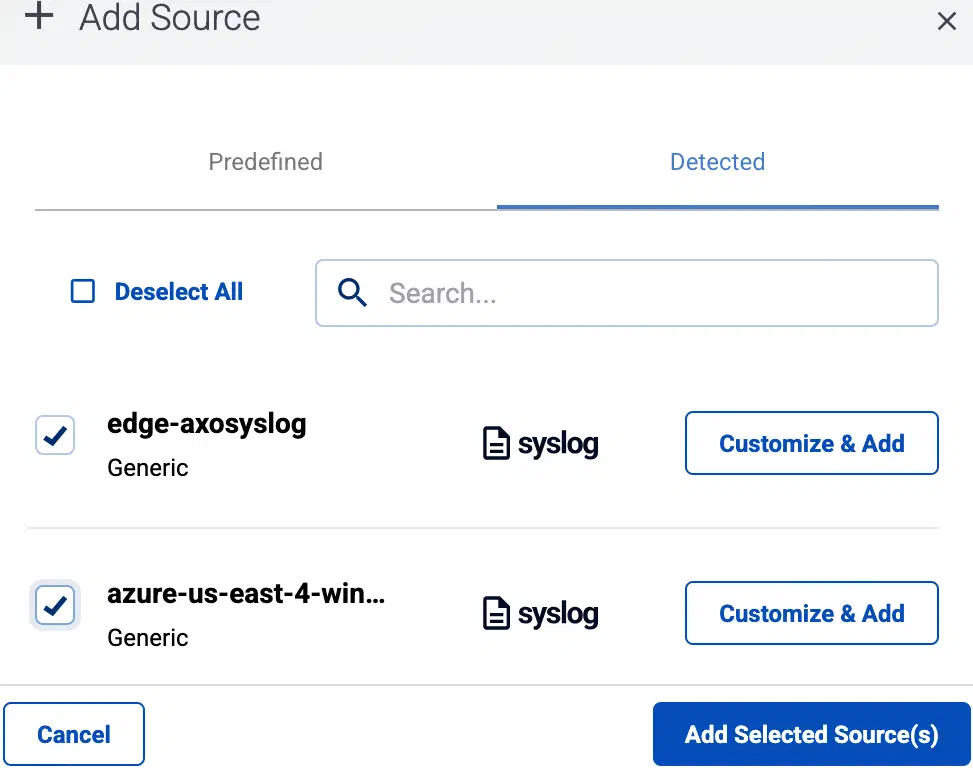
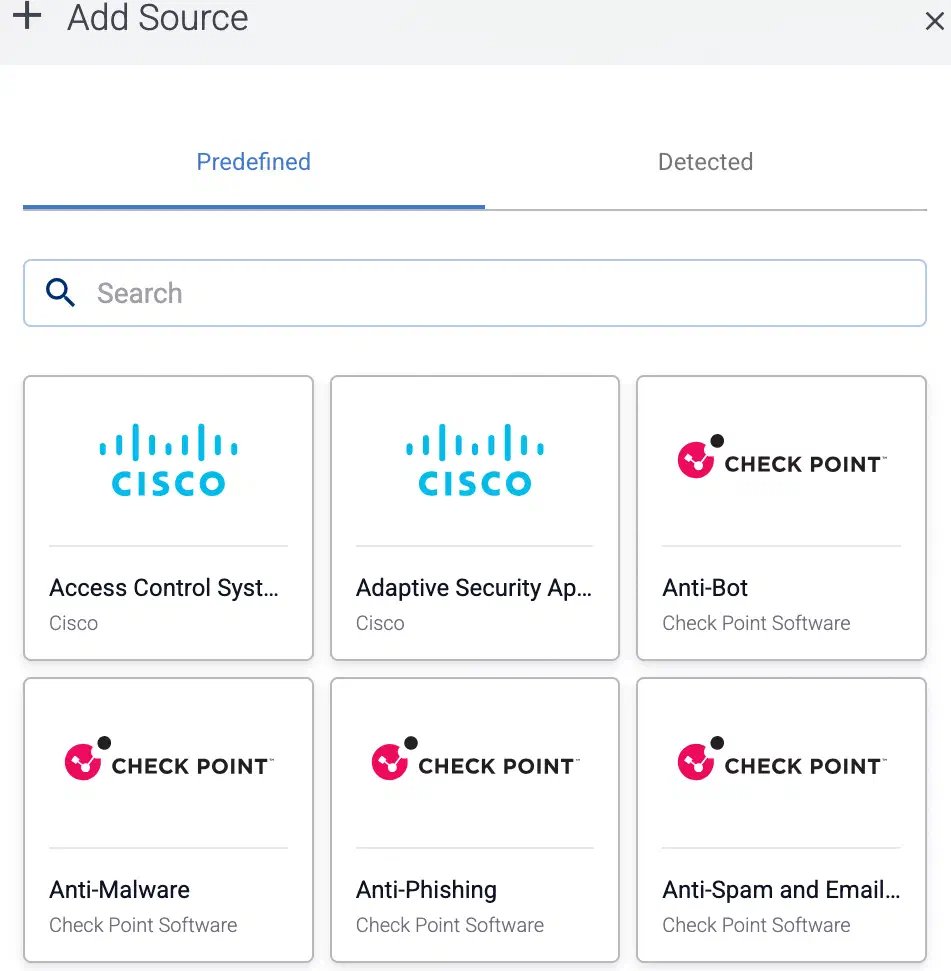
Select Add Item > Source.
If the source is actively sending data to an AxoRouter instance, select Detected, then select your source(s) and select Add Selected Source(s).
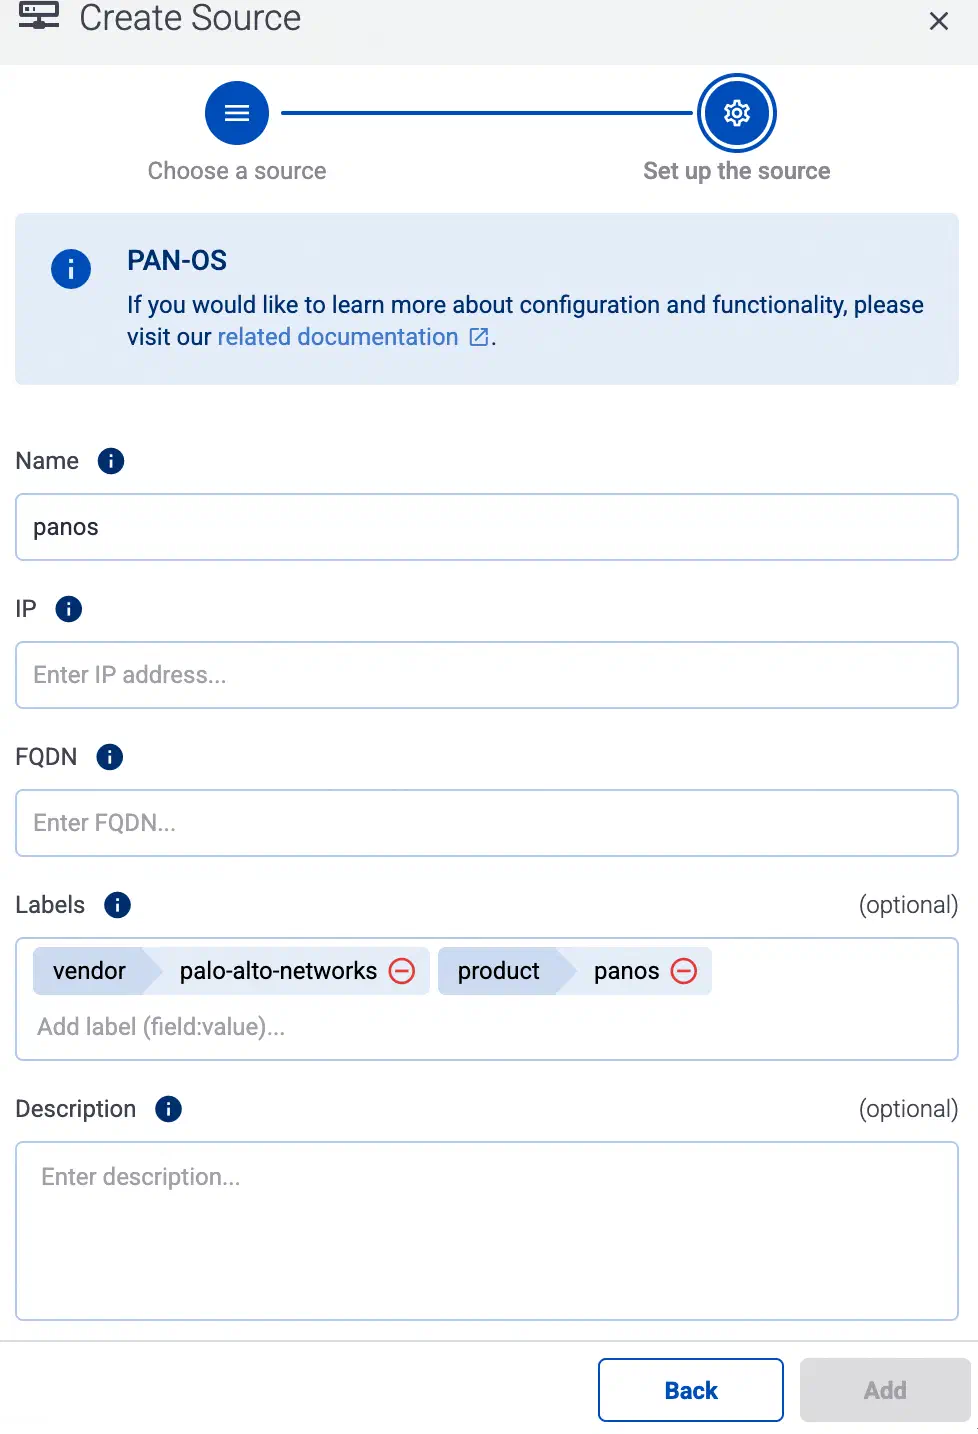
Otherwise, select the vendor and product corresponding to your source from the Predefined sources, then enter the parameters of the source, like IP address and FQDN.
Note
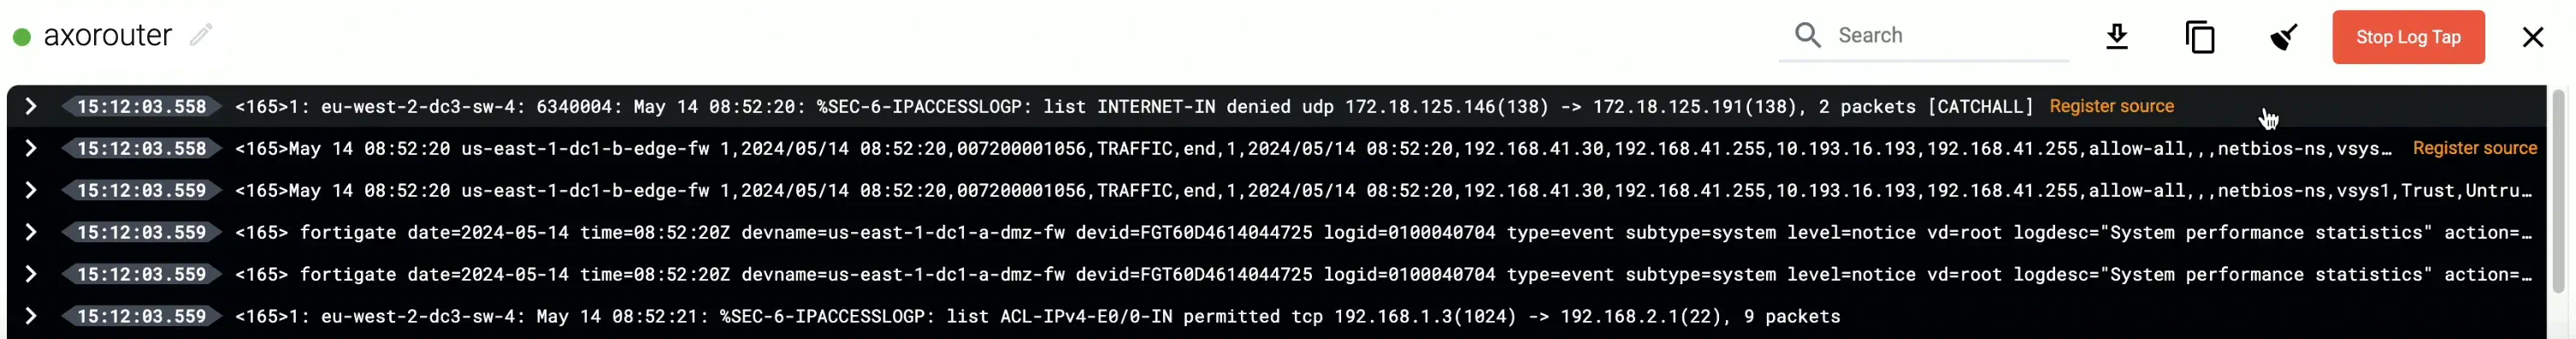
During log tapping, you can add hosts that are actively sending data to an AxoRouter instance by clicking Register source.
(Optional) Add Path manually. That’s needed only when AxoConsole can’t detect the path based on the IP address and the FQDN, and you haven’t yet configured the source to send data to the router.
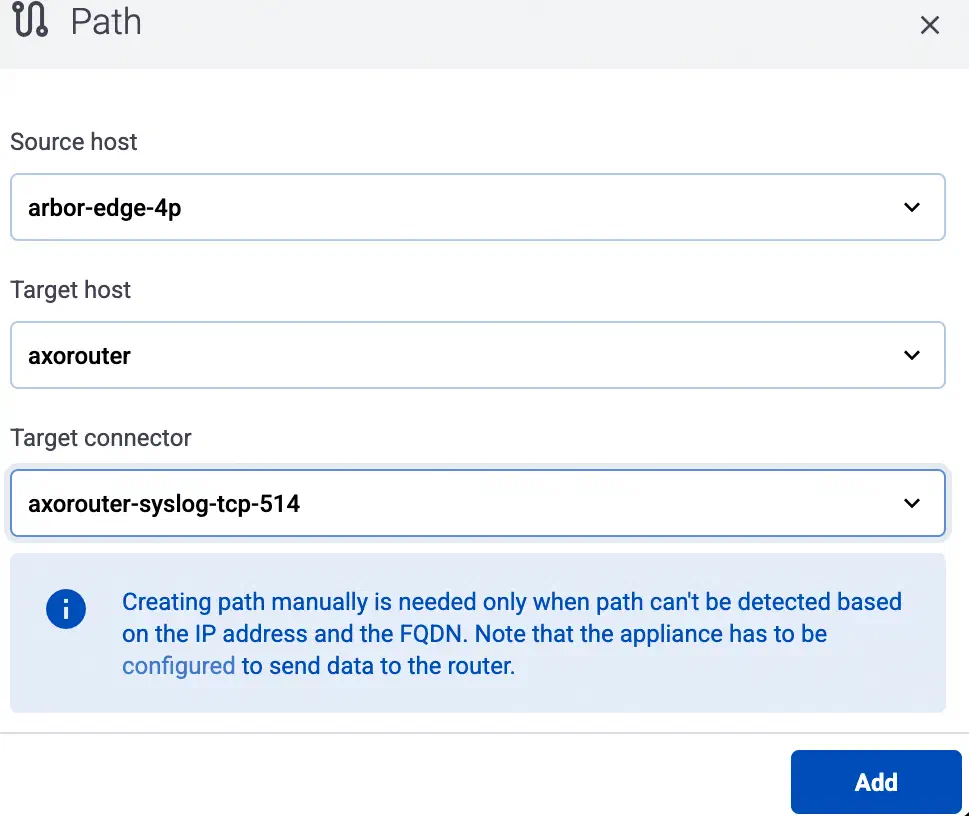
Add a path
Create a path between the source and the AxoRouter instance. If you've added the source from the Detected list, you can skip this step, as the path is created automatically. (Creating a path is usually part of adding the source. You only have to add paths explicitly if you forgot to do that during source provisioning.)
Select Topology > Add Item > Path.
Select the target router or aggregator this source is sending its data to in the Target host field, for example, axorouter.
Select the Target connector. The connector determines how the destination receives the data (for example, using which protocol or port).
Select Add. The new path appears on the Topology page.
Note
If your syslog source is running syslog-ng, Splunk Connect for Syslog (SC4S), or AxoSyslog as its log forwarder agent, consider installing Axolet on the host and instrumenting the configuration of the log forwarder to receive detailed metrics about the host and the processed data. For details, see Manage and monitor the pipeline.
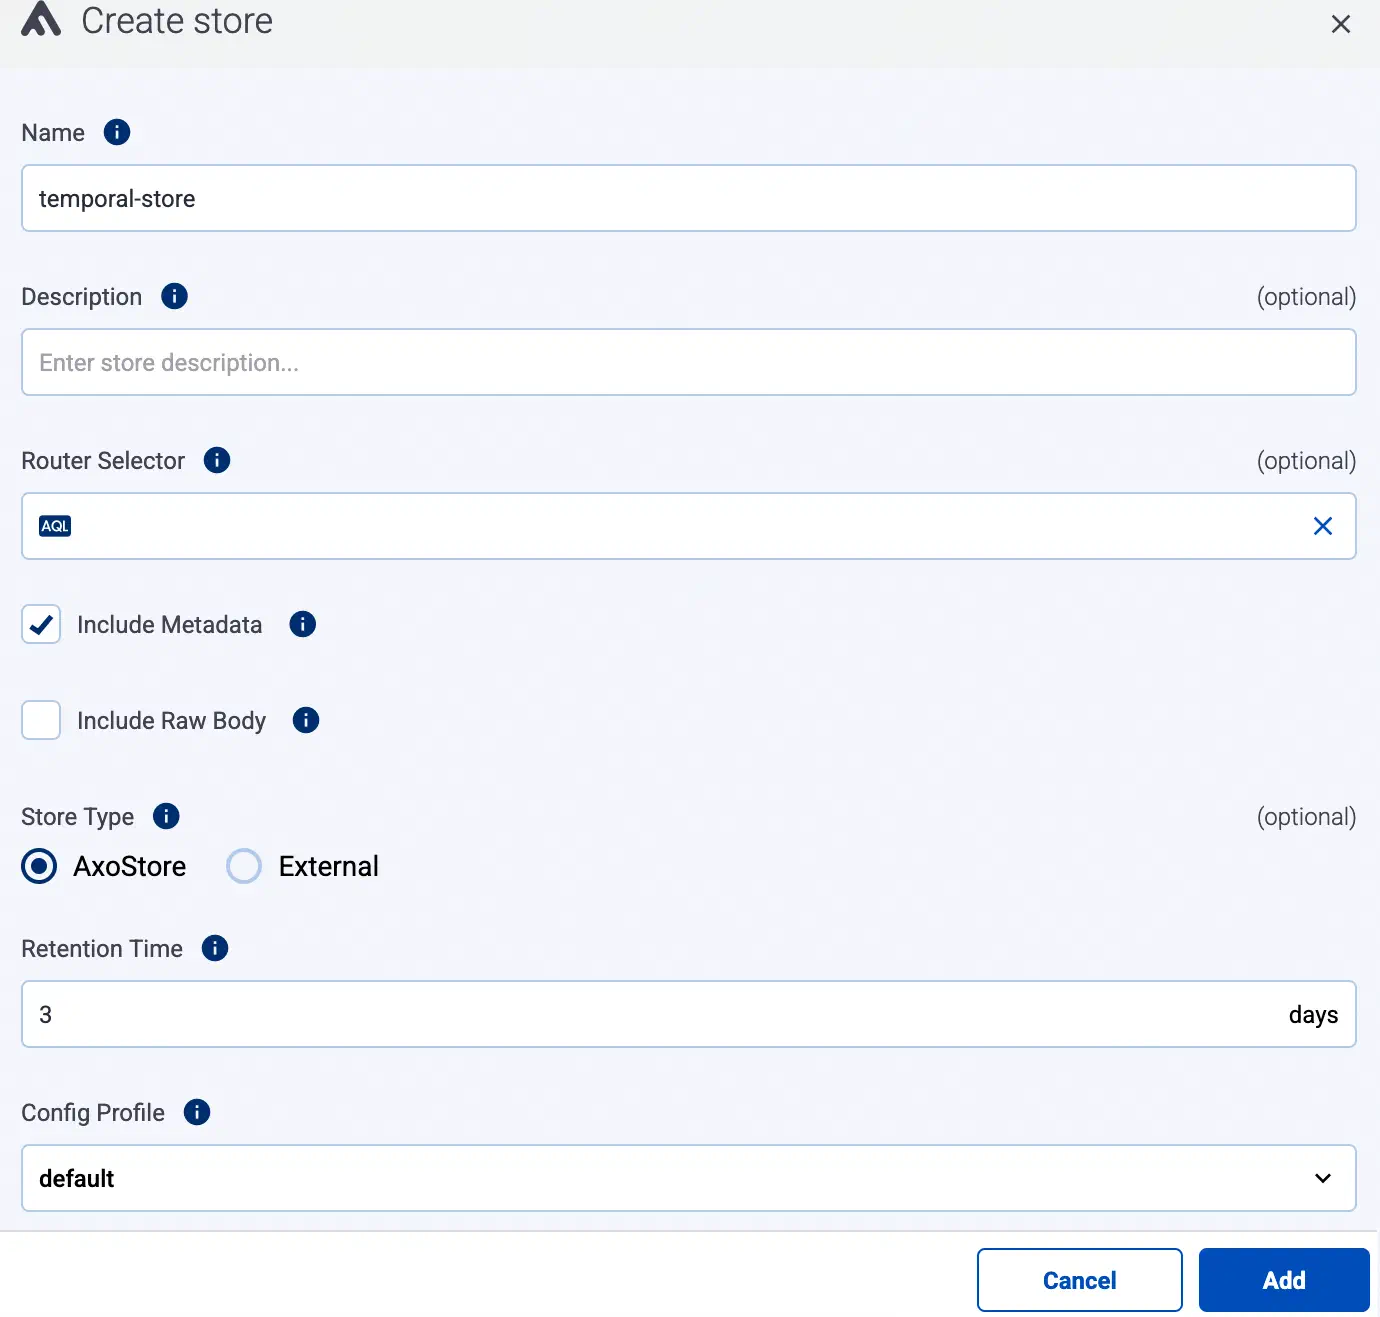
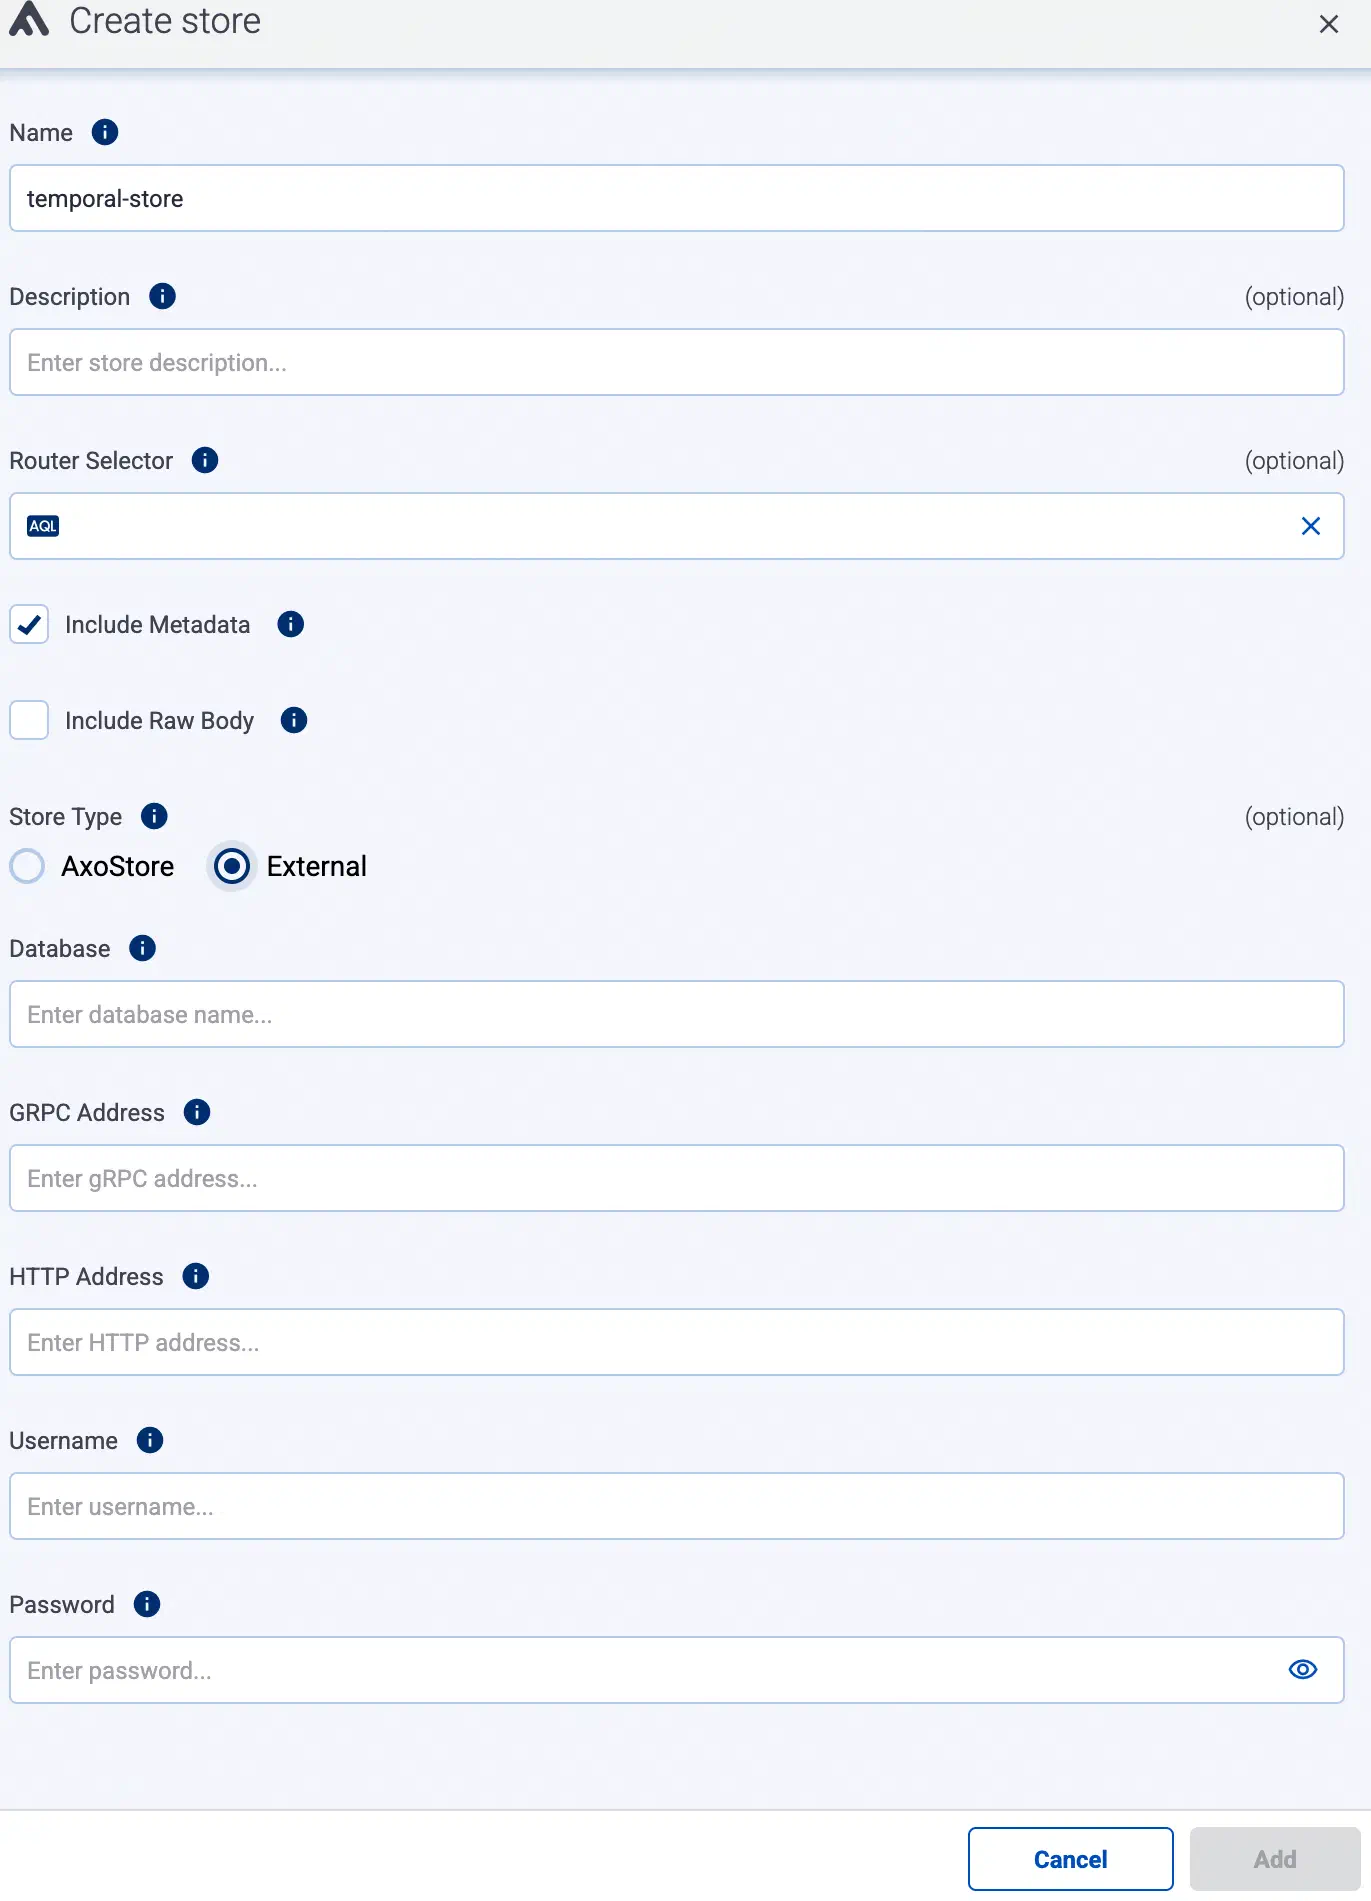
Create a store
Create a store called default to store the incoming messages.
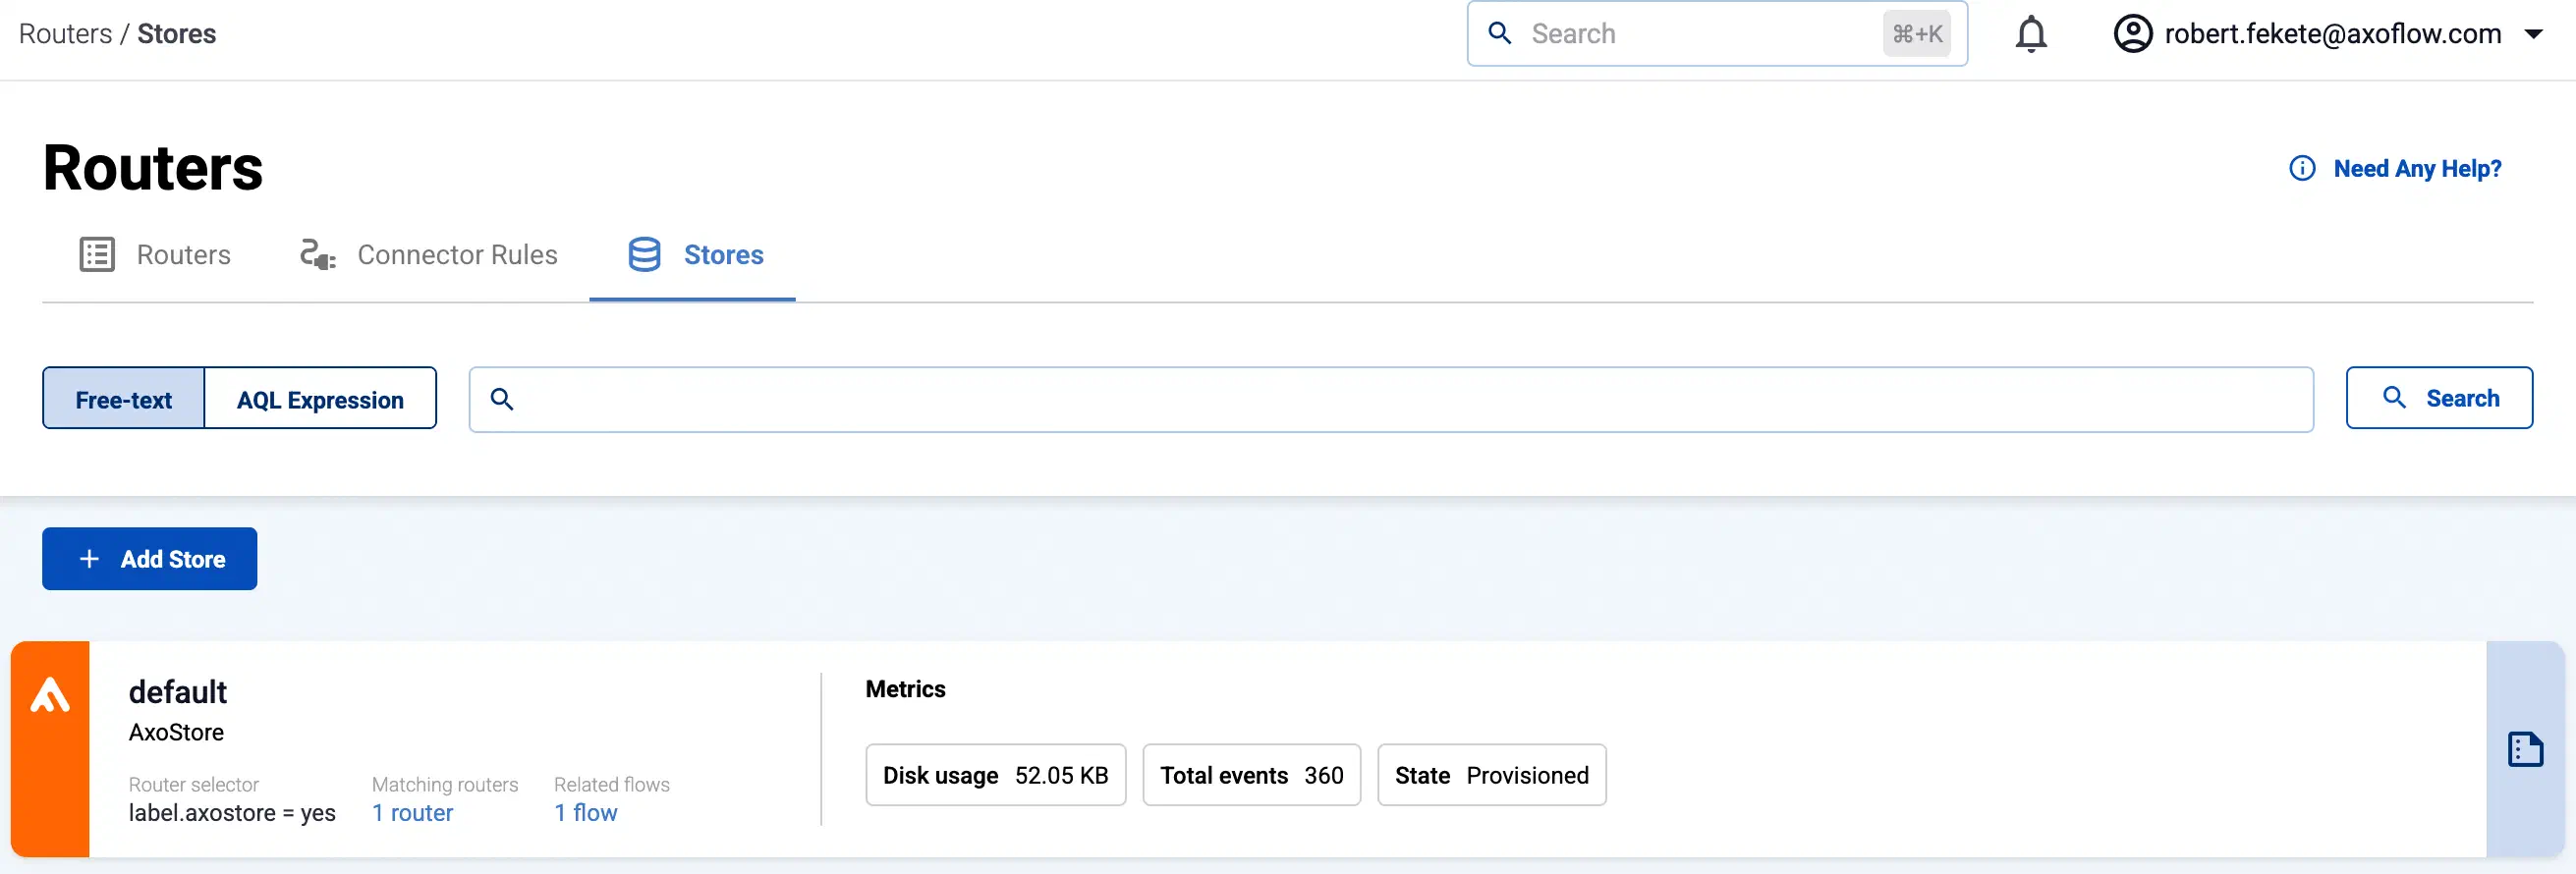
Navigate to Routers > Stores > Add Store.
Enter default as the Name of the store. This name will appear in the list of destinations (with the -store suffix) when setting the destination of a Flow. You cannot modify the name of the store later.
Set Store type to AxoStore.
Set the Router Selector so it matches the AxoRouter instances where you want to create this store.
You can use any labels and metadata of the AxoRouter hosts in the Router selectors, for example, the hostname of the AxoRouter, or any custom labels.
If you leave the Router Selector field empty, the selector will match every AxoRouter instance.
To select only a specific AxoRouter instance, set the name field to the name of the instance as selector. For example, name = my-axorouter.
If you set multiple fields in the selector, the selector will match only AxoRouter instances that match all elements of the selector. (There in an AND relationship between the fields.)
Set the Retention Time (in days) so older data is automatically deleted from the store. You cannot modify this parameter later.
Select Add.
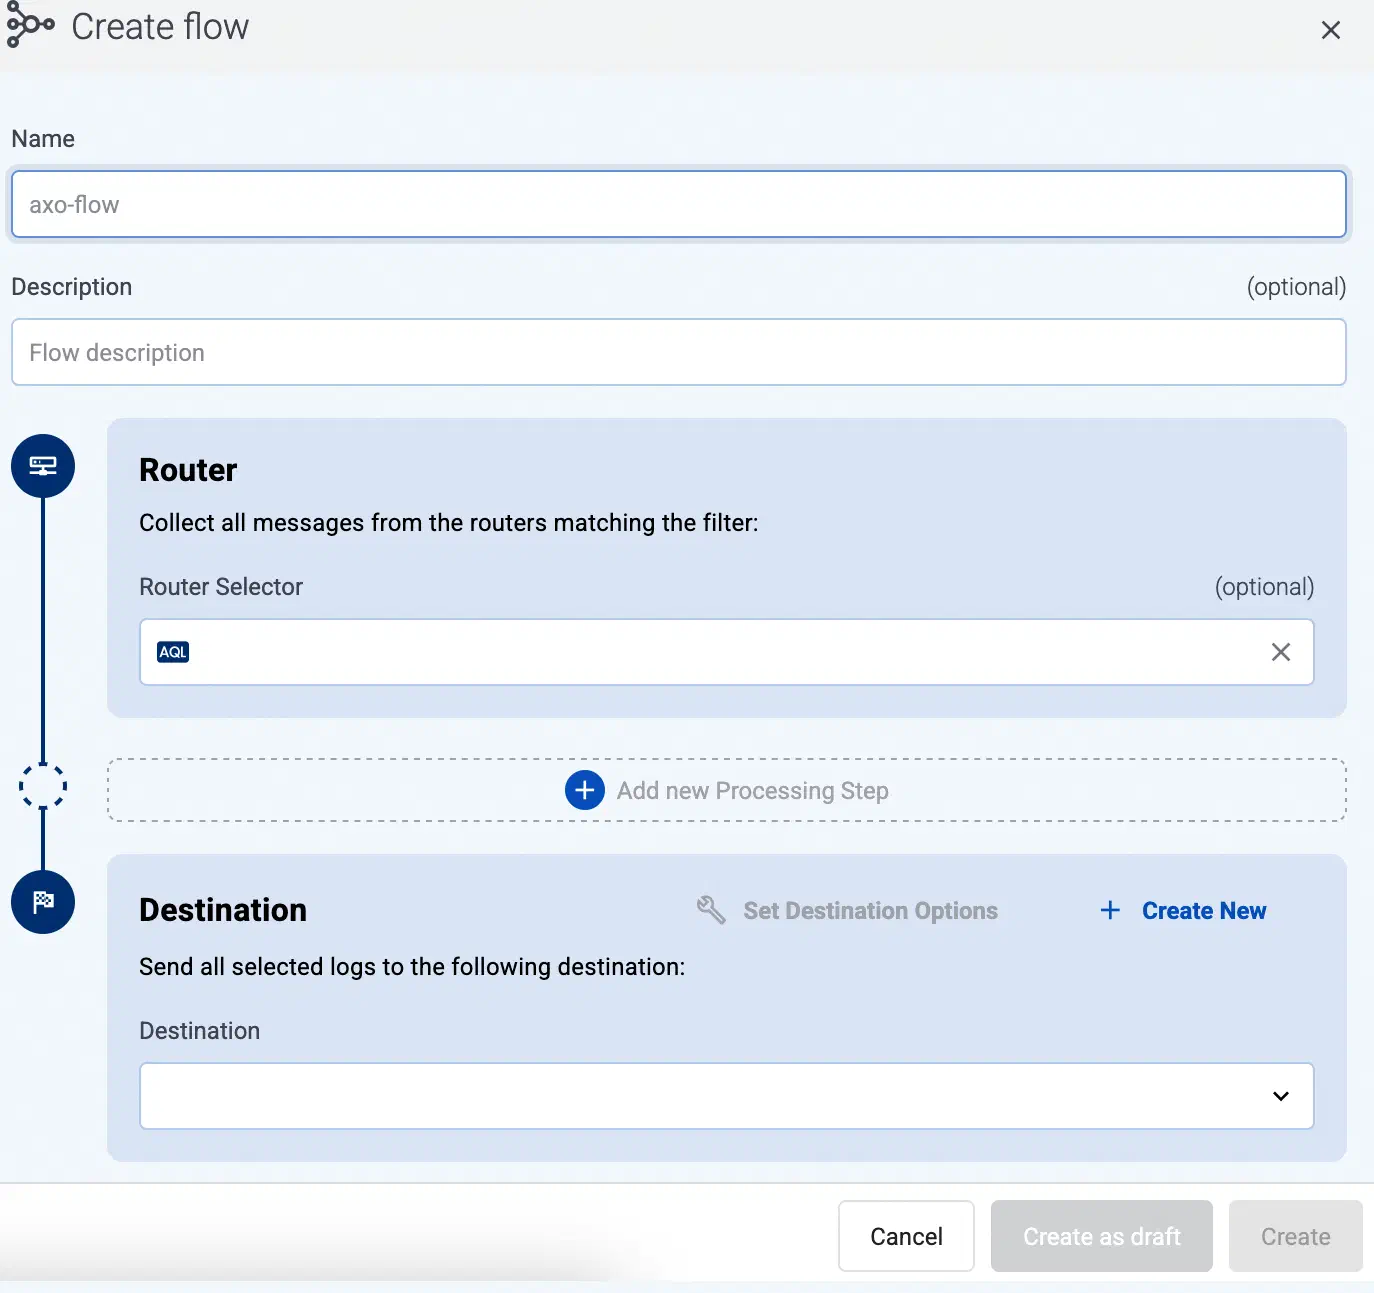
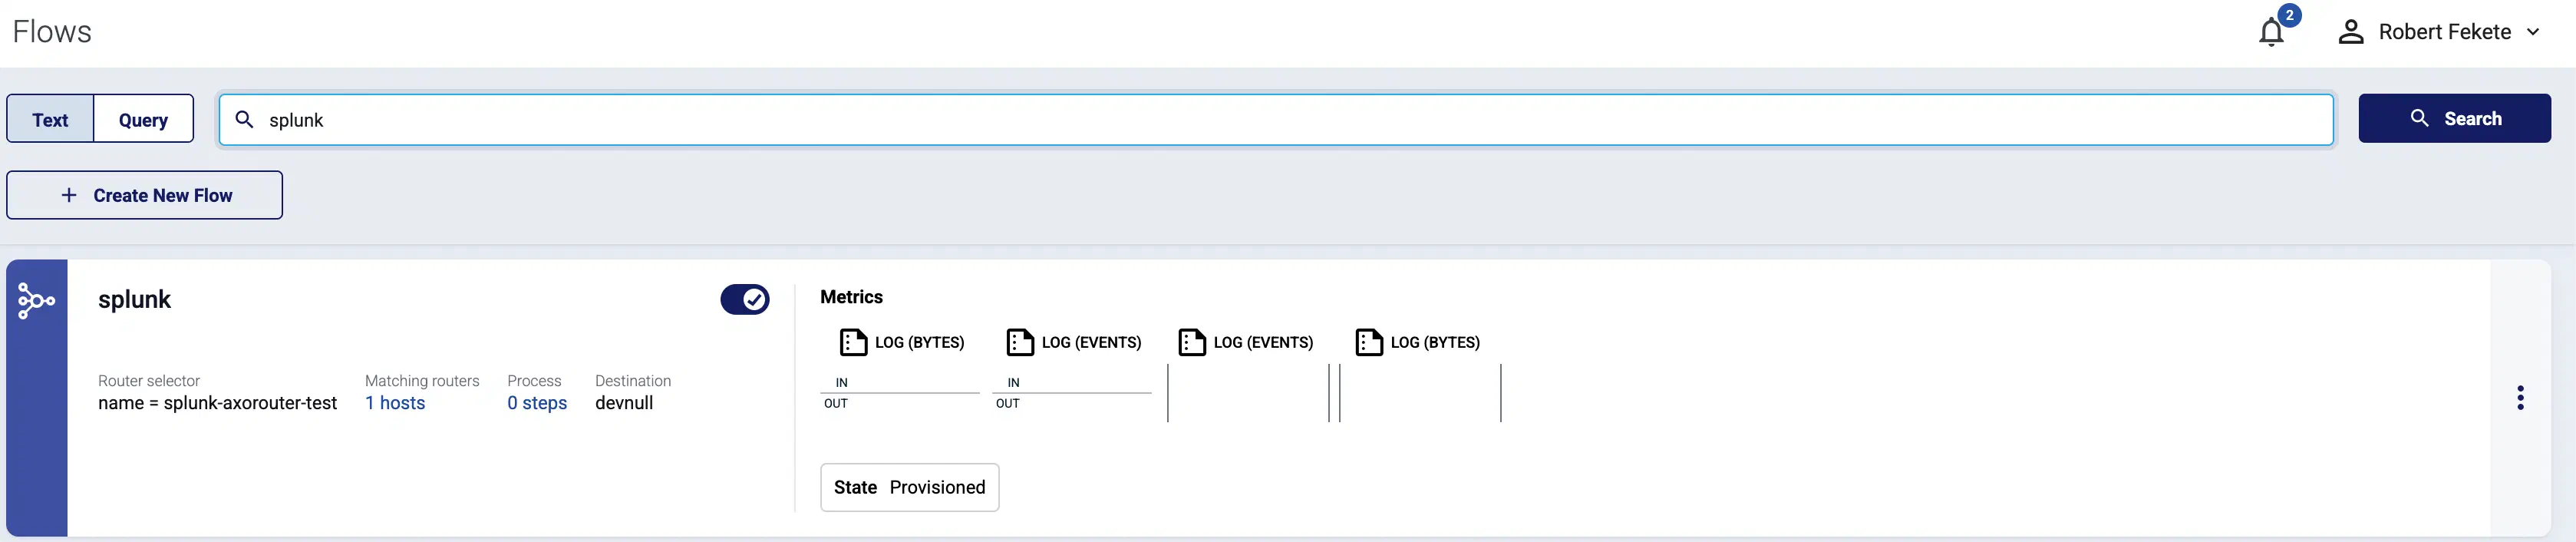
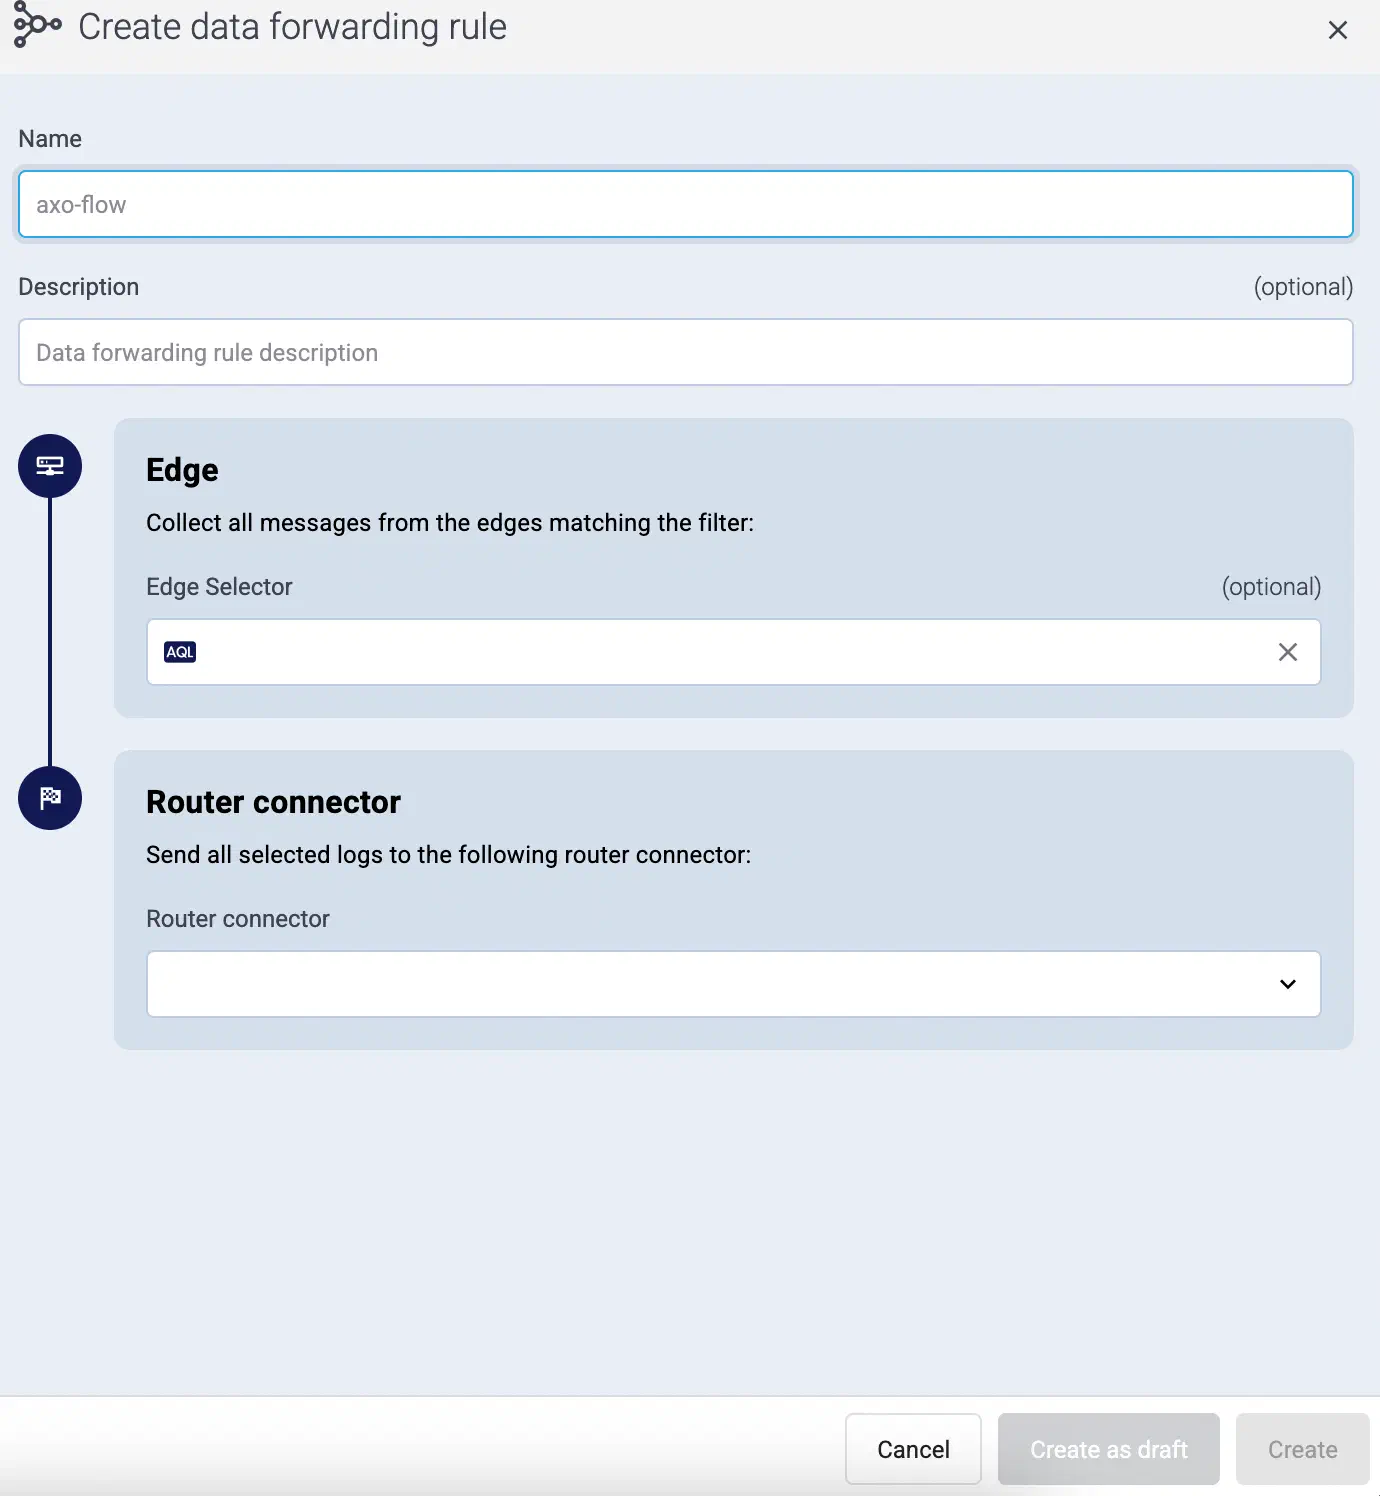
Create a flow
Create a flow to route the traffic from your AxoRouter instance to the `default-store` destination.
Select Flows.
Select Add Flow.
Enter a name for the flow, for example, my-test-flow.
In the Router Selector field, enter an expression that matches the router(s) you want to apply the flow. To select a specific router, use a name selector, for example, name = my-axorouter-hostname.
You can use any labels and metadata of the AxoRouter hosts in the Router selectors, for example, the hostname of the AxoRouter, or any custom labels.
If you leave the Router Selector field empty, the selector will match every AxoRouter instance.
To select only a specific AxoRouter instance, set the name field to the name of the instance as selector. For example, name = my-axorouter.
If you set multiple fields in the selector, the selector will match only AxoRouter instances that match all elements of the selector. (There in an AND relationship between the fields.)
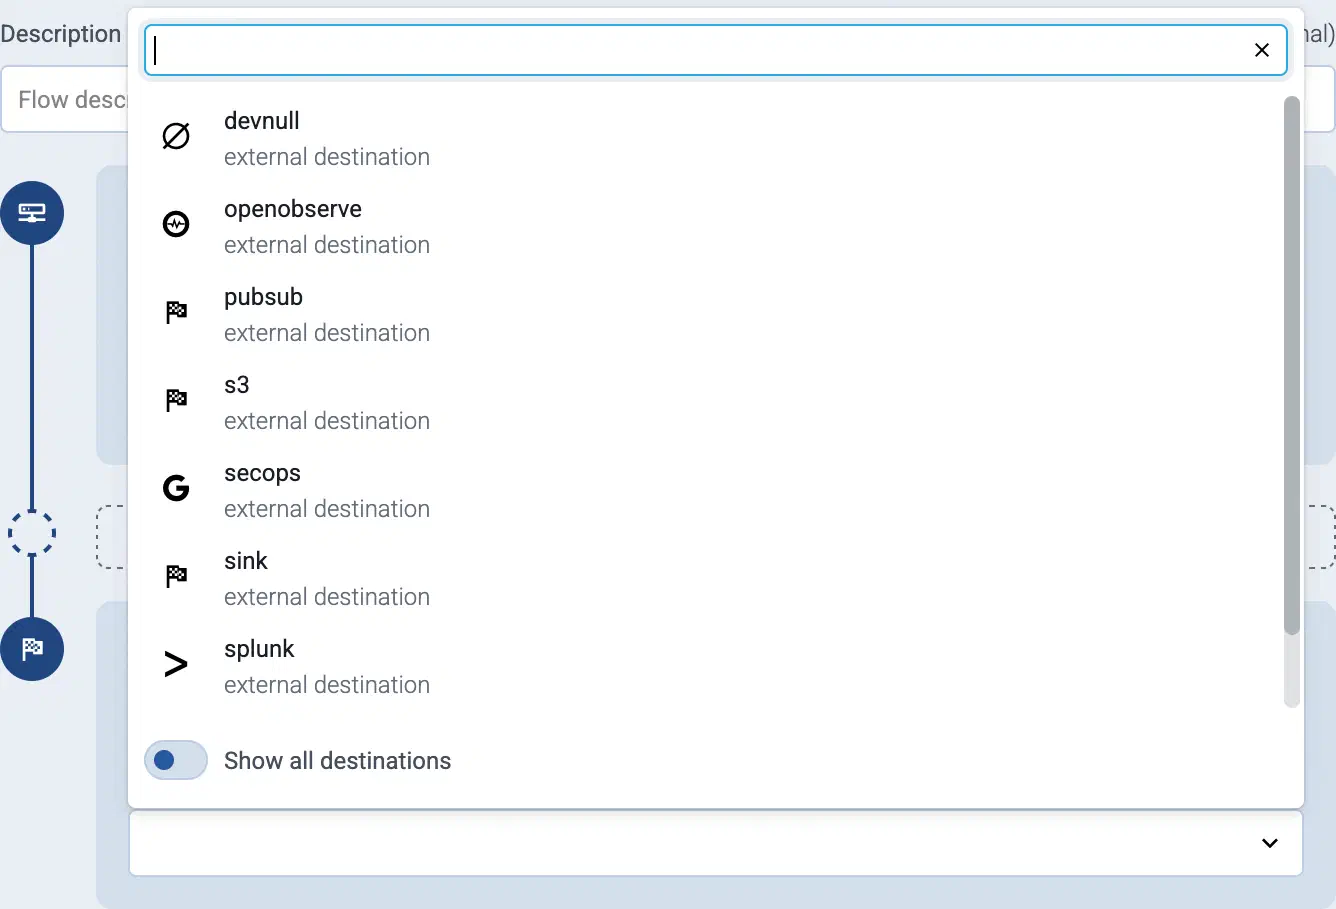
Set the Destination where you want to send your data. Select default-store. For details on the different destinations, see Destinations.
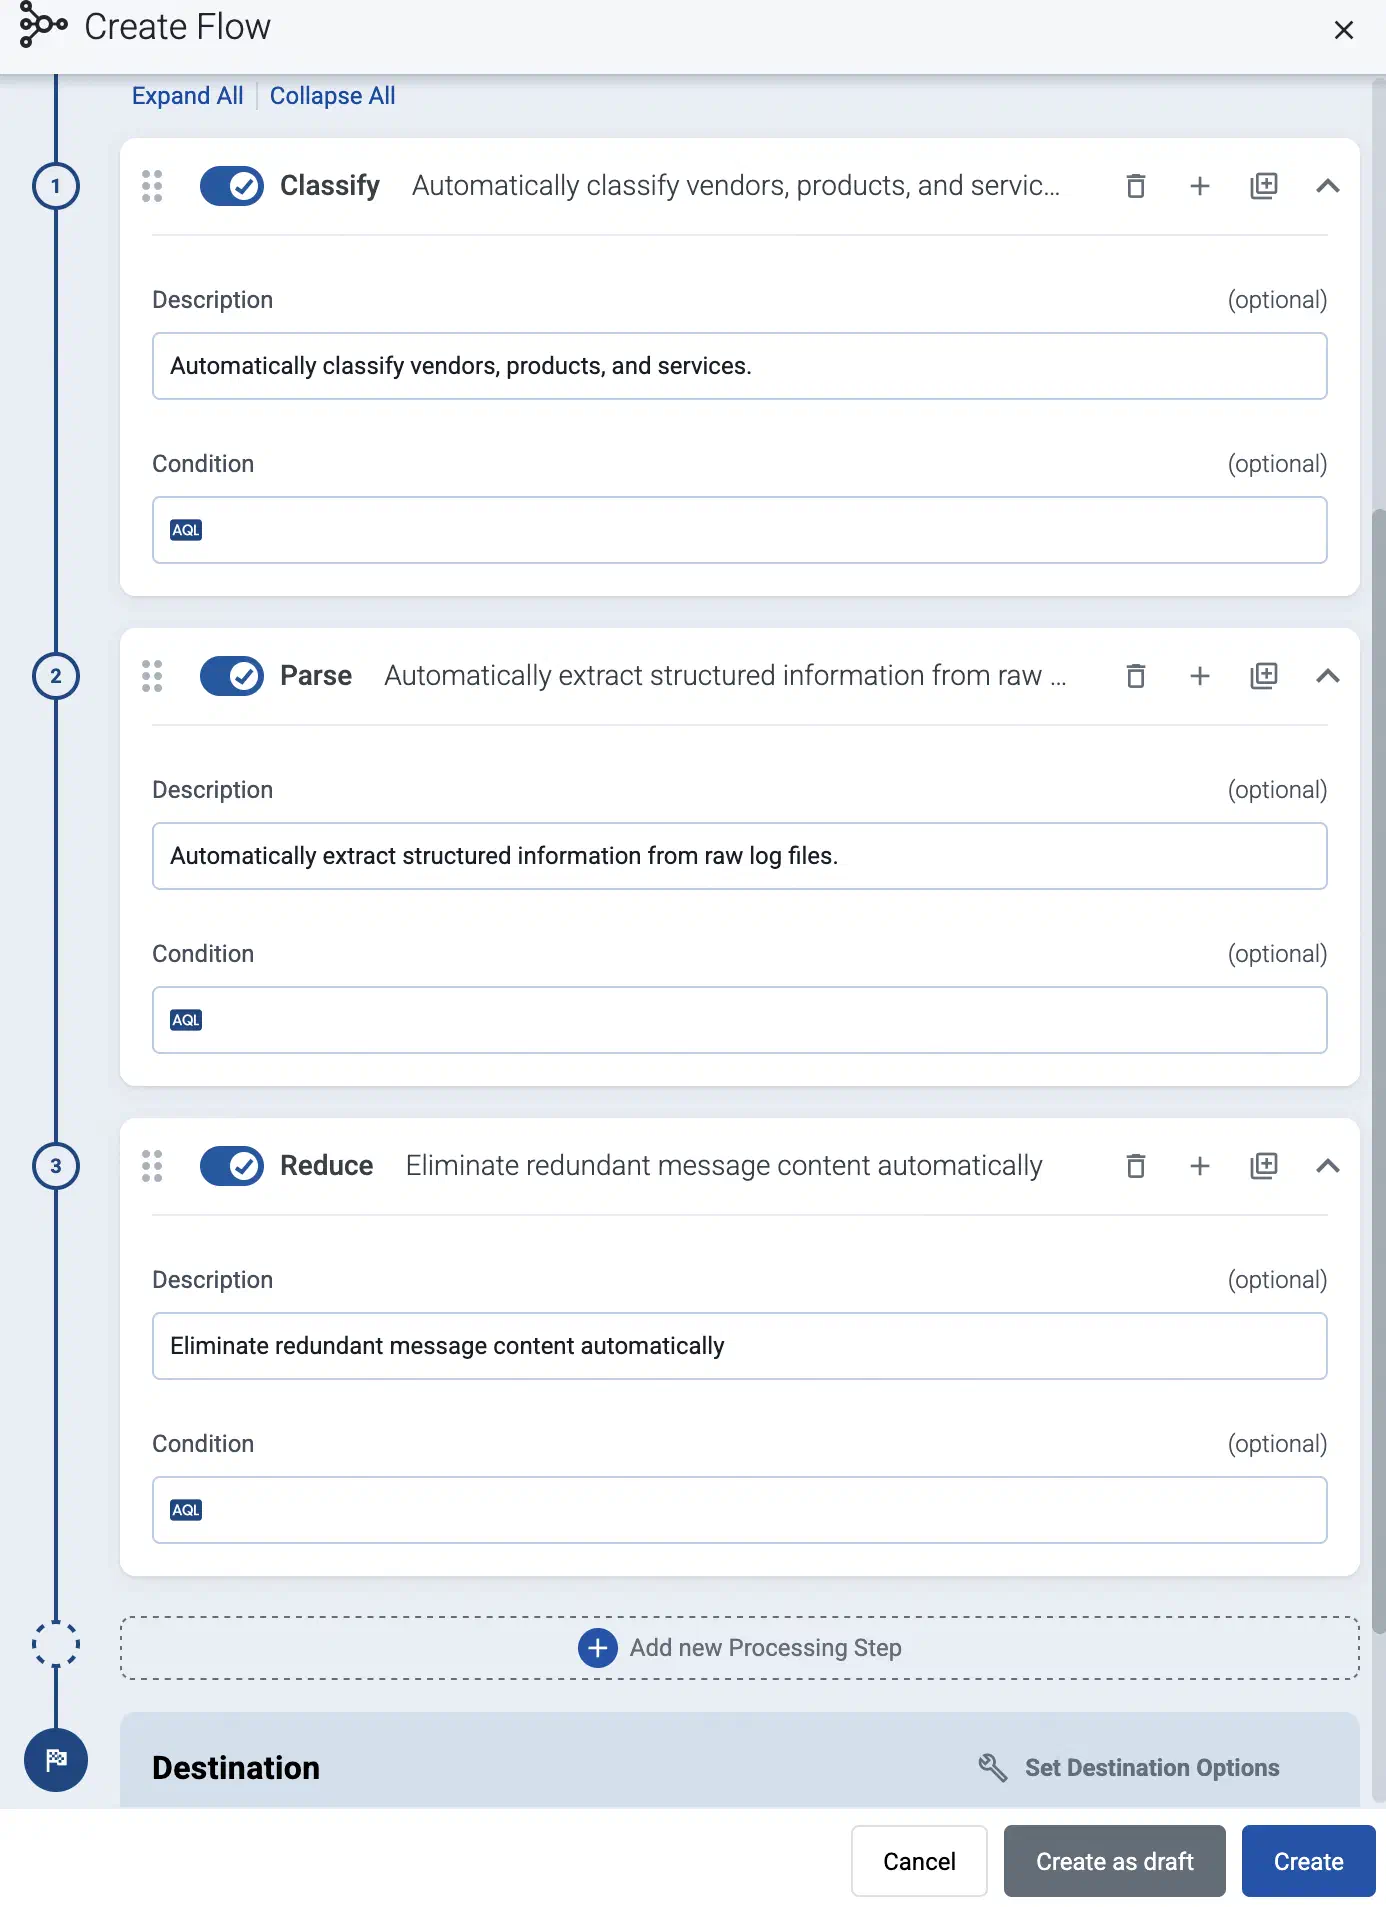
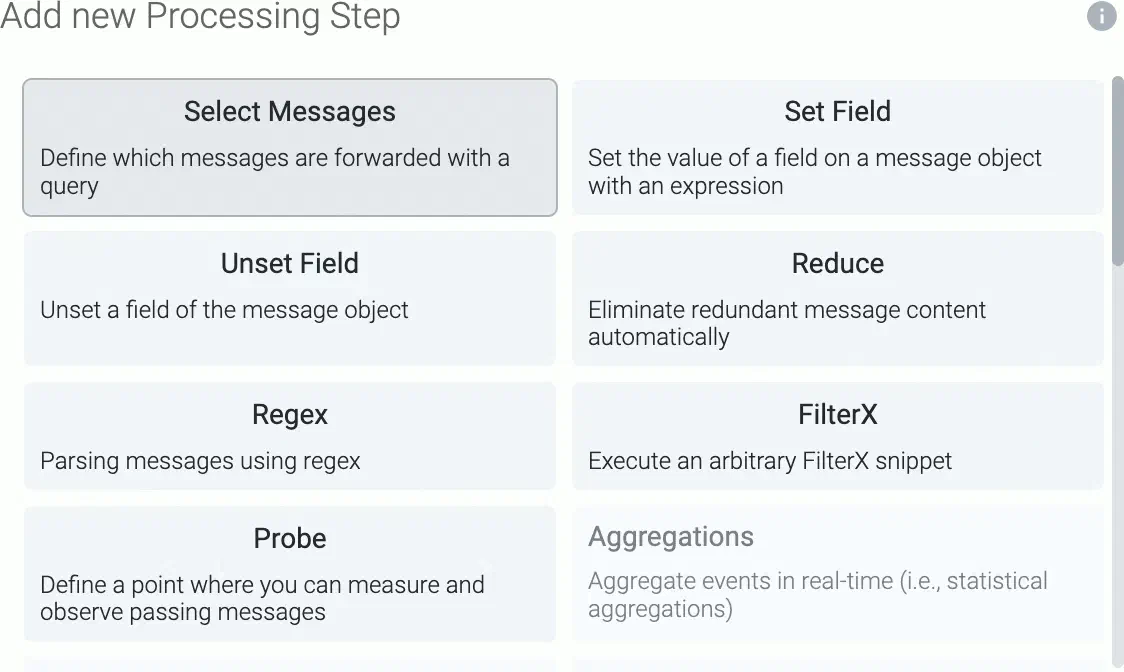
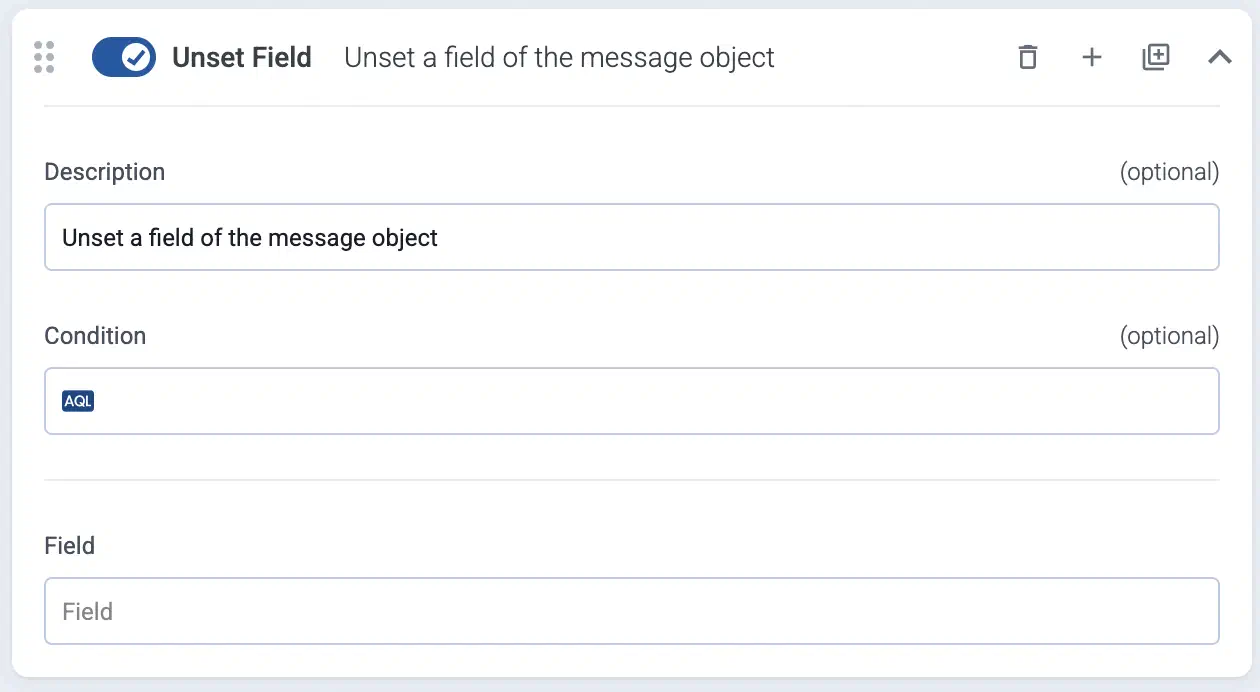
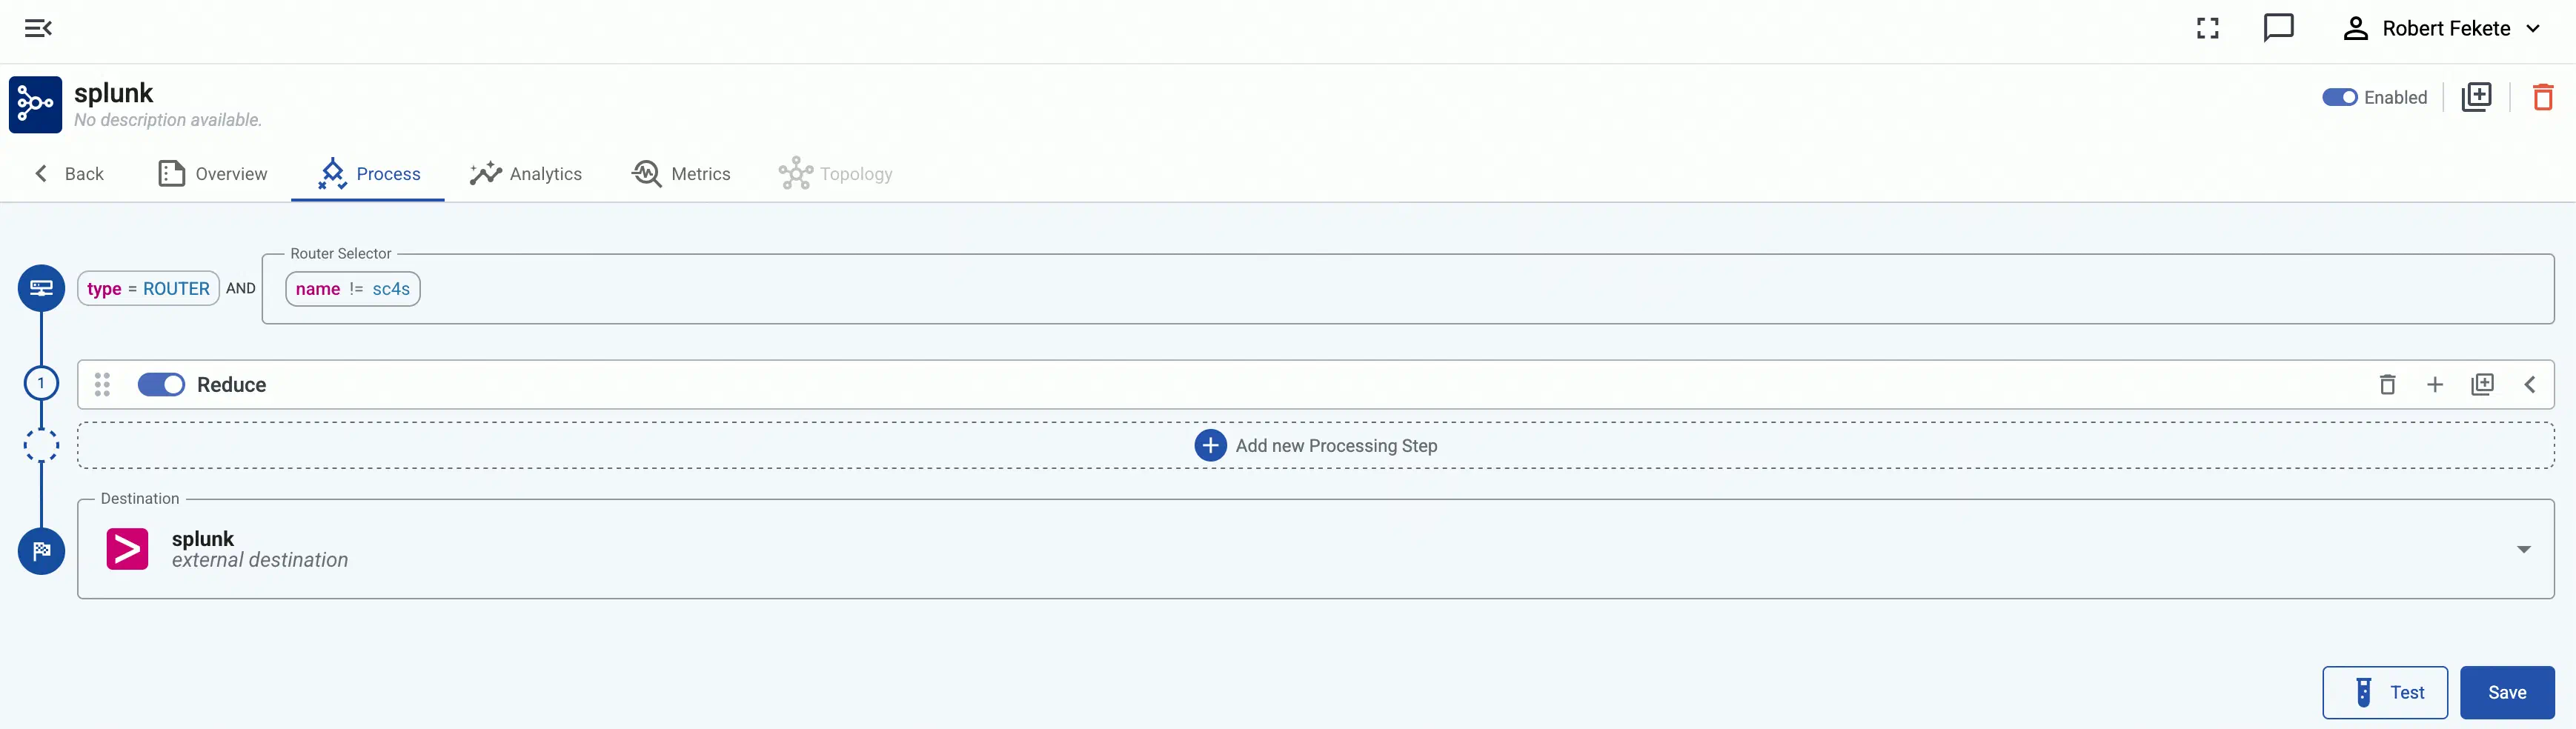
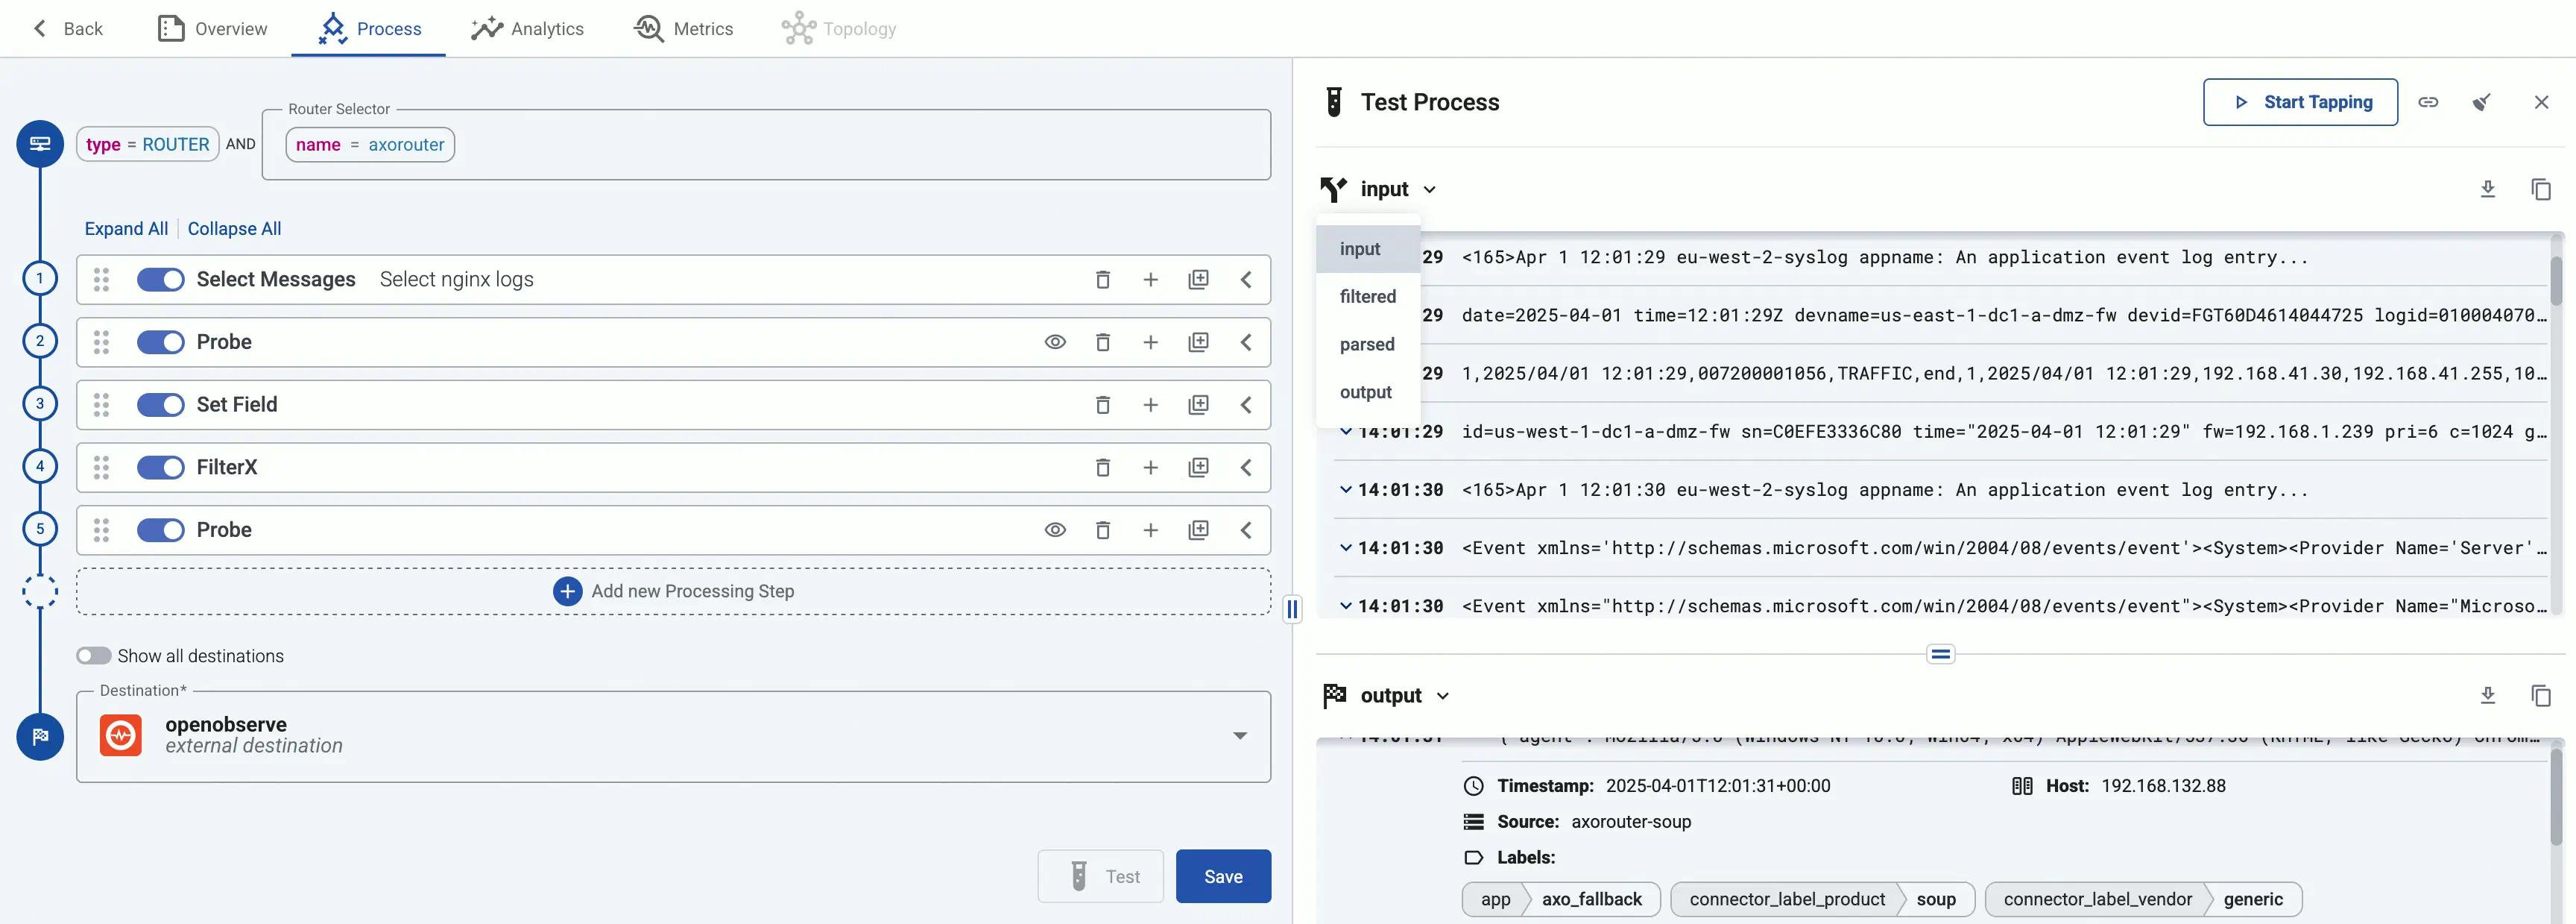
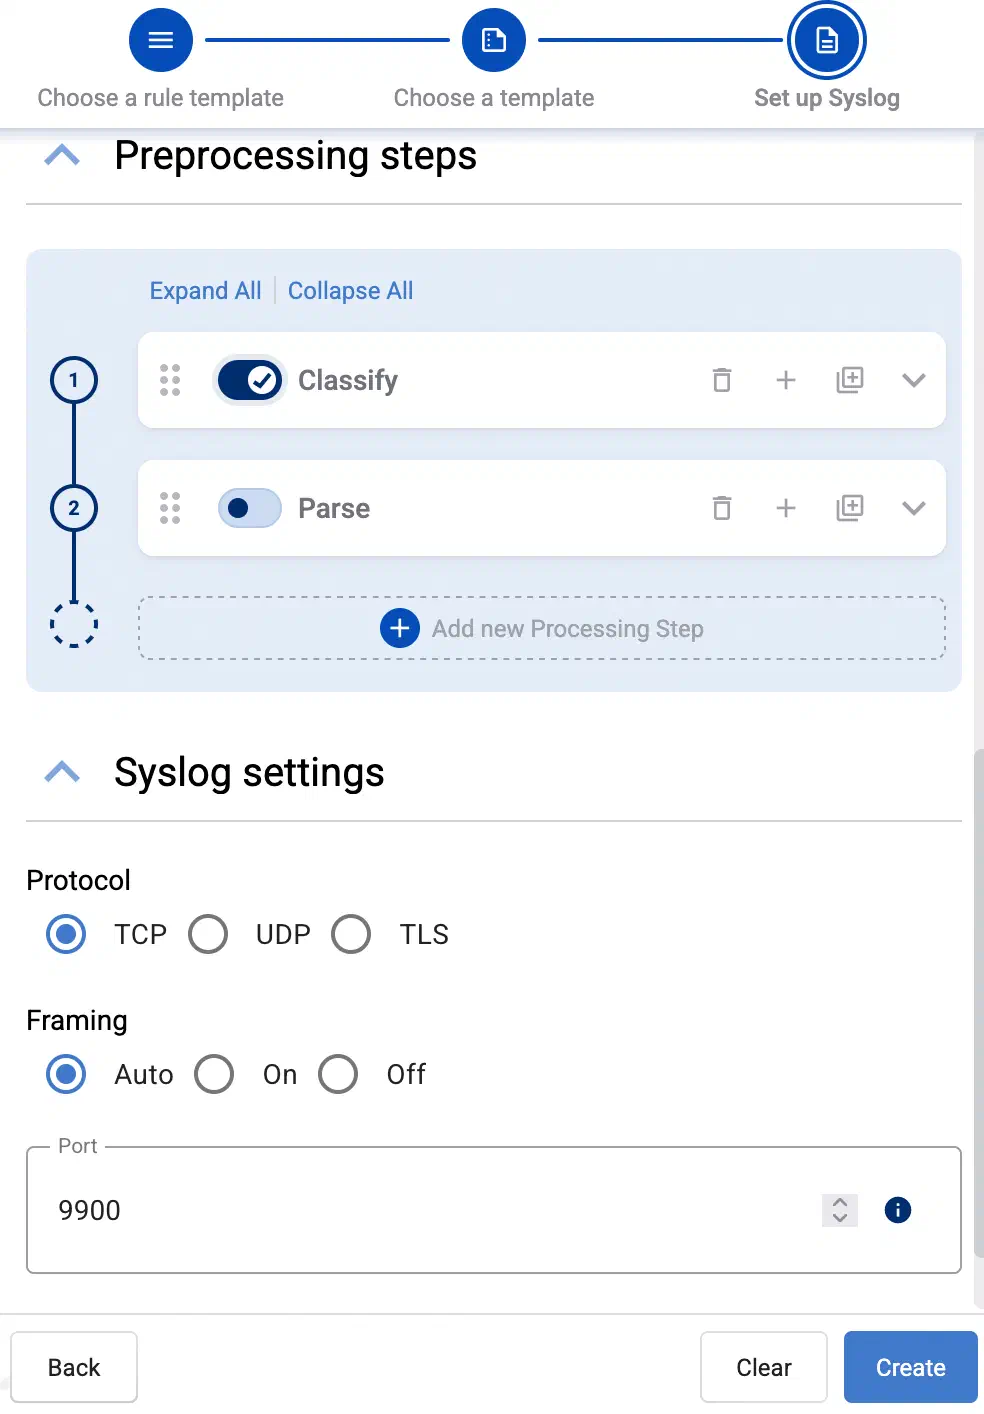
(Optional) To process the data transferred in the flow, select Add New Processing Step. For details, see Processing steps. For example:
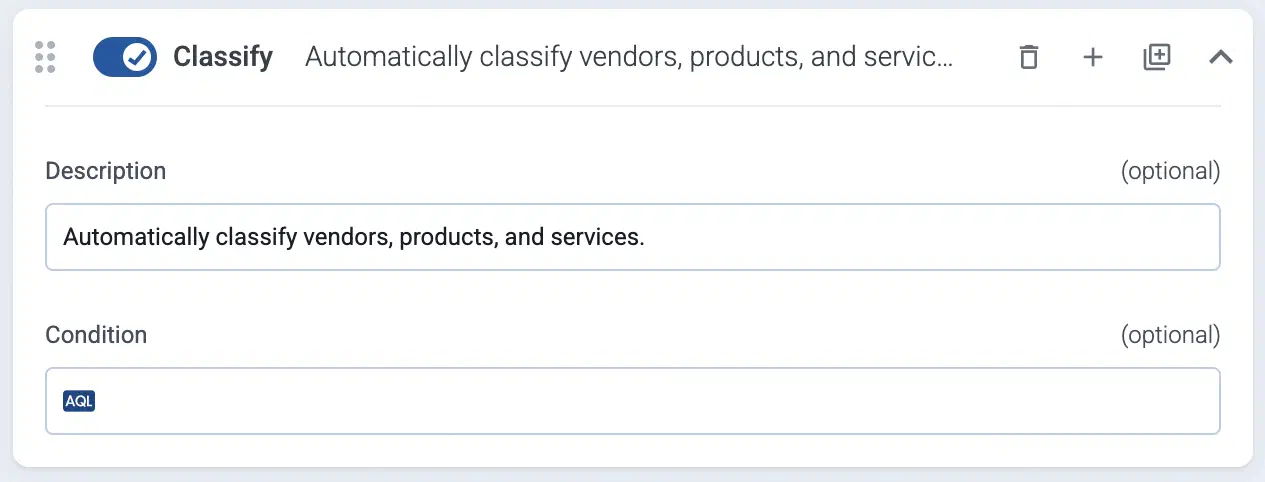
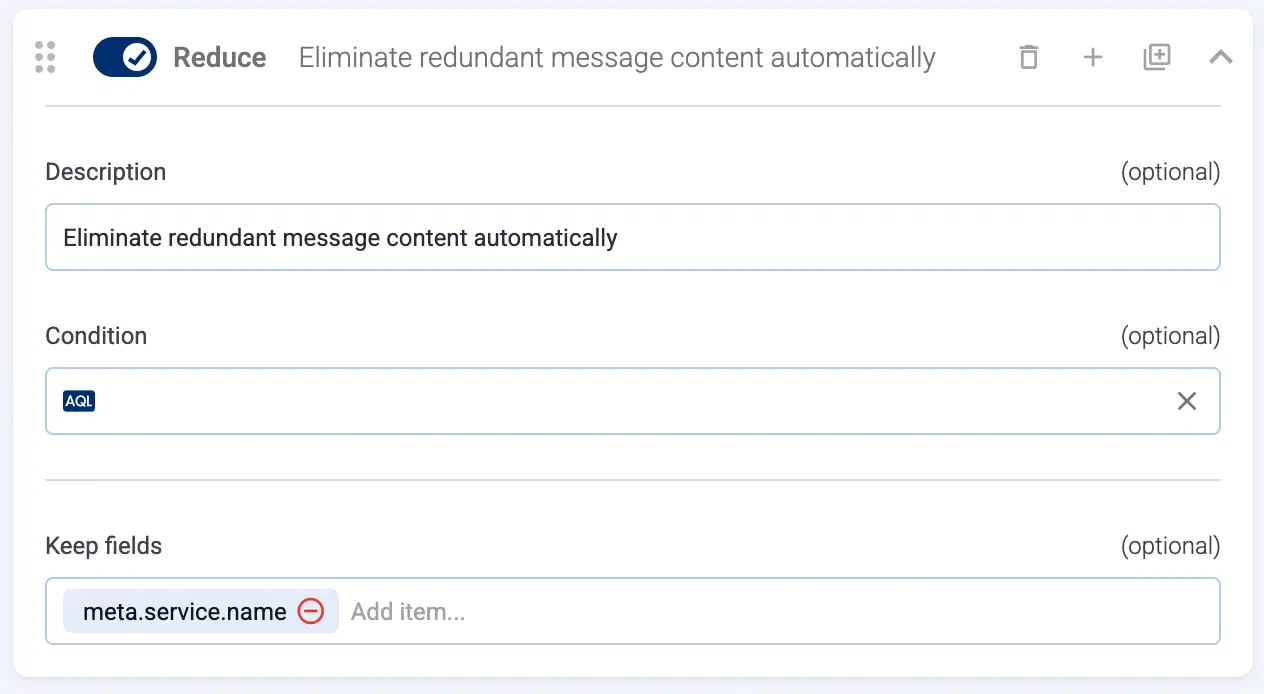
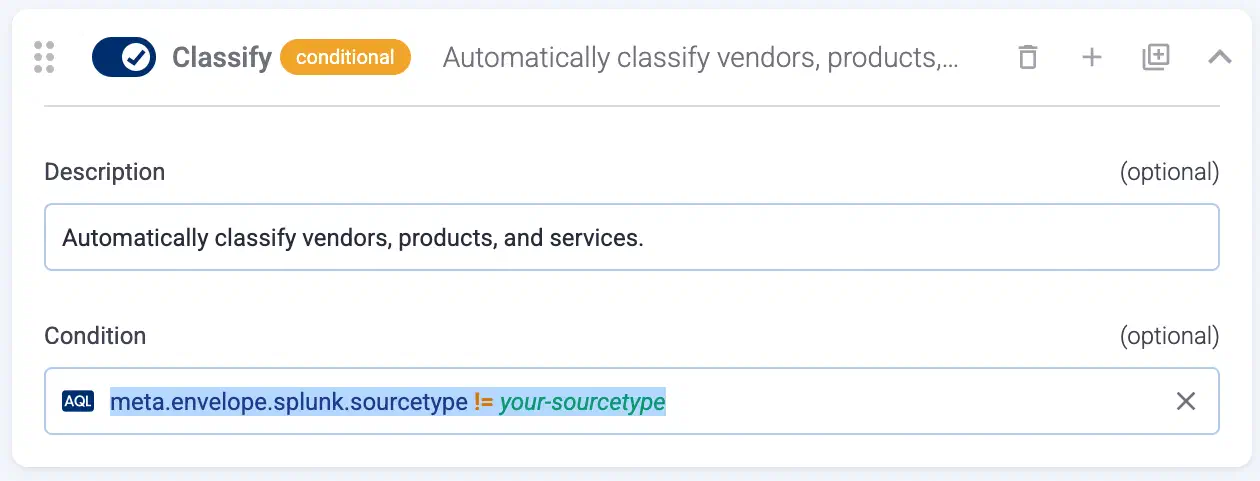
Add a Classify, a Parse, and a Reduce step, in that order, to automatically remove redundant and empty fields from your data.
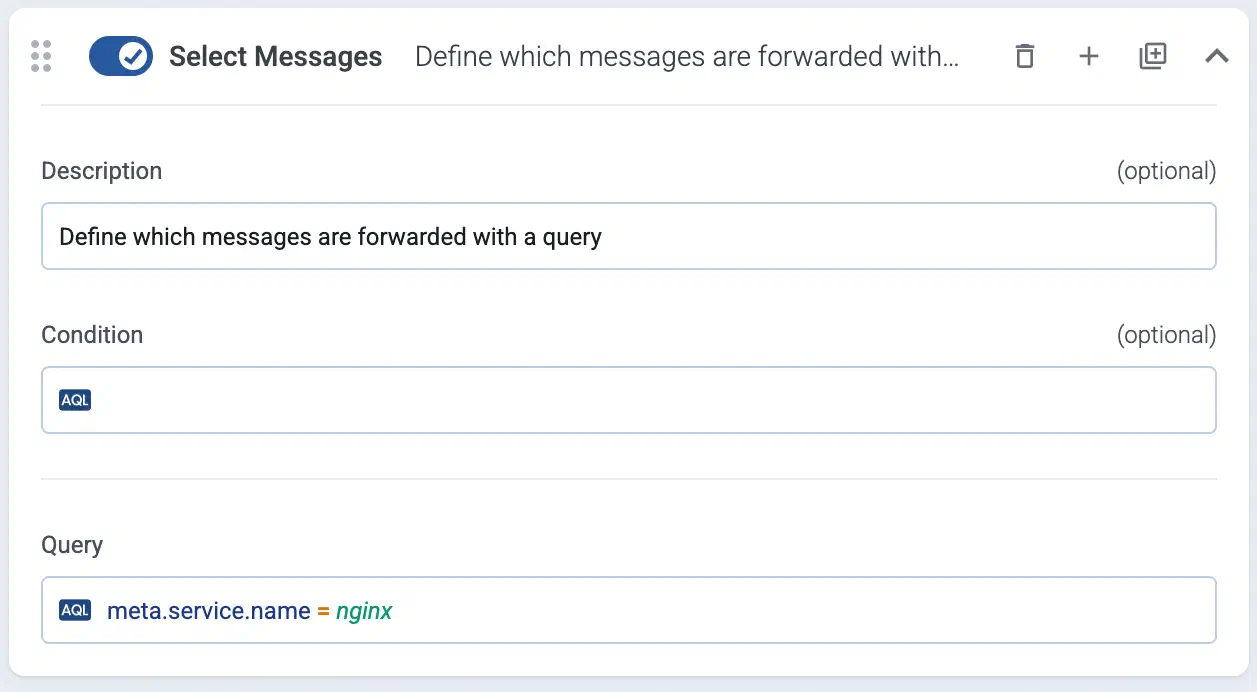
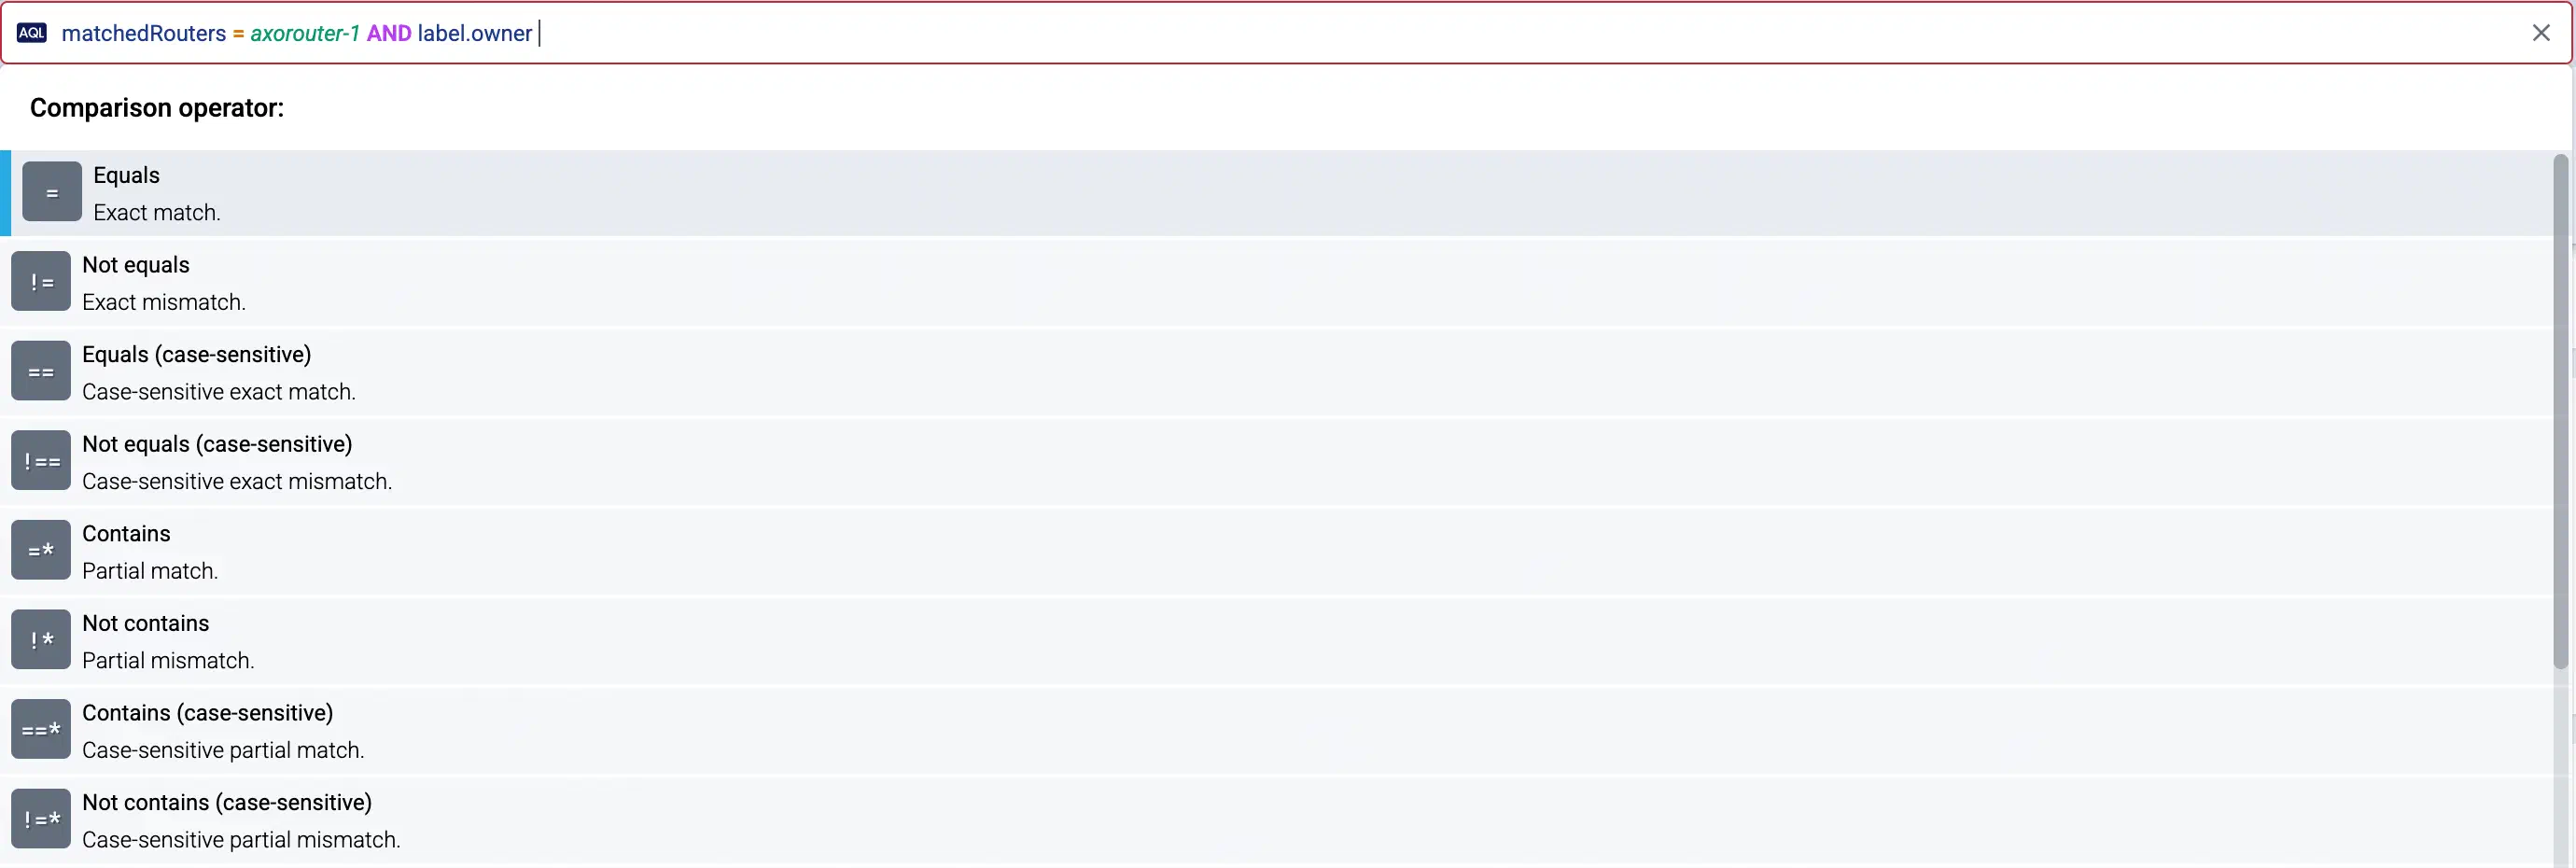
To select which messages are processed by the flow, add a Select Messages step, and enter a filter into the AQL Expression field. For example, to select only the messages received from Fortinet FortiGate firewalls, use the meta.vendor = fortinet AND meta.product = fortigate query.
Save the processing steps.
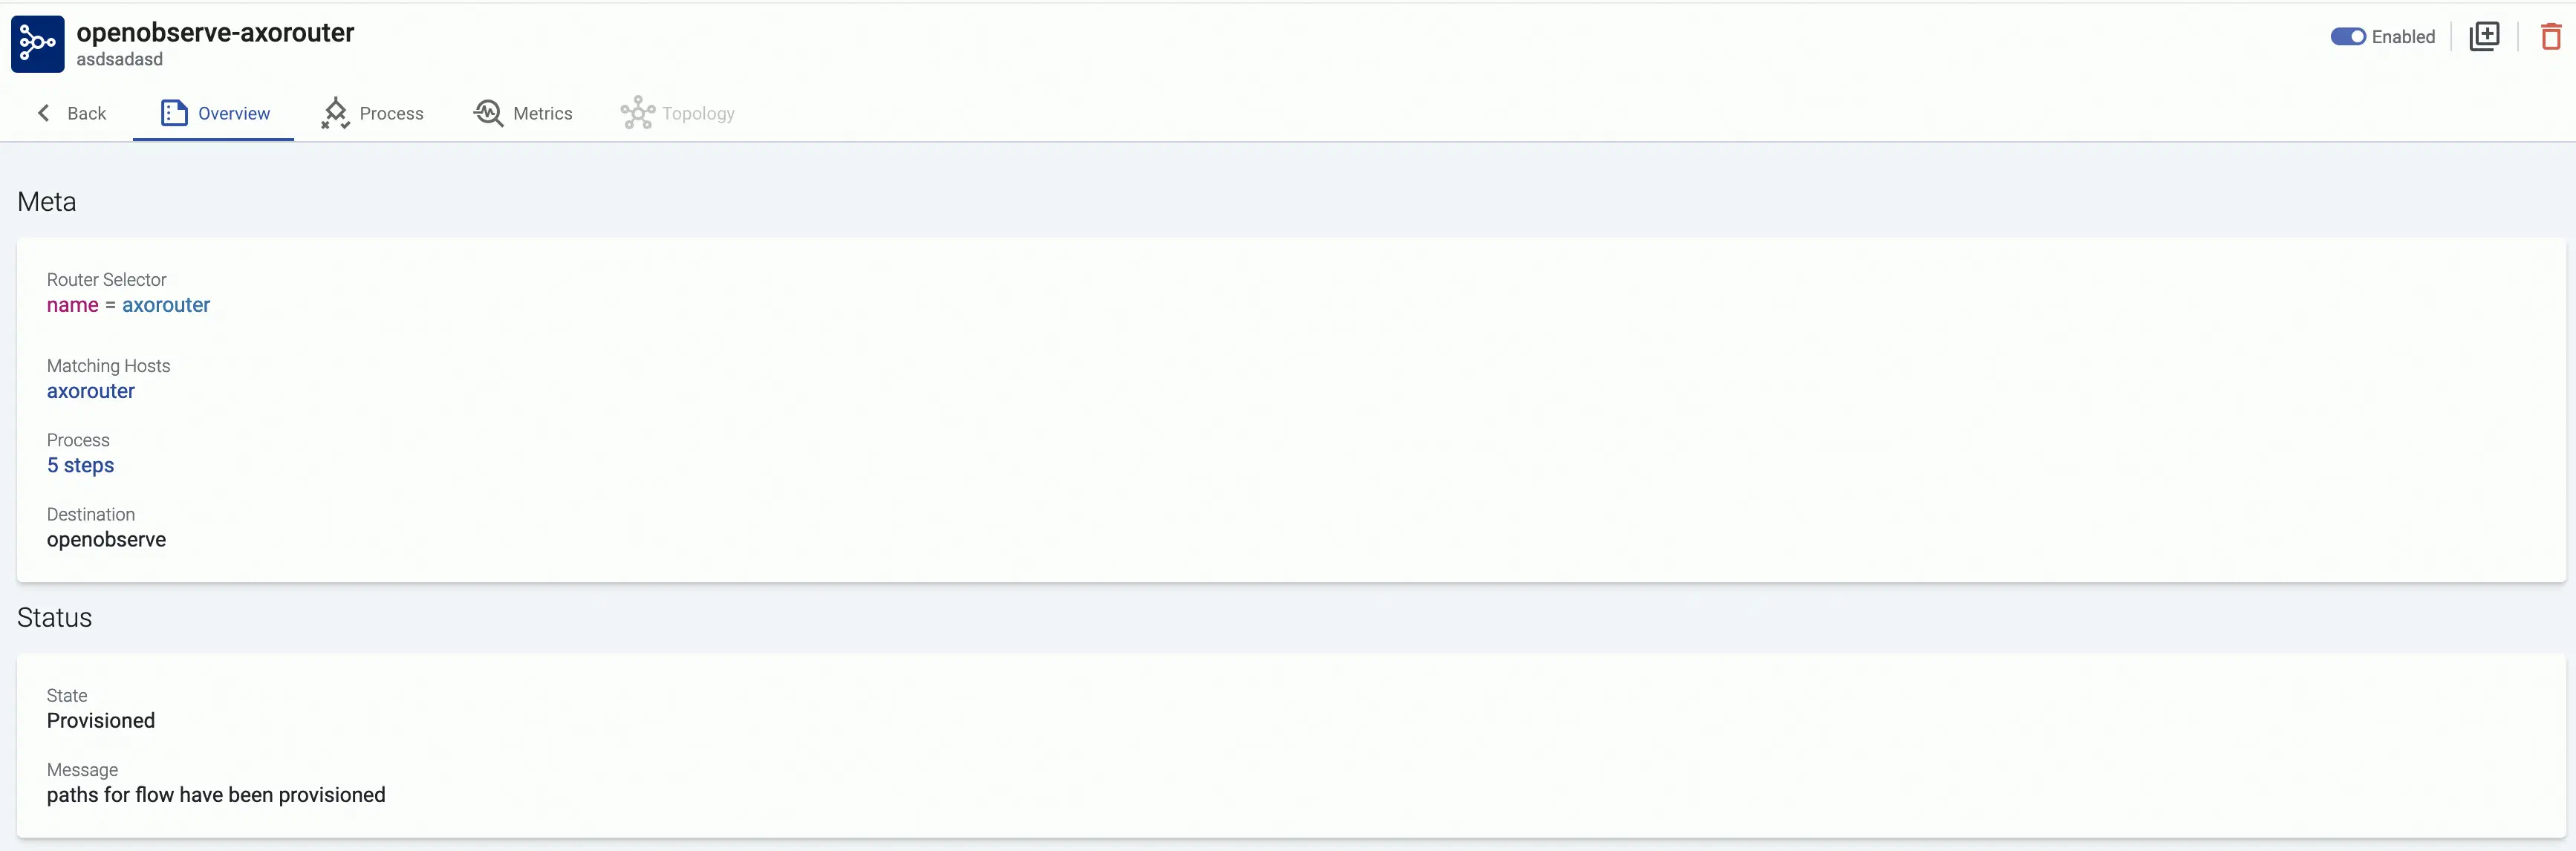
Select Add.
The new flow appears in the Flows list.
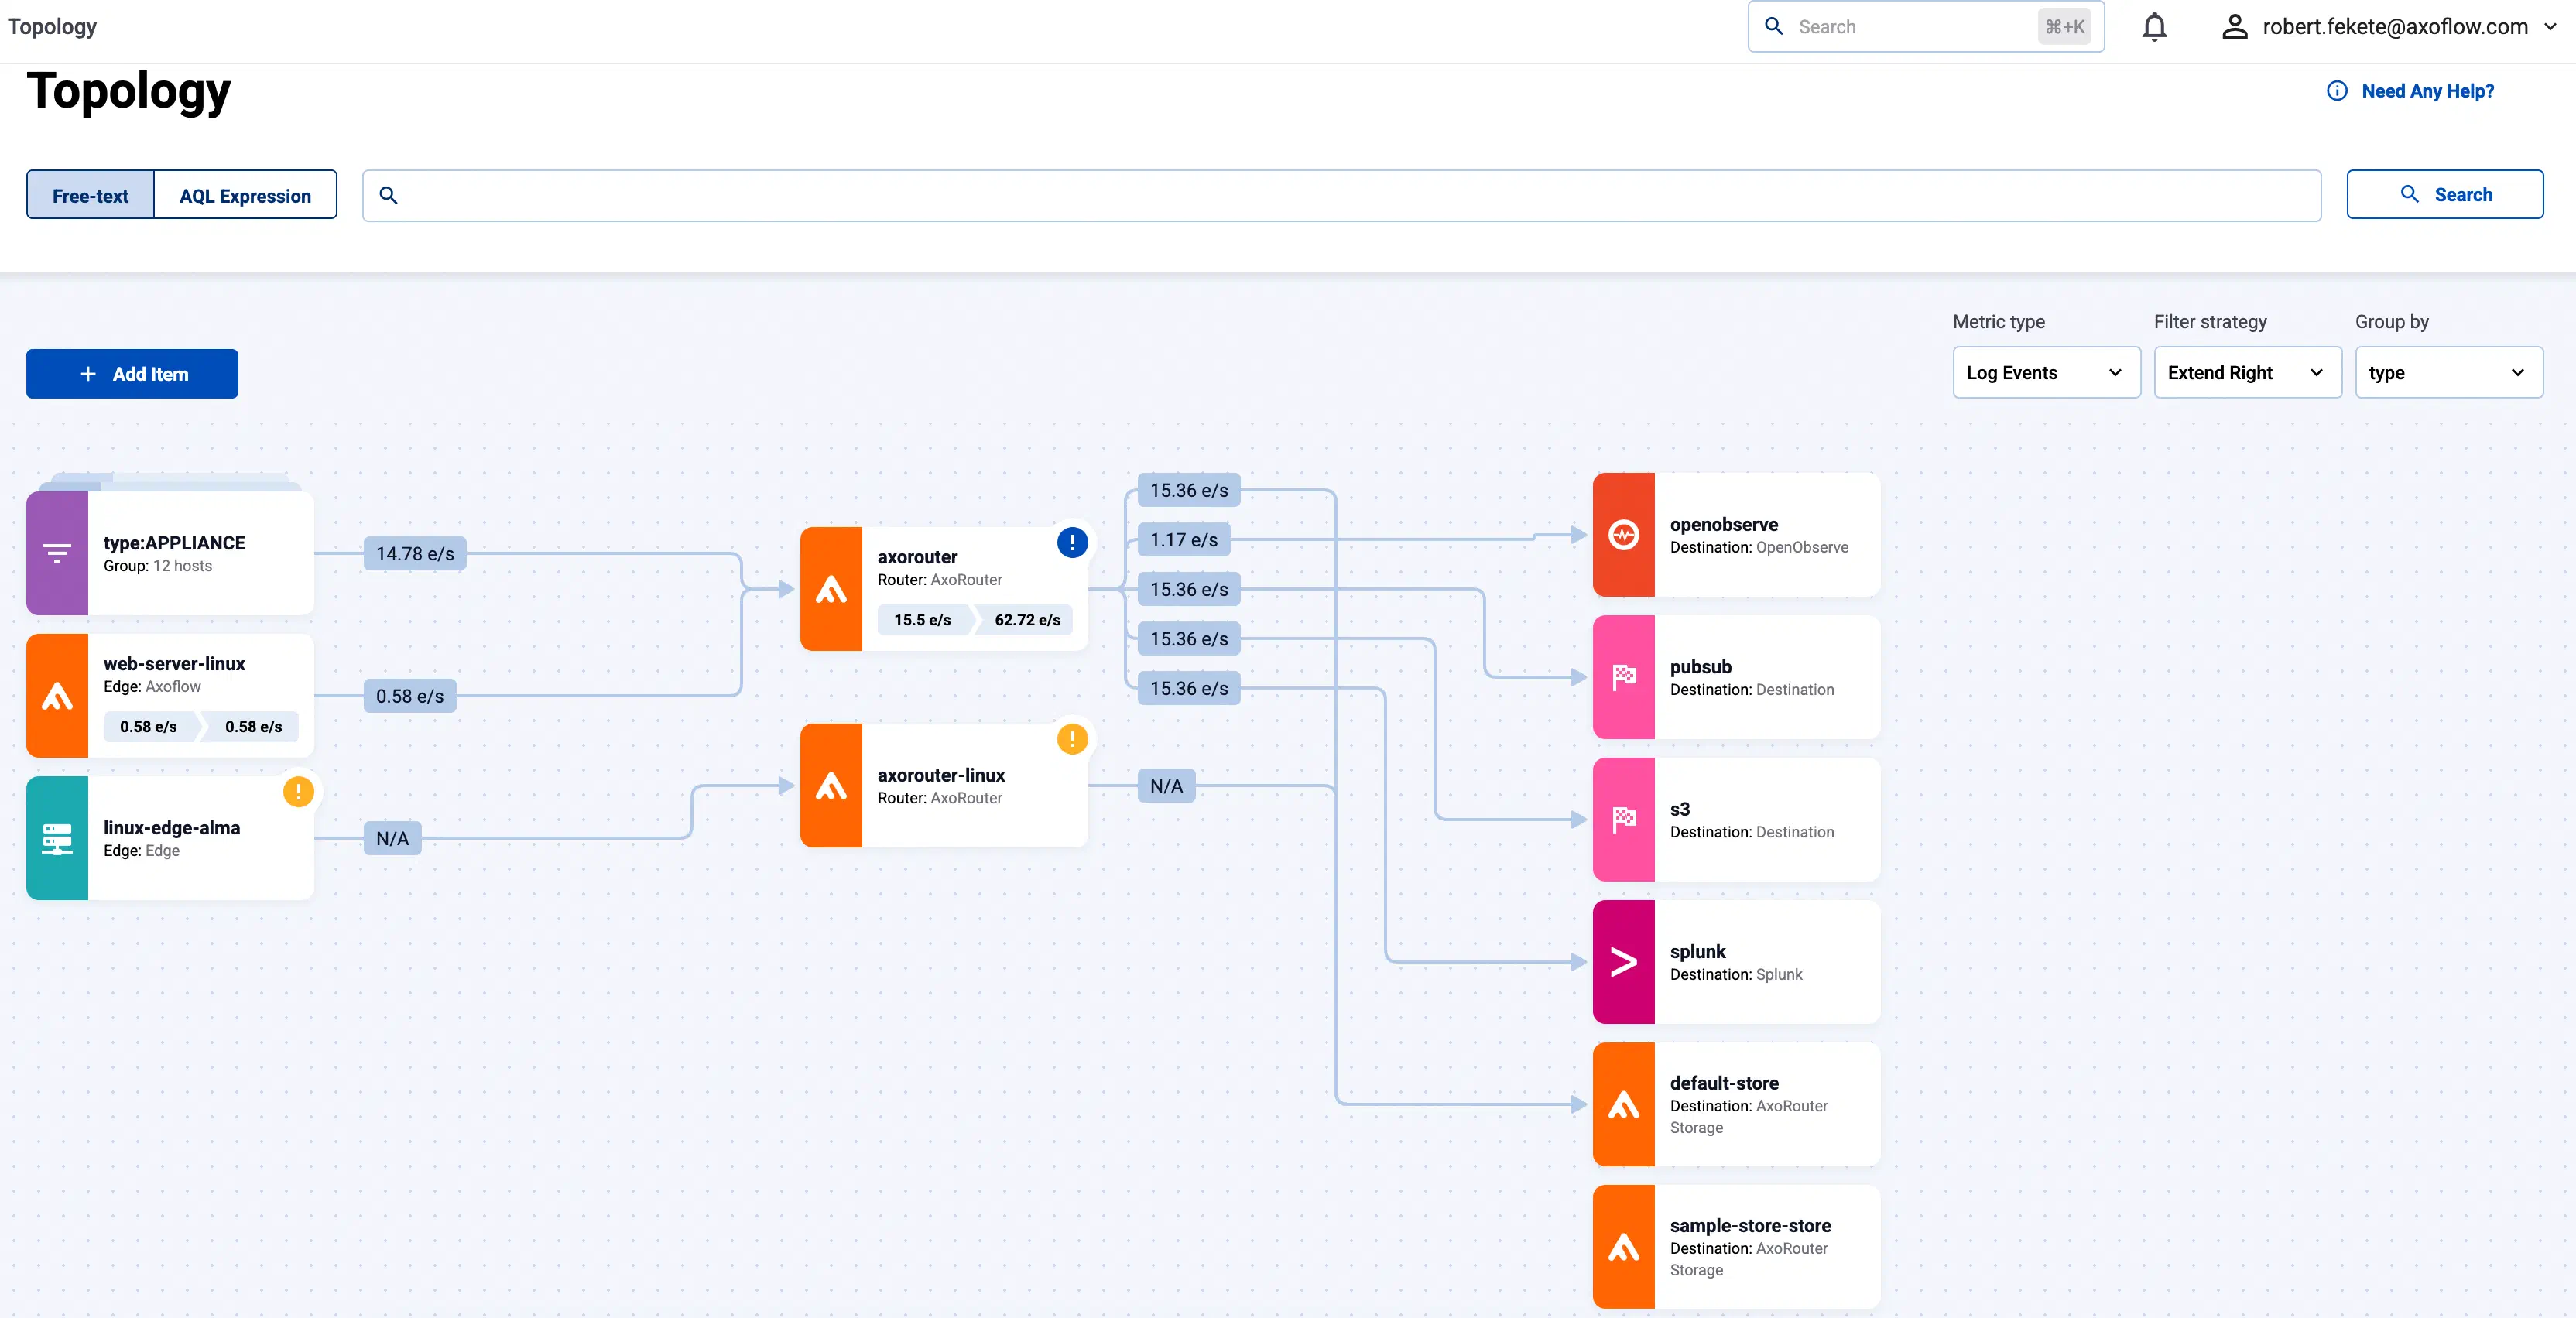
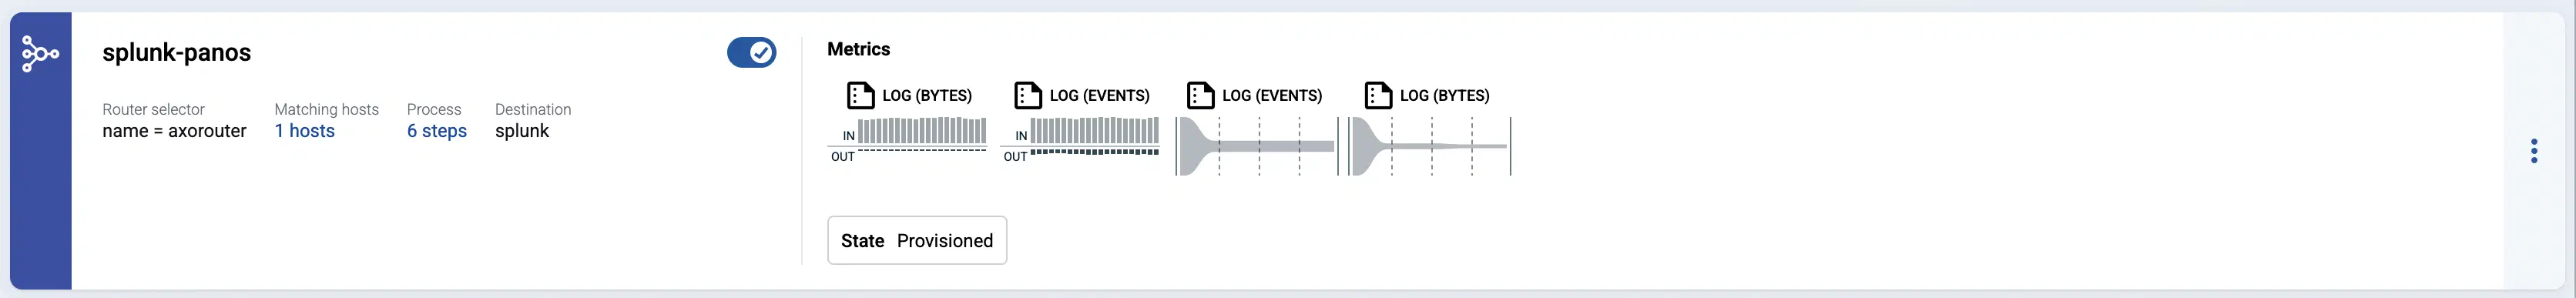
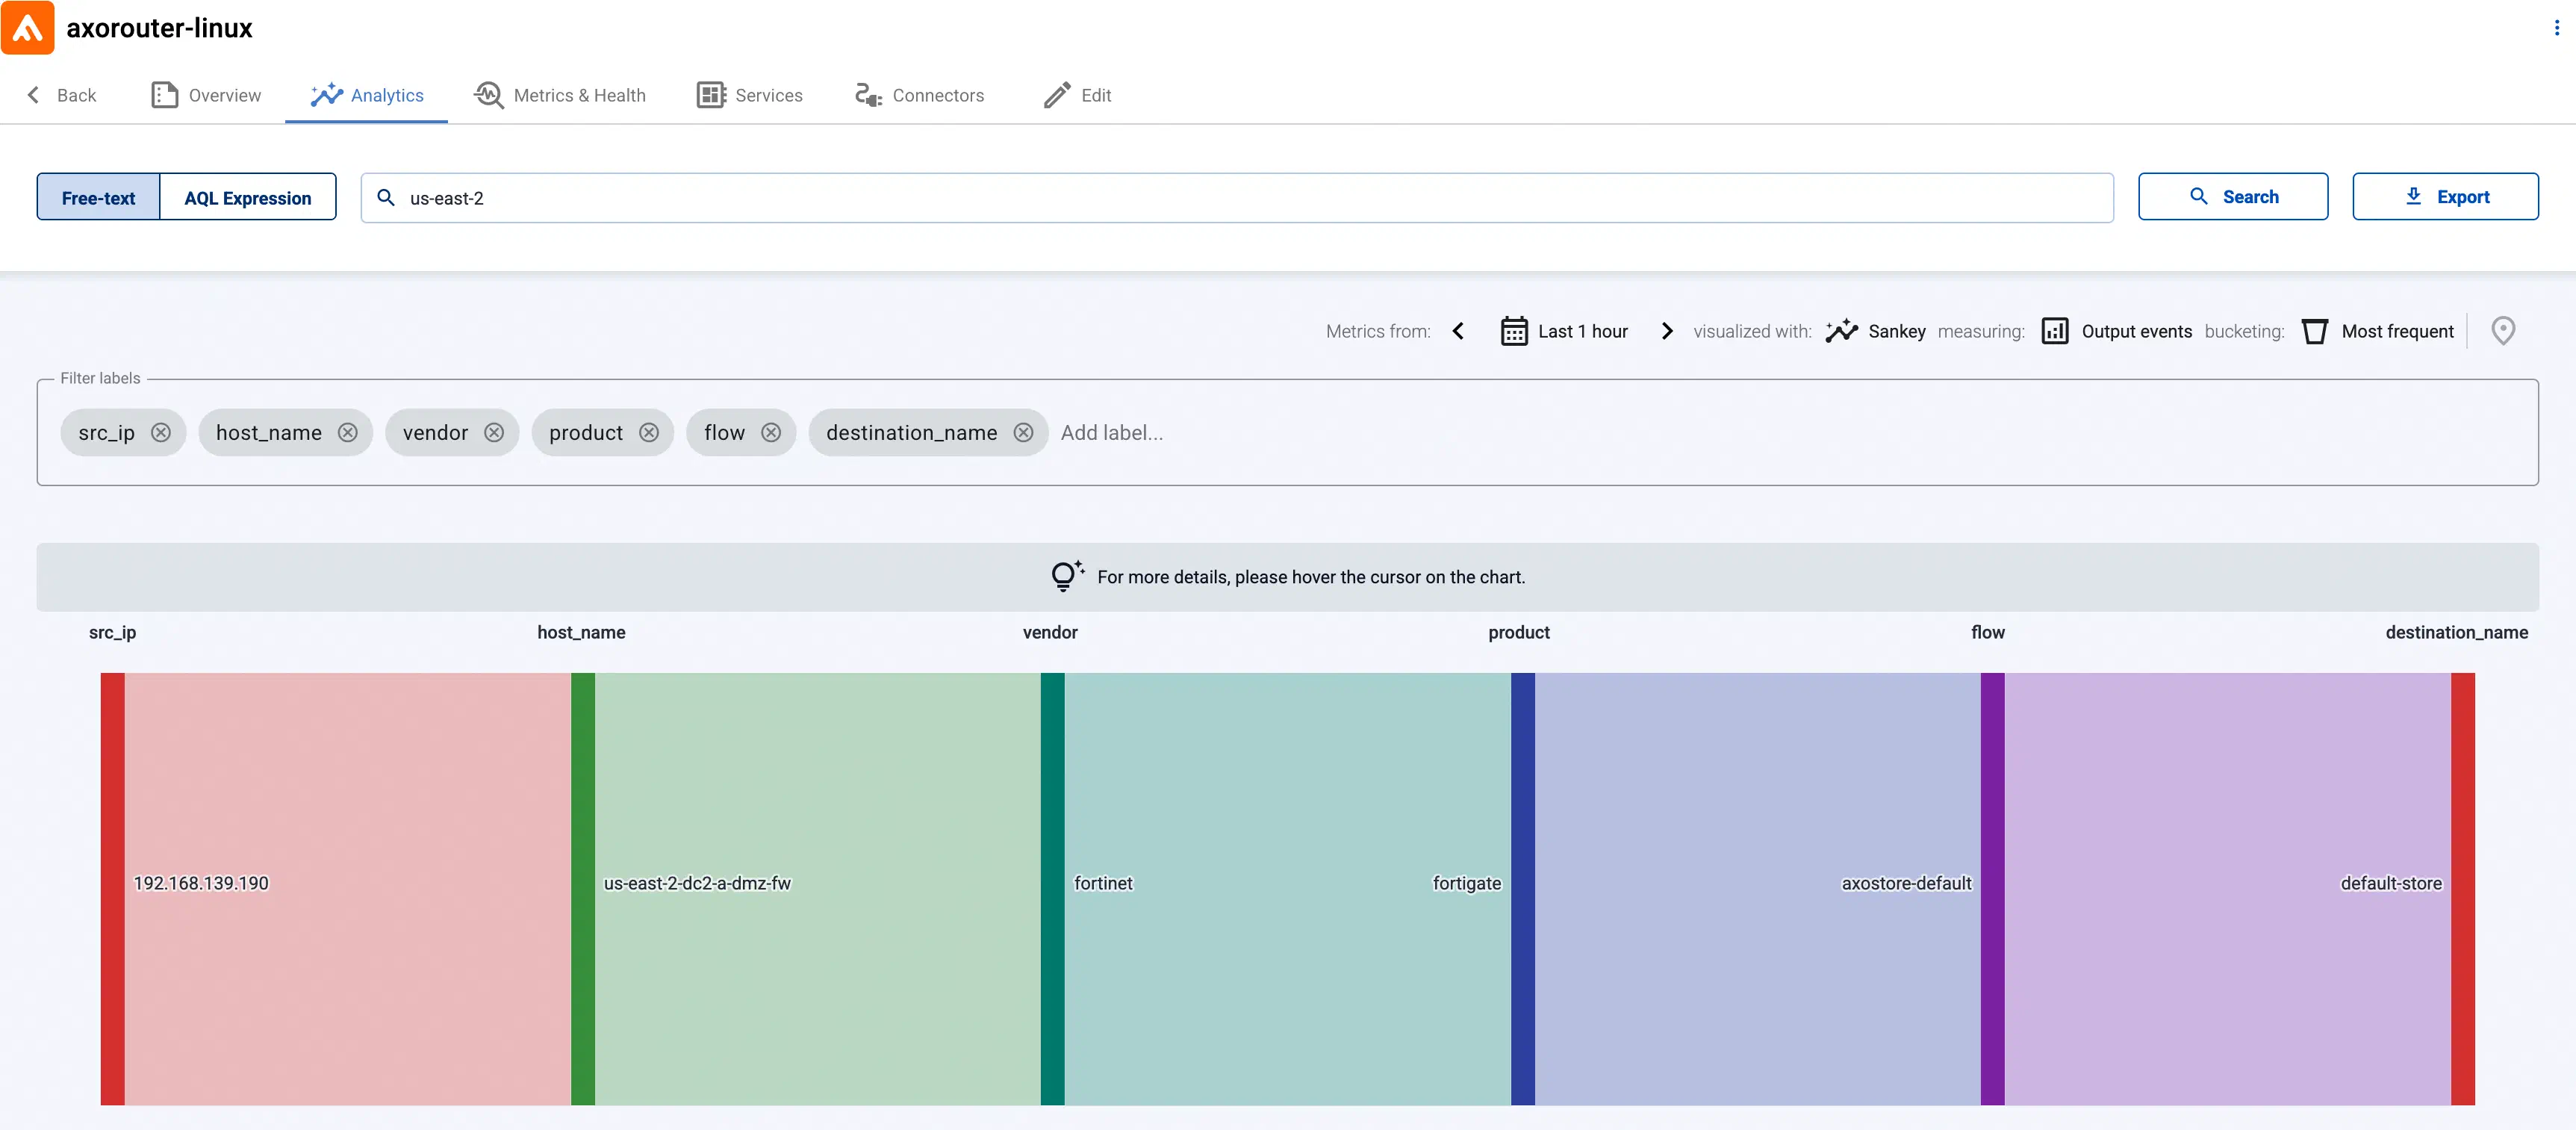
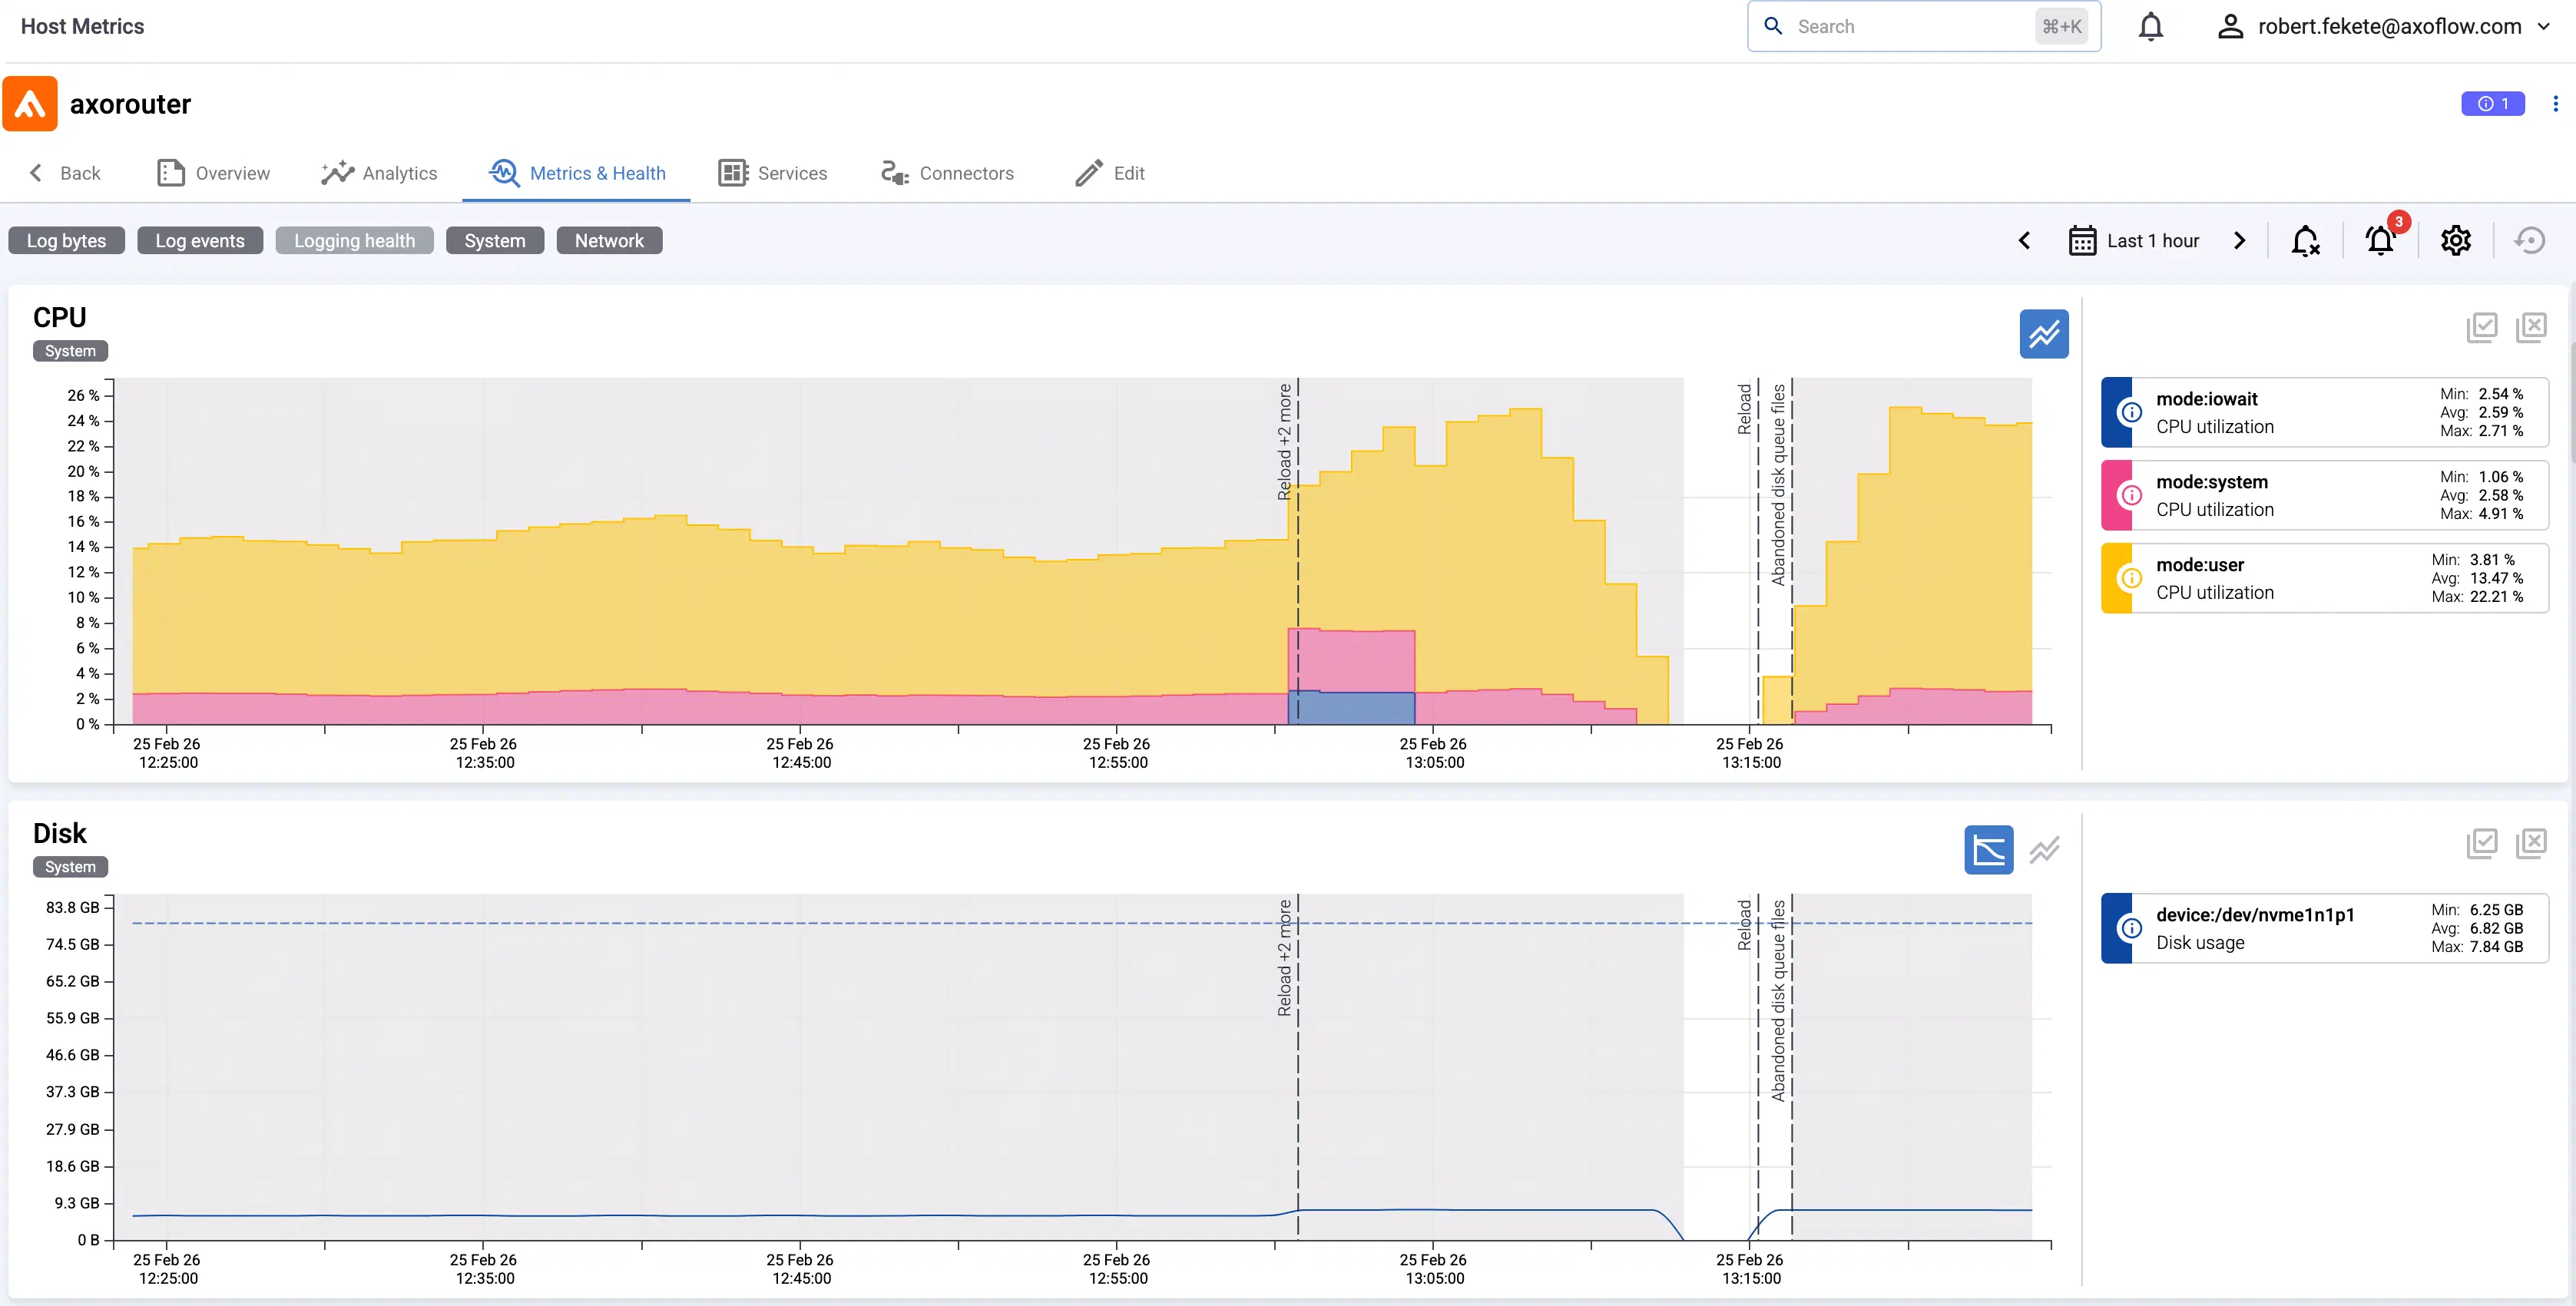
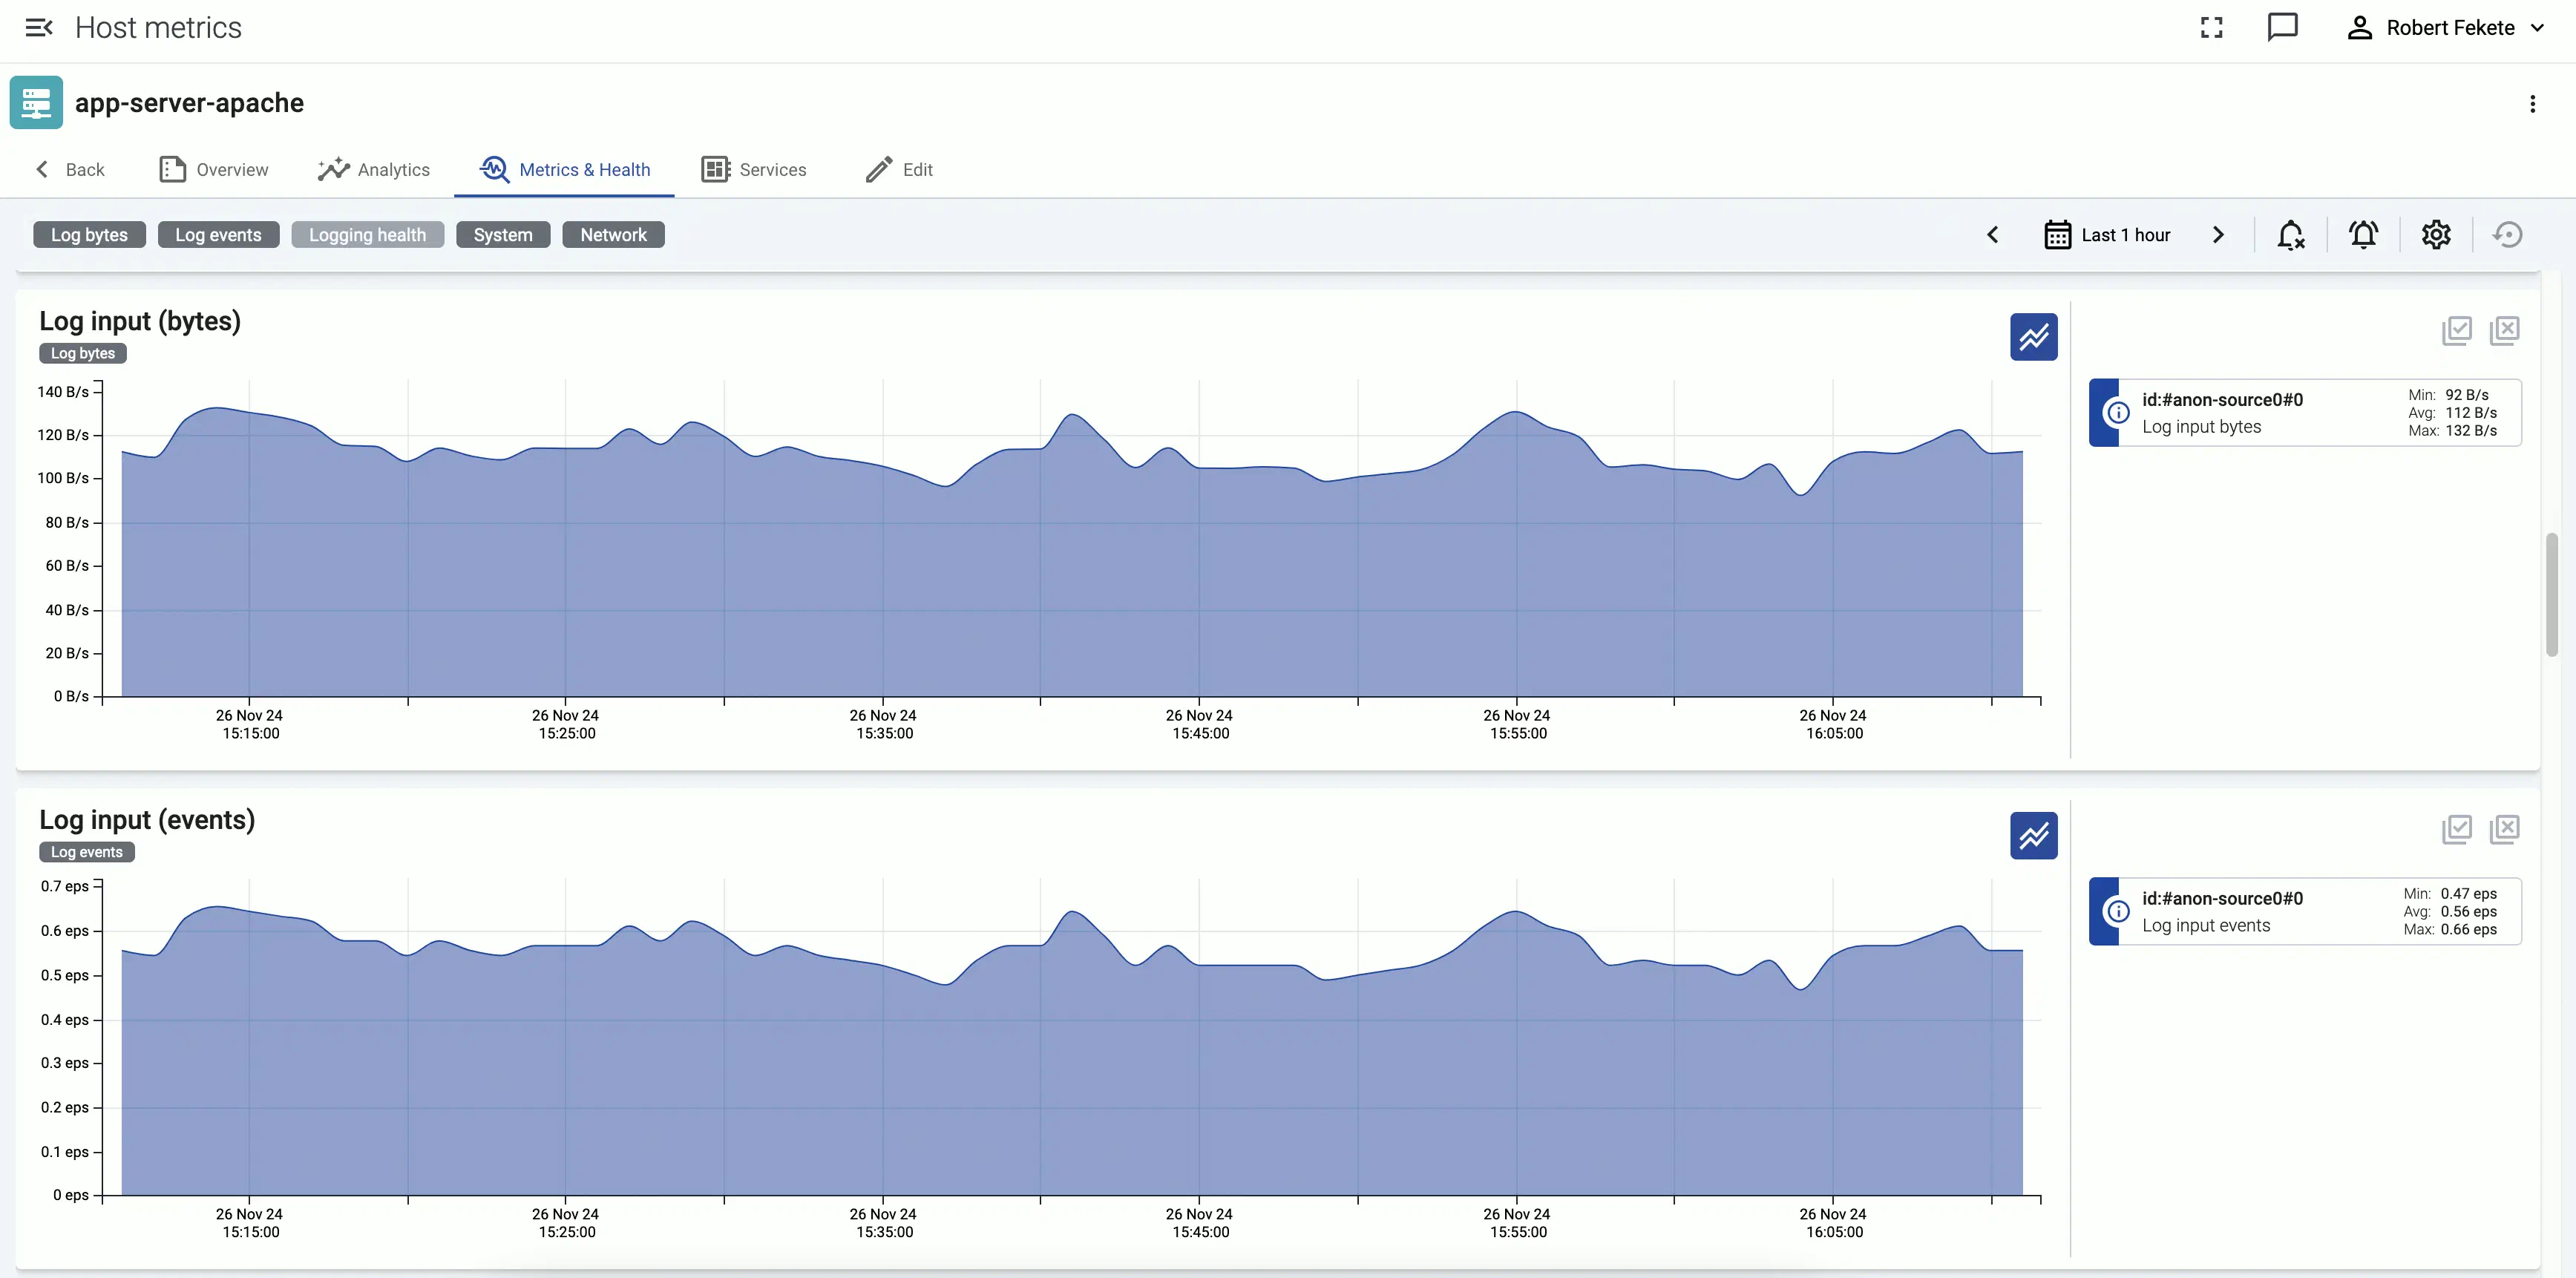
Check the metrics on the Topology page
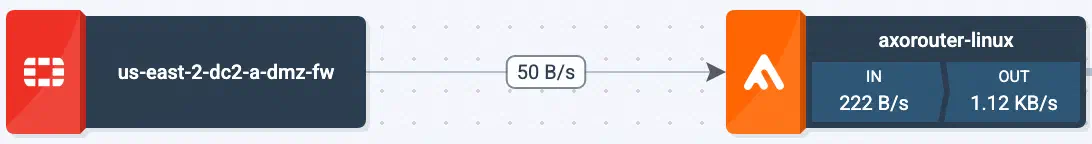
Open the Topology page and verify that your AxoRouter instance is connected both to the source and the destination.
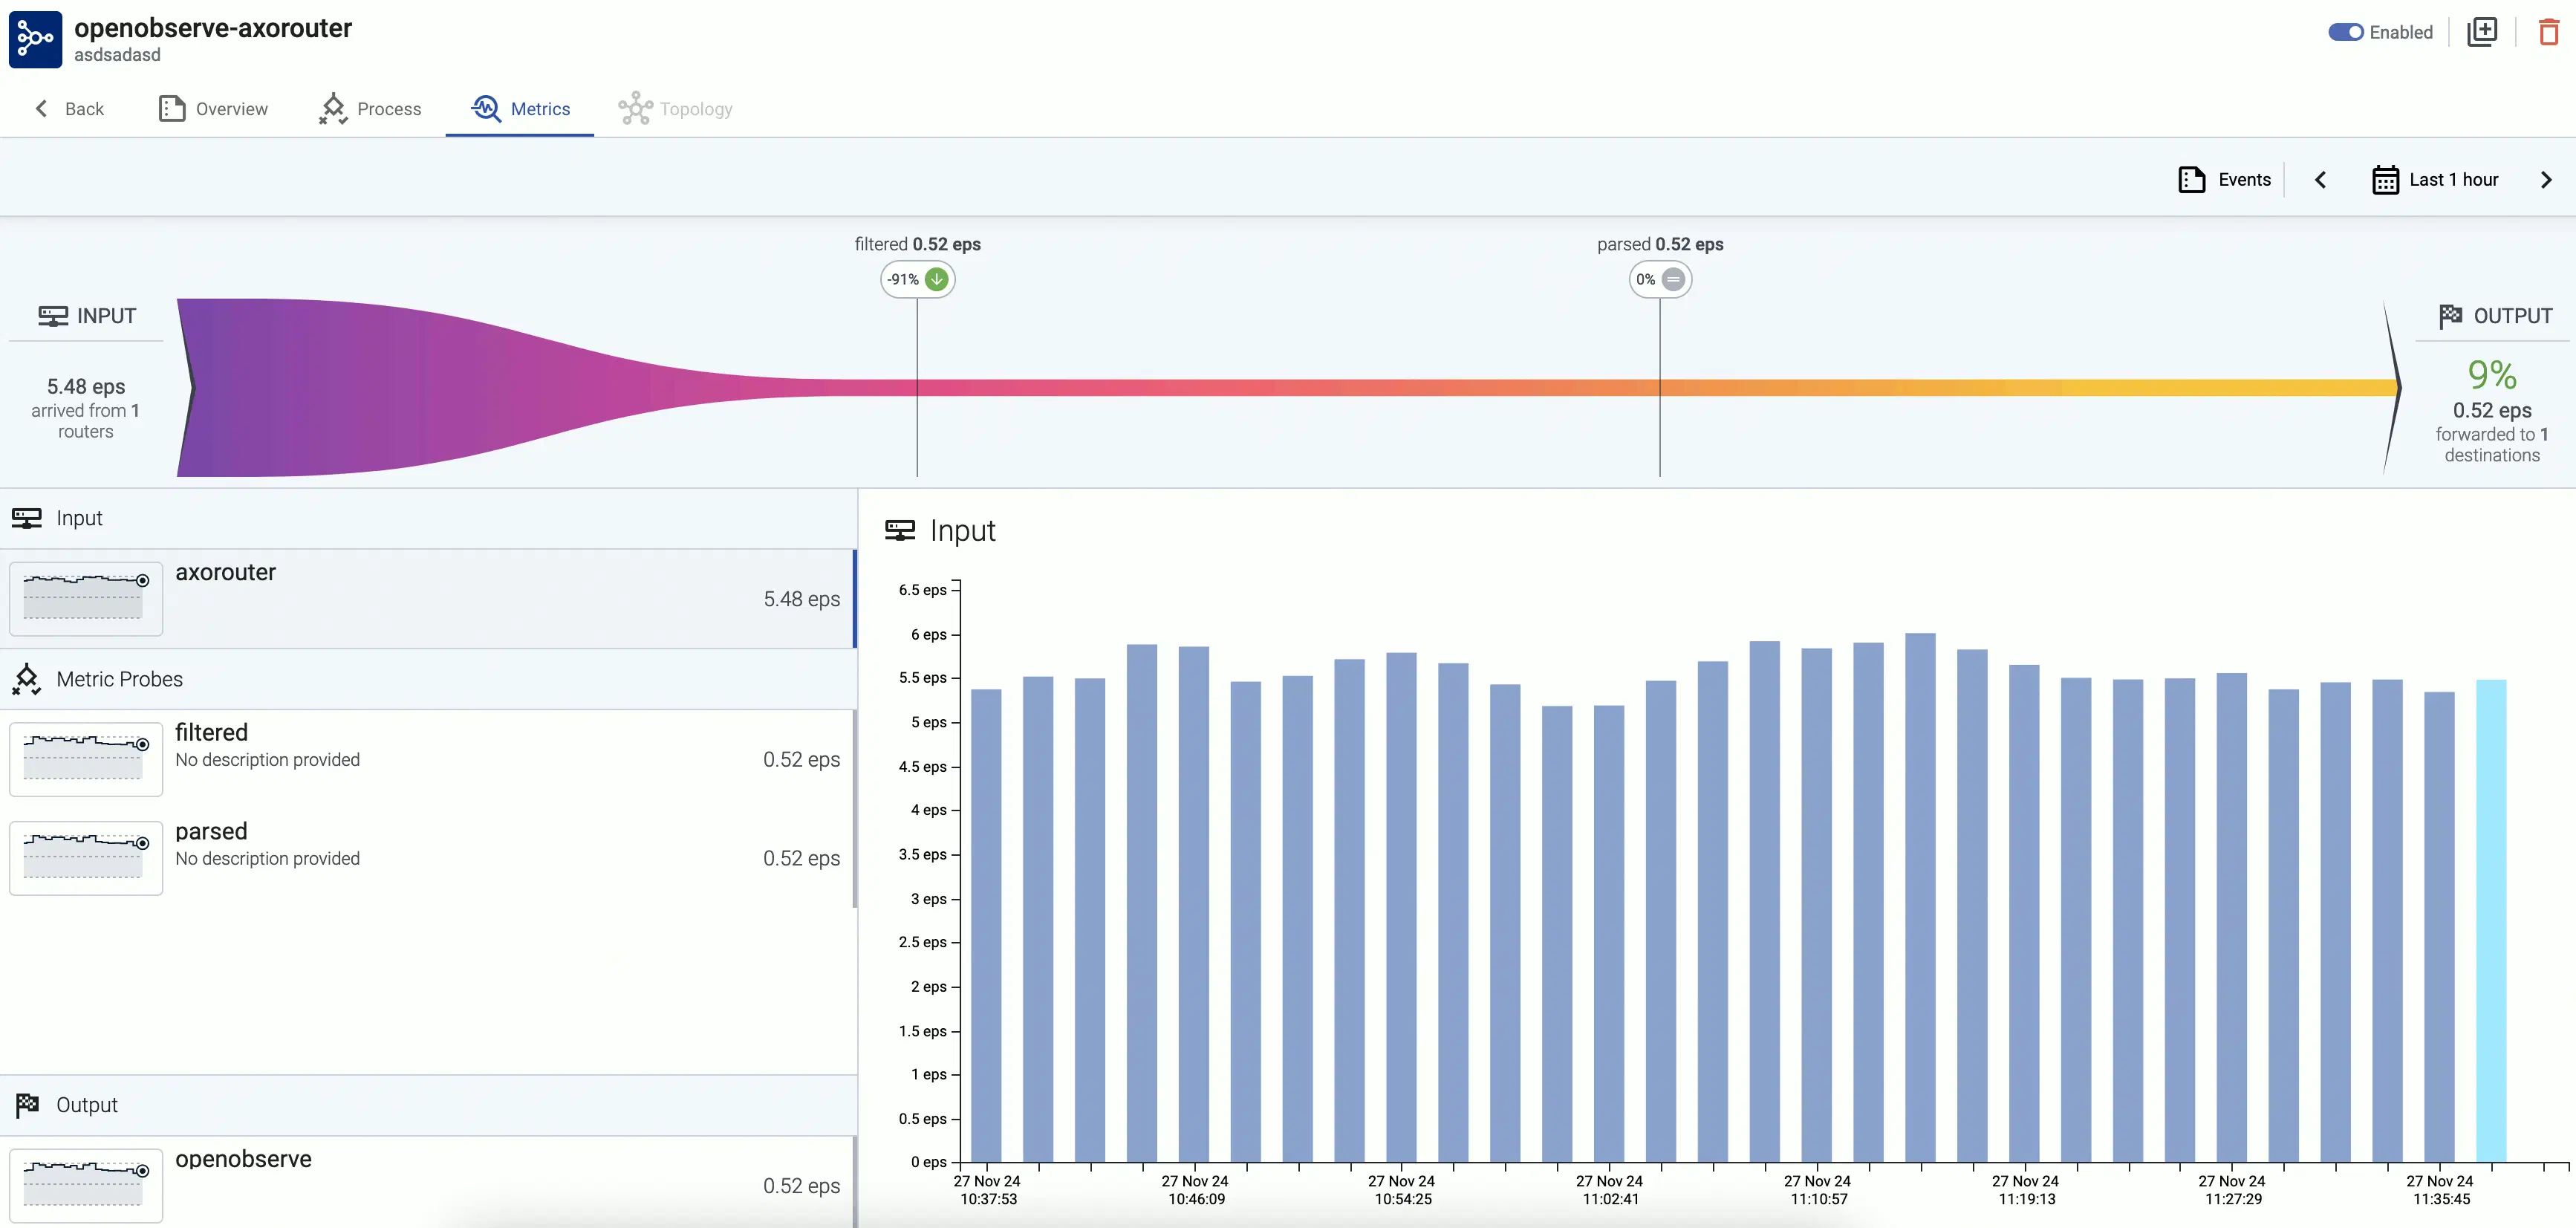
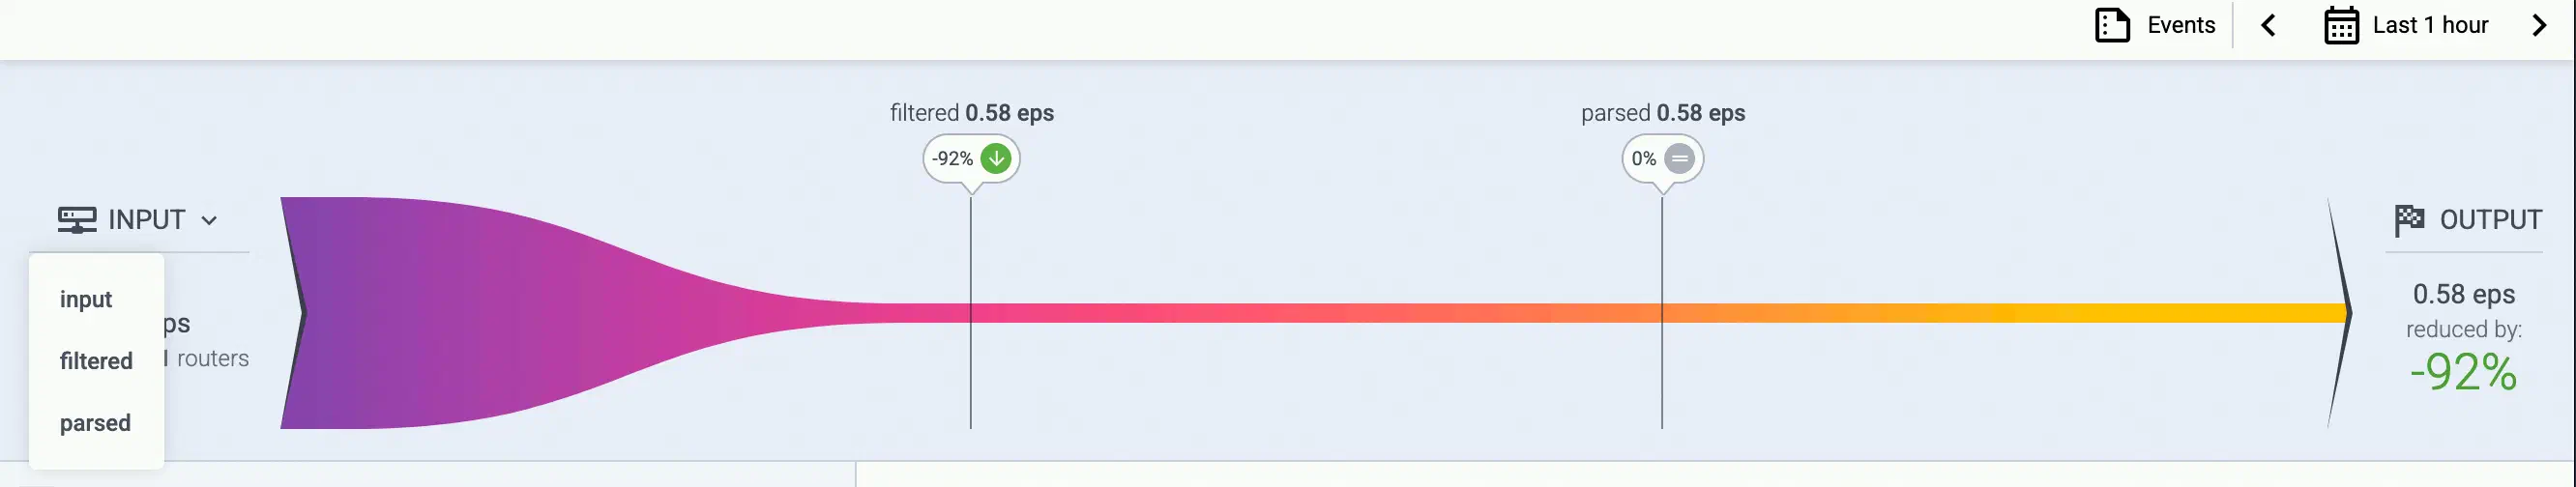
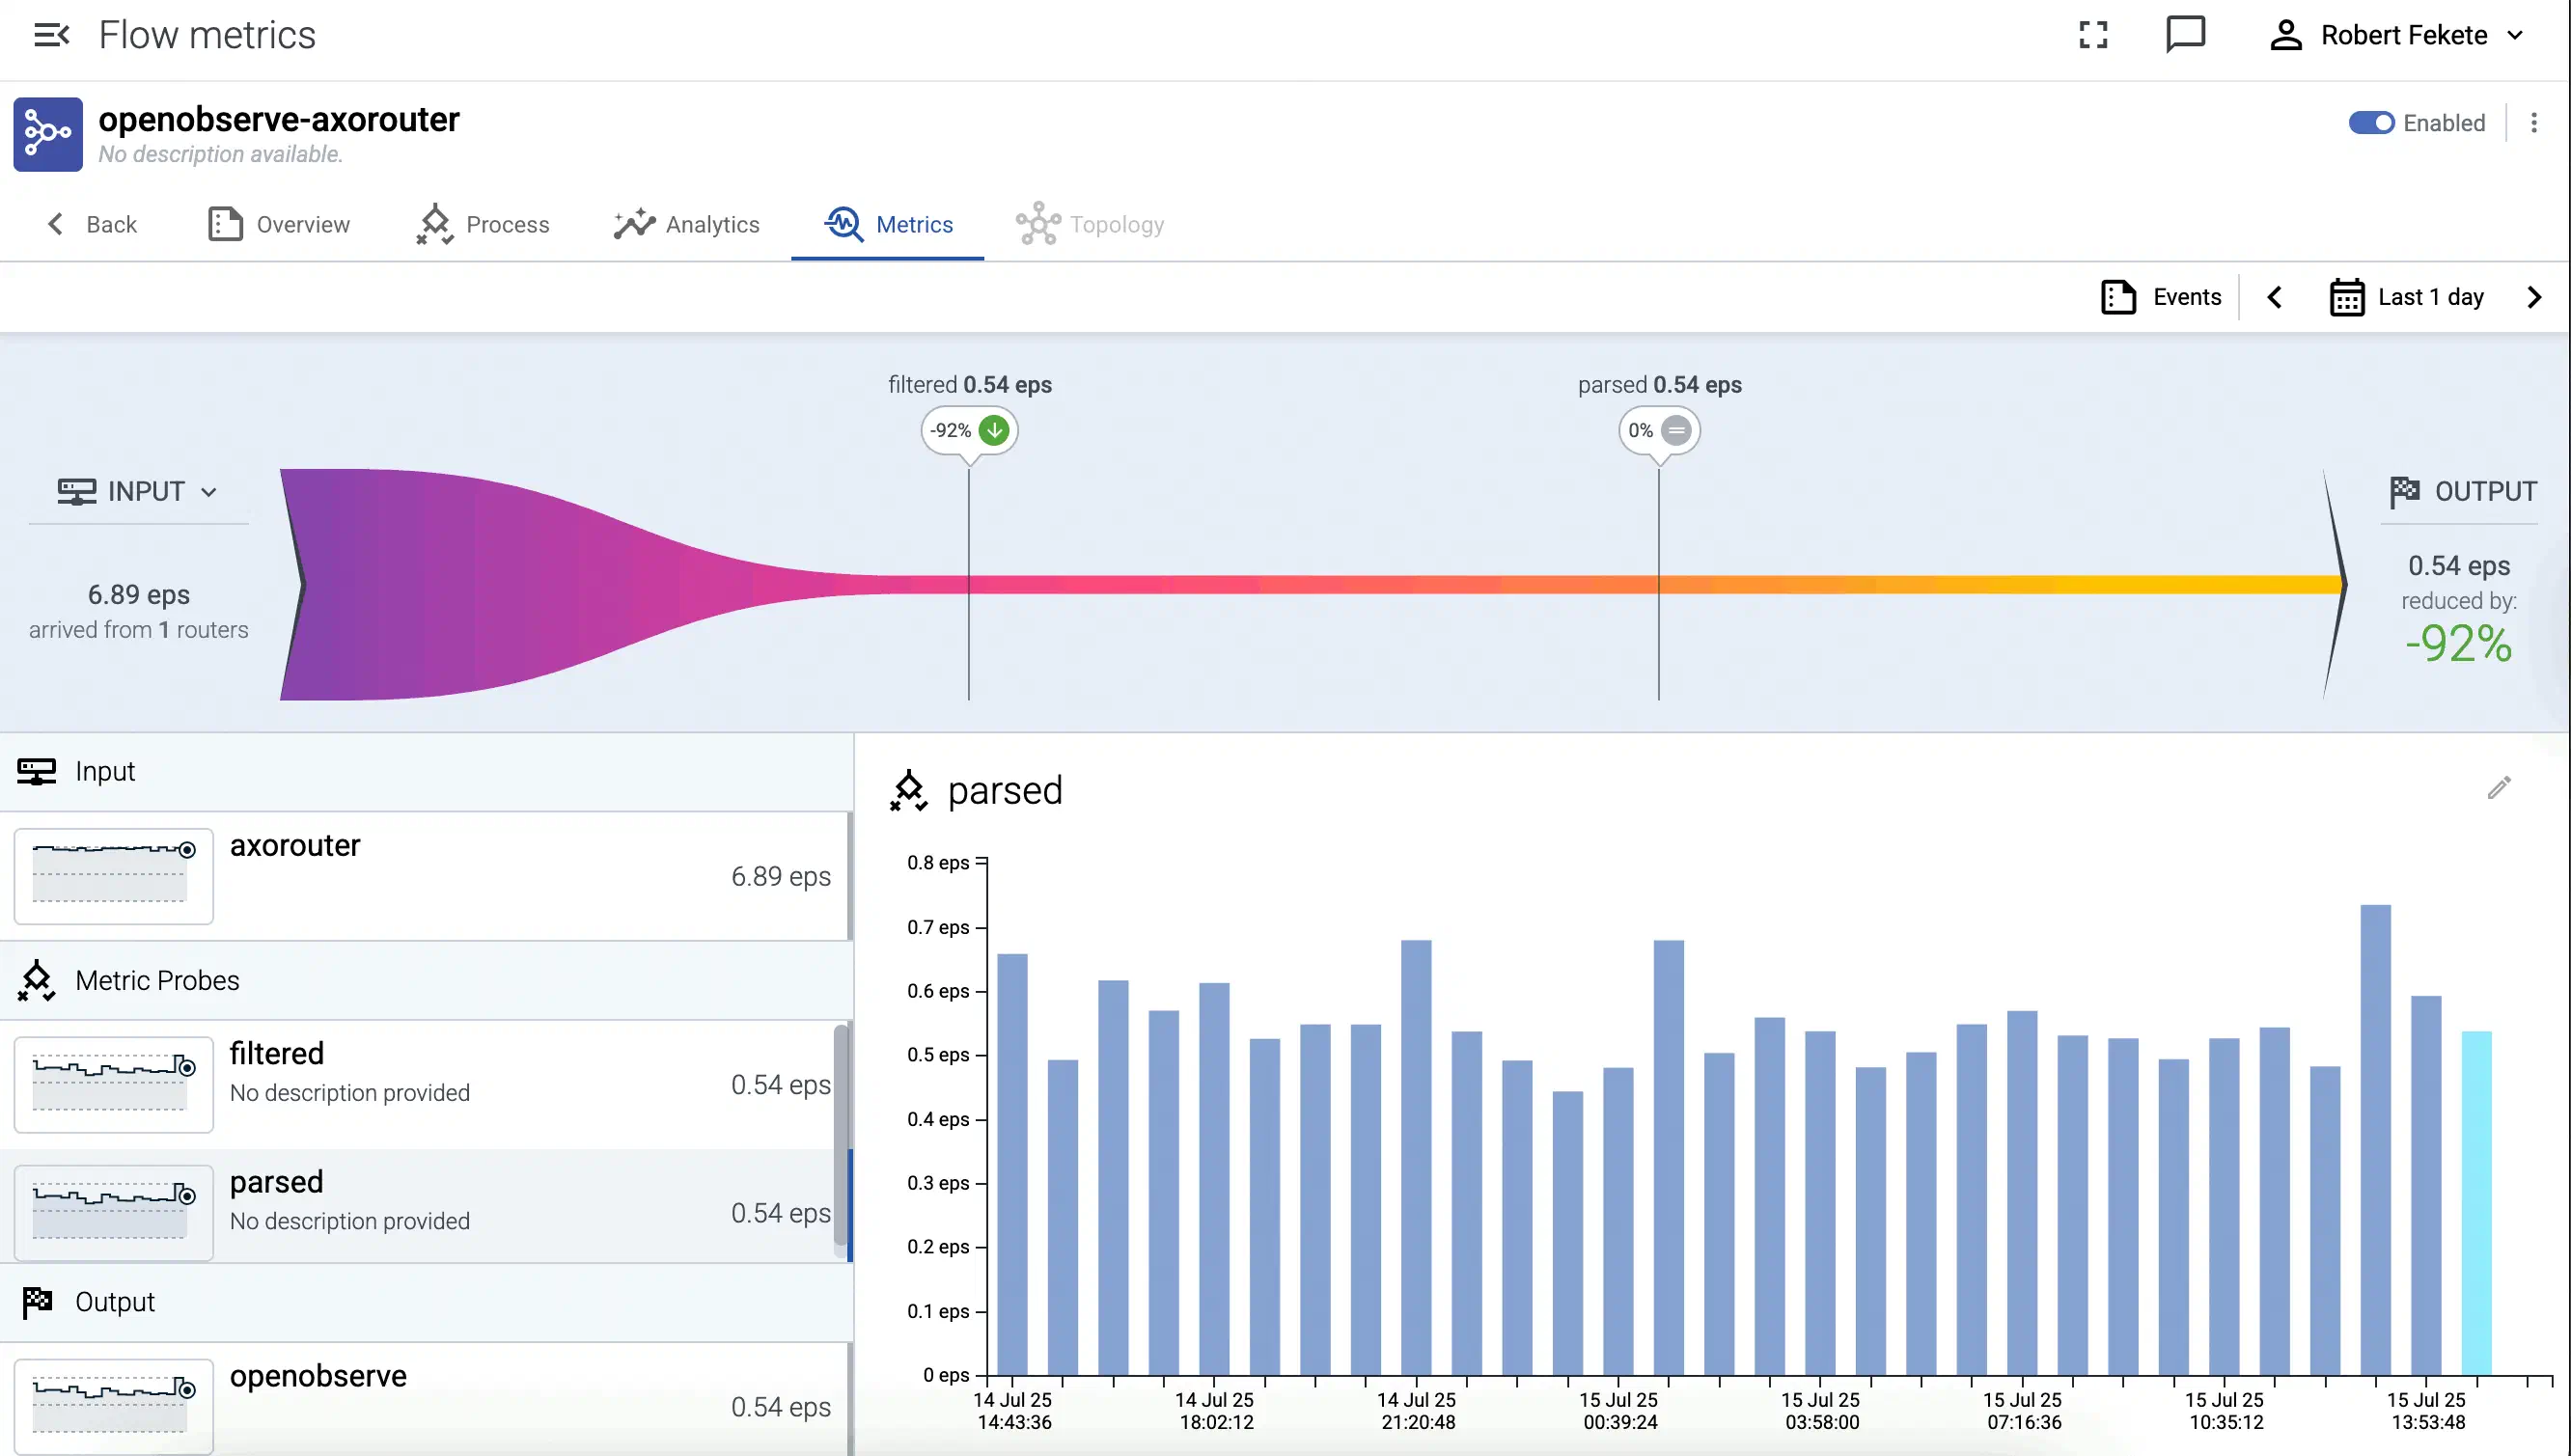
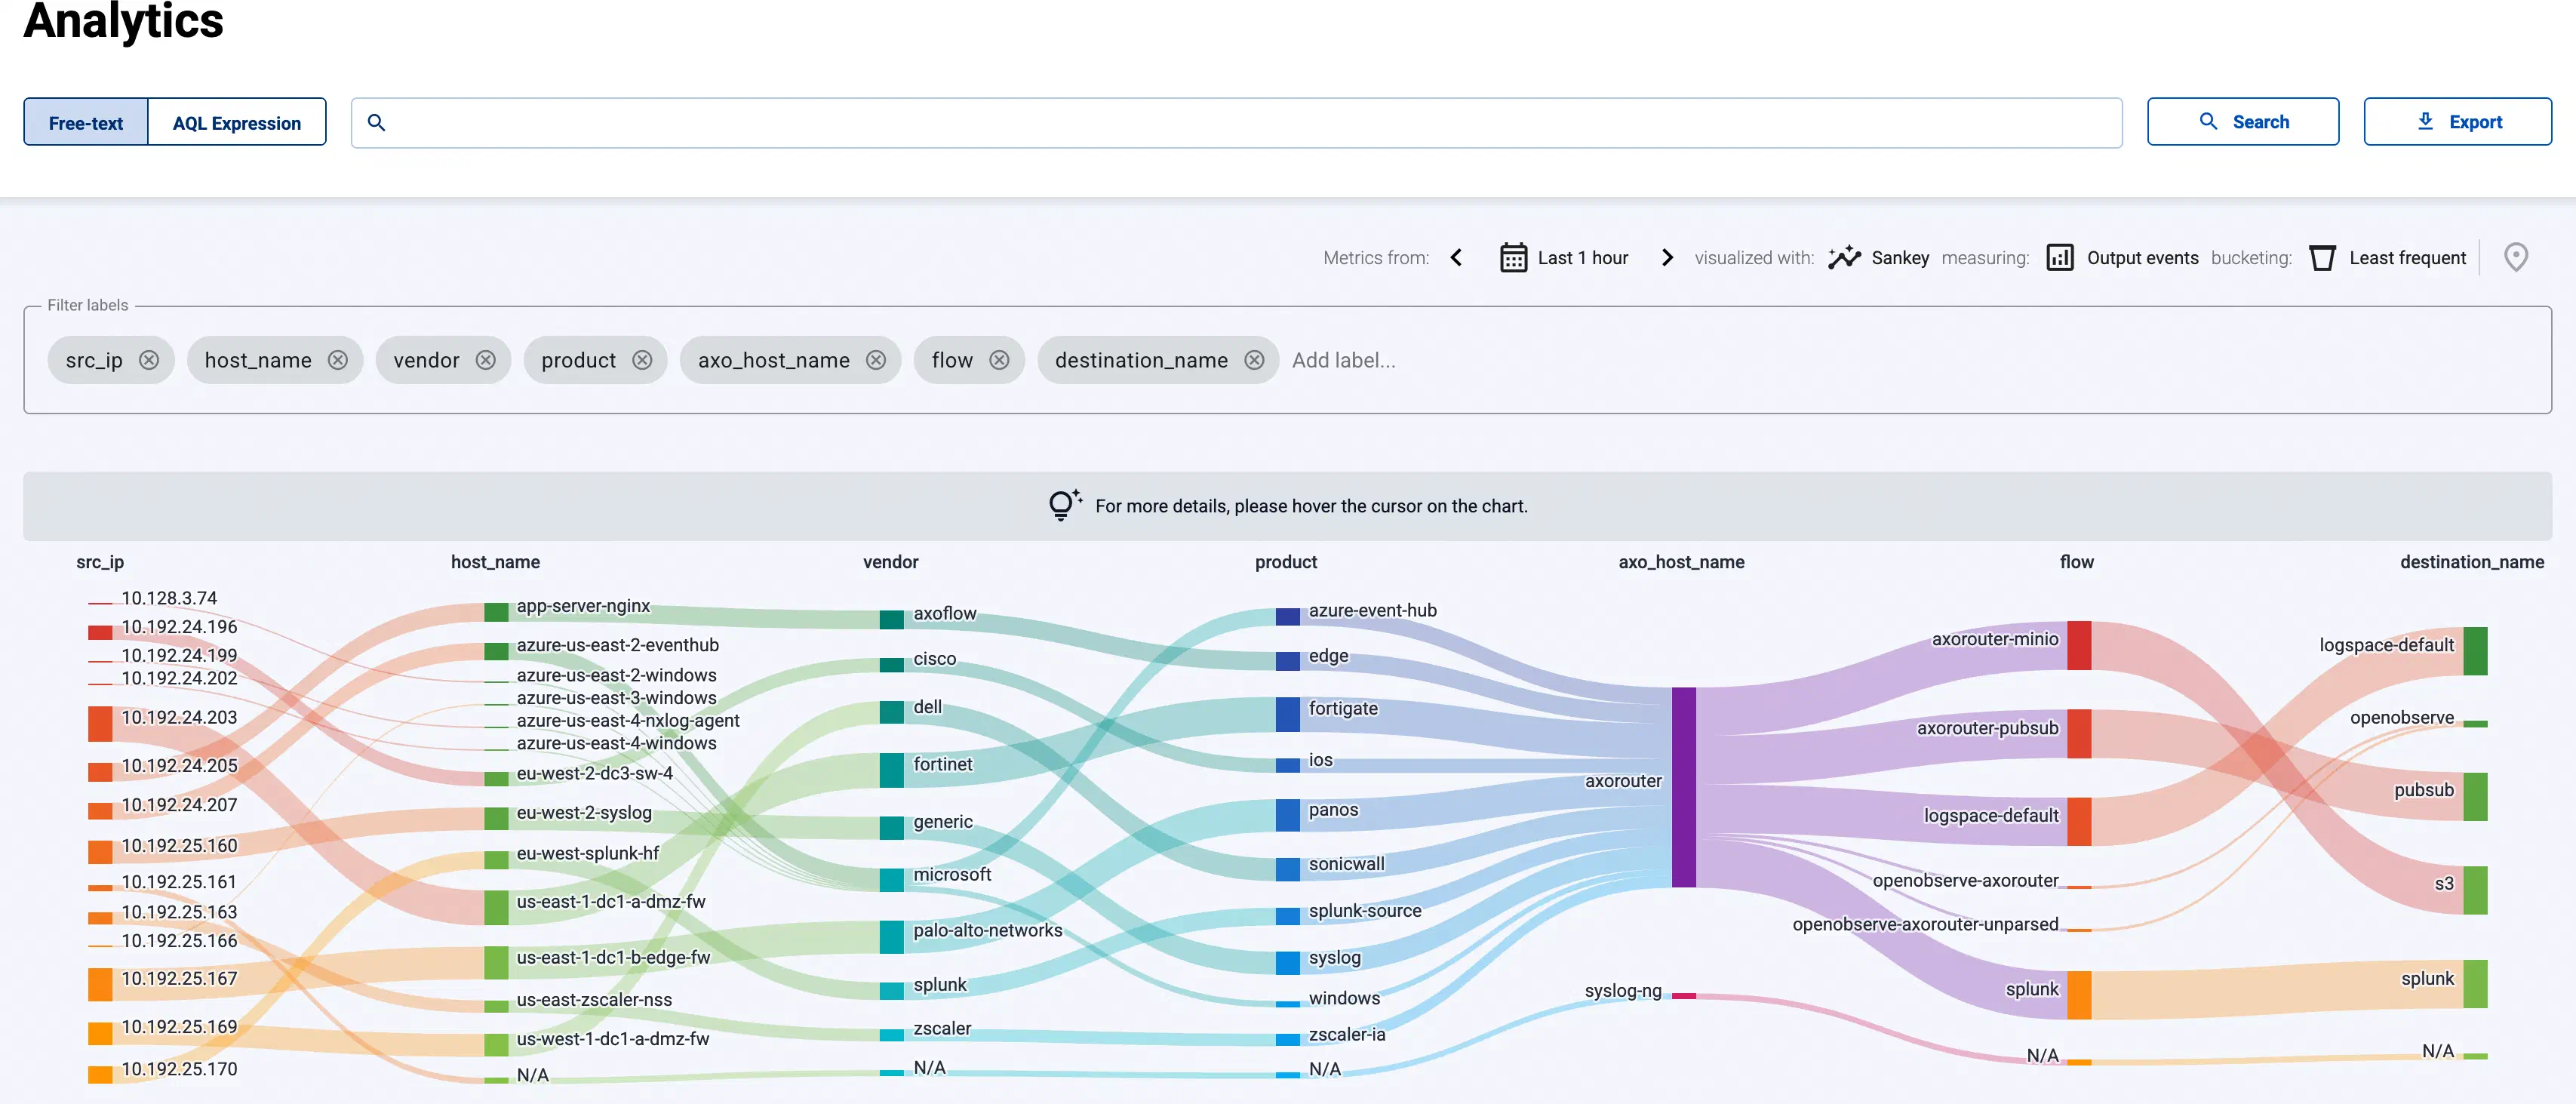
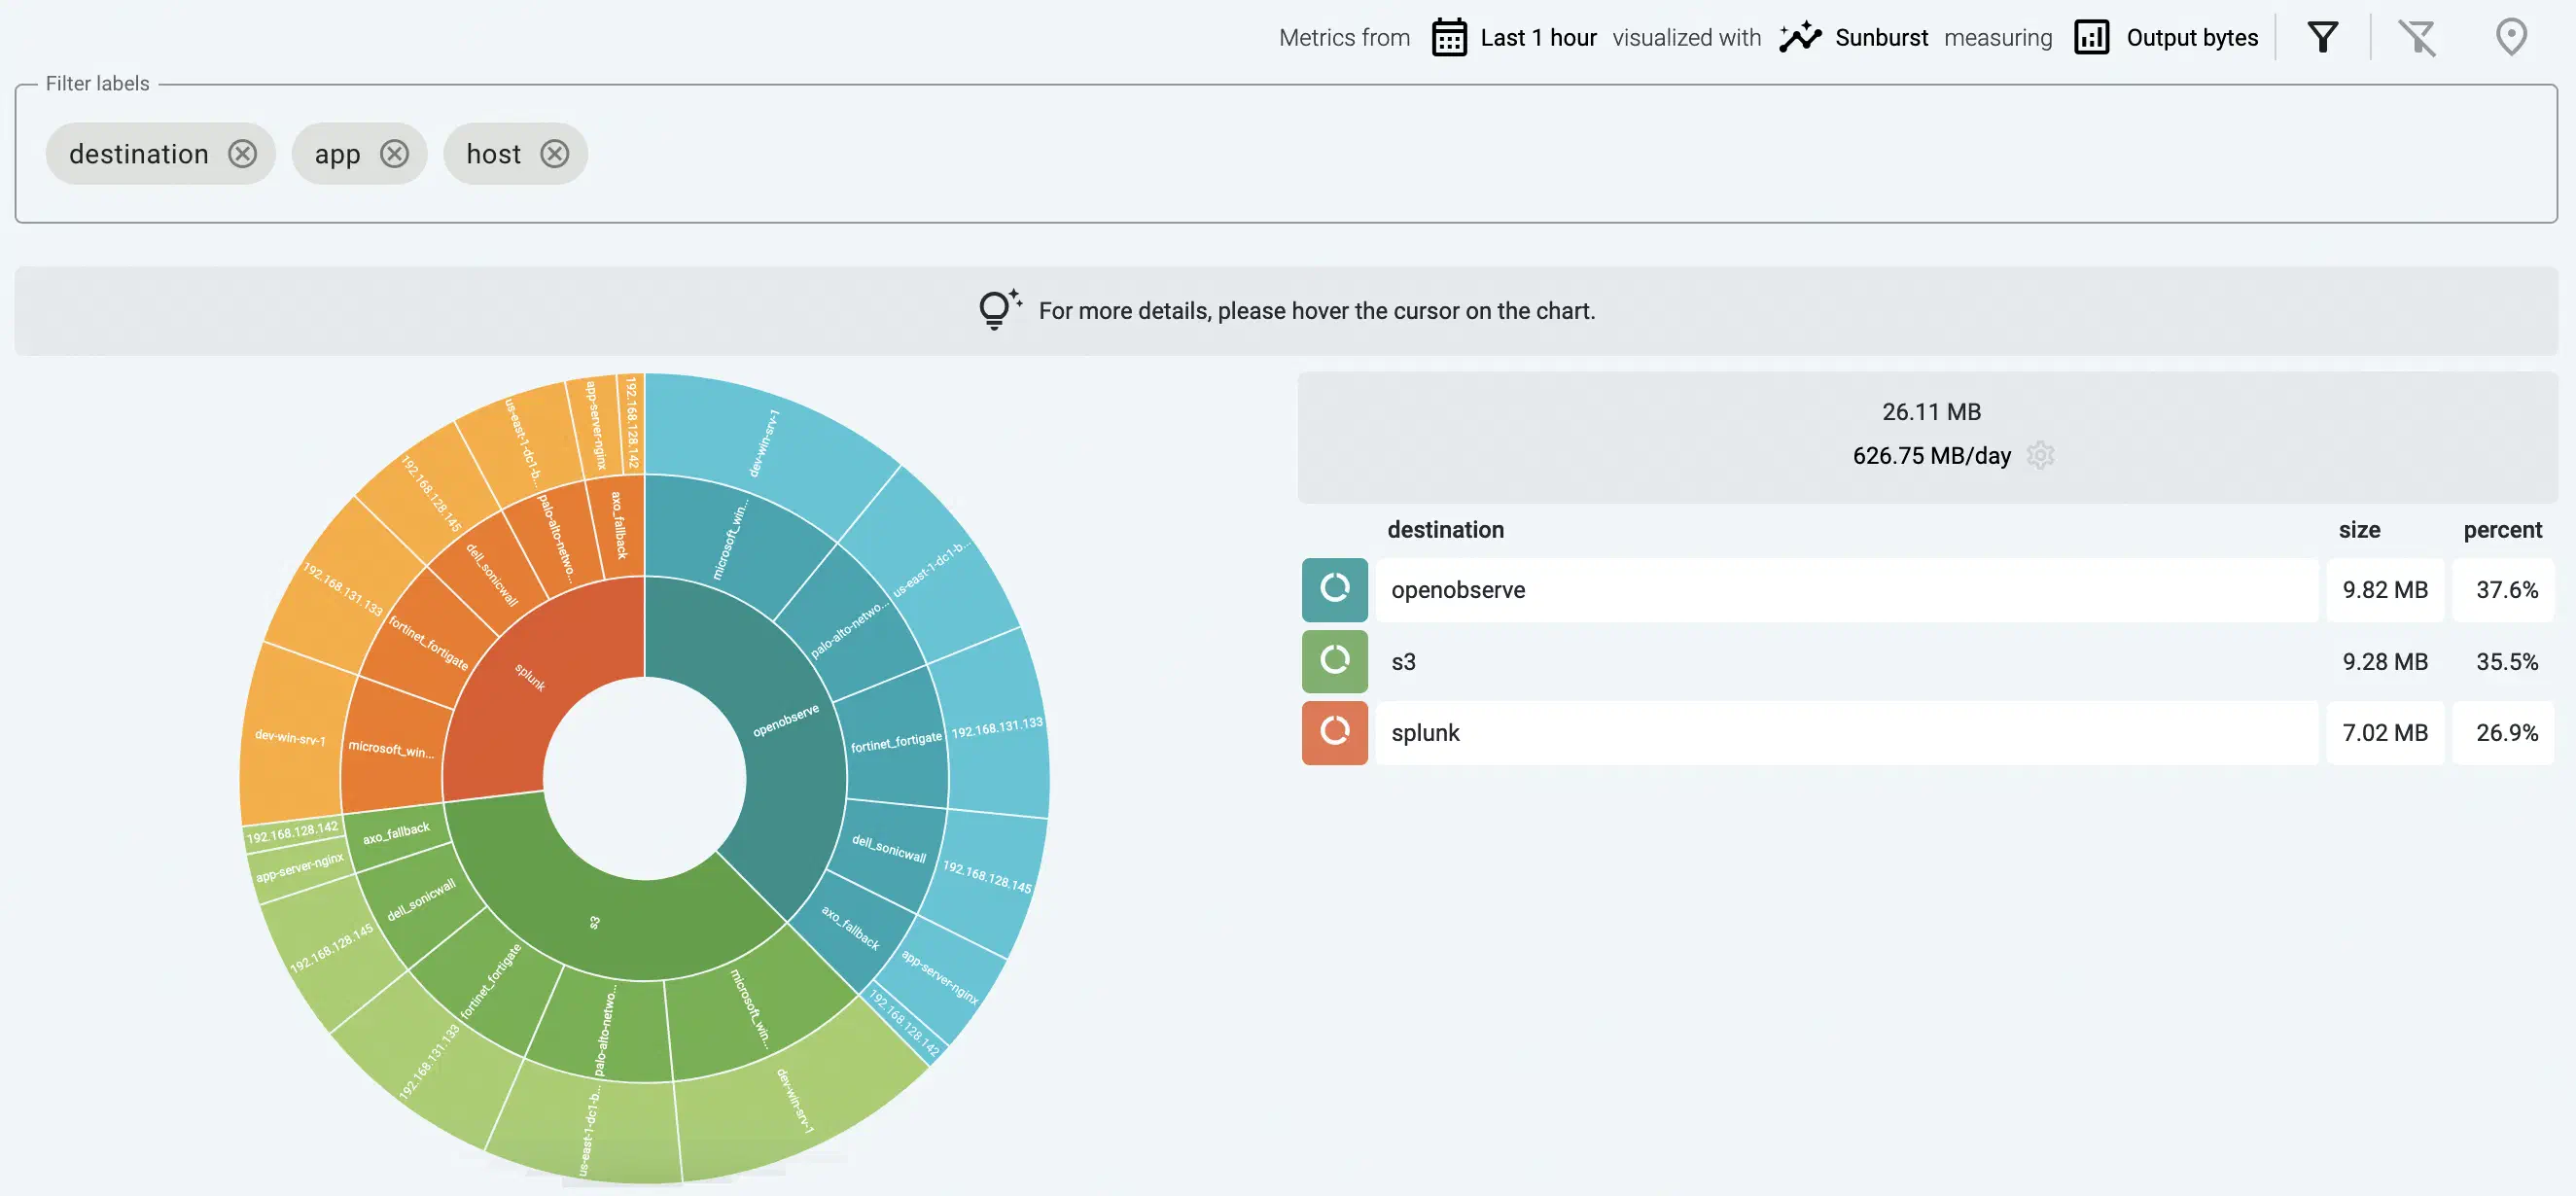
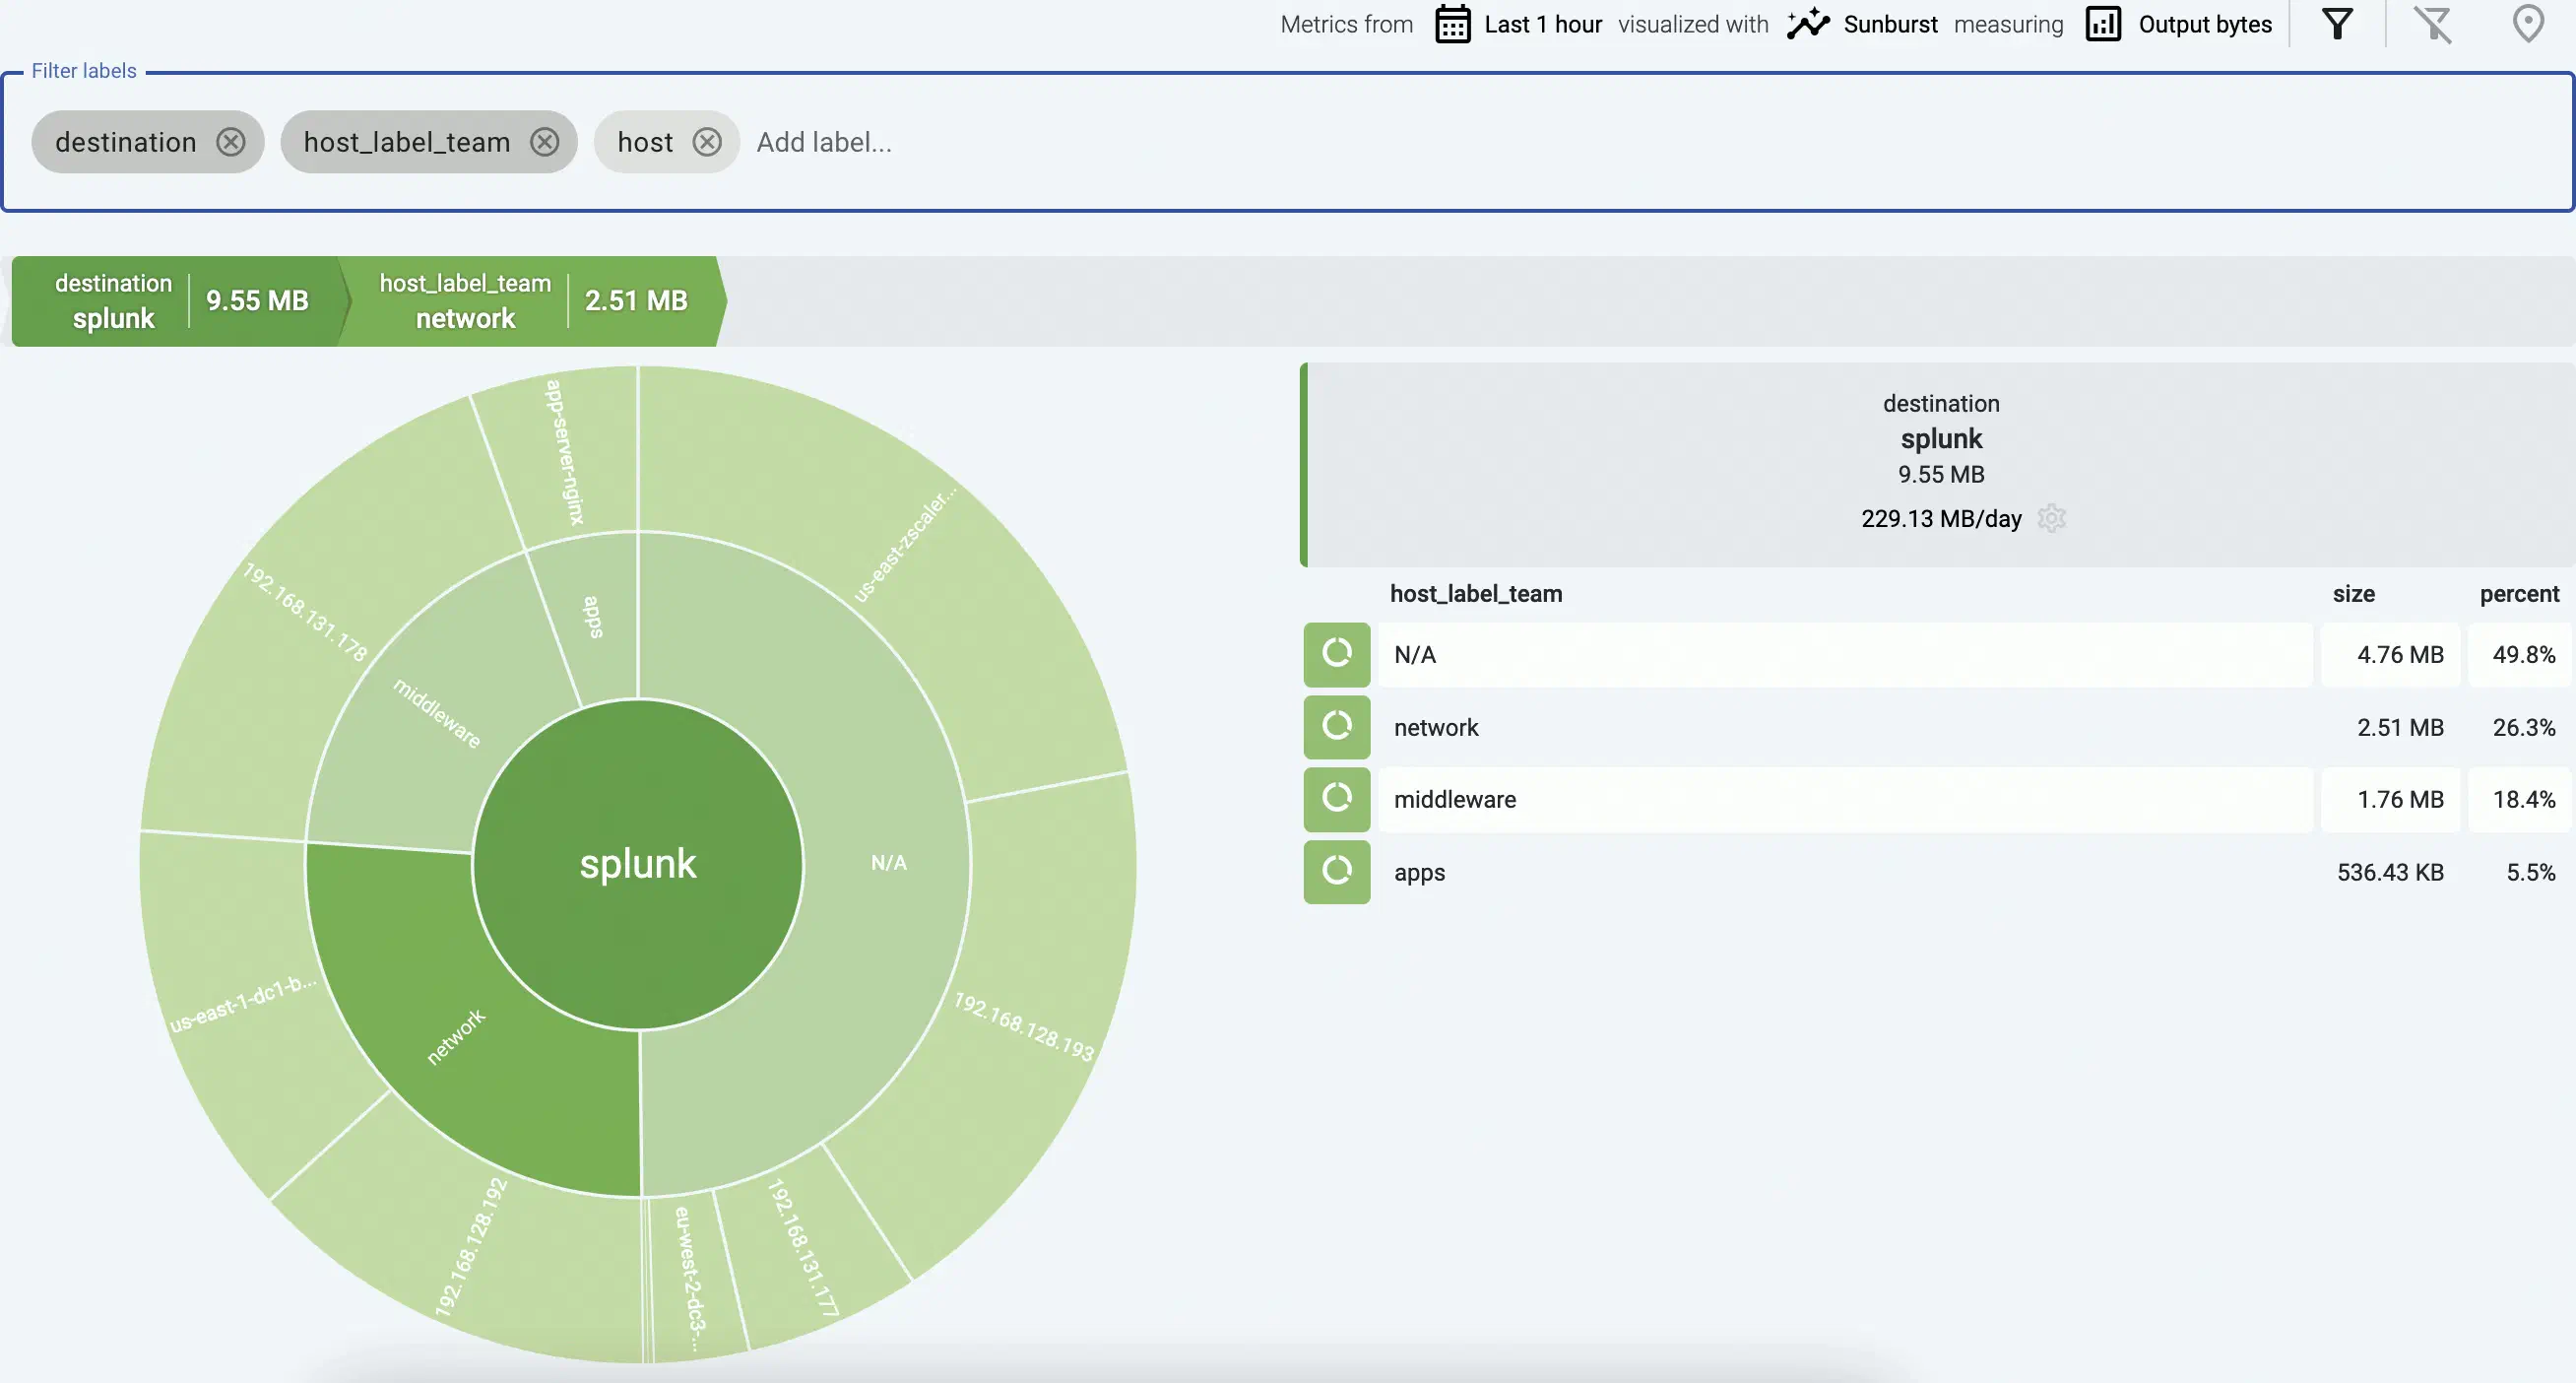
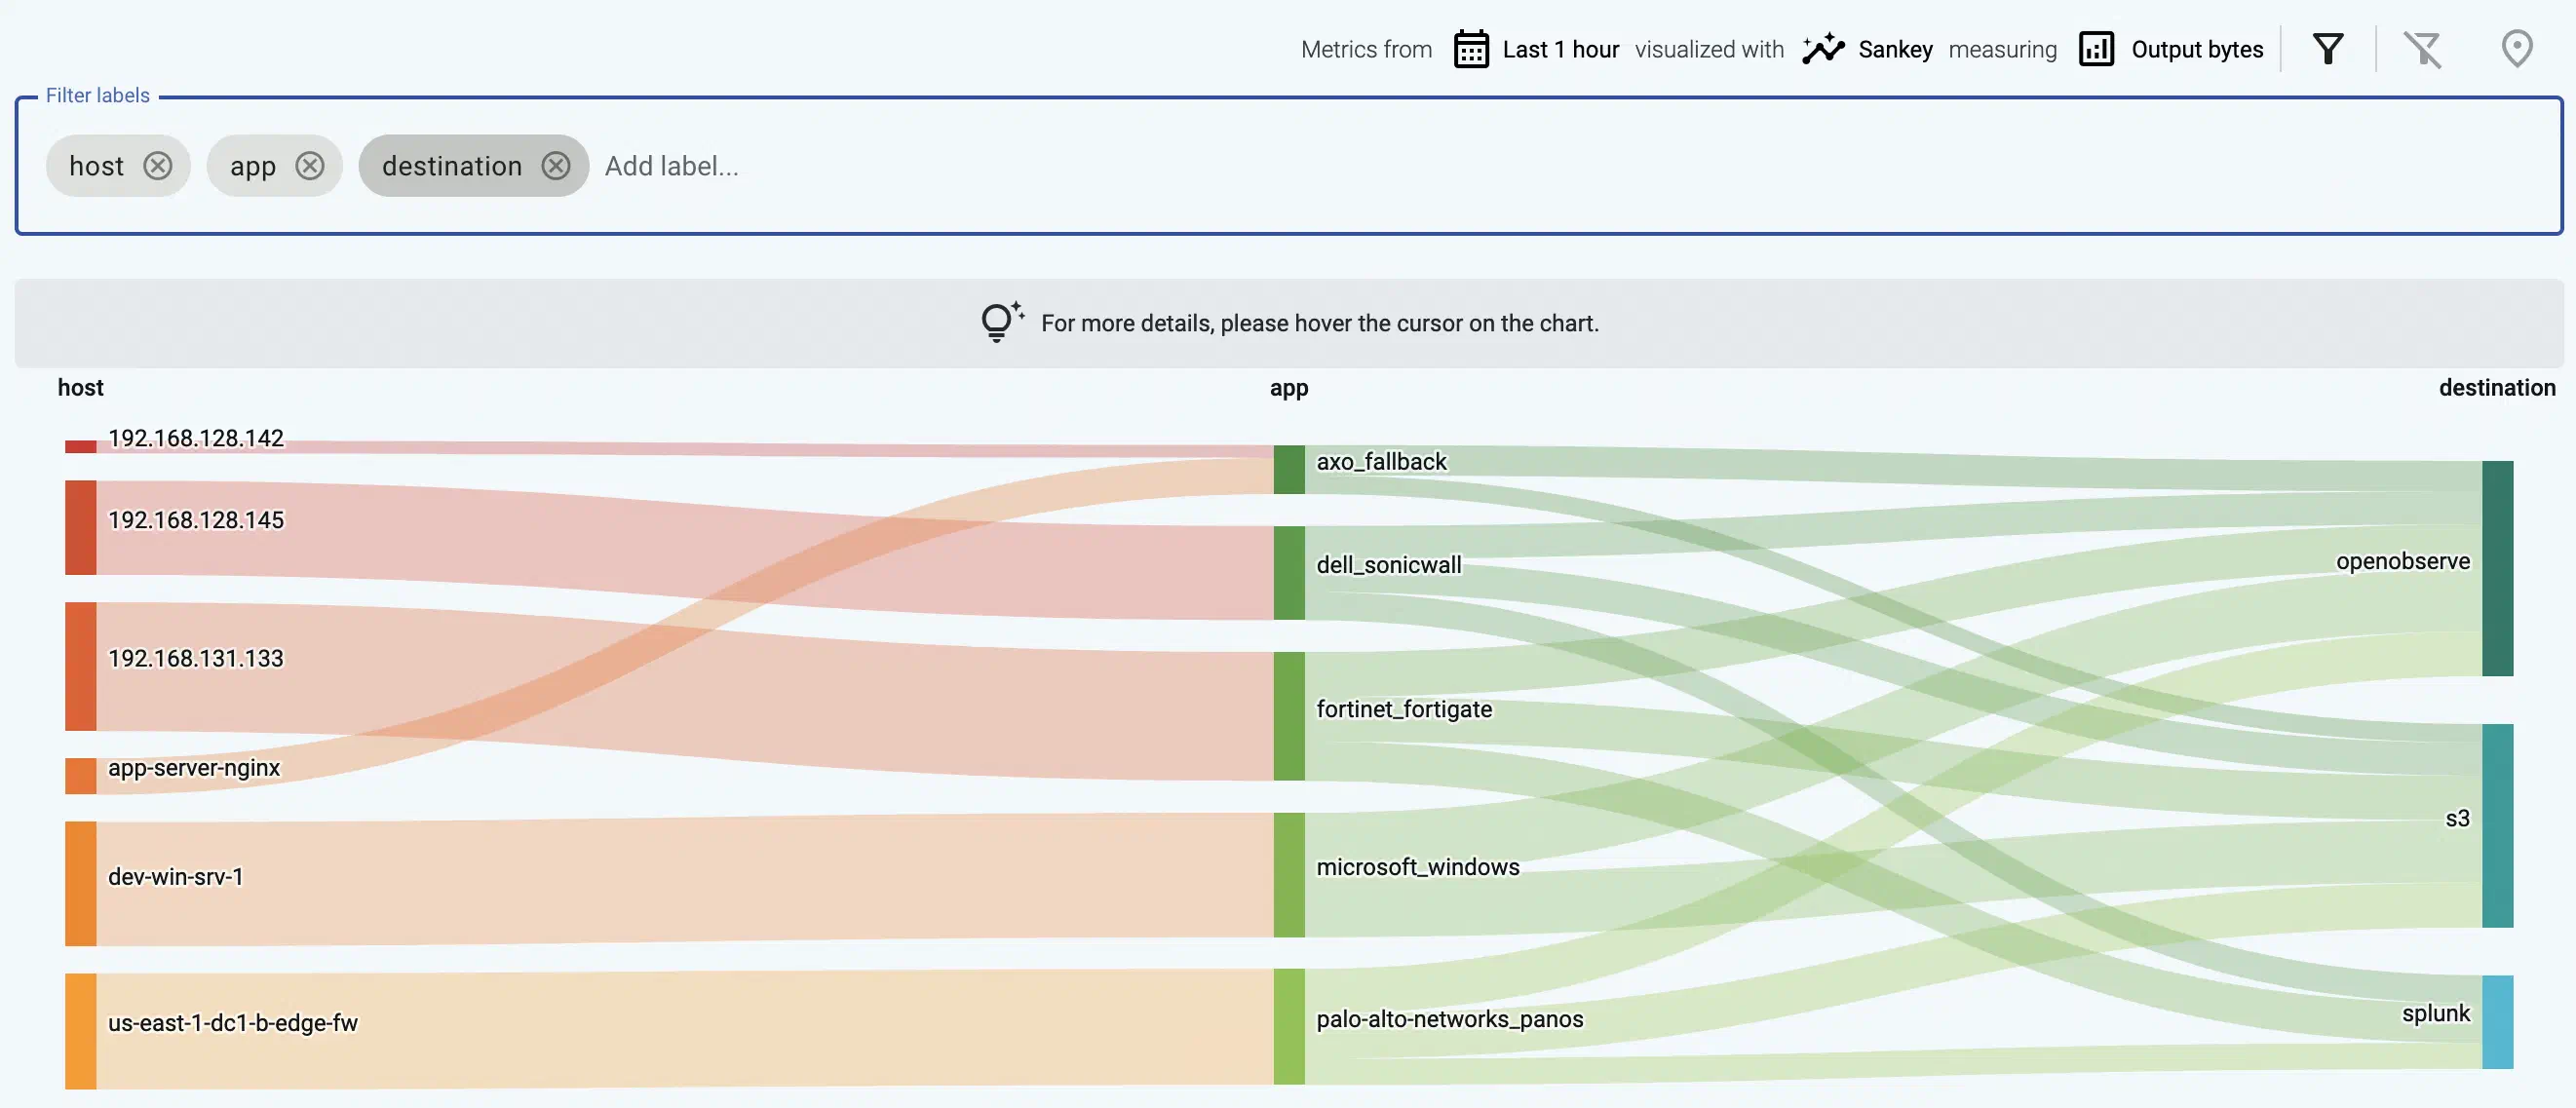
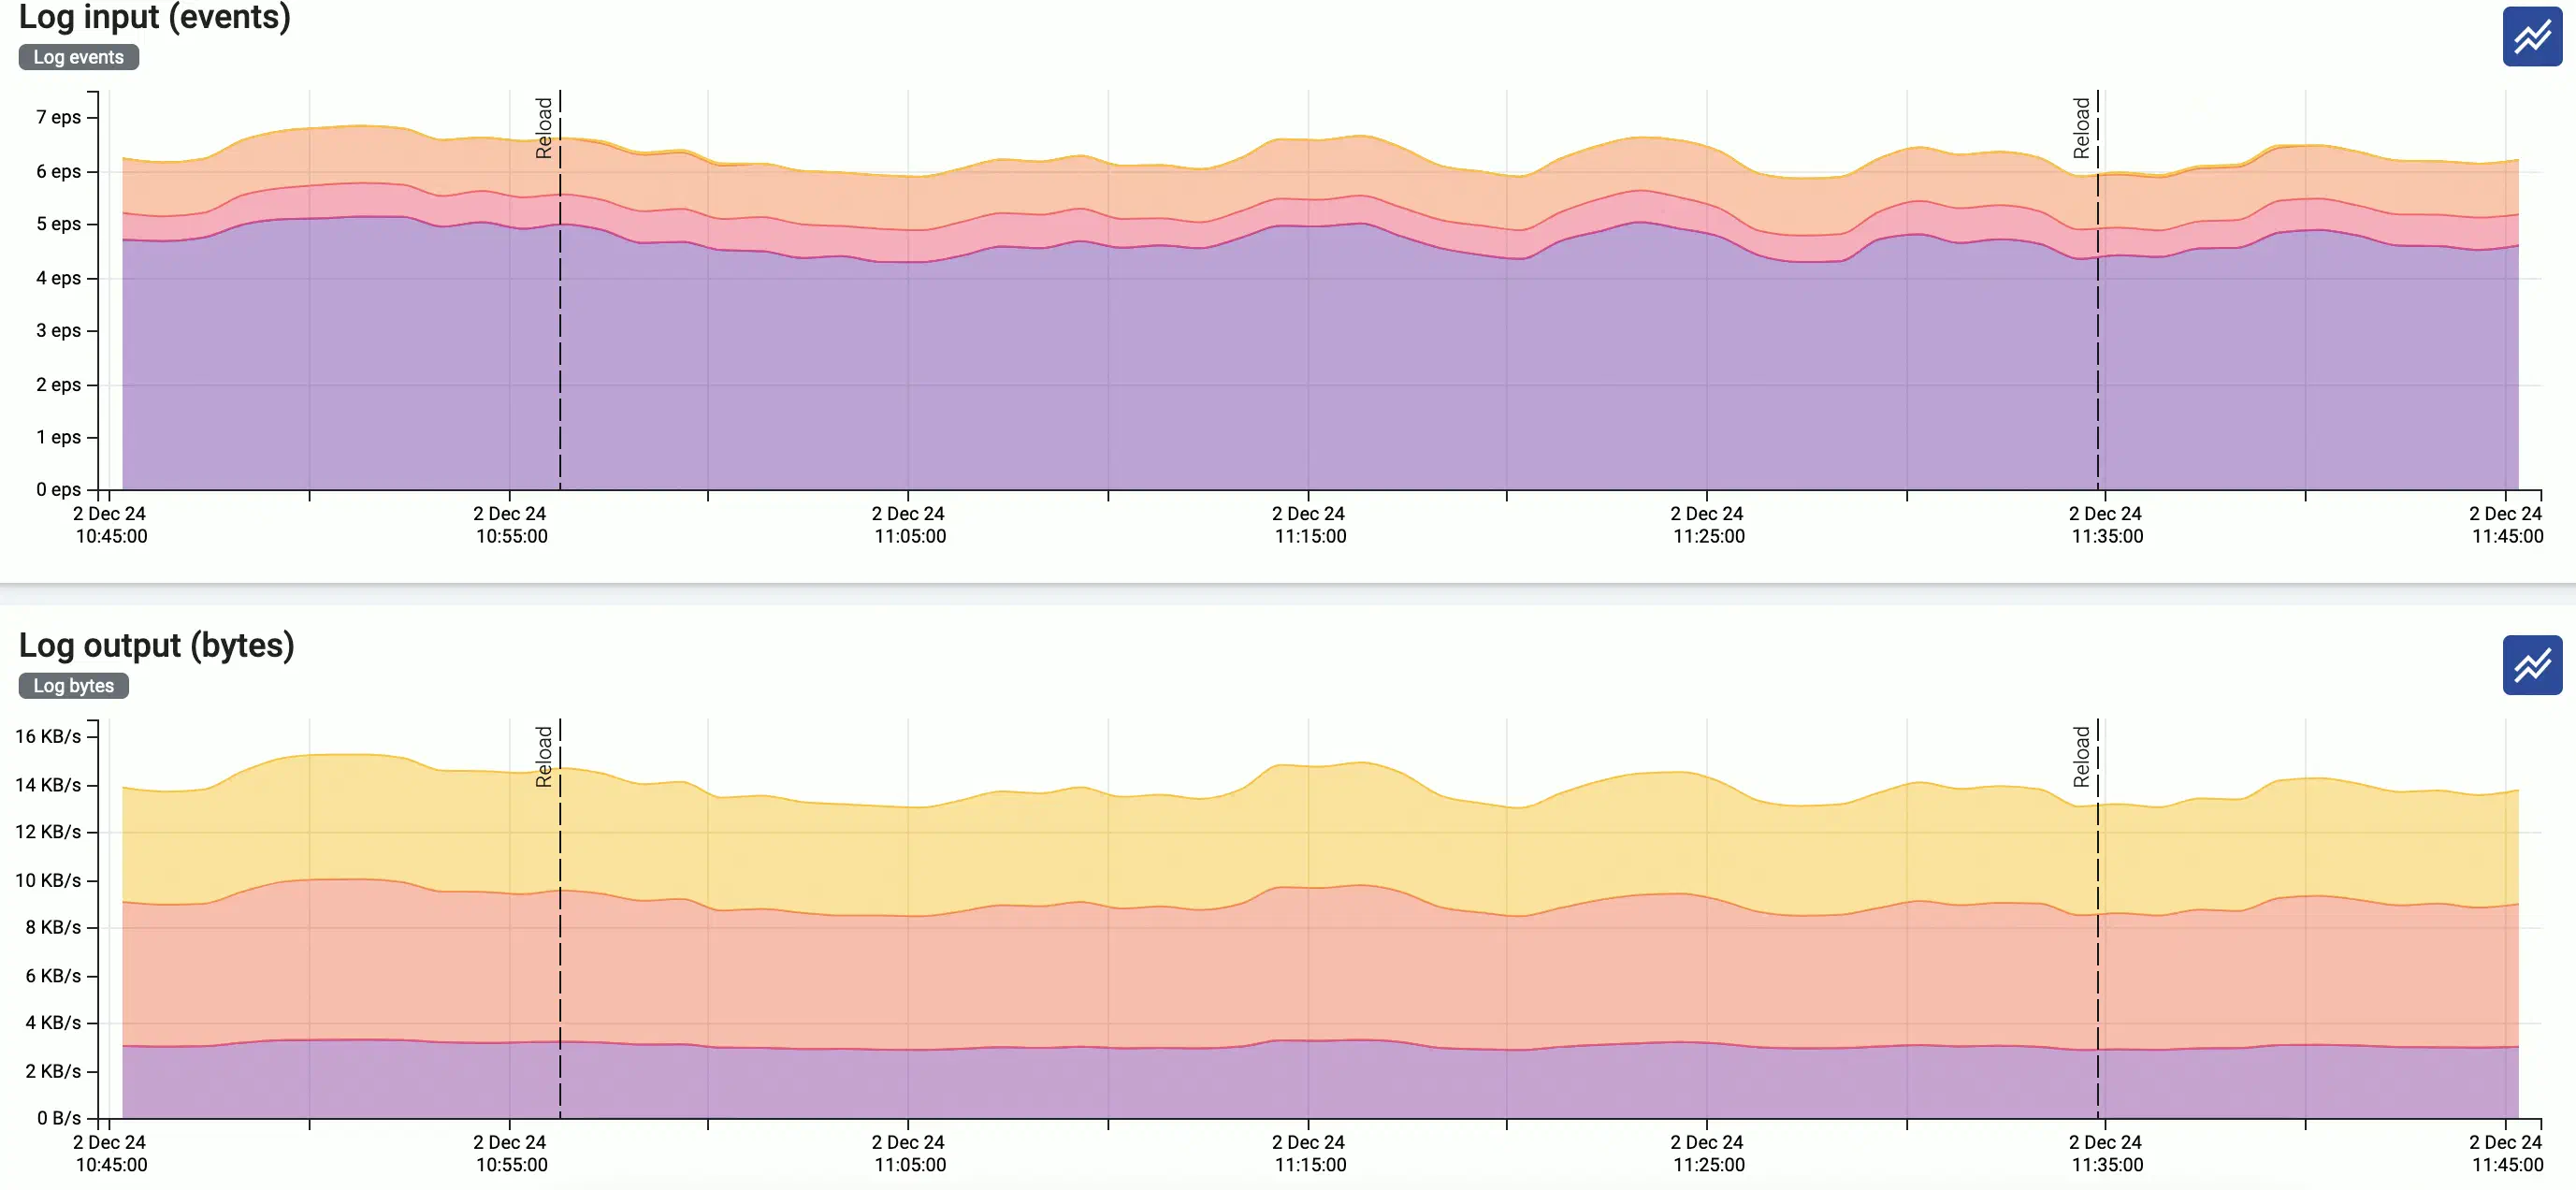
If you have traffic flowing from the source to your AxoRouter instance, the Topology page shows the amount of data flowing on the path. Click the AxoRouter instance, then select Analytics to visualize the data flow.
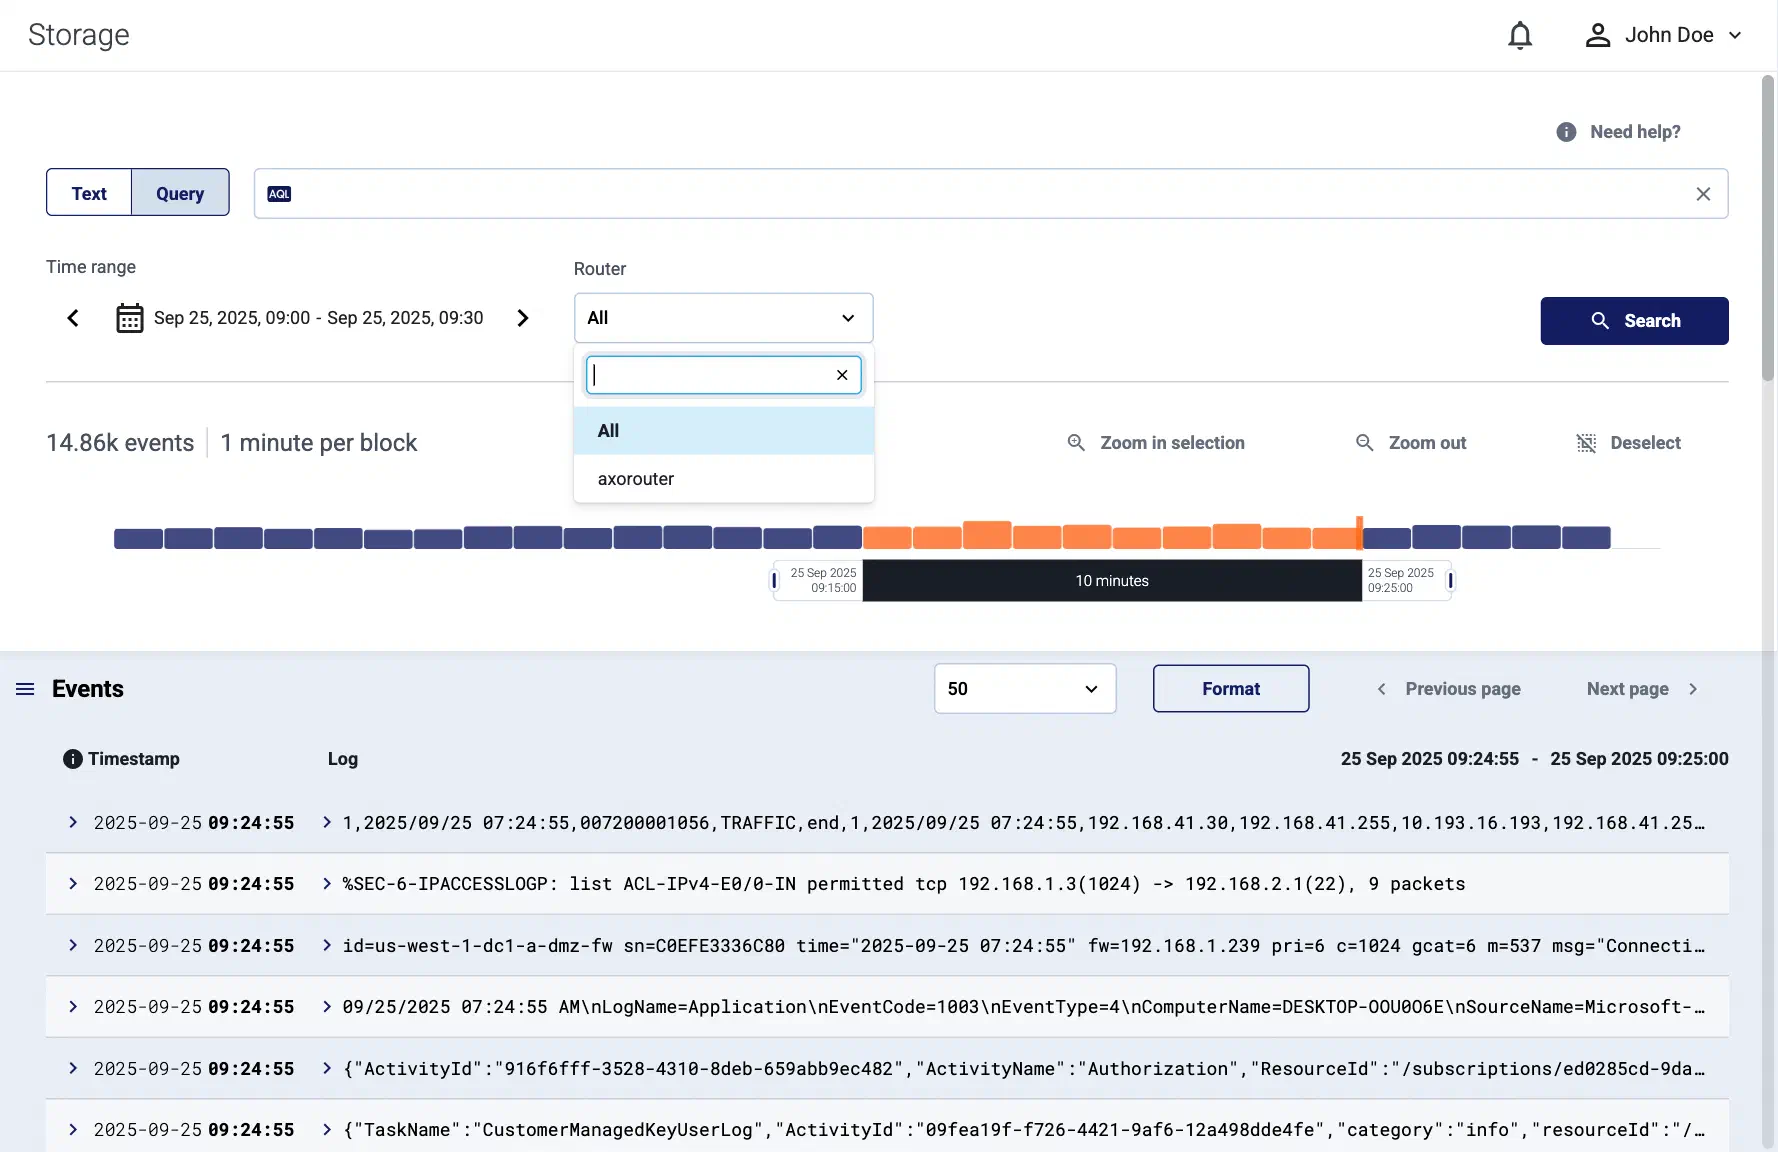
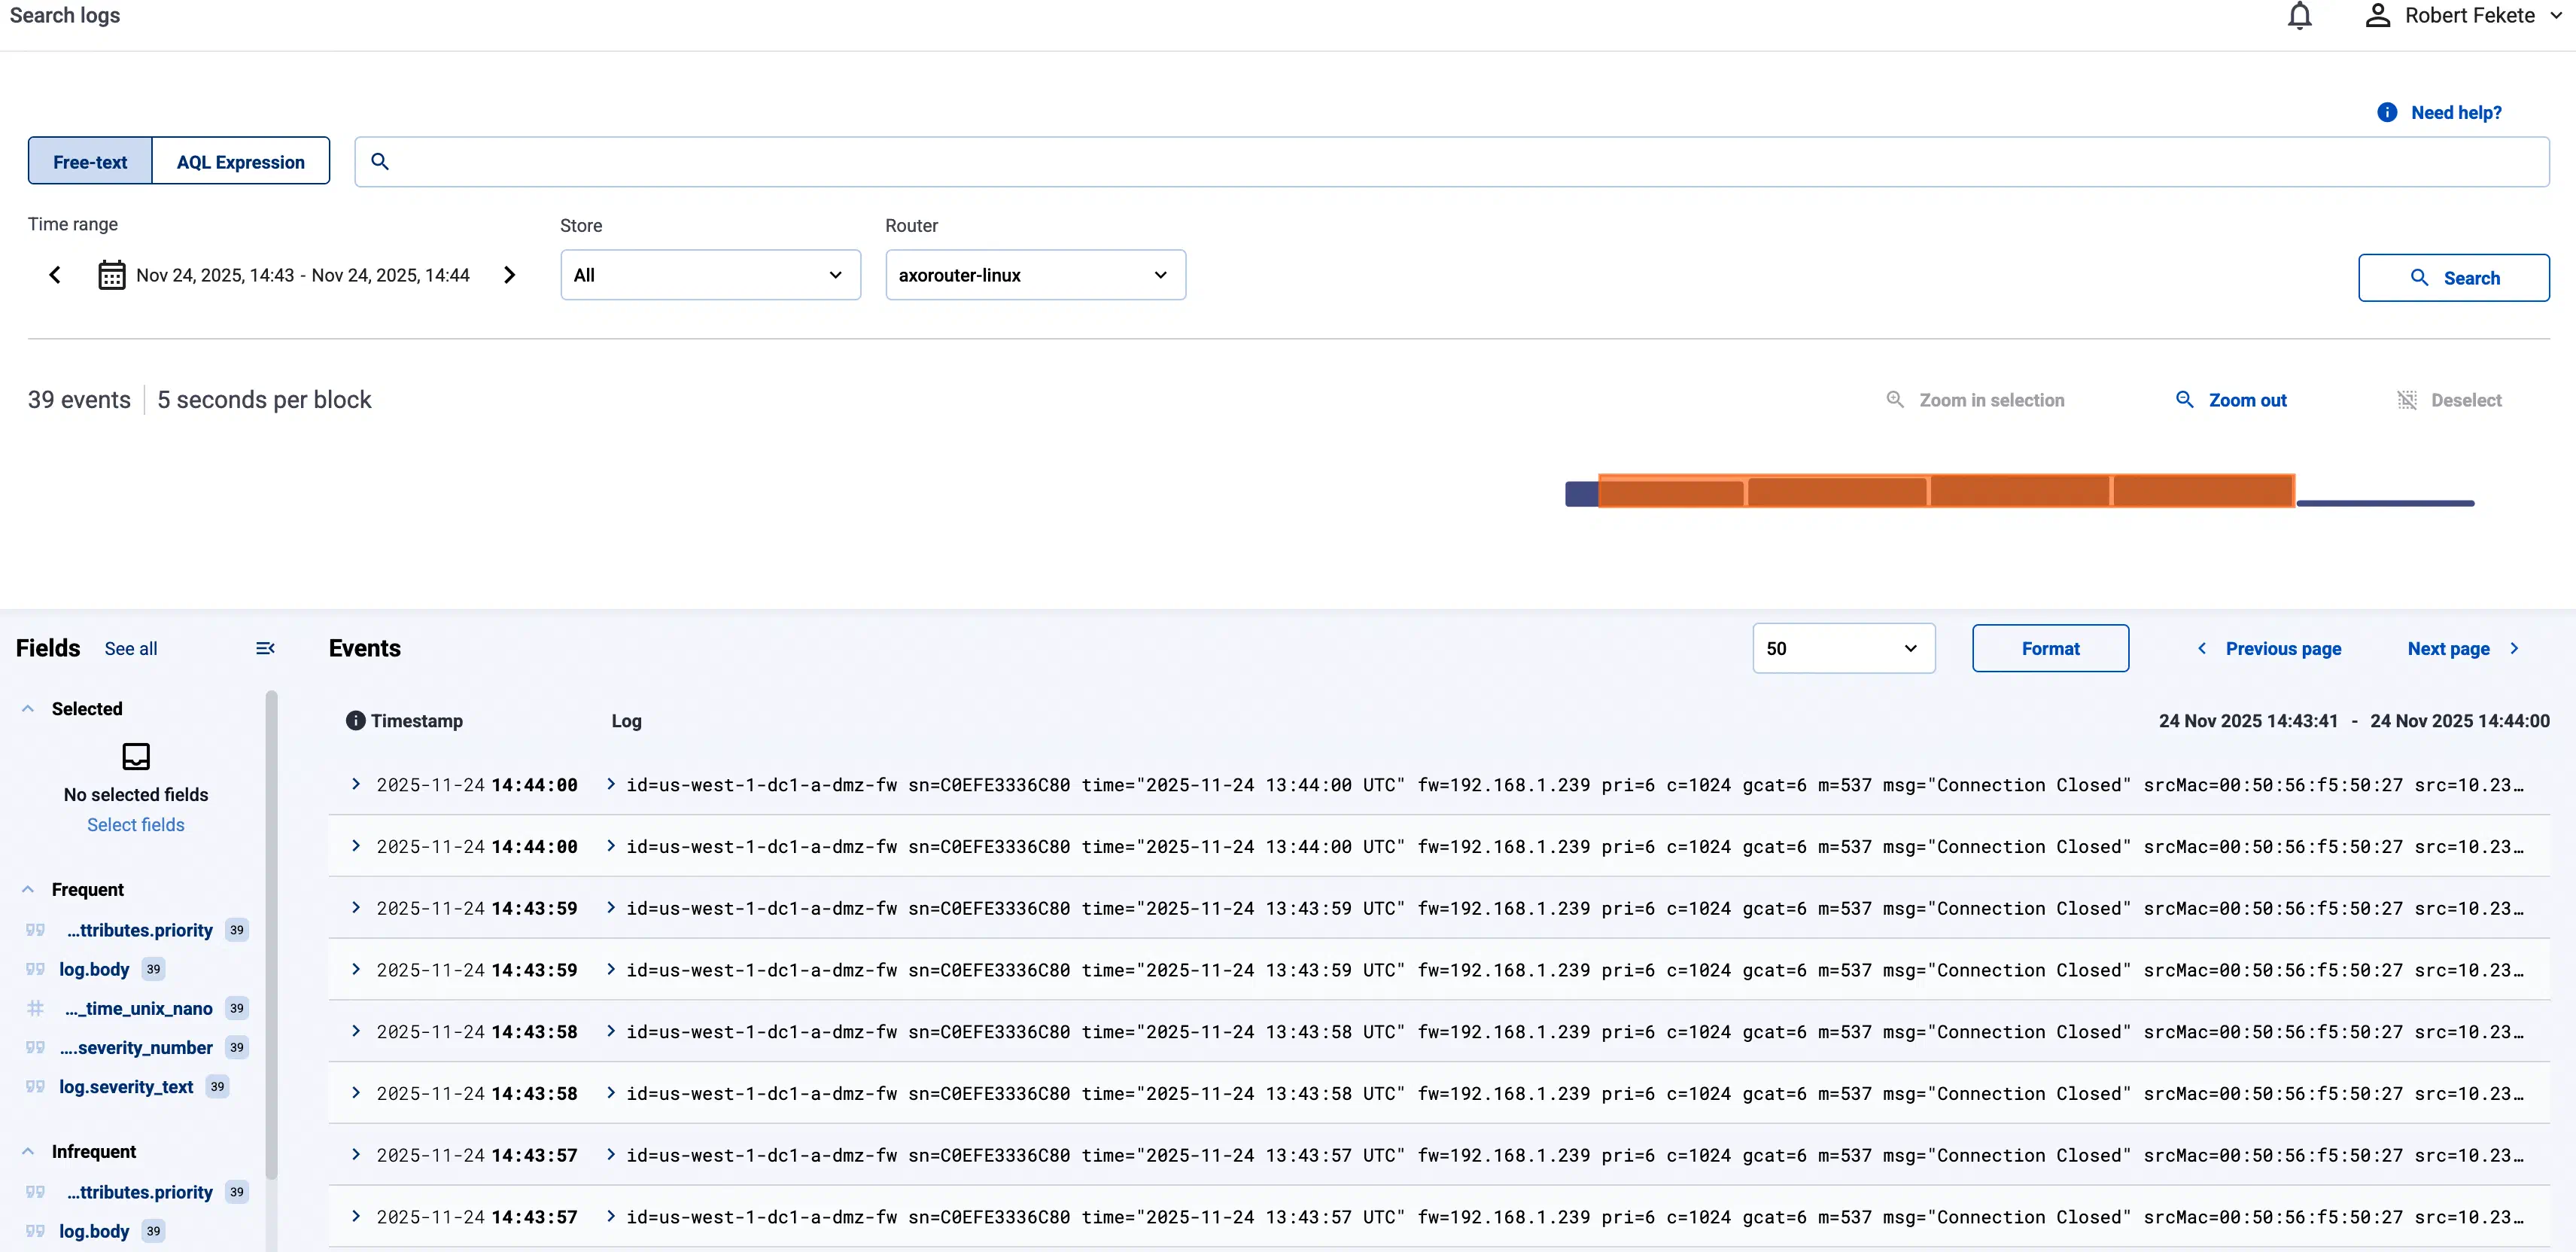
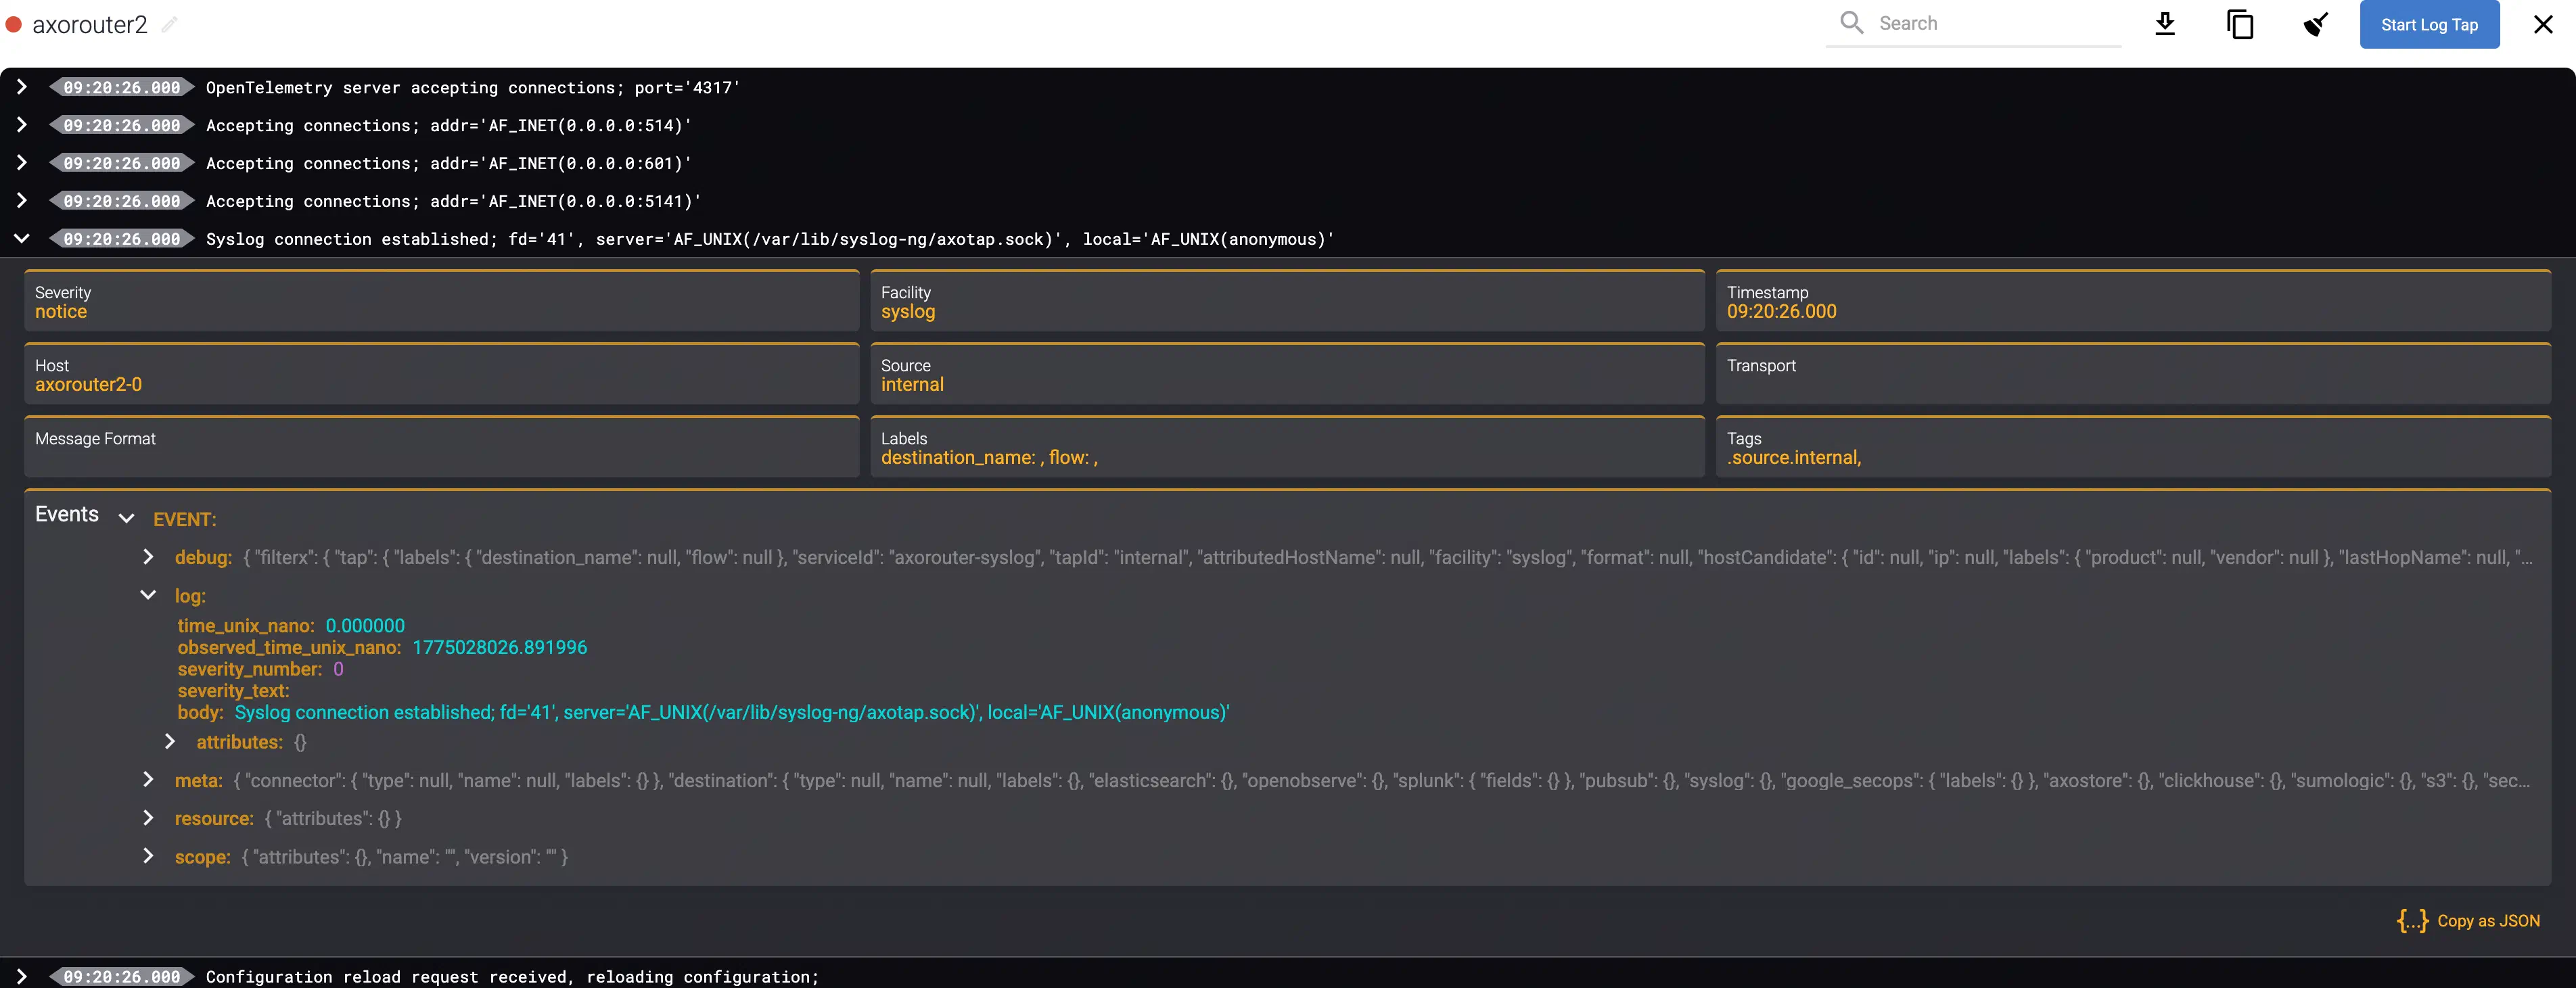
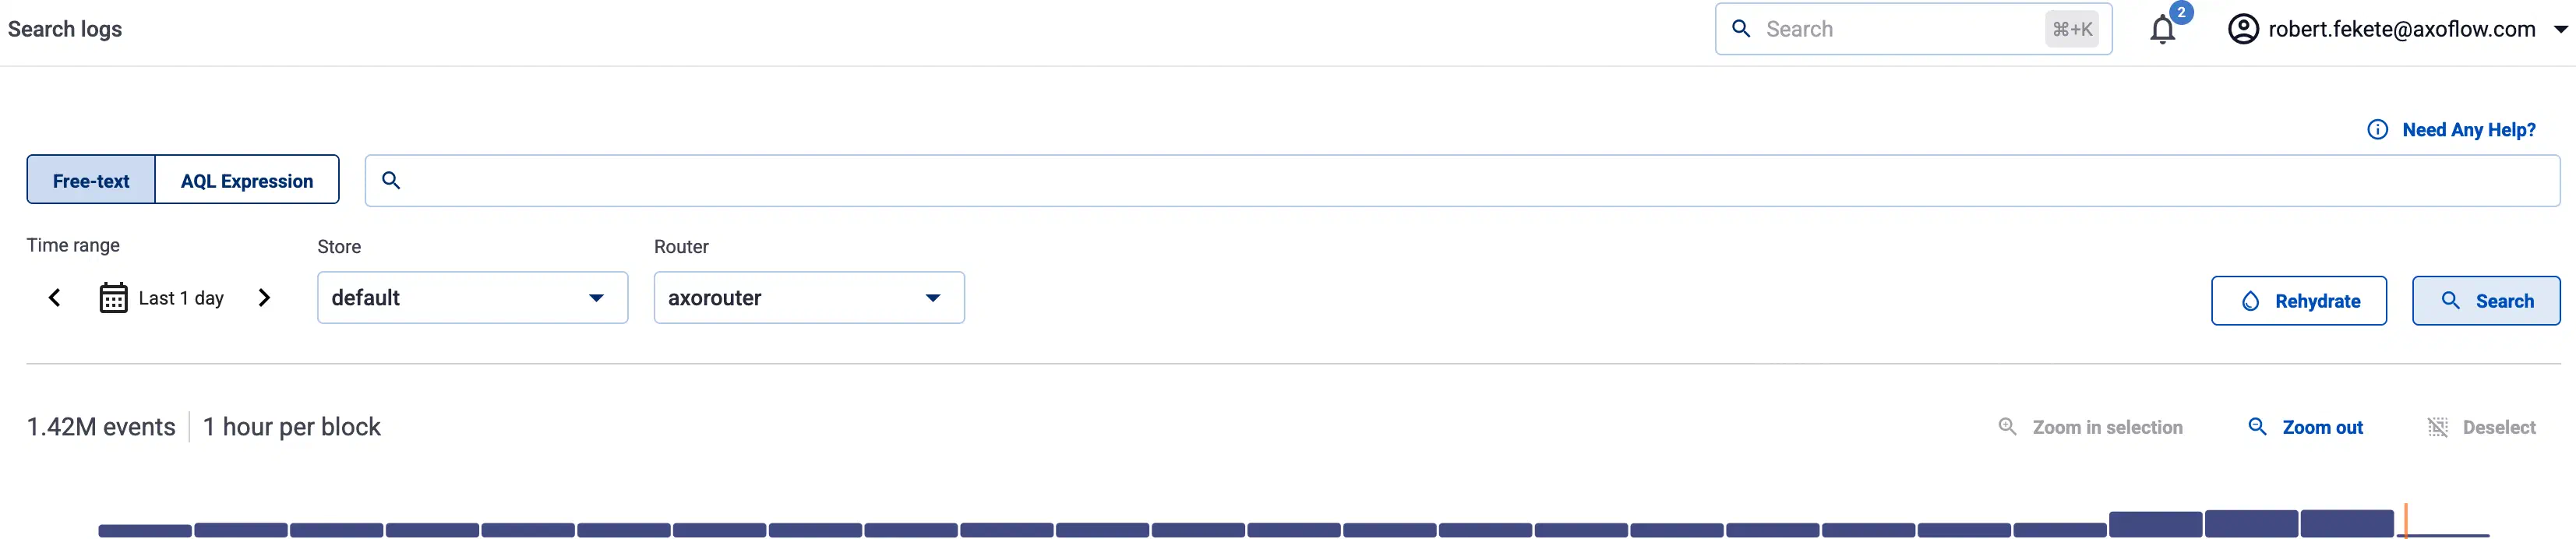
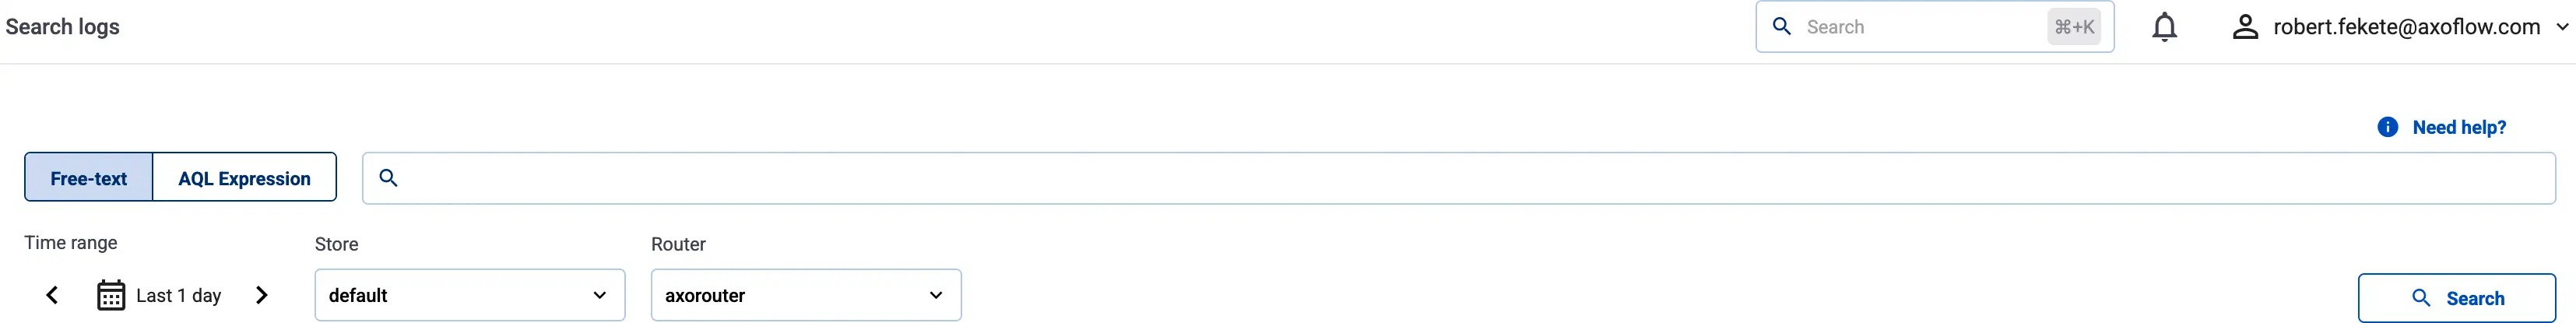
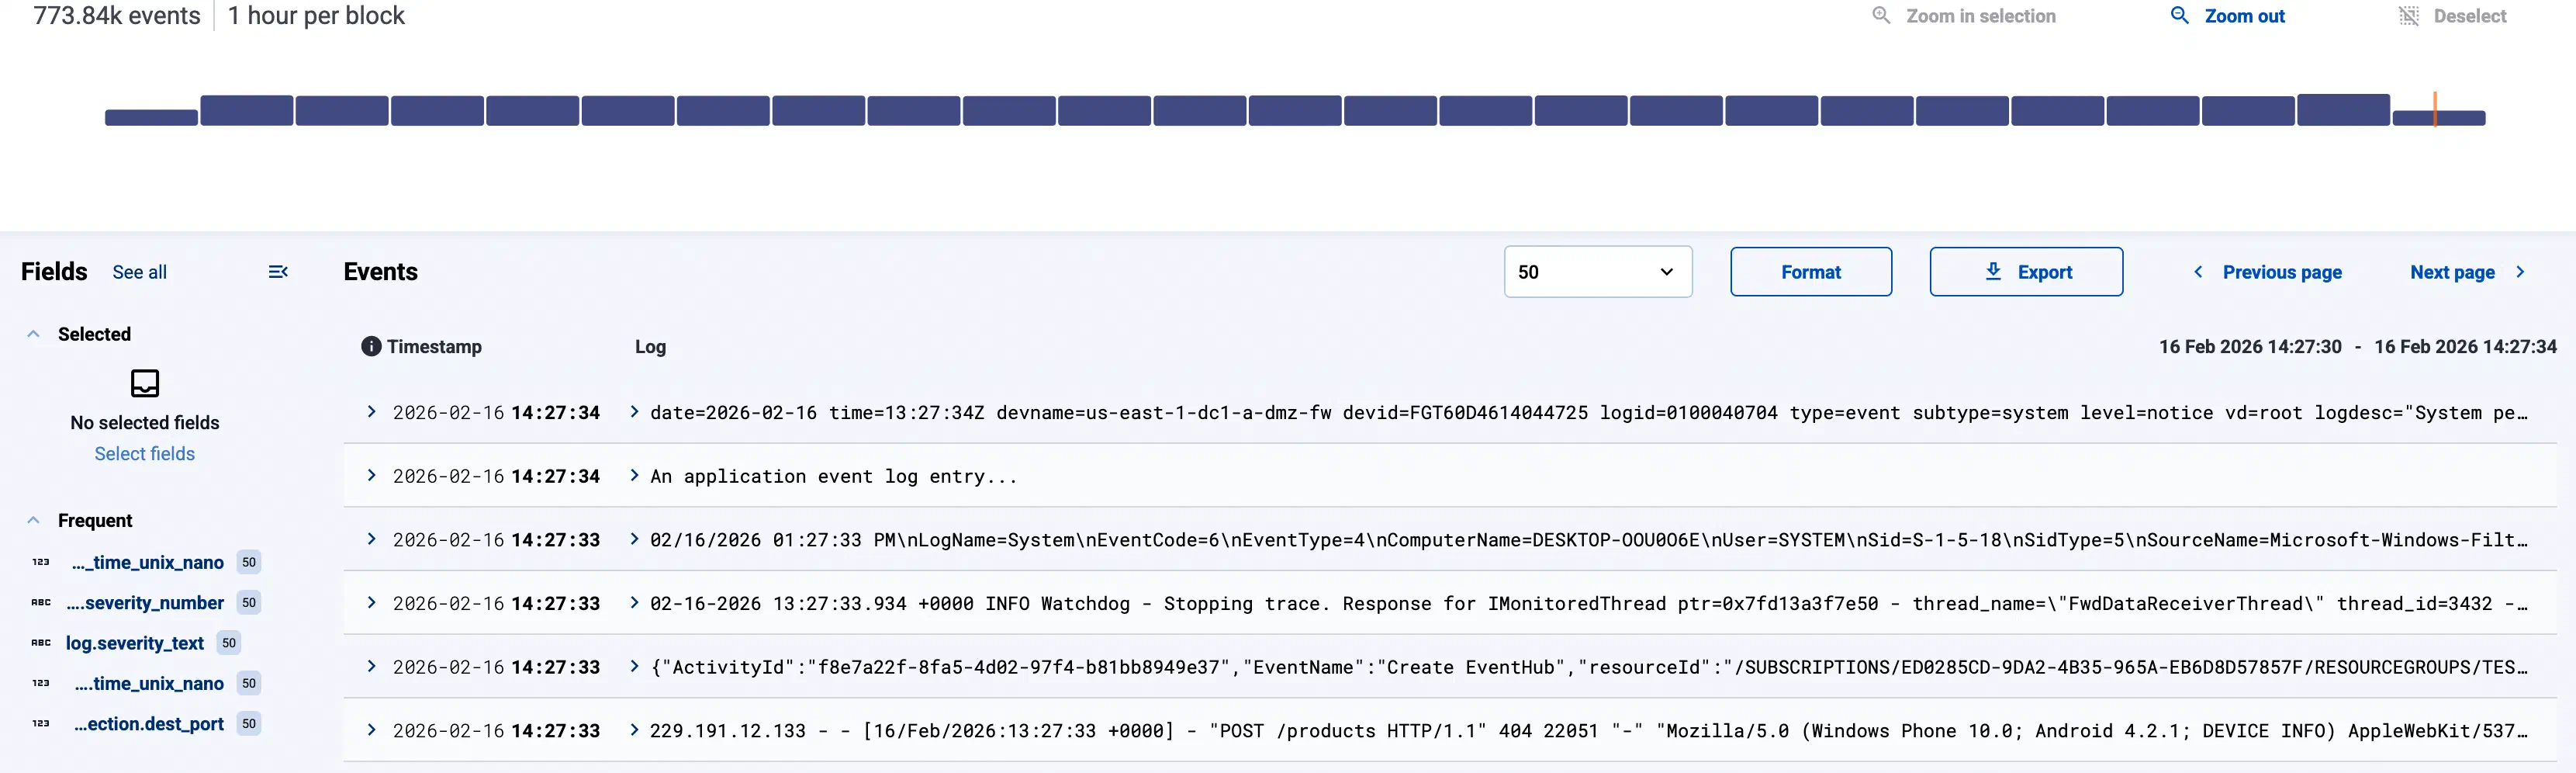
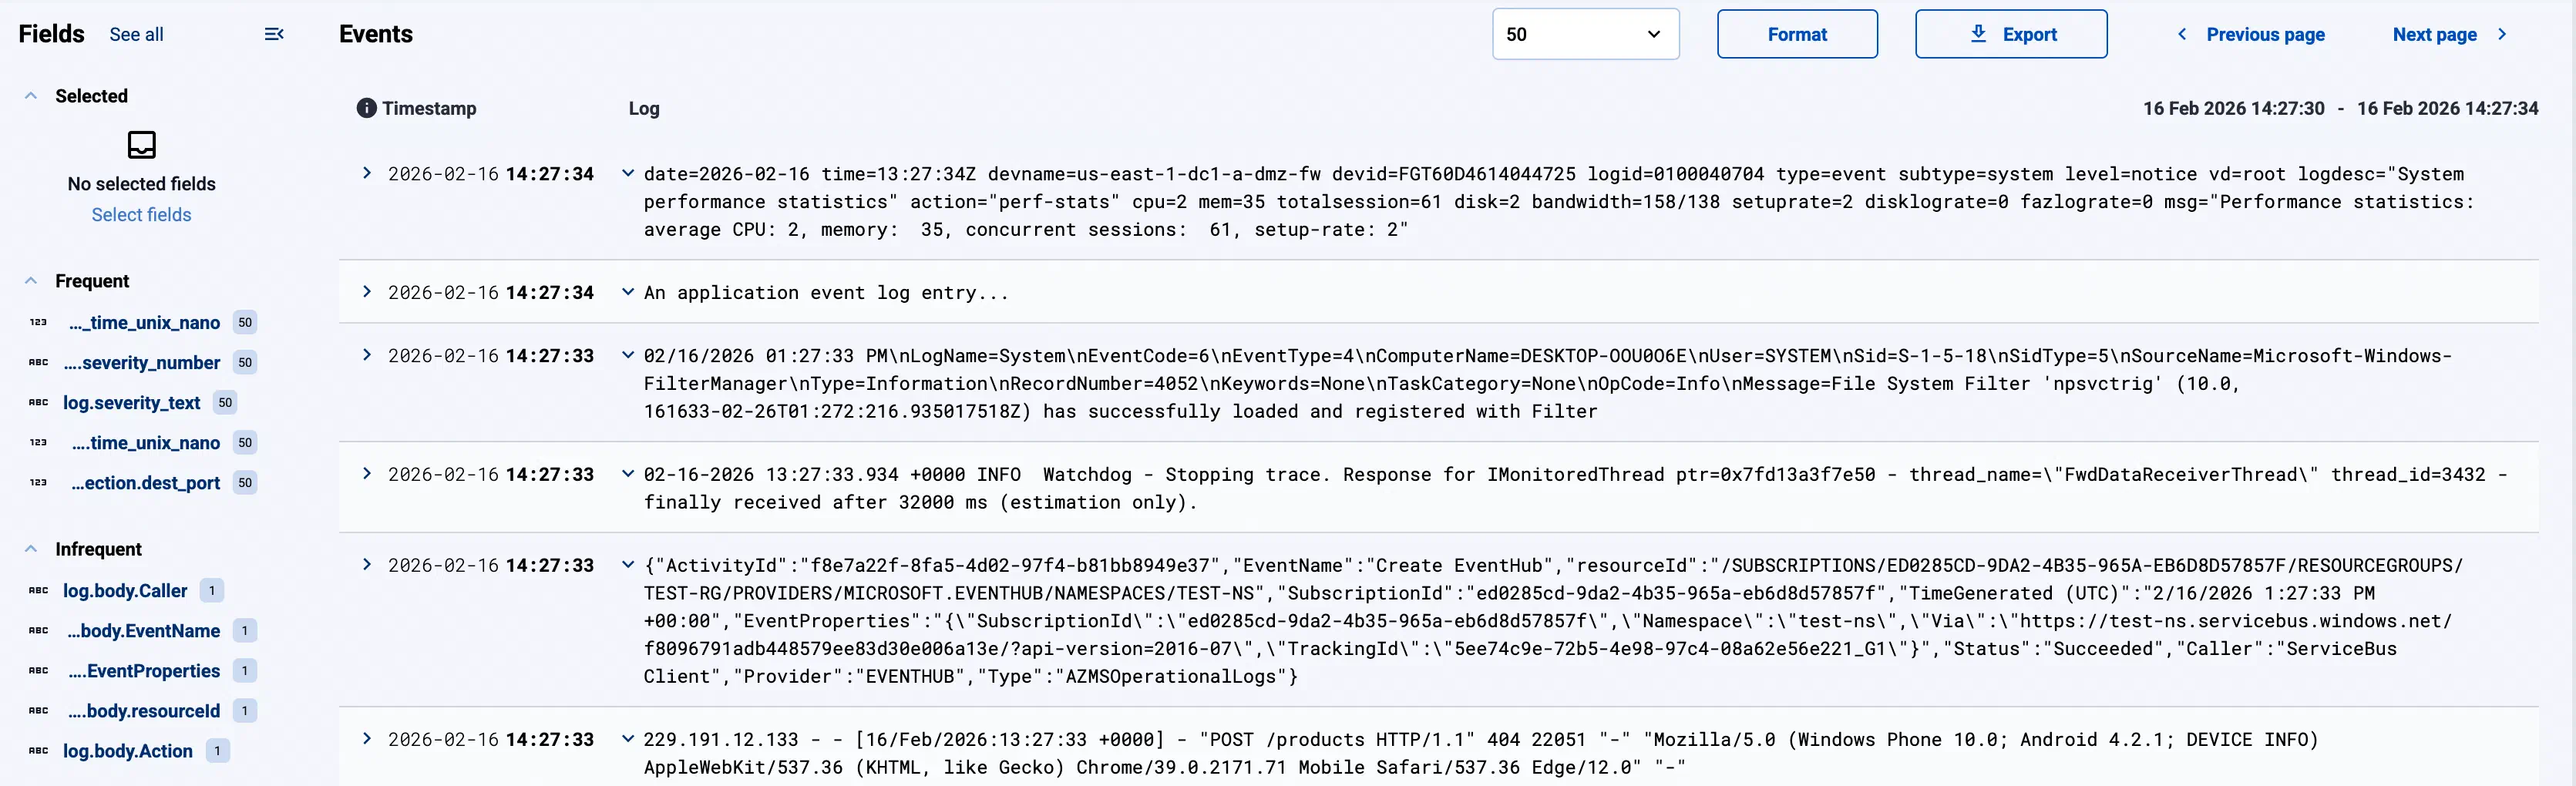
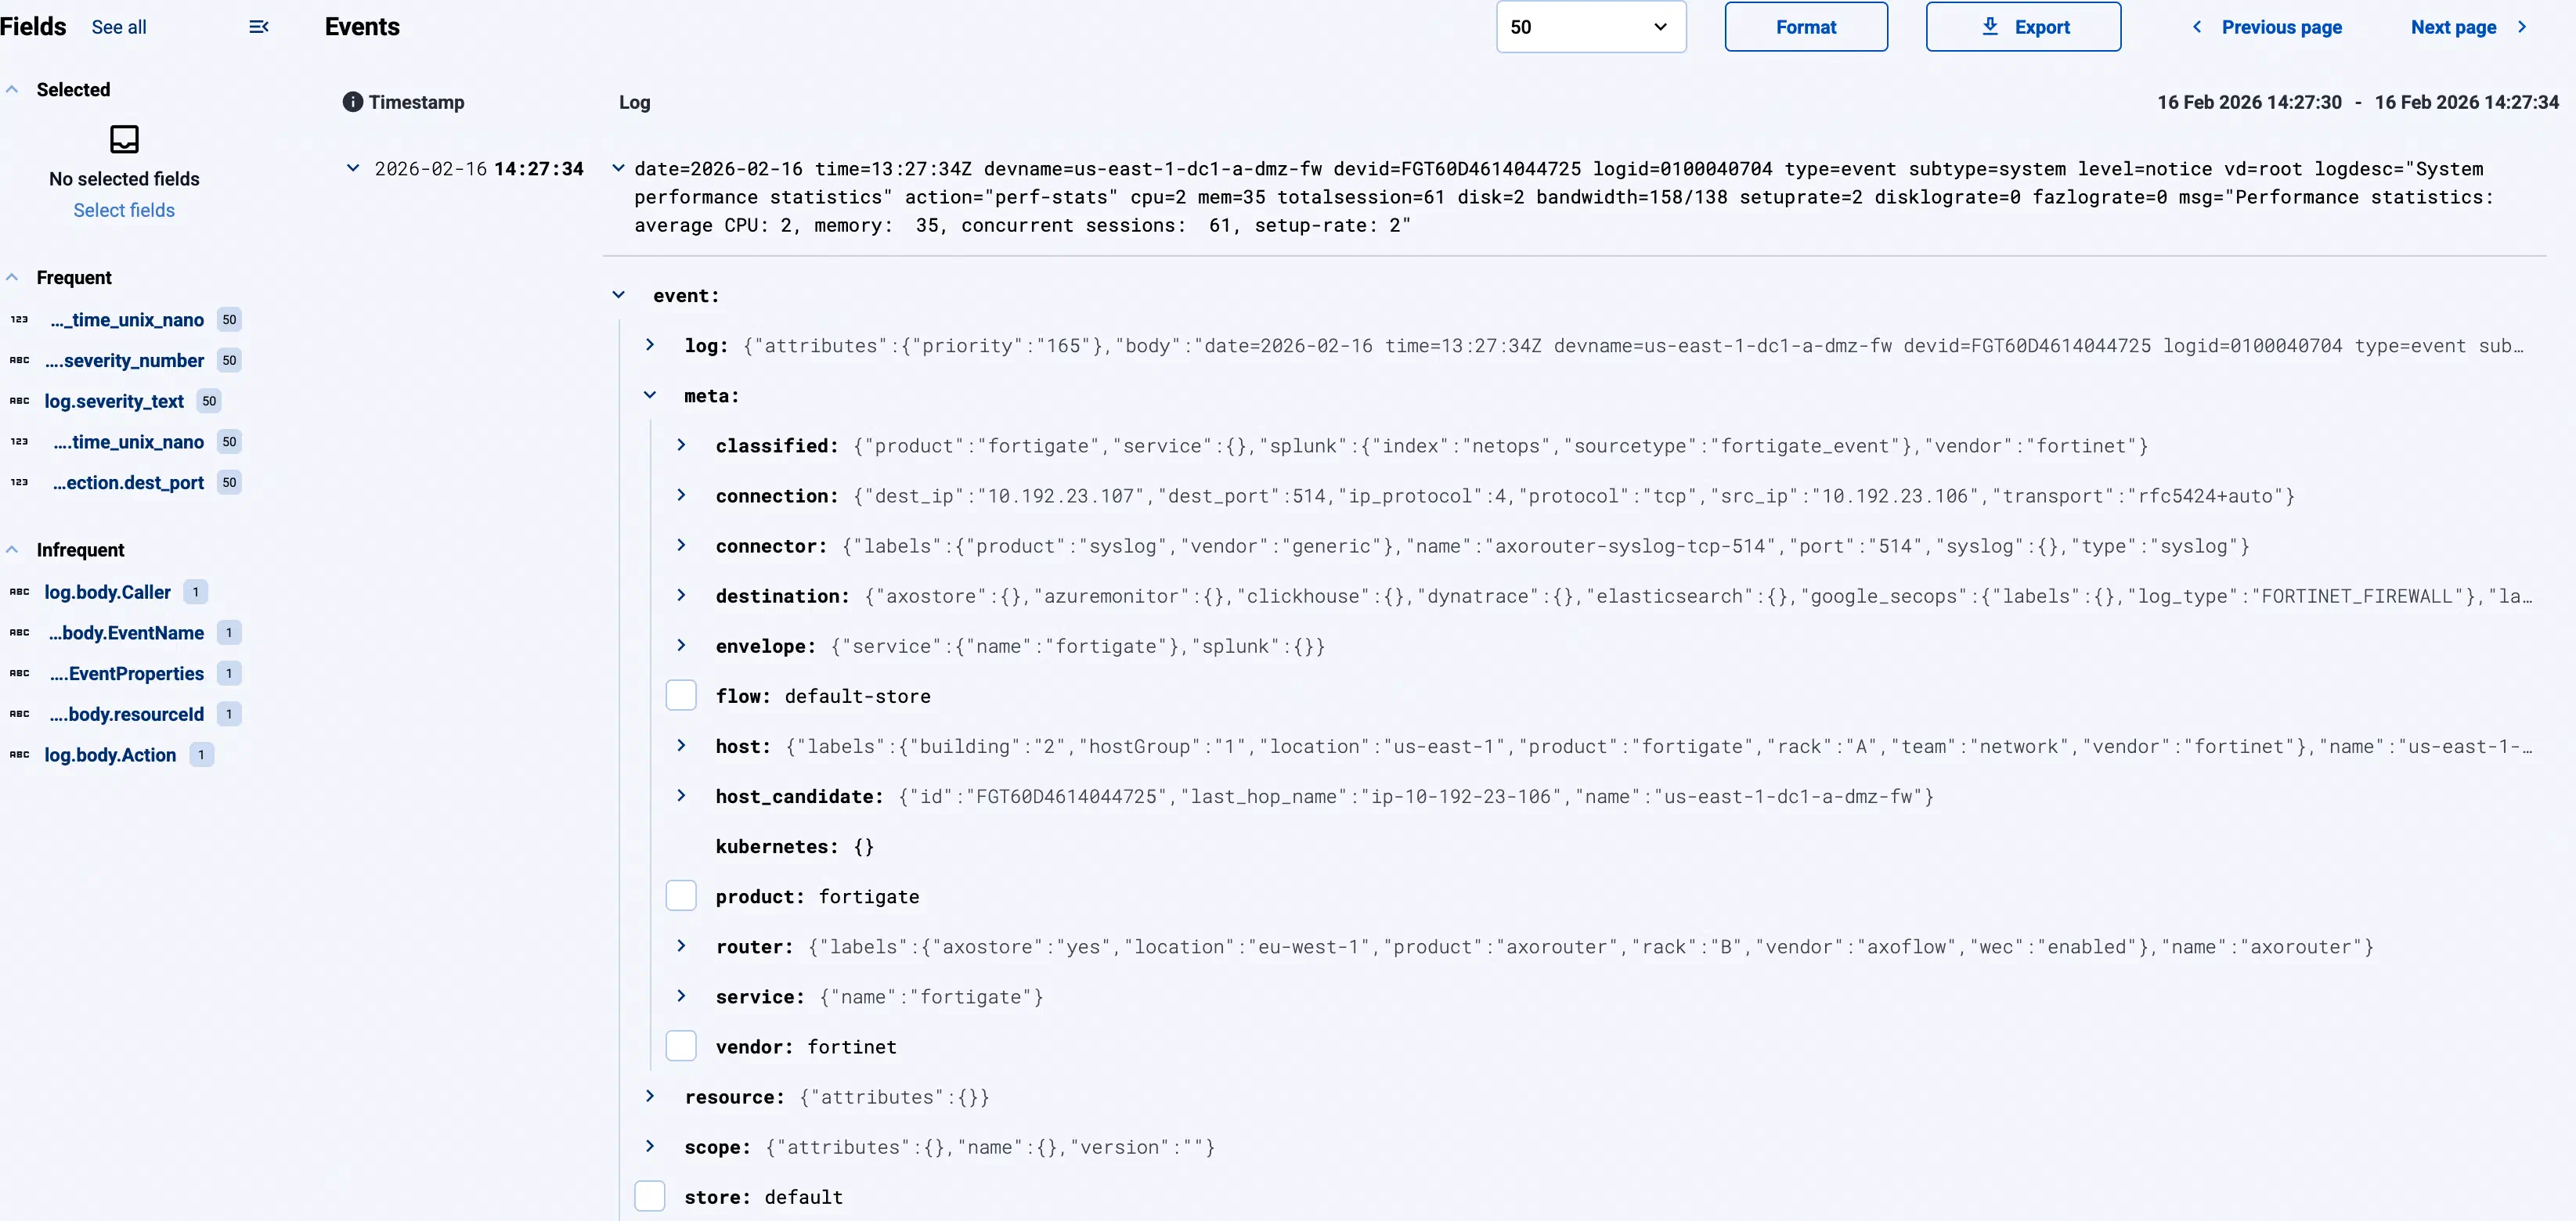
Search logs
Open the Search logs page, then select search
Search. The recently received logs in AxoStore will be displayed.
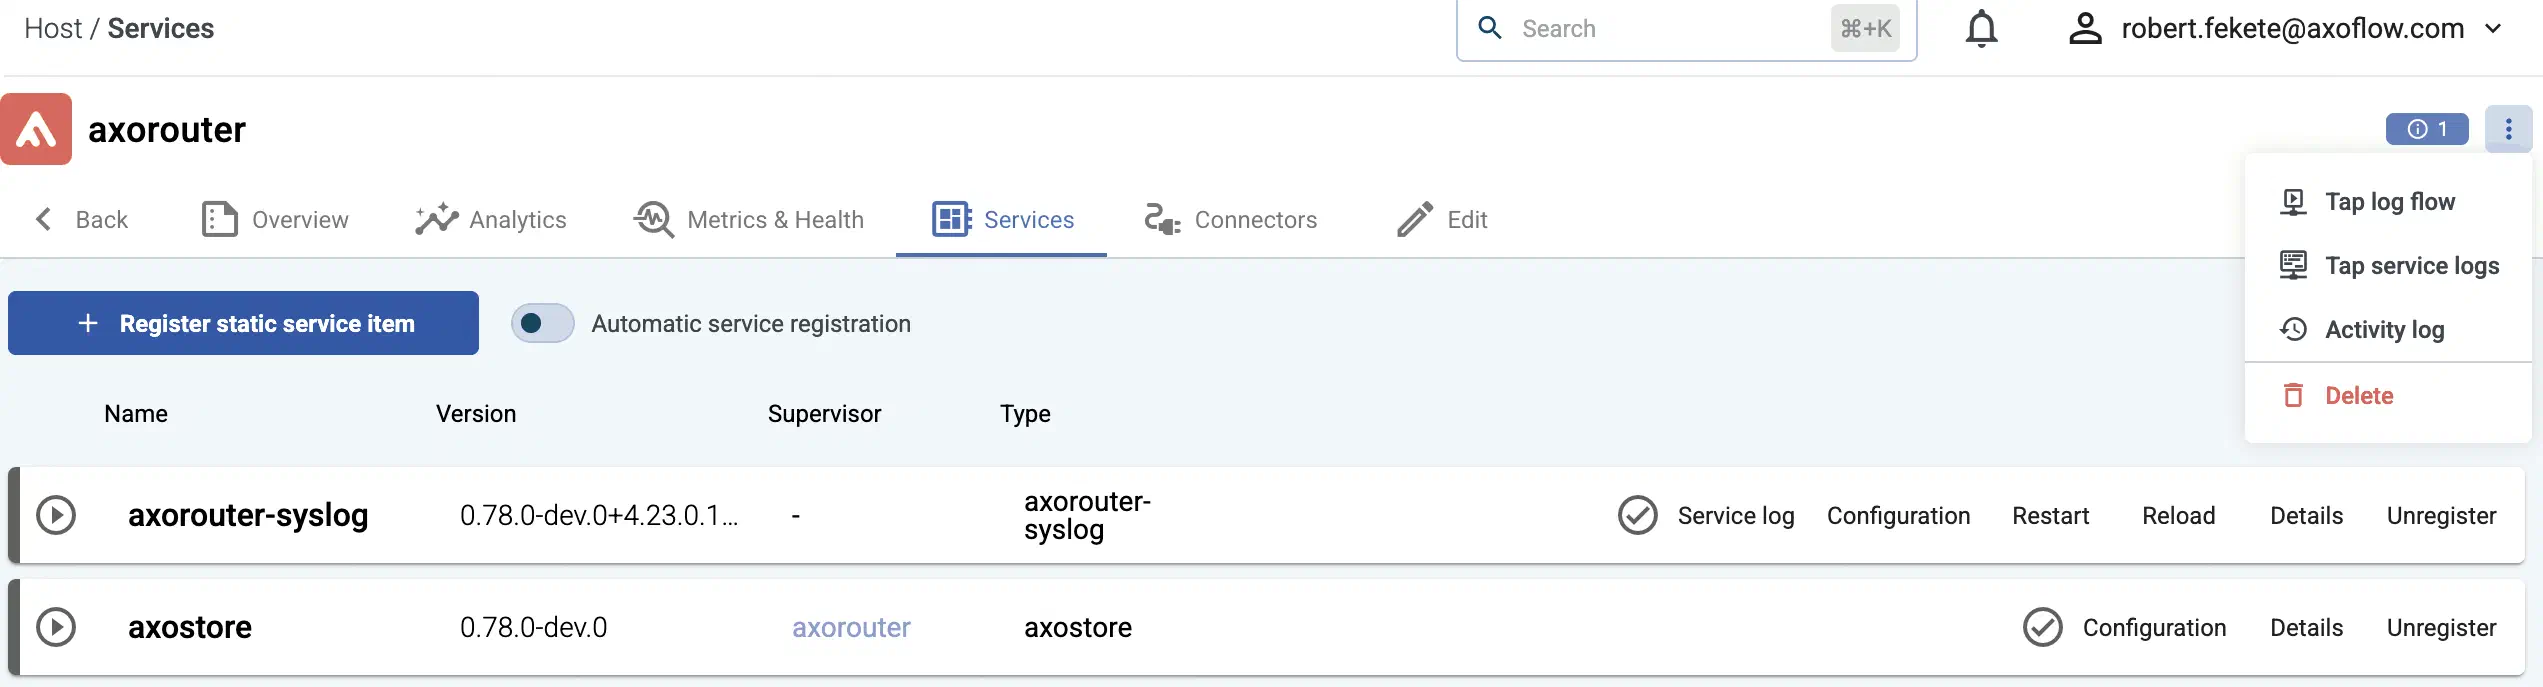
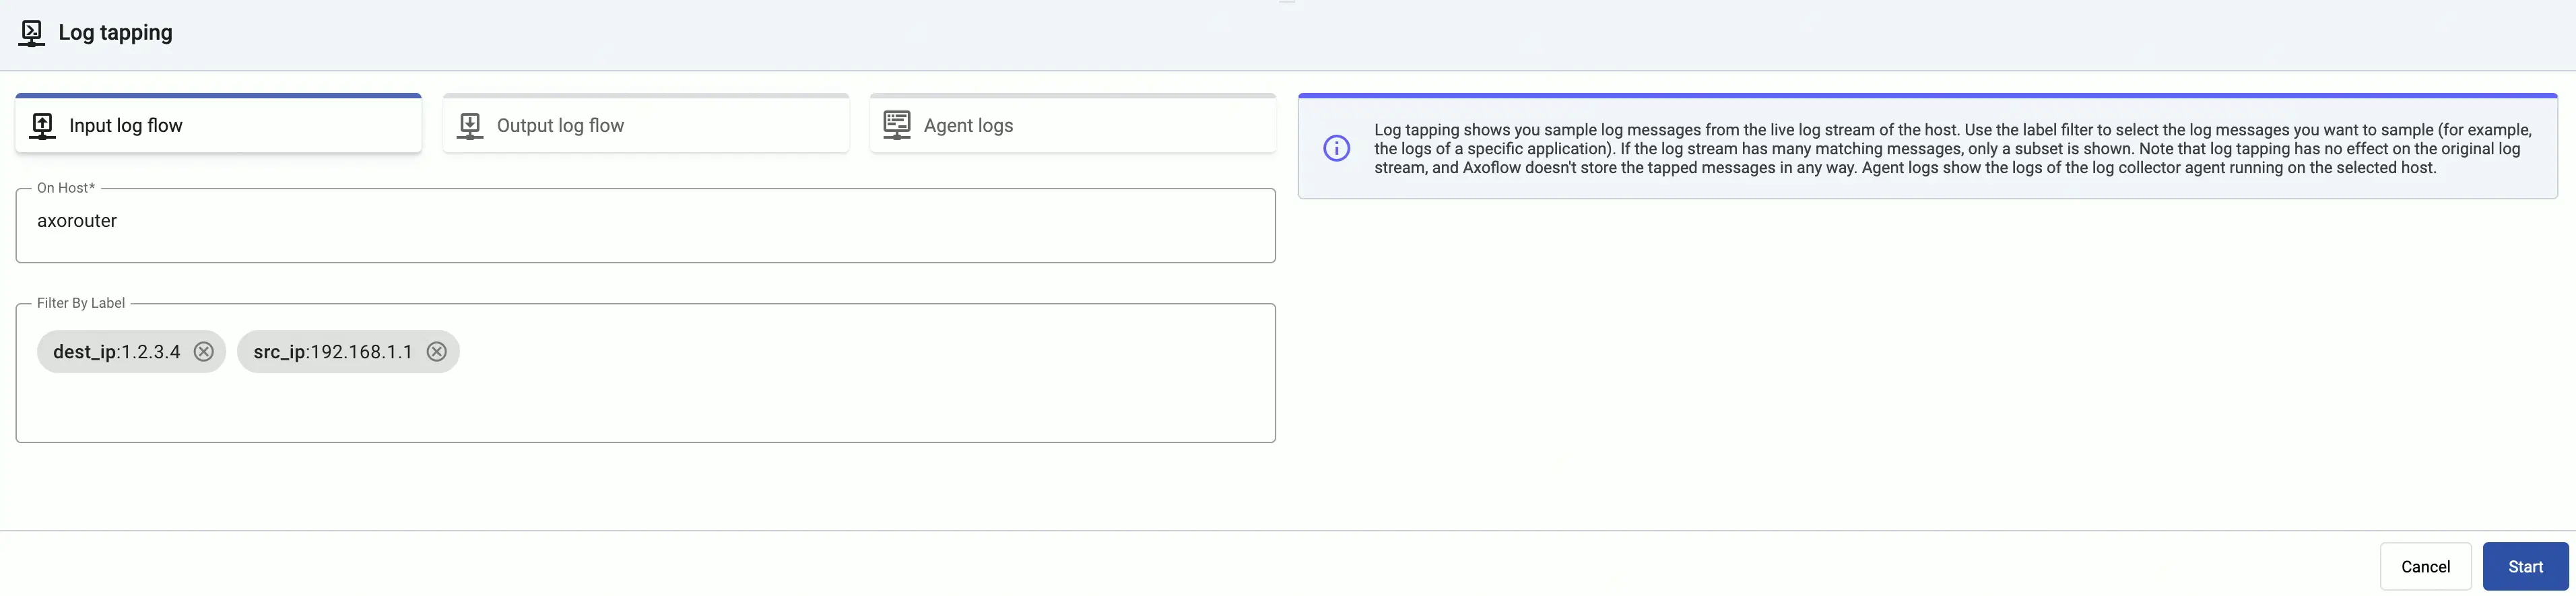
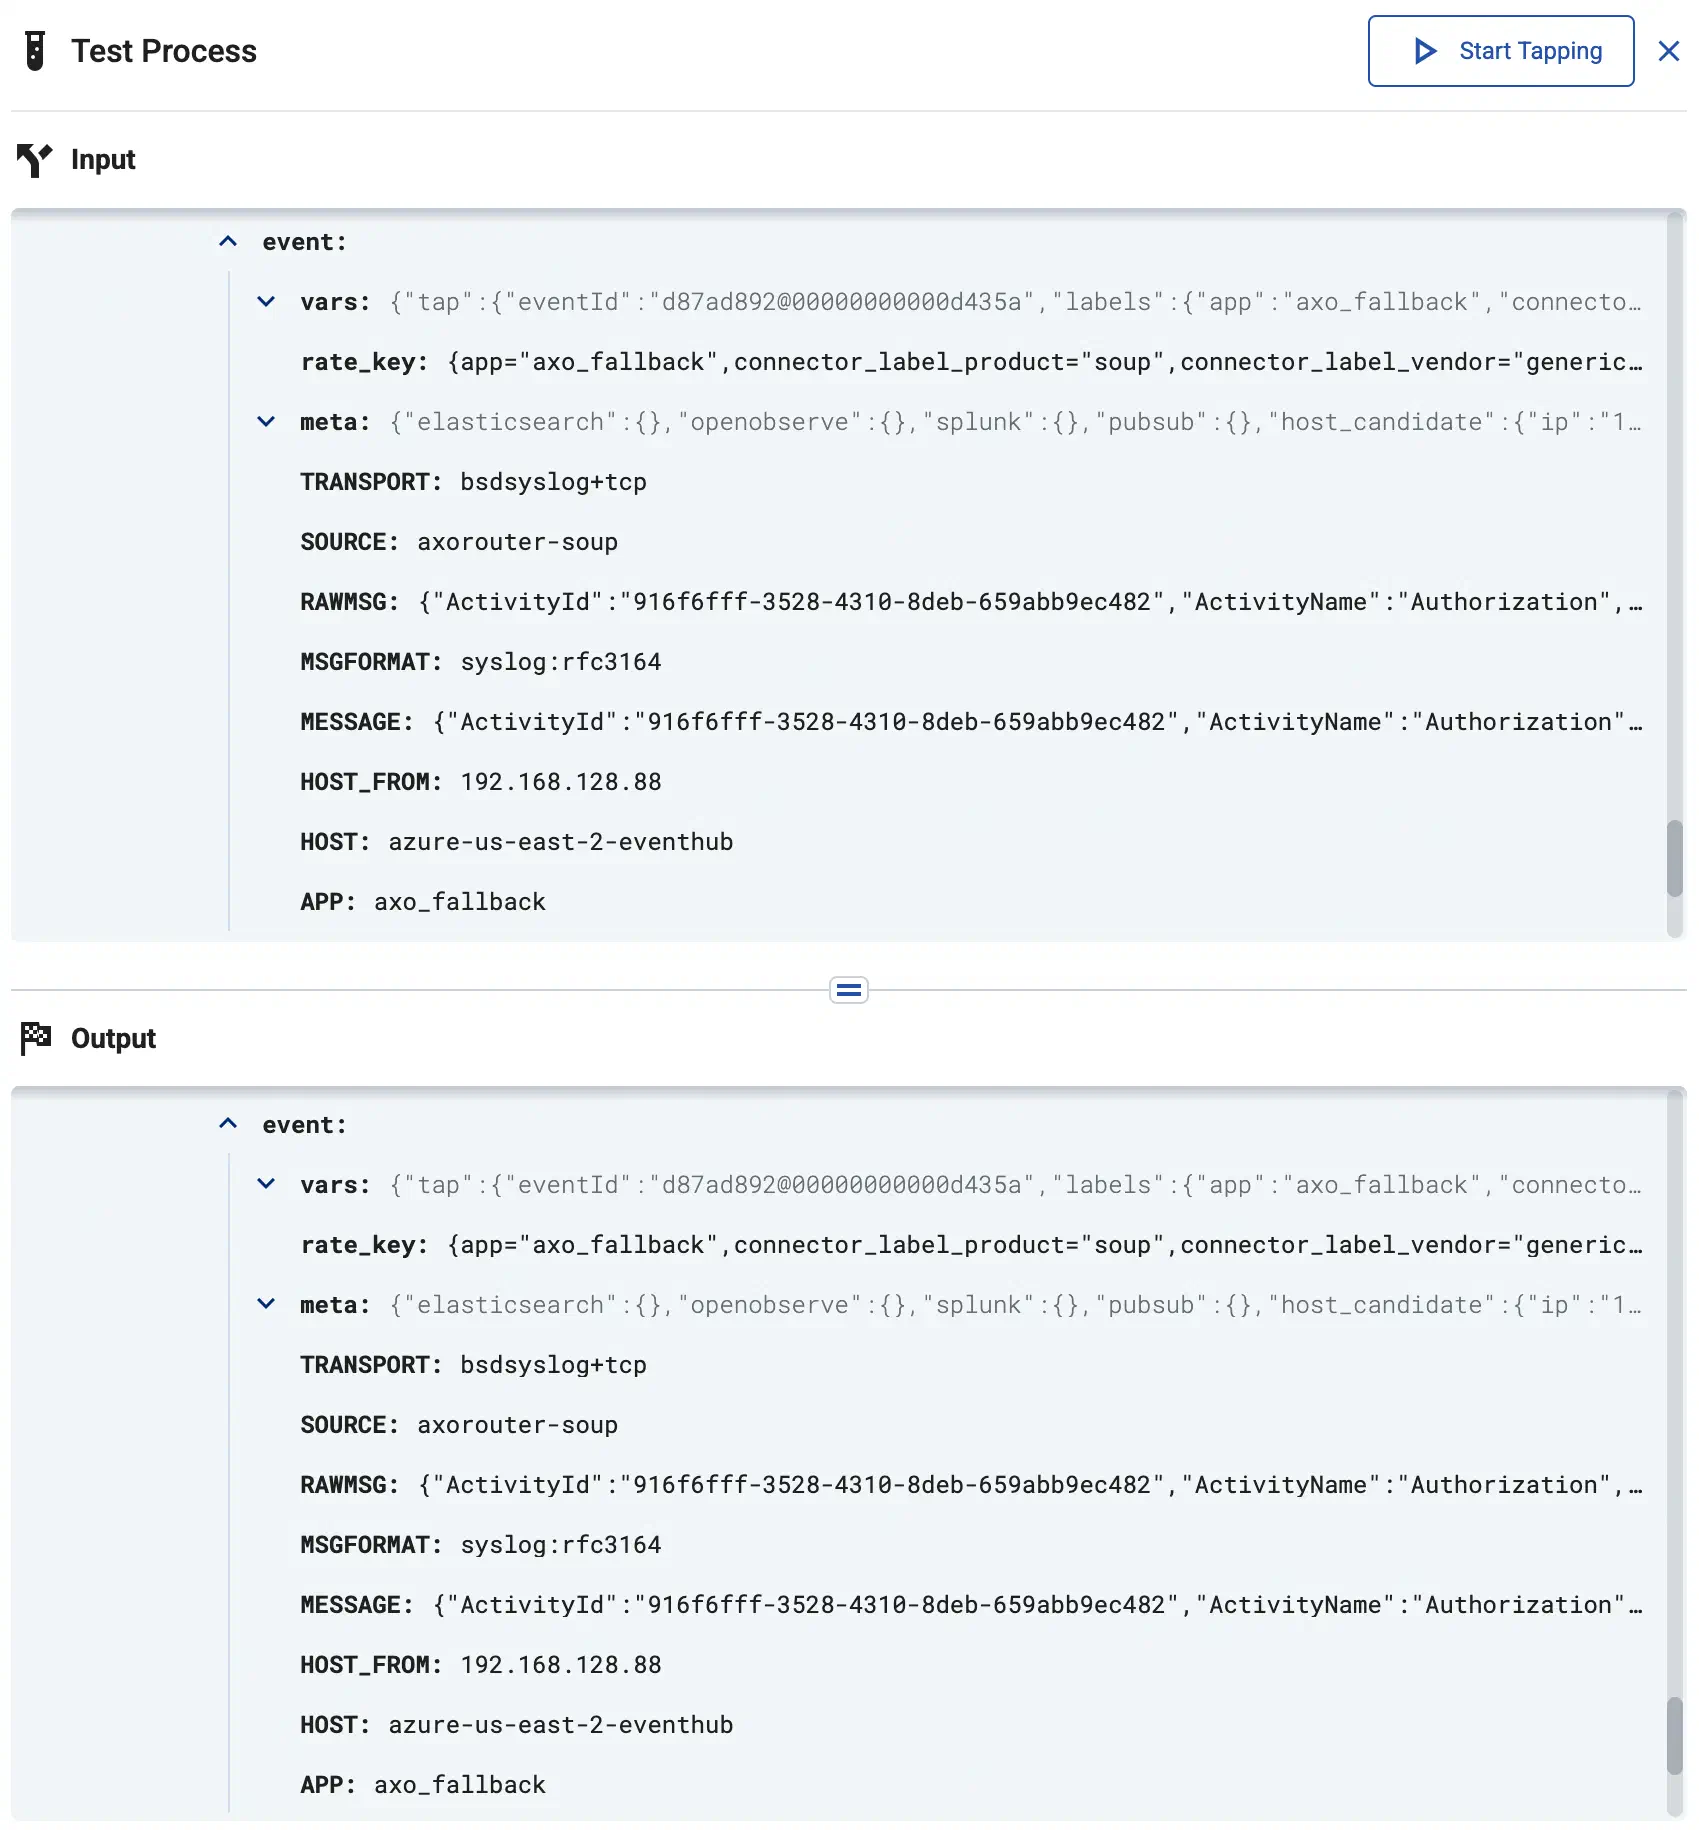
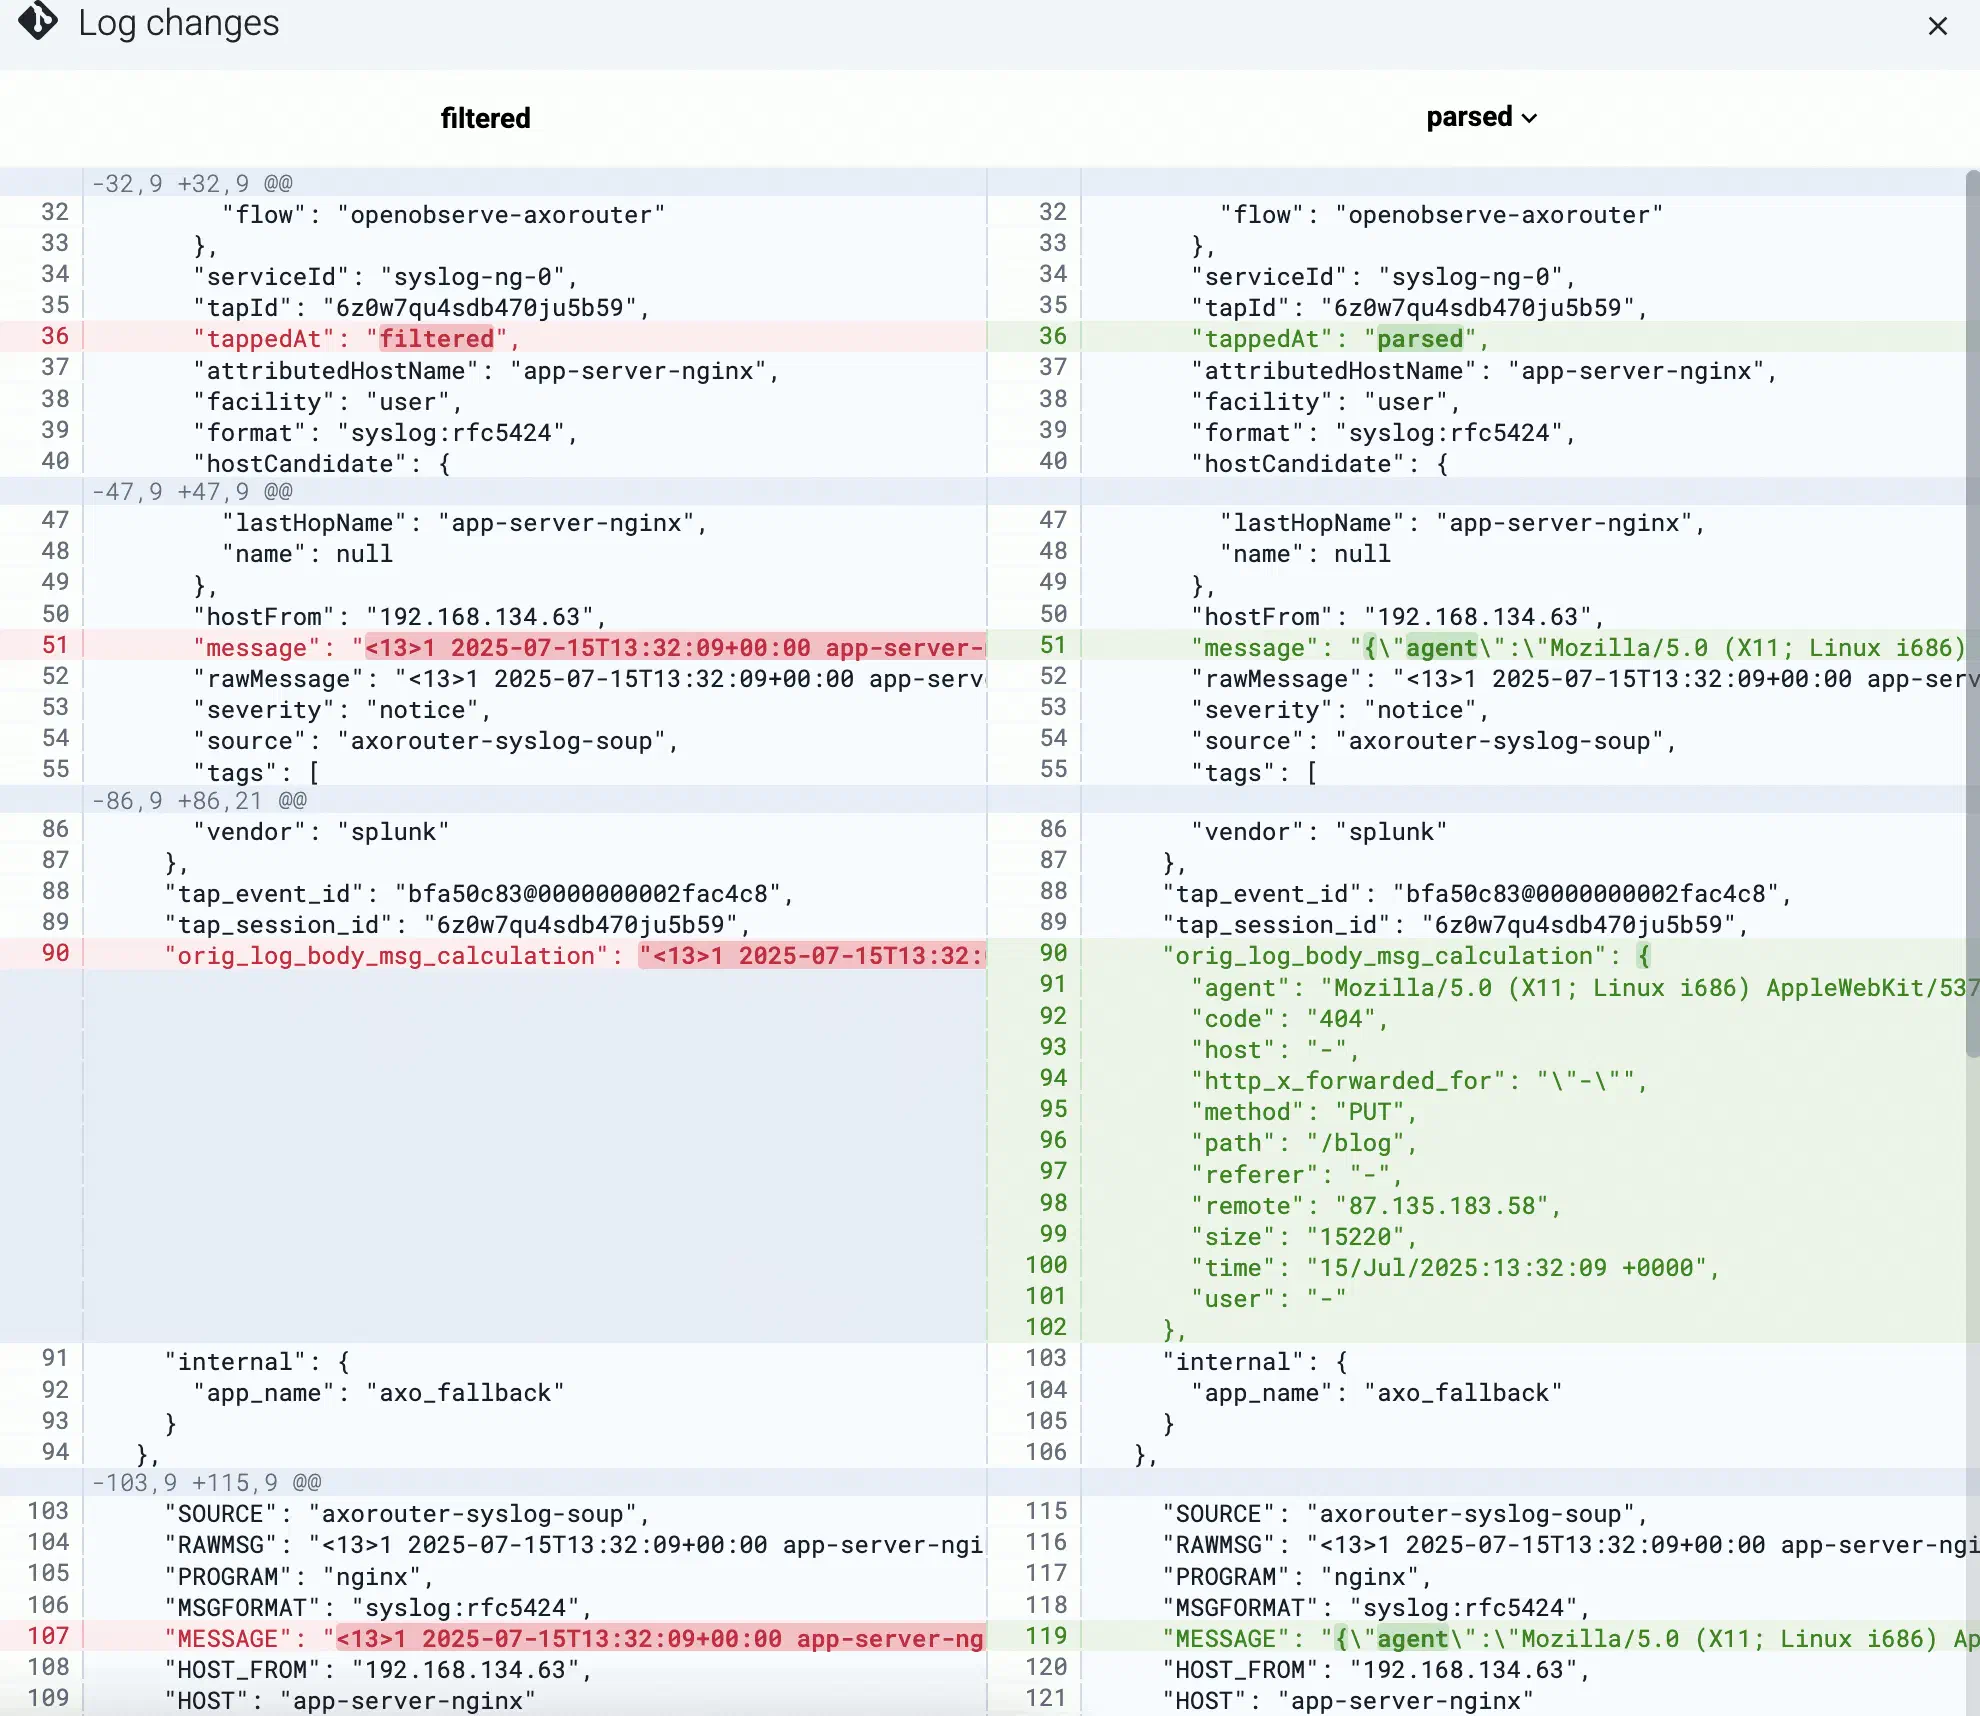
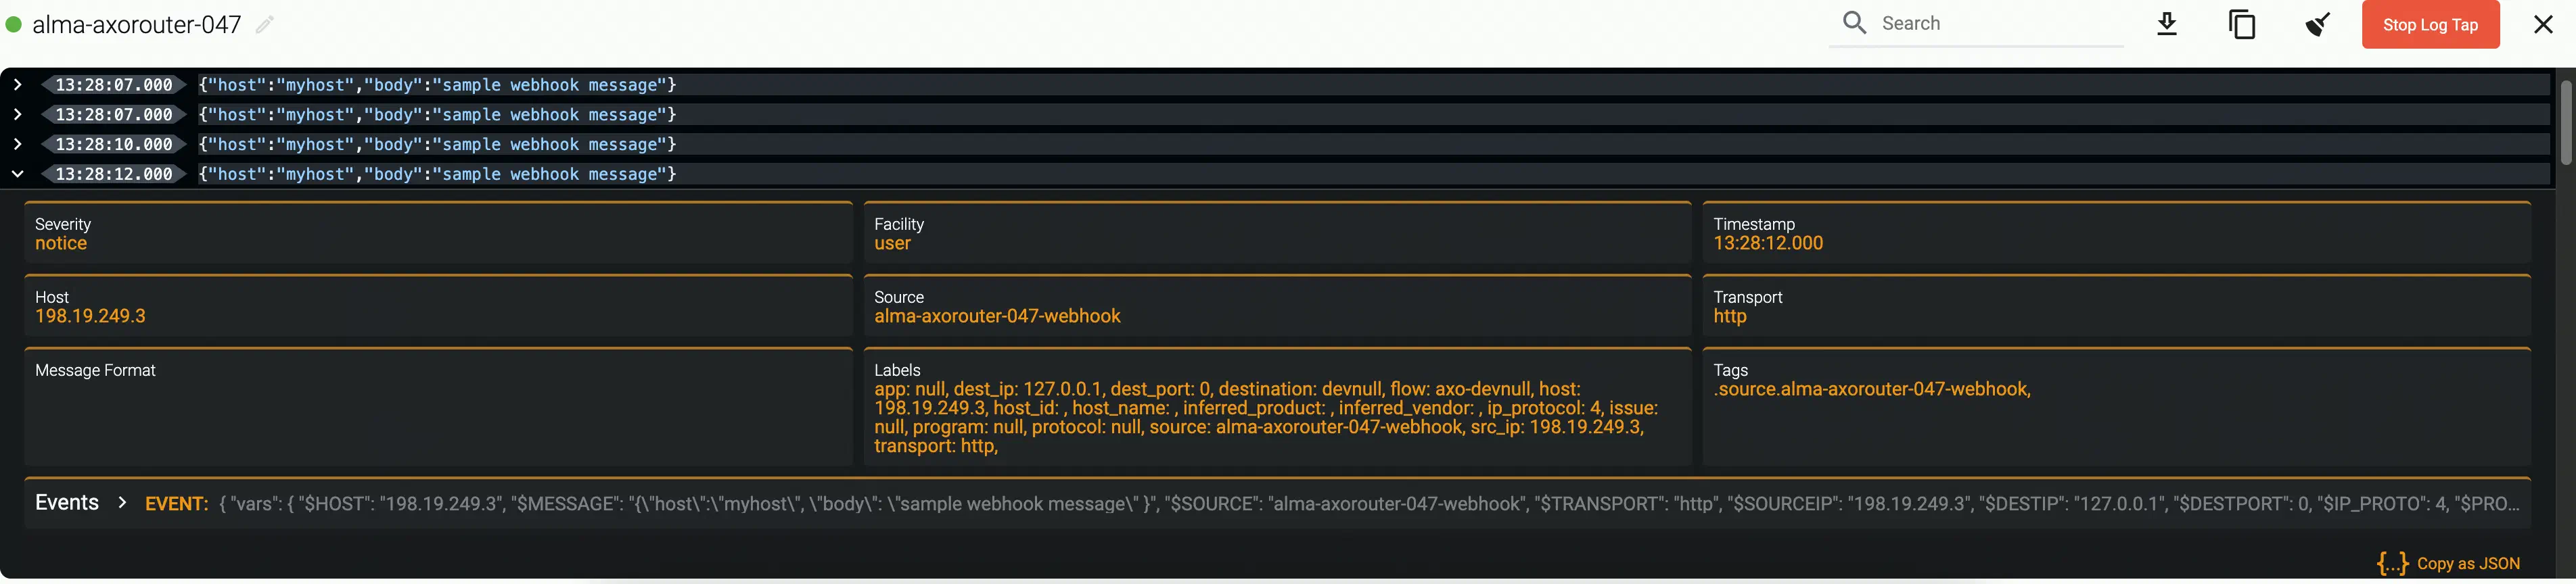
Tap into the log flow
Log tapping in Axoflow samples the log flow. You can use labels to filter for specific messages (like ones with parse errors) and tap only those messages. To not get overwhelmed with events, Axoflow automatically samples the output: if many messages match the selected filter, only a subset is shown (about 1 message per second). Using log tapping, you can quickly troubleshoot both parsing/curation errors and destination ingest (API) errors, and check:
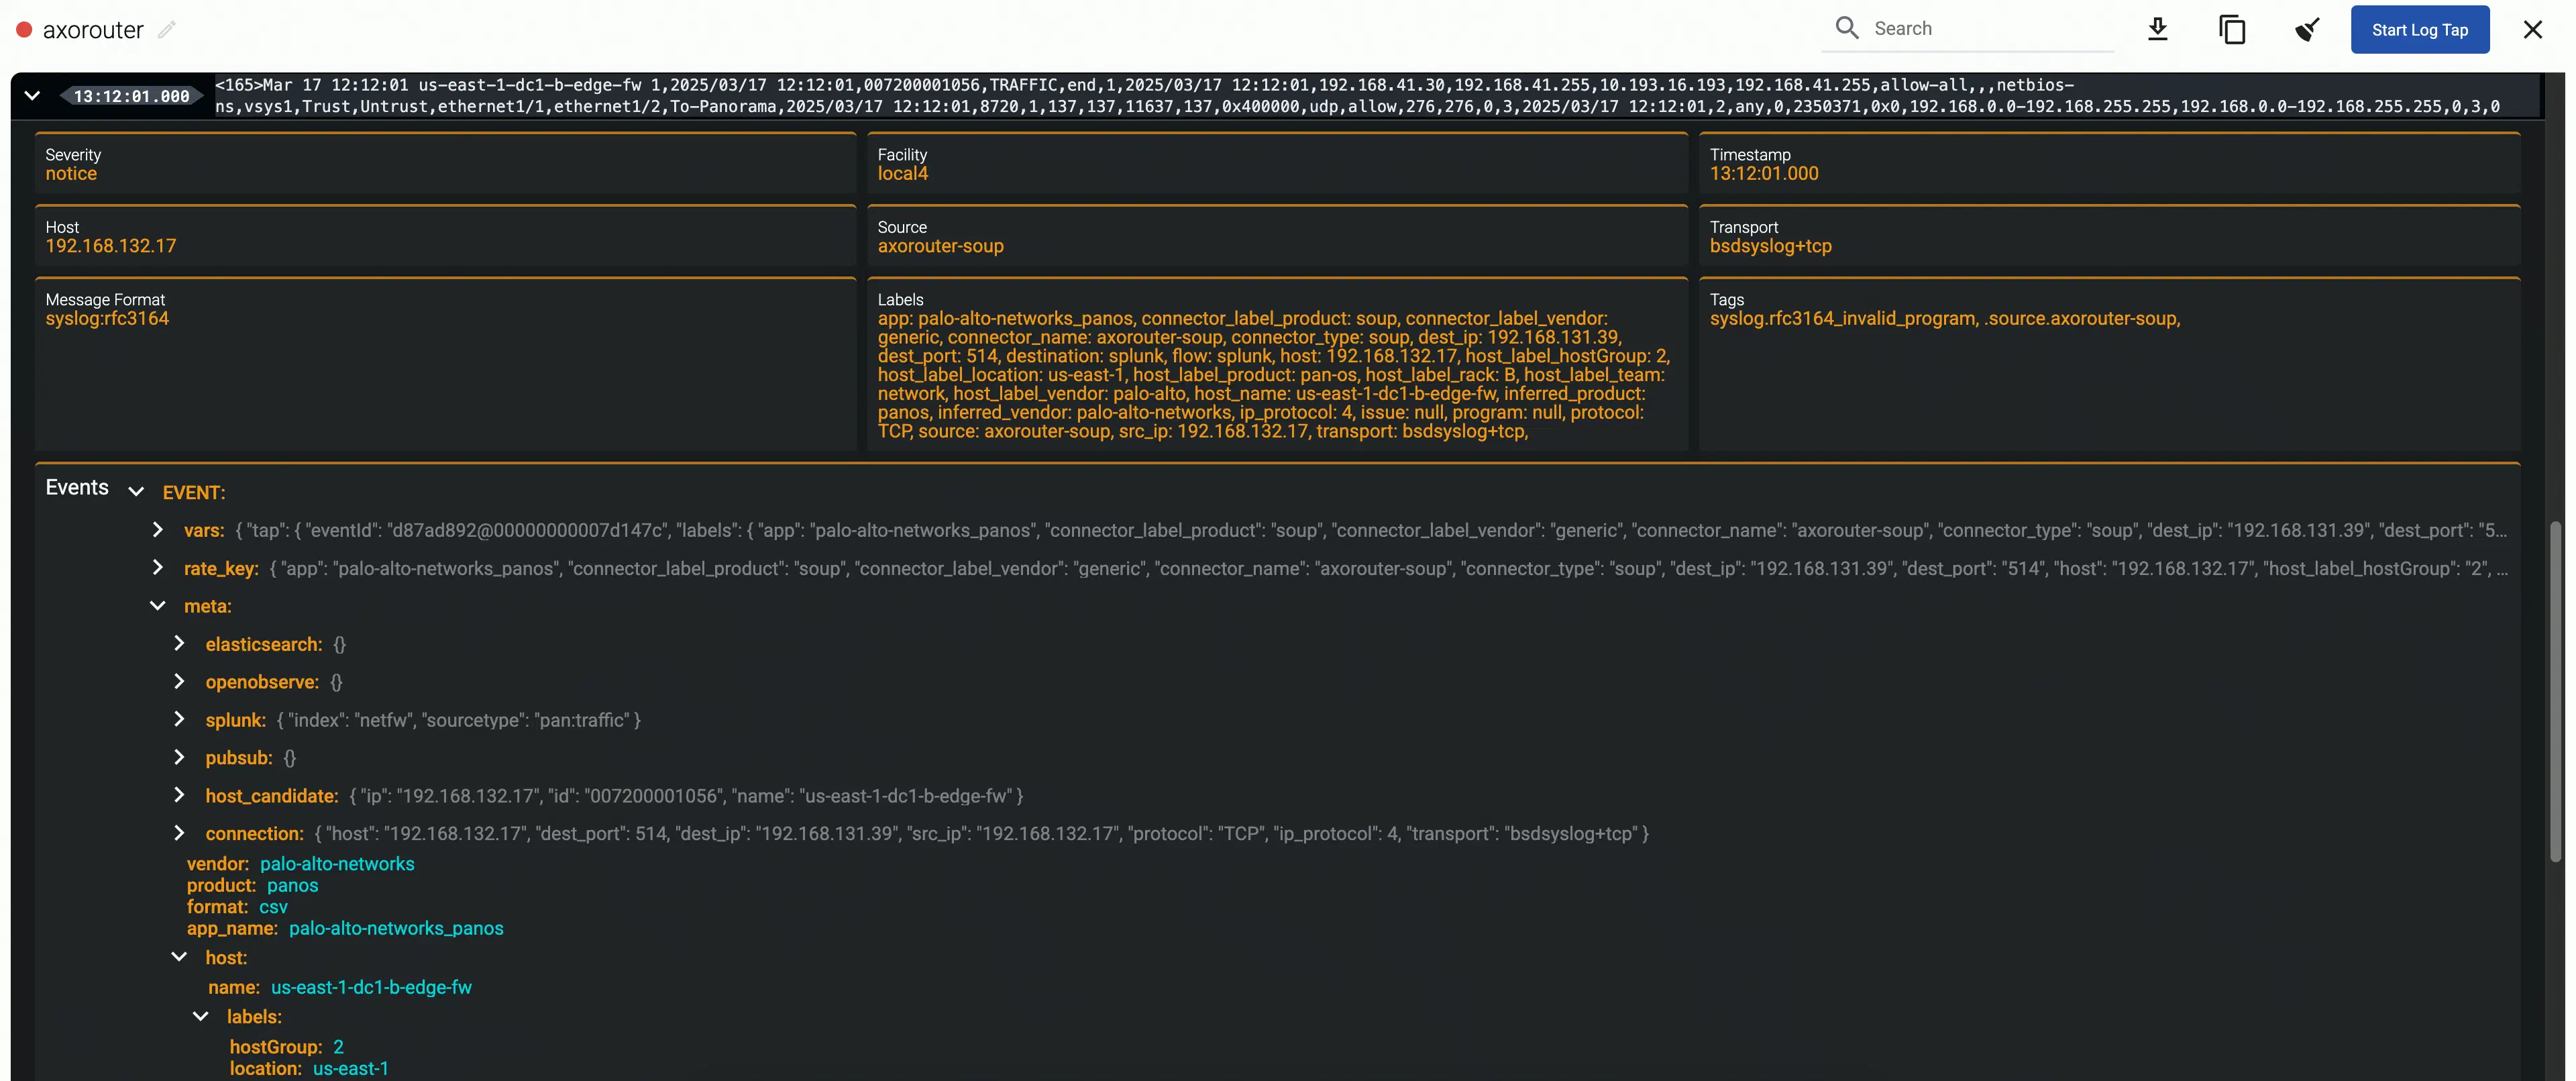
What was in the original message?
What is sent in the final payload to the destination?
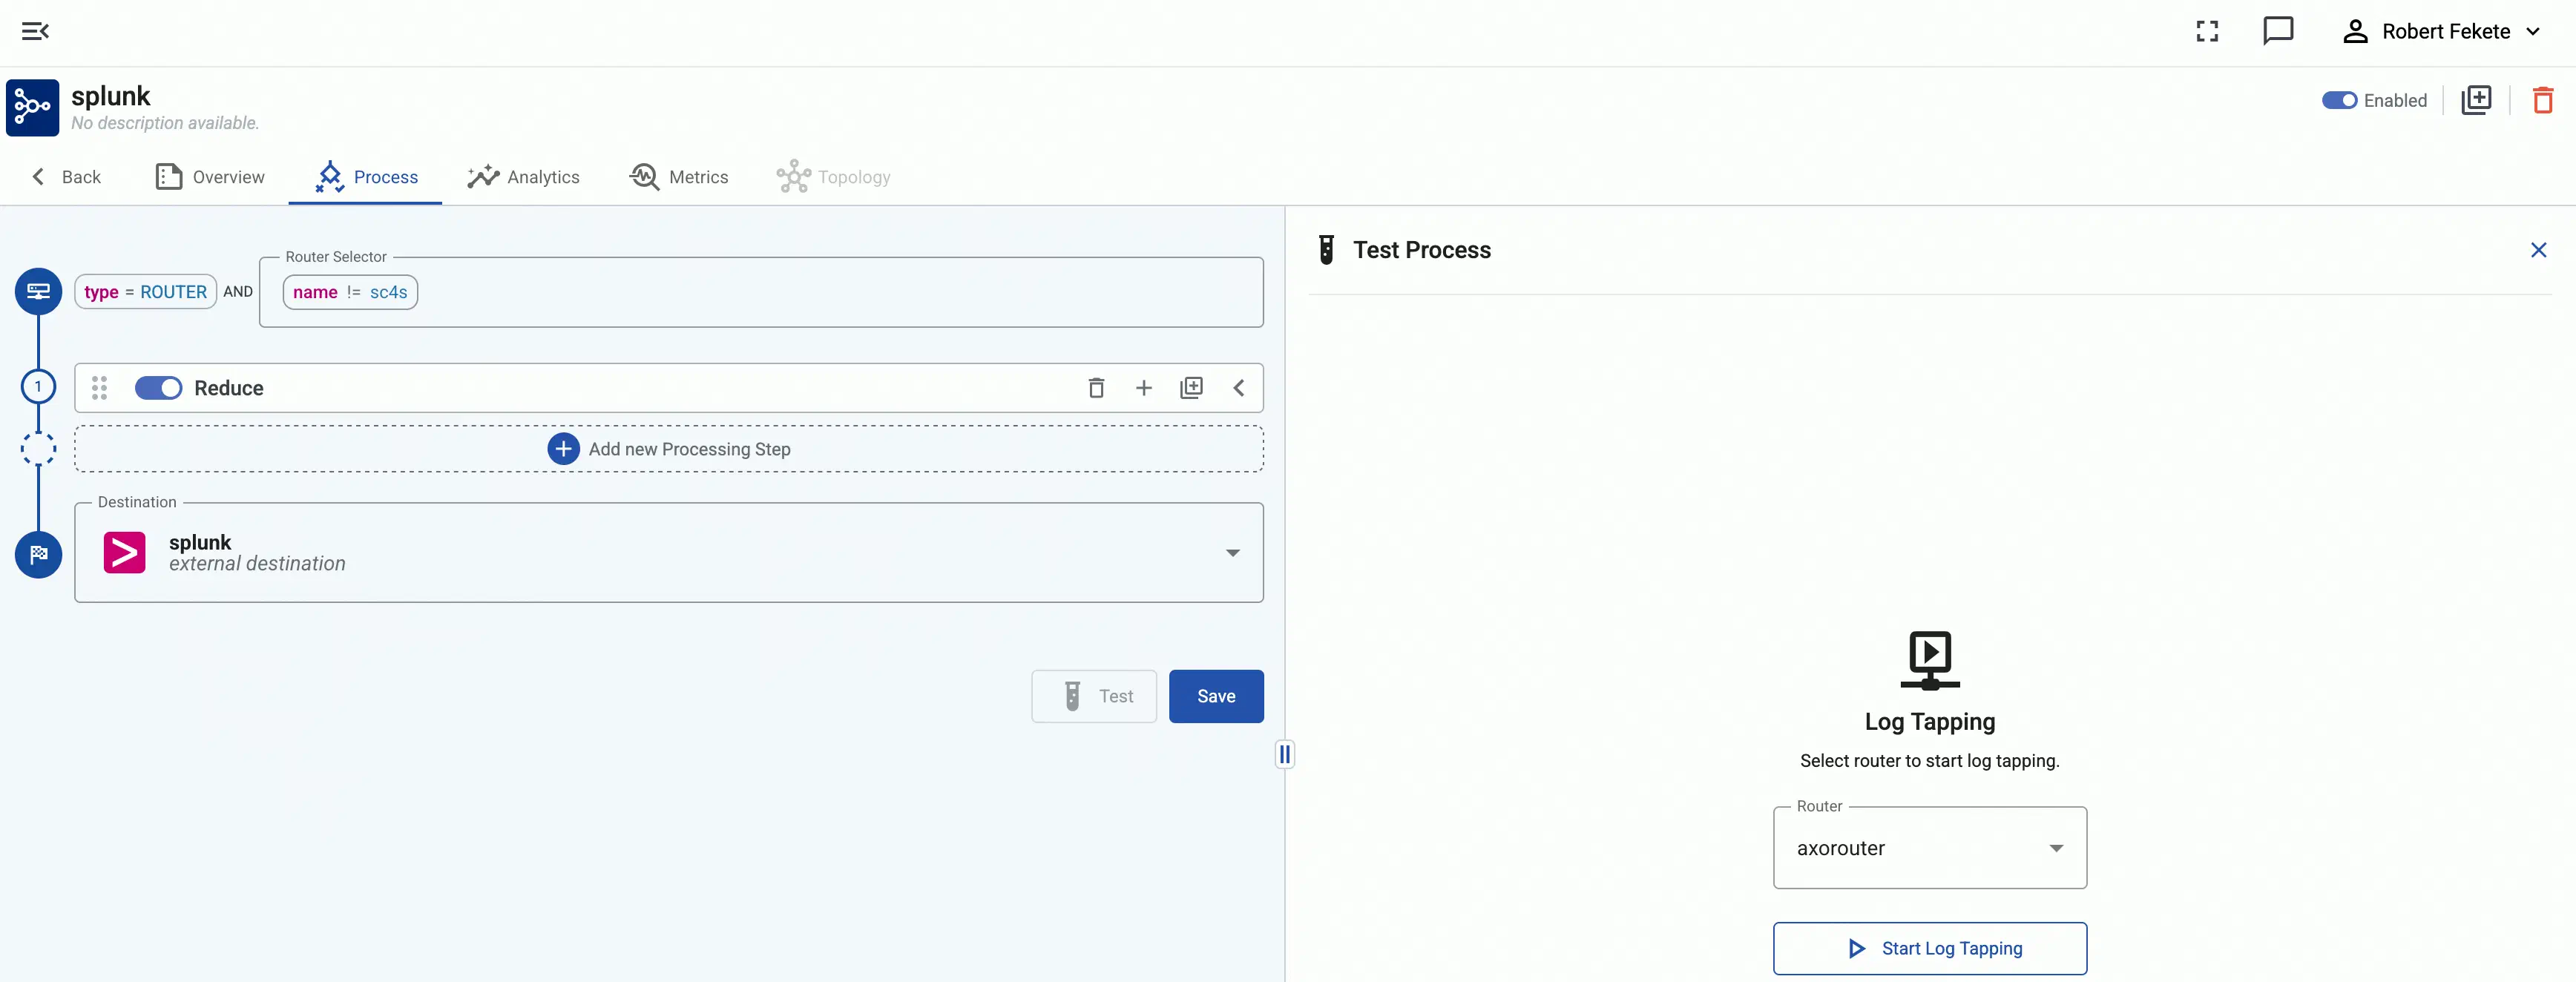
Tap into the log flow.
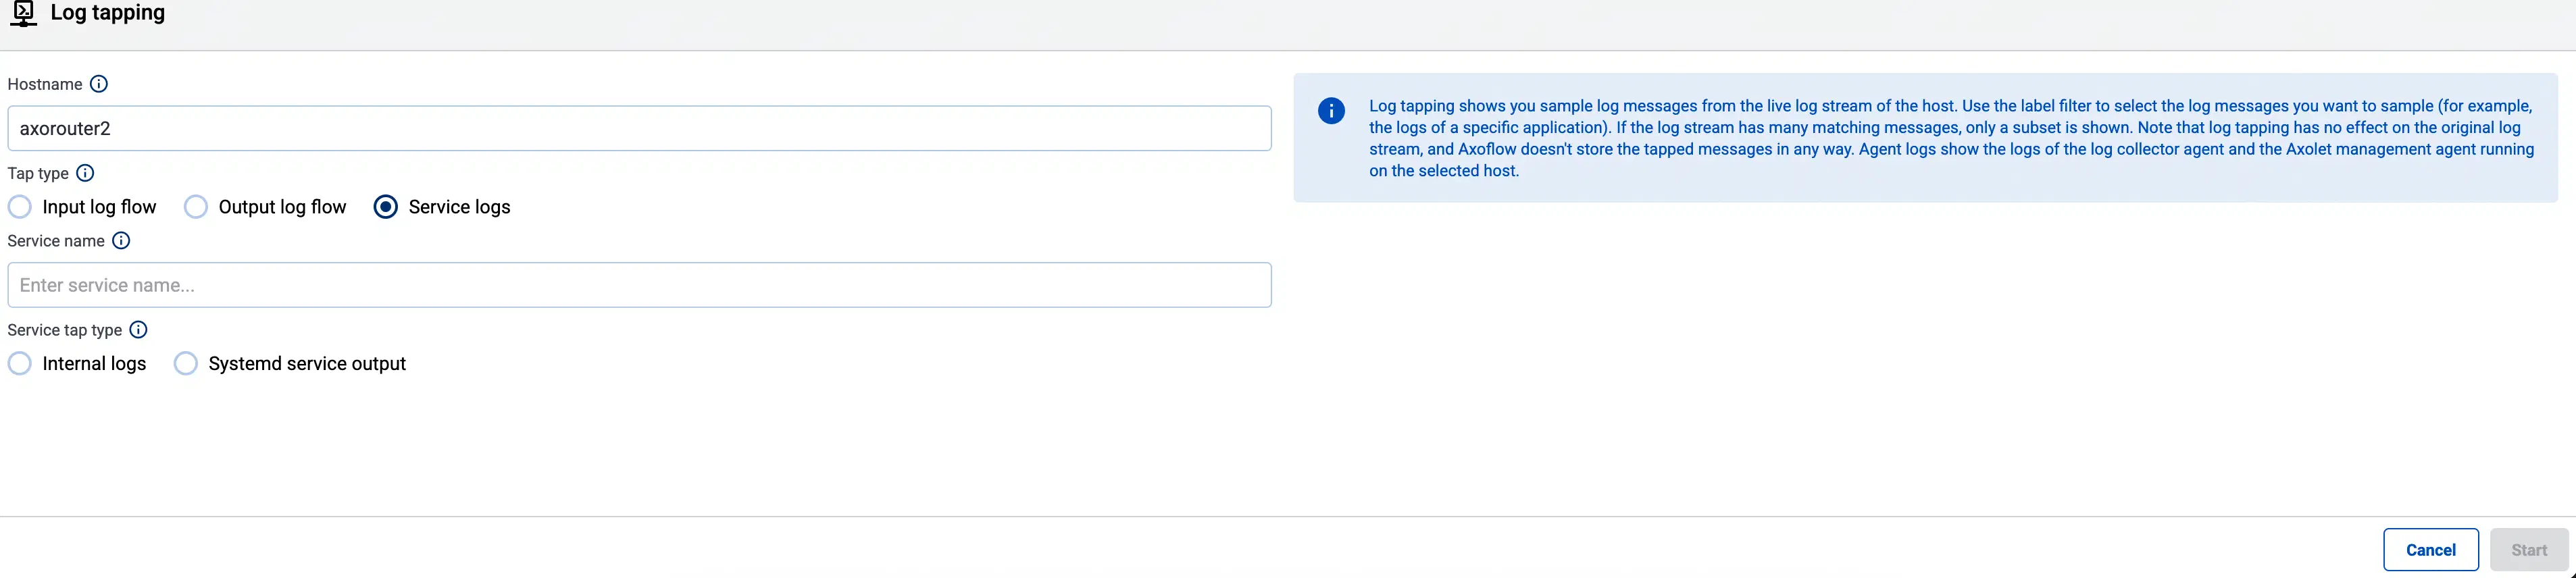
Click your AxoRouter instance on the Topology page, then select ⋮ > Tap log flow.
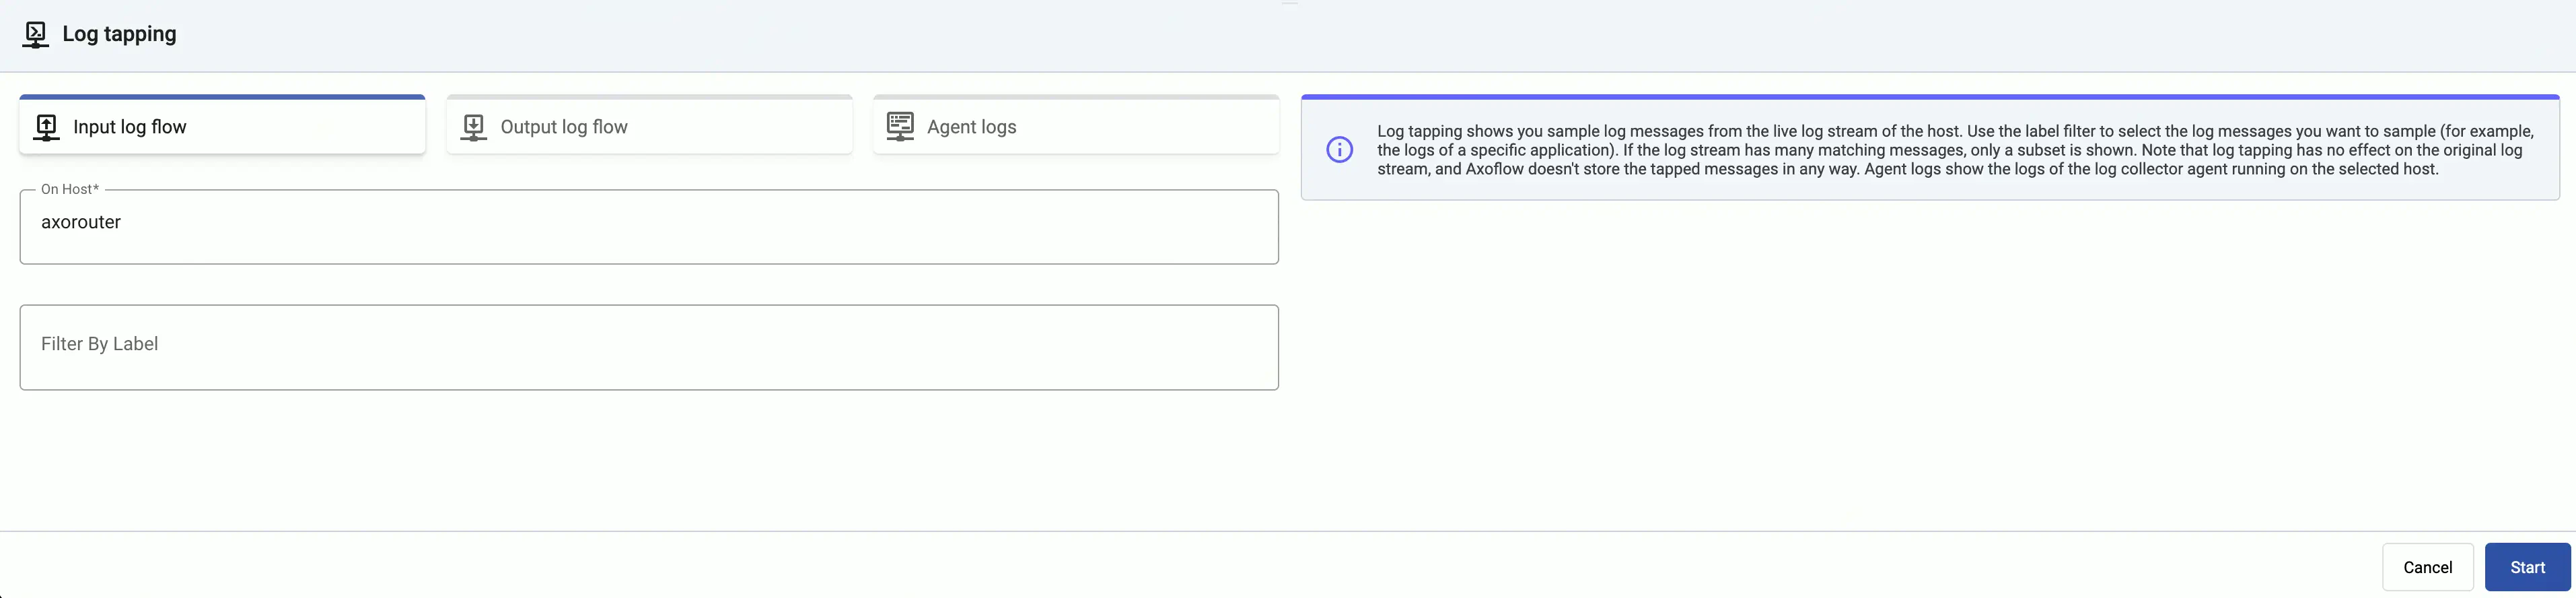
Tap into the log flow.
To see the input data, select Input log flow > Start.
To see the output data, select Output log flow > Start.
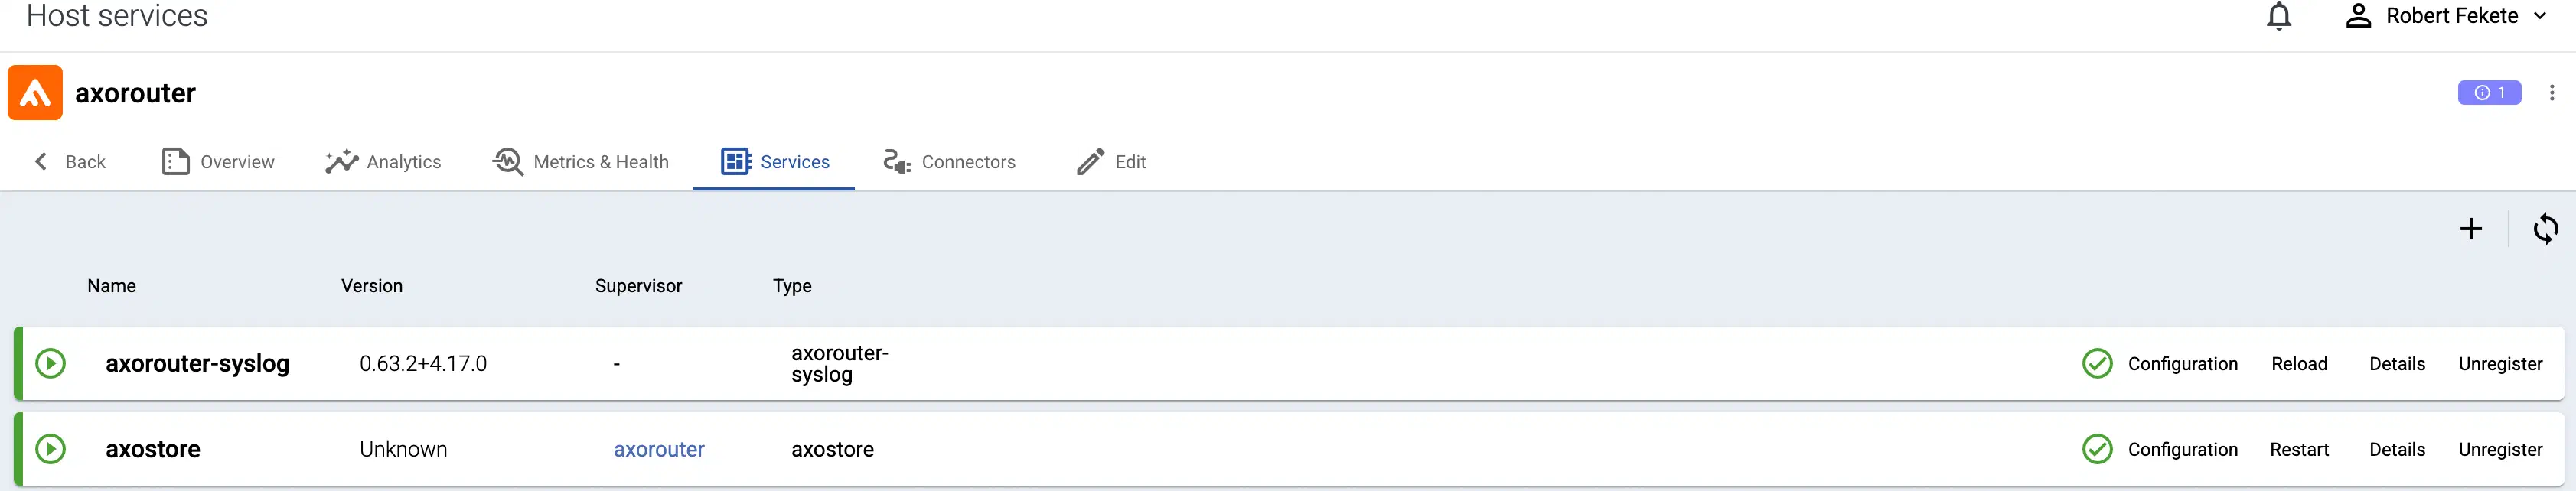
axostore: The service that handles AxoStore on the host. Only available if there are stores configured on the host.
If systemd is available on the host, select Systemd service output to show the logs of the service from the systemd journal. Otherwise, the Internal logs of the service are available.
Select Start. Axoflow displays the log messages of AxoRouter. Check the logs for error messages.
5.2 - Getting started using a SIEM
This guide shows you how to get started with Axoflow. You’re going to install AxoRouter, and configure or create a source to send data to AxoRouter. You’ll also configure AxoRouter to forward the received data to your destination SIEM or storage provider. The resulting topology will look something like this:
Why use Axoflow
Using the Axoflow security data pipeline automatically corrects and augments the security data you collect, resulting in high-quality, curated, SIEM-optimized data. It also removes redundant data to reduce storage and SIEM costs. In addition, it allows automates pipeline configuration and provides metrics and alerts for your telemetry data flows.
A data source. This can be any host that you can configure to send syslog or OpenTelemetry data to your AxoRouter instance that you’ll install. If you don’t want to change the configuration of an existing device, you can use a virtual machine or a docker container on your local computer.
A host that you’ll install AxoRouter on. This can be a separate Linux host, or a virtual machine running on your local computer.
AxoRouter should work on most Red Hat and Debian compatible Linux distributions. For production environments, we recommend using Red Hat 9.
A destination where AxoRouter will send the received data. This can be a supported SIEM or storage provider, like Splunk or Amazon S3 that you have access to. For a quick test of Axoflow, you can use a free Splunk or OpenObserve account as well. See our list of supported Destinations.
Network access
The host must be able to access the following domains related to the AxoConsole:
When using AxoConsole SaaS:
<your-tenant-id>.cloud.axoflow.io: HTTPS traffic on TCP port 443, needed to download the binaries for Axoflow software (like Axolet and AxoRouter).
kcp.<your-tenant-id>.cloud.axoflow.io: HTTPS (mutual TLS) traffic on TCP port 443 for management traffic.
telemetry.<your-tenant-id>.cloud.axoflow.io: HTTPS (mutual TLS) traffic on TCP port 443, where Axolet sends the metrics of the host.
us-docker.pkg.dev: HTTPS traffic on TCP port 443, but only if you’re forcing the installation script to pull the container images from the public repository. The Axolet and AxoRouter for Linux installation scripts download the images directly from AxoConsole.
When using an on-premise AxoConsole:
The following domains should point to AxoConsole IP address to access Axoflow from your desktop and AxoRouter hosts:
your-host.your-domain: The main domain of your AxoConsole deployment.
idp.your-host.your-domain: A subdomain for the identity provider.
kcp.your-host.your-domain: A subdomain for management traffic.
telemetry.your-host.your-domain: A subdomain for agent telemetry.
The AxoConsole host must have the following Open Ports:
Port 80 (HTTP)
Port 443 (HTTPS)
When installing Axoflow agent for Windows or Linux:
github.com: HTTPS traffic on TCP port 443, for downloading installer packages.
Open https://<your-tenant-id>.axoflow.io/ in your browser.
Log in using Google Authentication.
Deploy an AxoRouter instance
Deploy an AxoRouter instance that will route, curate, and enrich your log data.
Note
Note that AxoRouter and Axoflow agent collects detailed, real-time metrics about the data-flows – giving you observability over the health of the security data pipeline and its components. Your security data remains in your self-managed cloud or in your on-prem instance where your sources, destinations, Axoflow agents, and AxoRouters are running, only metrics are forwarded to AxoConsole.
Deploy AxoRouter on Linux. For other platforms, see AxoRouter.
Select Routers > Add Router.
Select the platform (Linux). The one-liner installation command is displayed.
(Optional) If you don’t want to store any logs locally on AxoRouter, disable AxoStore, select Advanced options, scroll down, and deselect Enable AxoStore.
(Optional)
If needed, set the Advanced options (for example, proxy settings, or External image pull in air-gapped environments) to modify the installation parameters. Usually, you don’t have to use advanced options unless the Axoflow support team instructs you to do so.
Open a terminal on the host where you want to install AxoRouter.
Run the one-liner, then follow the on-screen instructions.
Note
Running the provisioning command with sudo would mask environment variables of the calling shell. Either start the whole procedure from a root shell, or let the install script call sudo when it needs to. In other words: don’t add the sudo command to the provisioning command.
Example output:
Do you want to install AxoRouter now? [Y]% Total % Received % Xferd Average Speed Time Time Time Current
Dload Upload Total Spent Left Speed
1005480100548000320760 --:--:-- --:--:-- --:--:-- 33414Selecting previously unselected package axorouter.
(Reading database ... 17697 files and directories currently installed.)Preparing to unpack axorouter.deb ...
Unpacking axorouter (0.66.0) ...
Setting up axorouter (0.66.0) ...
Low maximum socket receive buffer size value detected: 7500000 bytes (7.2MB).
Do you you want to permanently set the net.core.rmem_max sysctl value to 33554432 bytes (32MB) on this system? [Y]net.core.rmem_max =33554432Created symlink '/etc/systemd/system/multi-user.target.wants/axostore.path' → '/etc/systemd/system/axostore.path'.
Created symlink '/etc/systemd/system/multi-user.target.wants/axorouter-wec.path' → '/etc/systemd/system/axorouter-wec.path'.
% Total % Received % Xferd Average Speed Time Time Time Current
Dload Upload Total Spent Left Speed
100 42.9M 100 42.9M 00 28.1M 0 0:00:01 0:00:01 --:--:-- 28.2M
Selecting previously unselected package axolet.
(Reading database ... 17707 files and directories currently installed.)Preparing to unpack axolet.deb ...
Unpacking axolet (0.66.0) ...
Setting up axolet (0.66.0) ...
Created symlink '/etc/systemd/system/multi-user.target.wants/axolet.service' → '/usr/lib/systemd/system/axolet.service'.
Now continue with onboarding the host on the Axoflow web UI.
Note
If you get the following errors:
AXOROUTER_FUSE envvar is not set. It may mean that the /usr/local/bin/setup-axorouter script is called without proper configuration.
Failed to configure AxoRouter.
Failed to deploy the AxoRouter.
Set the following (or equivalent) in the sudoers file on the host, and rerun the installation command.
Reload the Provisioning page. There should be a registration request for the new AxoRouter deployment. Select ✓.
Select Register to register the host. You can add a description and labels (in label:value format) to the host.
If the primary IP address (the first IP address shown in the Network addresses section on the Routers page for each AxoRouter) is not accessible from your edge hosts, set a Network address override (IP address or an FQDN) that’s accessible. Otherwise, data forwarding from edge hosts will fail.
Select the Topology page. The new AxoRouter instance is displayed.
Add a source
Configure a host to send data to AxoRouter.
Configure a generic syslog host. For sources that are specifically supported by Axoflow, see Sources.
Log in to your device. You need administrator privileges to perform the configuration.
If needed, enable syslog forwarding on the device.
Set AxoRouter as the syslog server. Typically, you can configure the following parameters:
Name or IP Address of the syslog server: Set the address of your AxoRouter.
Protocol: If possible, set TCP or TLS.
Note
If you’re sending data over TLS, make sure to configure a TLS-enabled connector rule in Axoflow.
Syslog Format: If possible, set RFC5424 (or equivalent), otherwise leave the default.
Port: Set a port appropriate for the protocol and syslog format you have configured.
By default, AxoRouter accepts data on the following ports (unless you’ve modified the default connector rules):
514 UDP and TCP for RFC3164 (BSD-syslog) and RFC5424 (IETF-syslog) formatted traffic. AxoRouter automatically recognizes and handles both formats.
601 TCP for RFC5424 (IETF-syslog) and RFC3164 (BSD-syslog) formatted traffic. AxoRouter automatically recognizes and handles both formats.
6514 TCP for TLS-encrypted syslog traffic.
4317 TCP for OpenTelemetry log data.
To receive data on other ports or other protocols, configure other connector rules for the AxoRouter host.
For TLS-encrypted syslog connections, create a new connector rule or edit an existing one, and configure the keys and certificates needed to encrypt the connections. For details, see Syslog.
Note
Make sure to enable the ports you’re using on the firewall of your host.
Add the source to AxoConsole.
Open the AxoConsole and select Topology.
Select Add Item > Source.
If the source is actively sending data to an AxoRouter instance, select Detected, then select your source(s) and select Add Selected Source(s).
Otherwise, select the vendor and product corresponding to your source from the Predefined sources, then enter the parameters of the source, like IP address and FQDN.
Note
During log tapping, you can add hosts that are actively sending data to an AxoRouter instance by clicking Register source.
(Optional) Add Path manually. That’s needed only when AxoConsole can’t detect the path based on the IP address and the FQDN, and you haven’t yet configured the source to send data to the router.
Add a path
Create a path between the source and the AxoRouter instance. If you've added the source from the Detected list, you can skip this step, as the path is created automatically. (Creating a path is usually part of adding the source. You only have to add paths explicitly if you forgot to do that during source provisioning.)
Select Topology > Add Item > Path.
Select the target router or aggregator this source is sending its data to in the Target host field, for example, axorouter.
Select the Target connector. The connector determines how the destination receives the data (for example, using which protocol or port).
Select Add. The new path appears on the Topology page.
Note
If your syslog source is running syslog-ng, Splunk Connect for Syslog (SC4S), or AxoSyslog as its log forwarder agent, consider installing Axolet on the host and instrumenting the configuration of the log forwarder to receive detailed metrics about the host and the processed data. For details, see Manage and monitor the pipeline.
Add a destination
Add the destination where you’re sending your data. For a quick test, you can use a free Splunk or OpenObserve account.
Add a Splunk Cloud destination. For other destinations, see Destinations.
If you’re using AxoRouter, create the indexes where Axoflow sends the log data. Which index is needed depends on the sources you have, but create at least the following event indices: axoflow, infraops, netops, netfw, osnix (for unclassified messages). Check your sources in the Sources section for a detailed lists on which indices their data is sent.
If you’ve created any new indexes, make sure to add those indexes to the token’s Allowed Indexes.
Steps
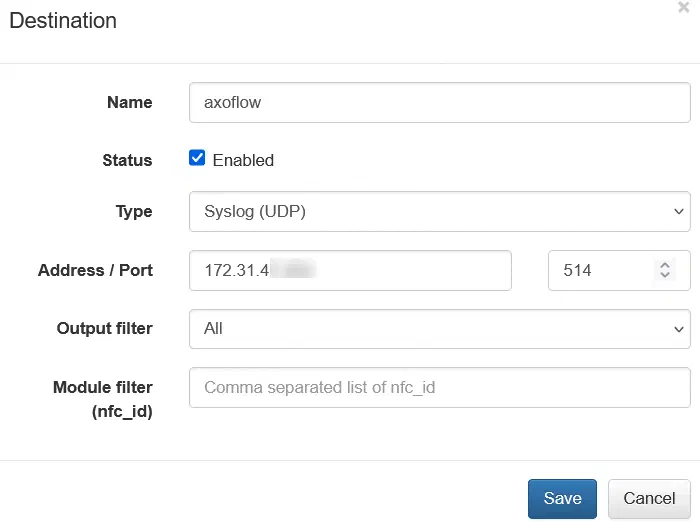
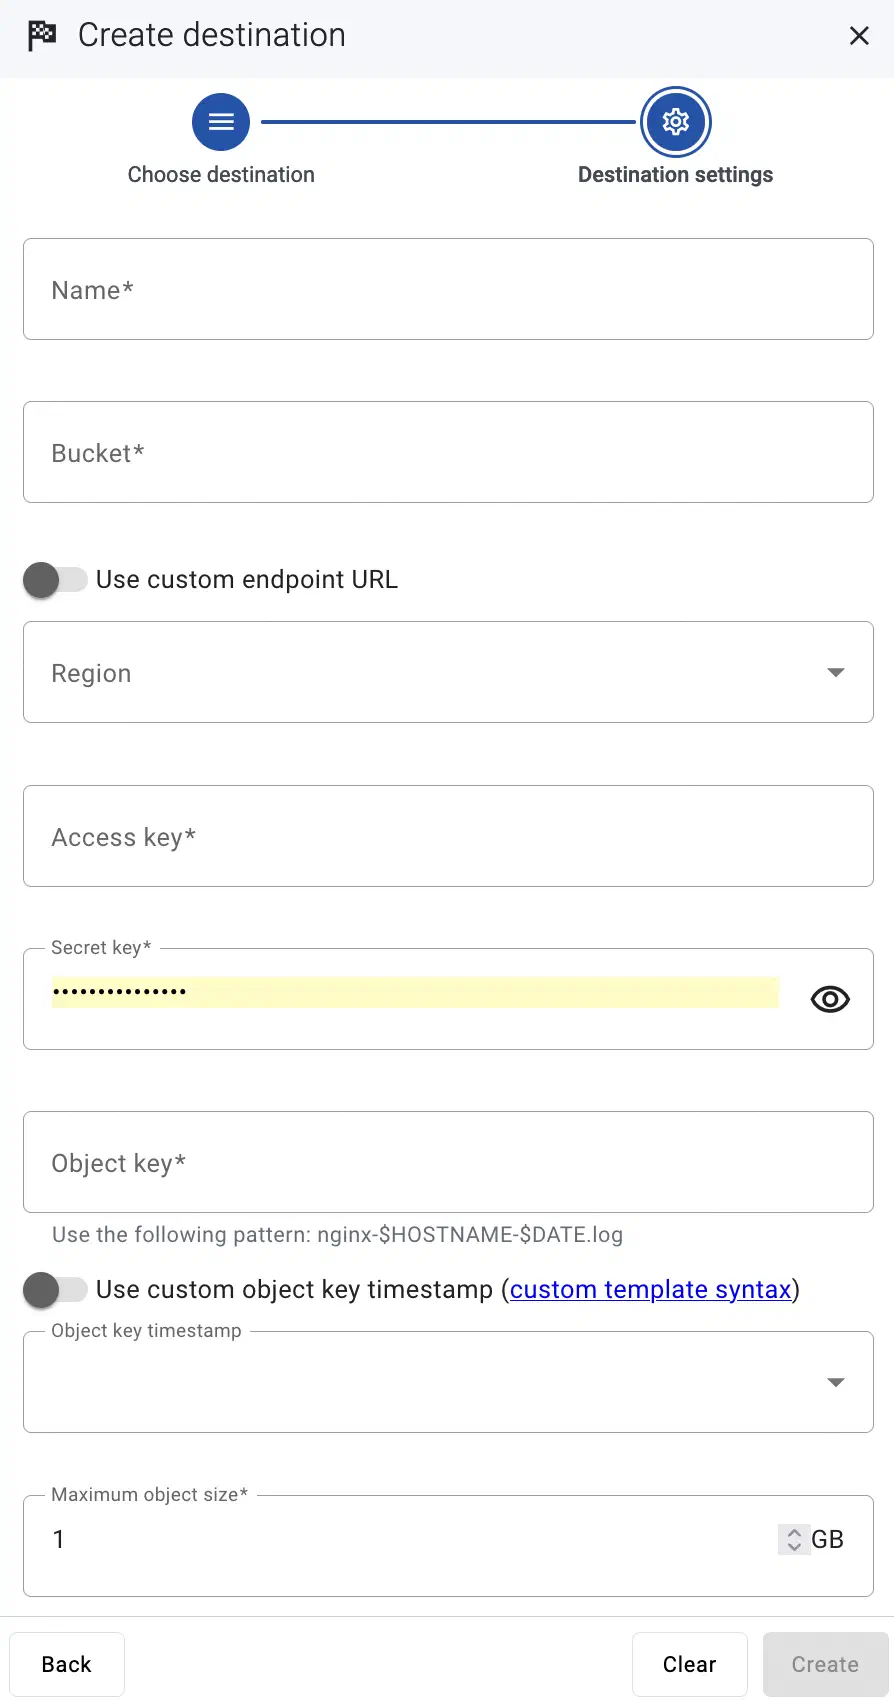
Create a new destination.
Open the AxoConsole.
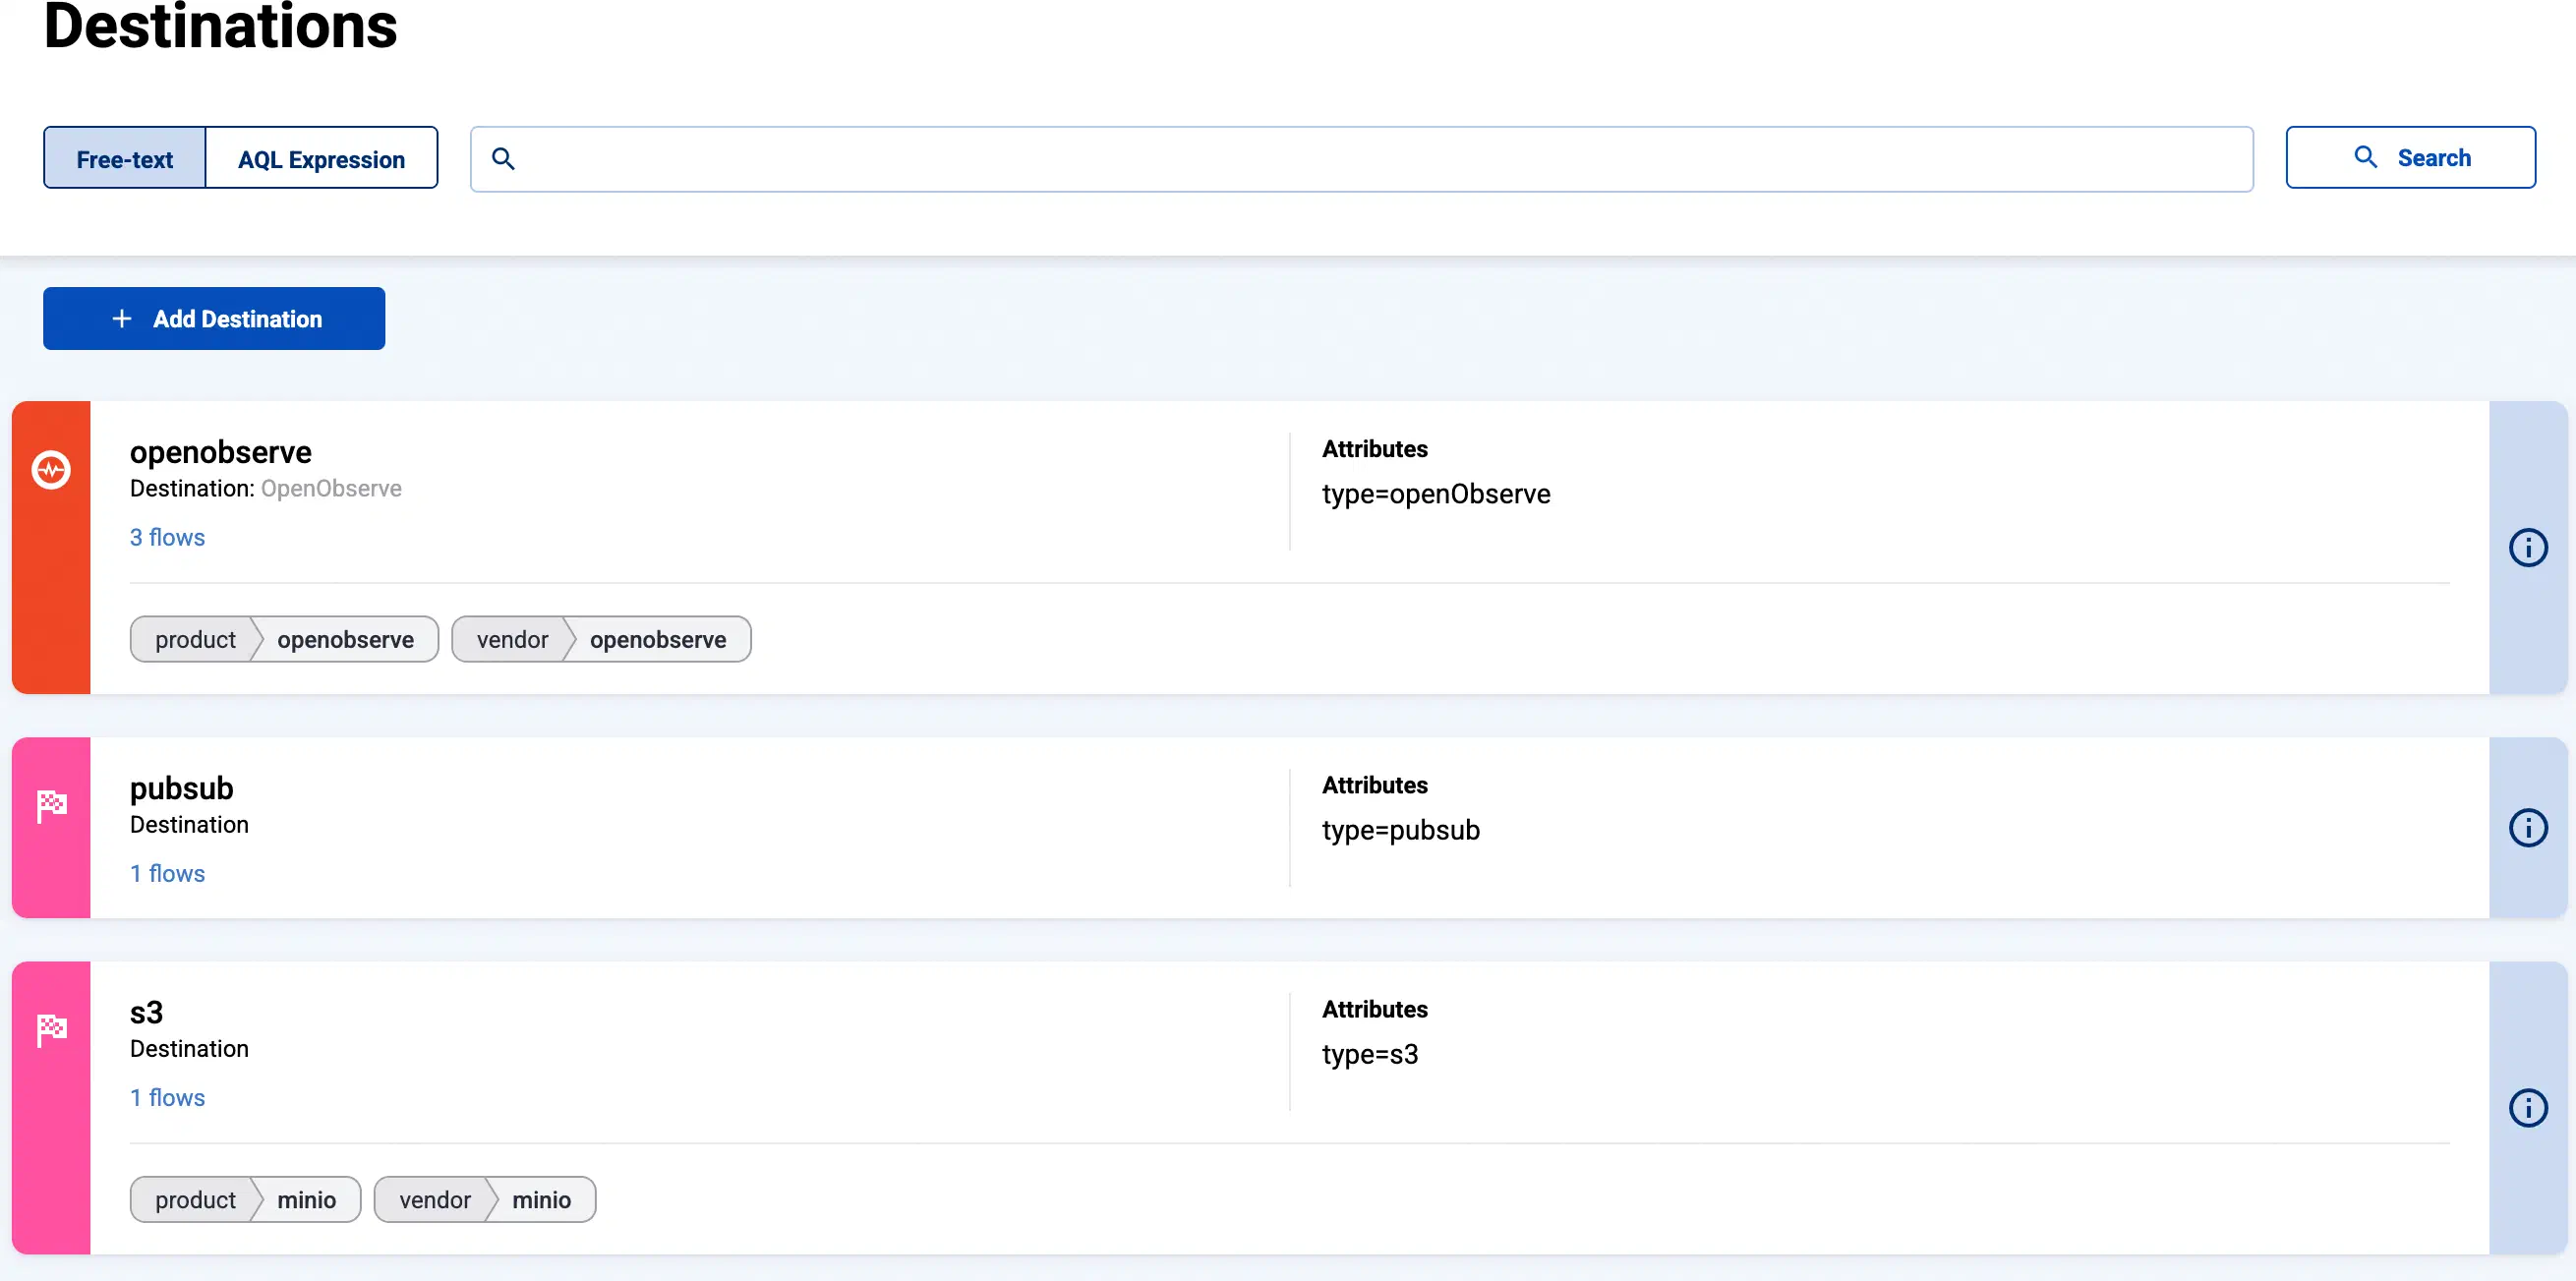
Select Destinations > + Add Destination.
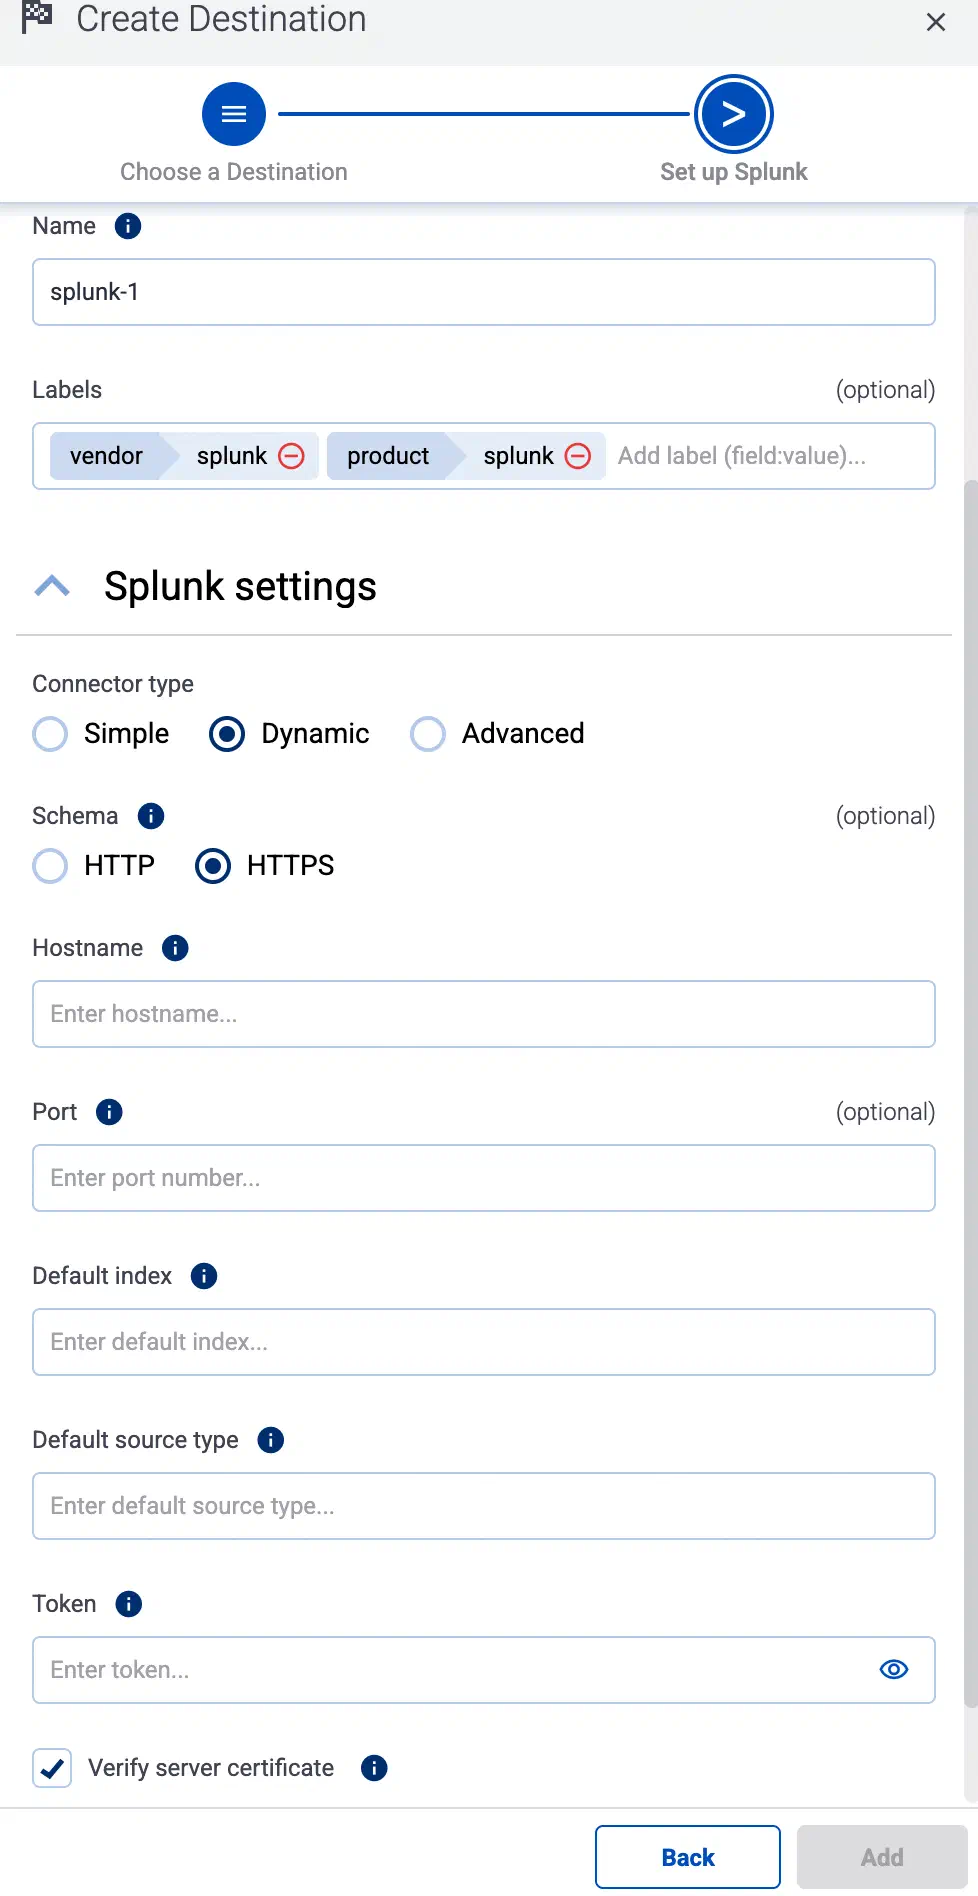
Select Splunk.
Select Dynamic. This will allow you to set a default index, source, and source type for messages that aren’t automatically identified.
Enter your Splunk URL into the Hostname field, for example, <your-splunk-tenant-id>.splunkcloud.com for Splunk Cloud Platform free trials, or <your-splunk-tenant-id>.splunkcloud.com for Splunk Cloud Platform instances.
Enter the name of the Default Index. The data will be sent into this index if no other index is set during the processing of the message (based on automatic classification, or by the processing steps of the Flow). Make sure that the index exists in Splunk.
Enter the Default Source Type. This will be assigned to the messages that have no sourcetype set during the processing of the message (based on automatic classification, or by the processing steps of the Flow).
Enter the token you’ve created into the Token field.
Disable the Verify server certificate option unless your deployment has a valid, non-self-signed certificate. Free Splunk Cloud accounts have self-signed certificates.
(Optional) You can set other options as needed for your environment. For details, see Splunk.
Select Add.
Create a flow
Create a flow to route the traffic from your AxoRouter instance to your destination.
Select Flows.
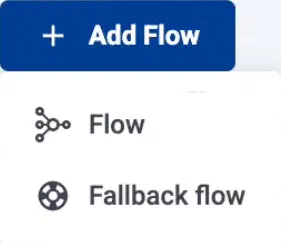
Select Add Flow > Flow.
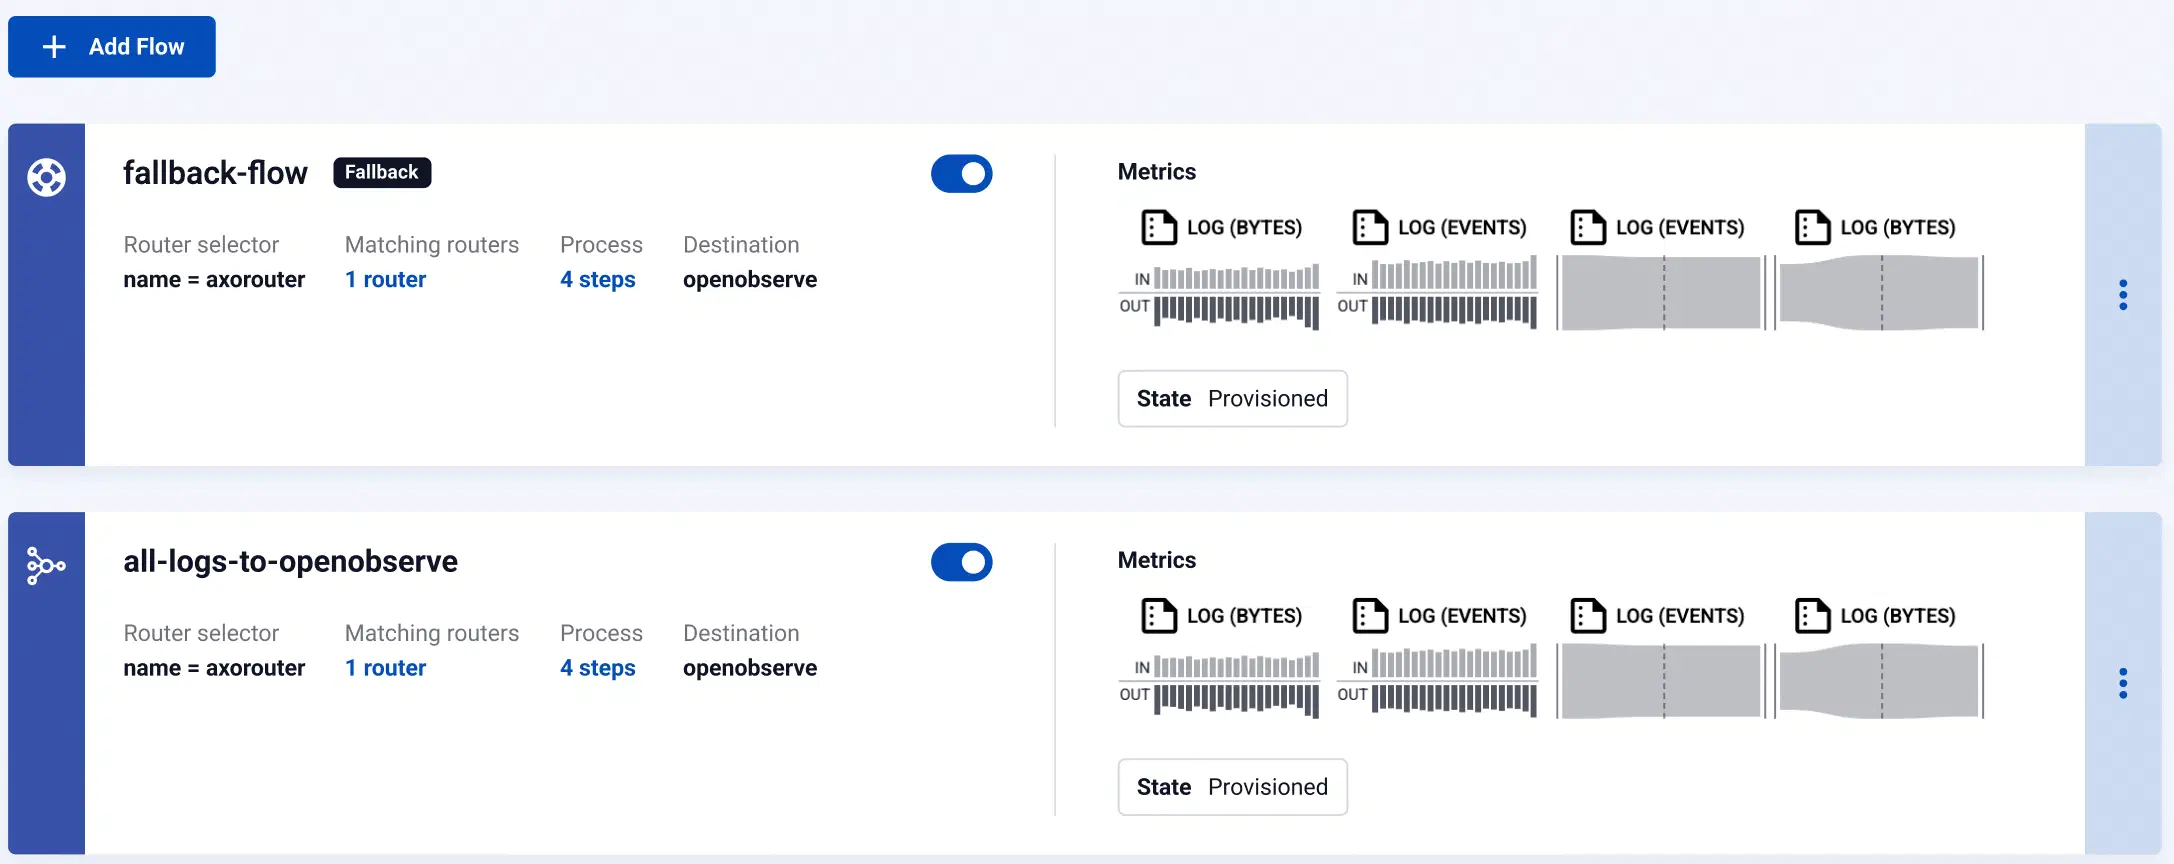
To create a fallback flow, select Add Flow > Fallback flow.
Enter a name for the flow, for example, my-test-flow.
In the Router Selector field, enter an expression that matches the router(s) you want to apply the flow. To select a specific router, use a name selector, for example, name = my-axorouter-hostname.
You can use any labels and metadata of the AxoRouter hosts in the Router selectors, for example, the hostname of the AxoRouter, or any custom labels.
If you leave the Router Selector field empty, the selector will match every AxoRouter instance.
To select only a specific AxoRouter instance, set the name field to the name of the instance as selector. For example, name = my-axorouter.
If you set multiple fields in the selector, the selector will match only AxoRouter instances that match all elements of the selector. (There in an AND relationship between the fields.)
Note
You can configure multiple fallback flows, but only one fallback flow can apply to an AxoRouter (so the Router Selector of the fallback flows can’t overlap).
Select the Destination where you want to send your data. If you don’t have any destination configured, you can select + Add in the destination section to create a new destination now. For details on the different destinations, see Destinations.
If you don’t have any destination configured, see Destinations.
If you’ve already created a store, it automatically available as a destination. Note that the Router Selector of the flow must match only AxoRouters that have the selected store available, otherwise you’ll get an error message.
If you want to send data to another AxoRouter, enable the Show all destinations option, and select the connector of the AxoRouter where you want to send the data.
(Optional) To process the data transferred in the flow, select Add New Processing Step. For details, see Processing steps. For example:
Add a Classify, a Parse, and a Reduce step, in that order, to automatically remove redundant and empty fields from your data.
To select which messages are processed by the flow, add a Select Messages step, and enter a filter into the AQL Expression field. For example, to select only the messages received from Fortinet FortiGate firewalls, use the meta.vendor = fortinet AND meta.product = fortigate query.
Save the processing steps.
Select Add.
The new flow appears in the Flows list.
Check metrics on the Topology page
Open the Topology page and verify that your AxoRouter instance is connected both to the source and the destination.
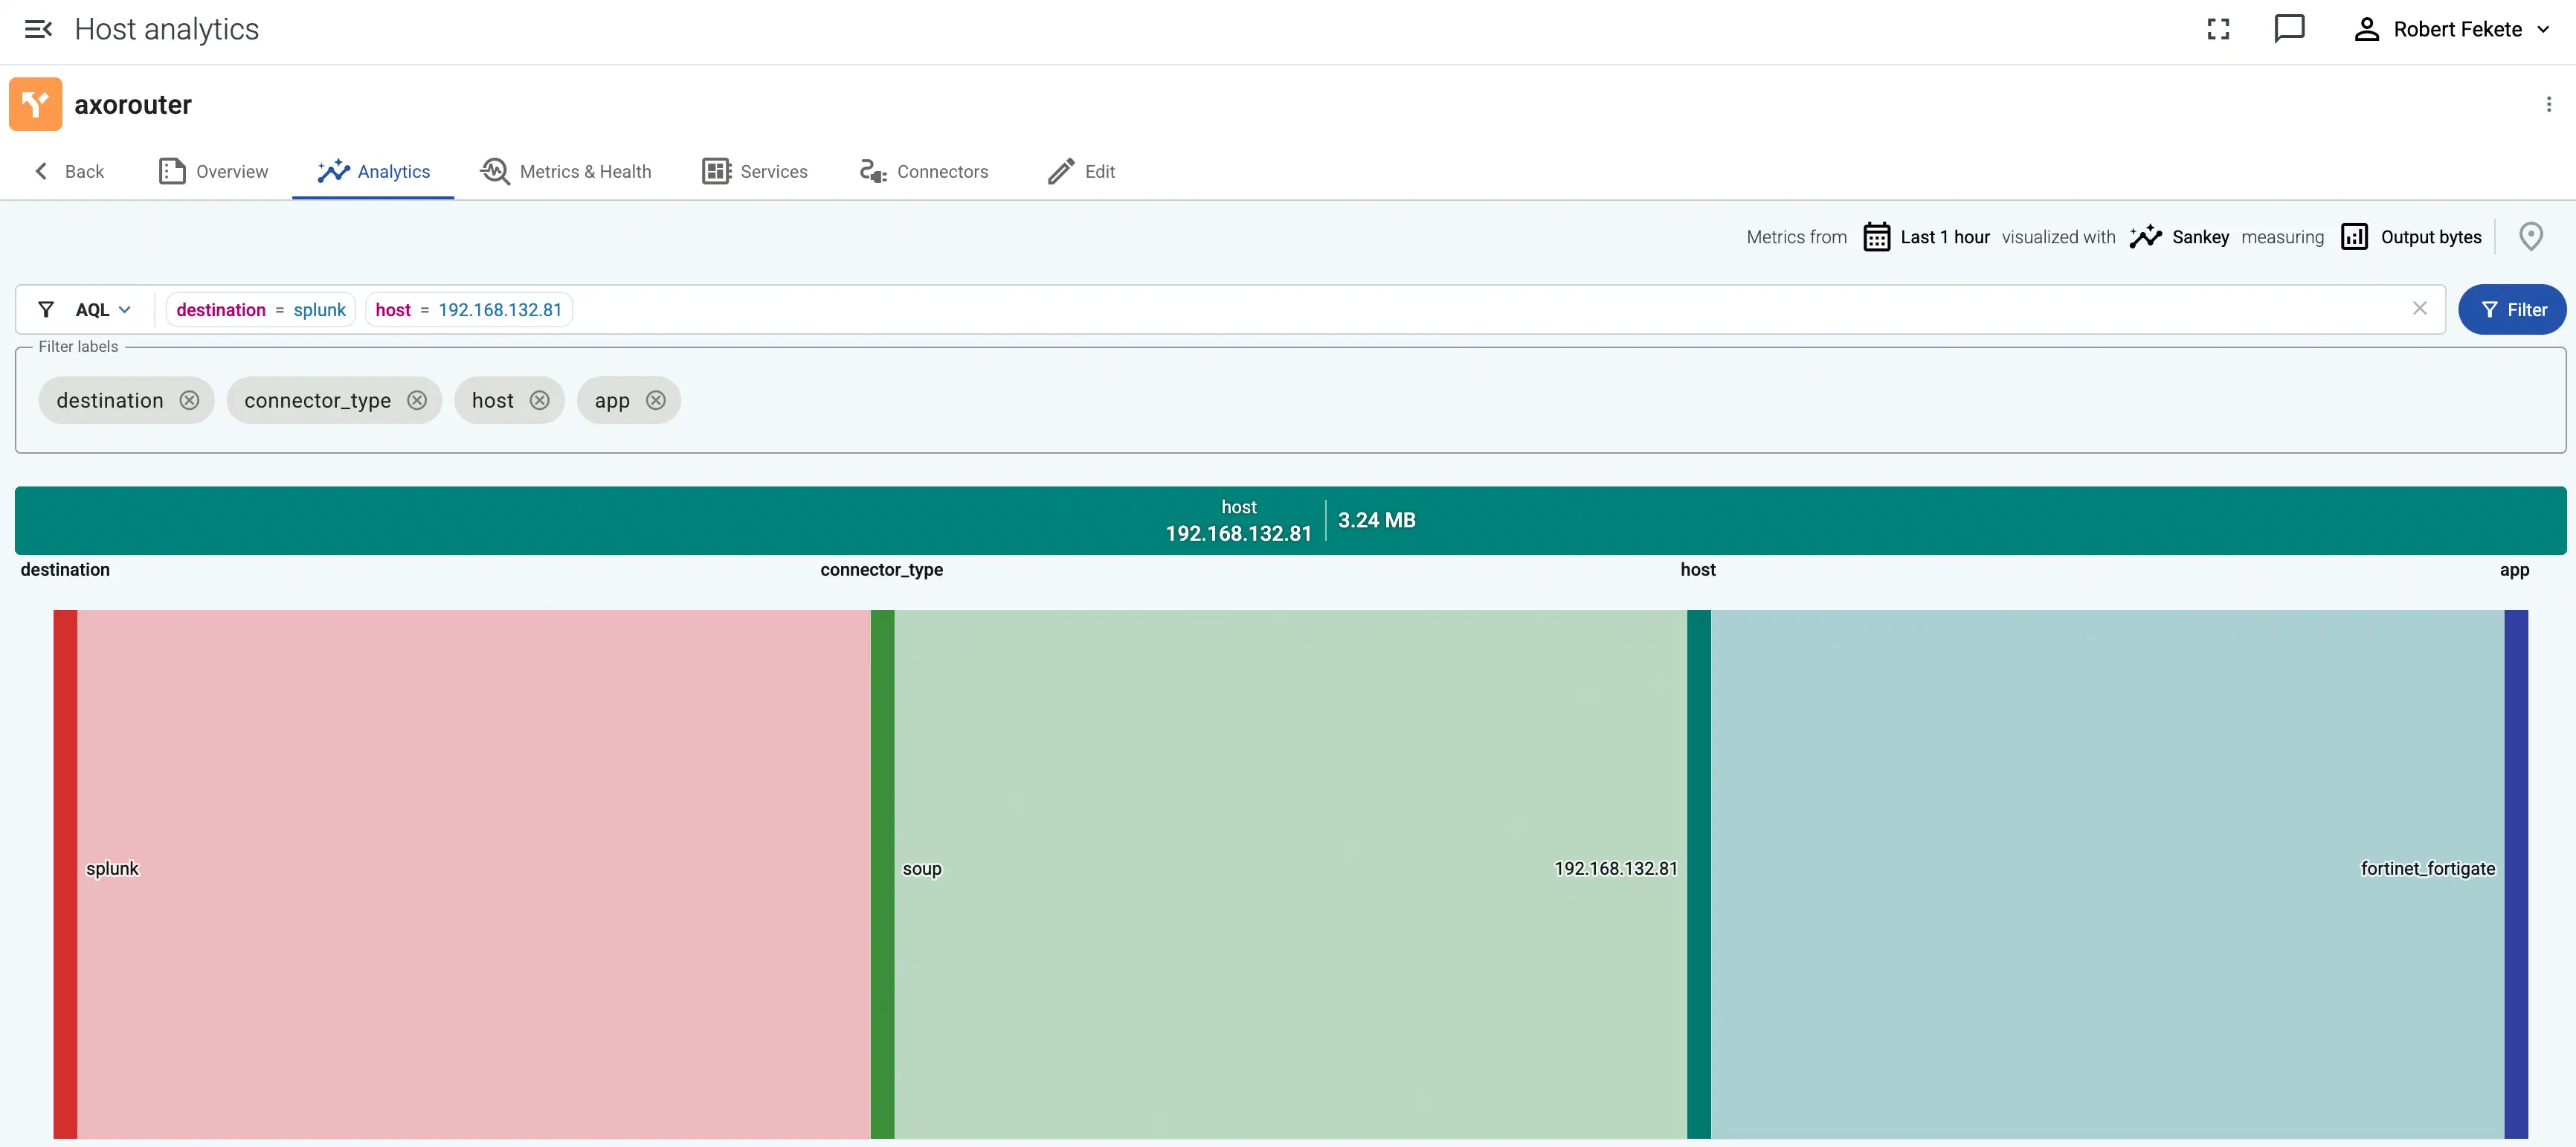
If you have traffic flowing from the source to your AxoRouter instance, the Topology page shows the amount of data flowing on the path. Click the AxoRouter instance, then select Analytics to visualize the data flow.
Tap into the log flow
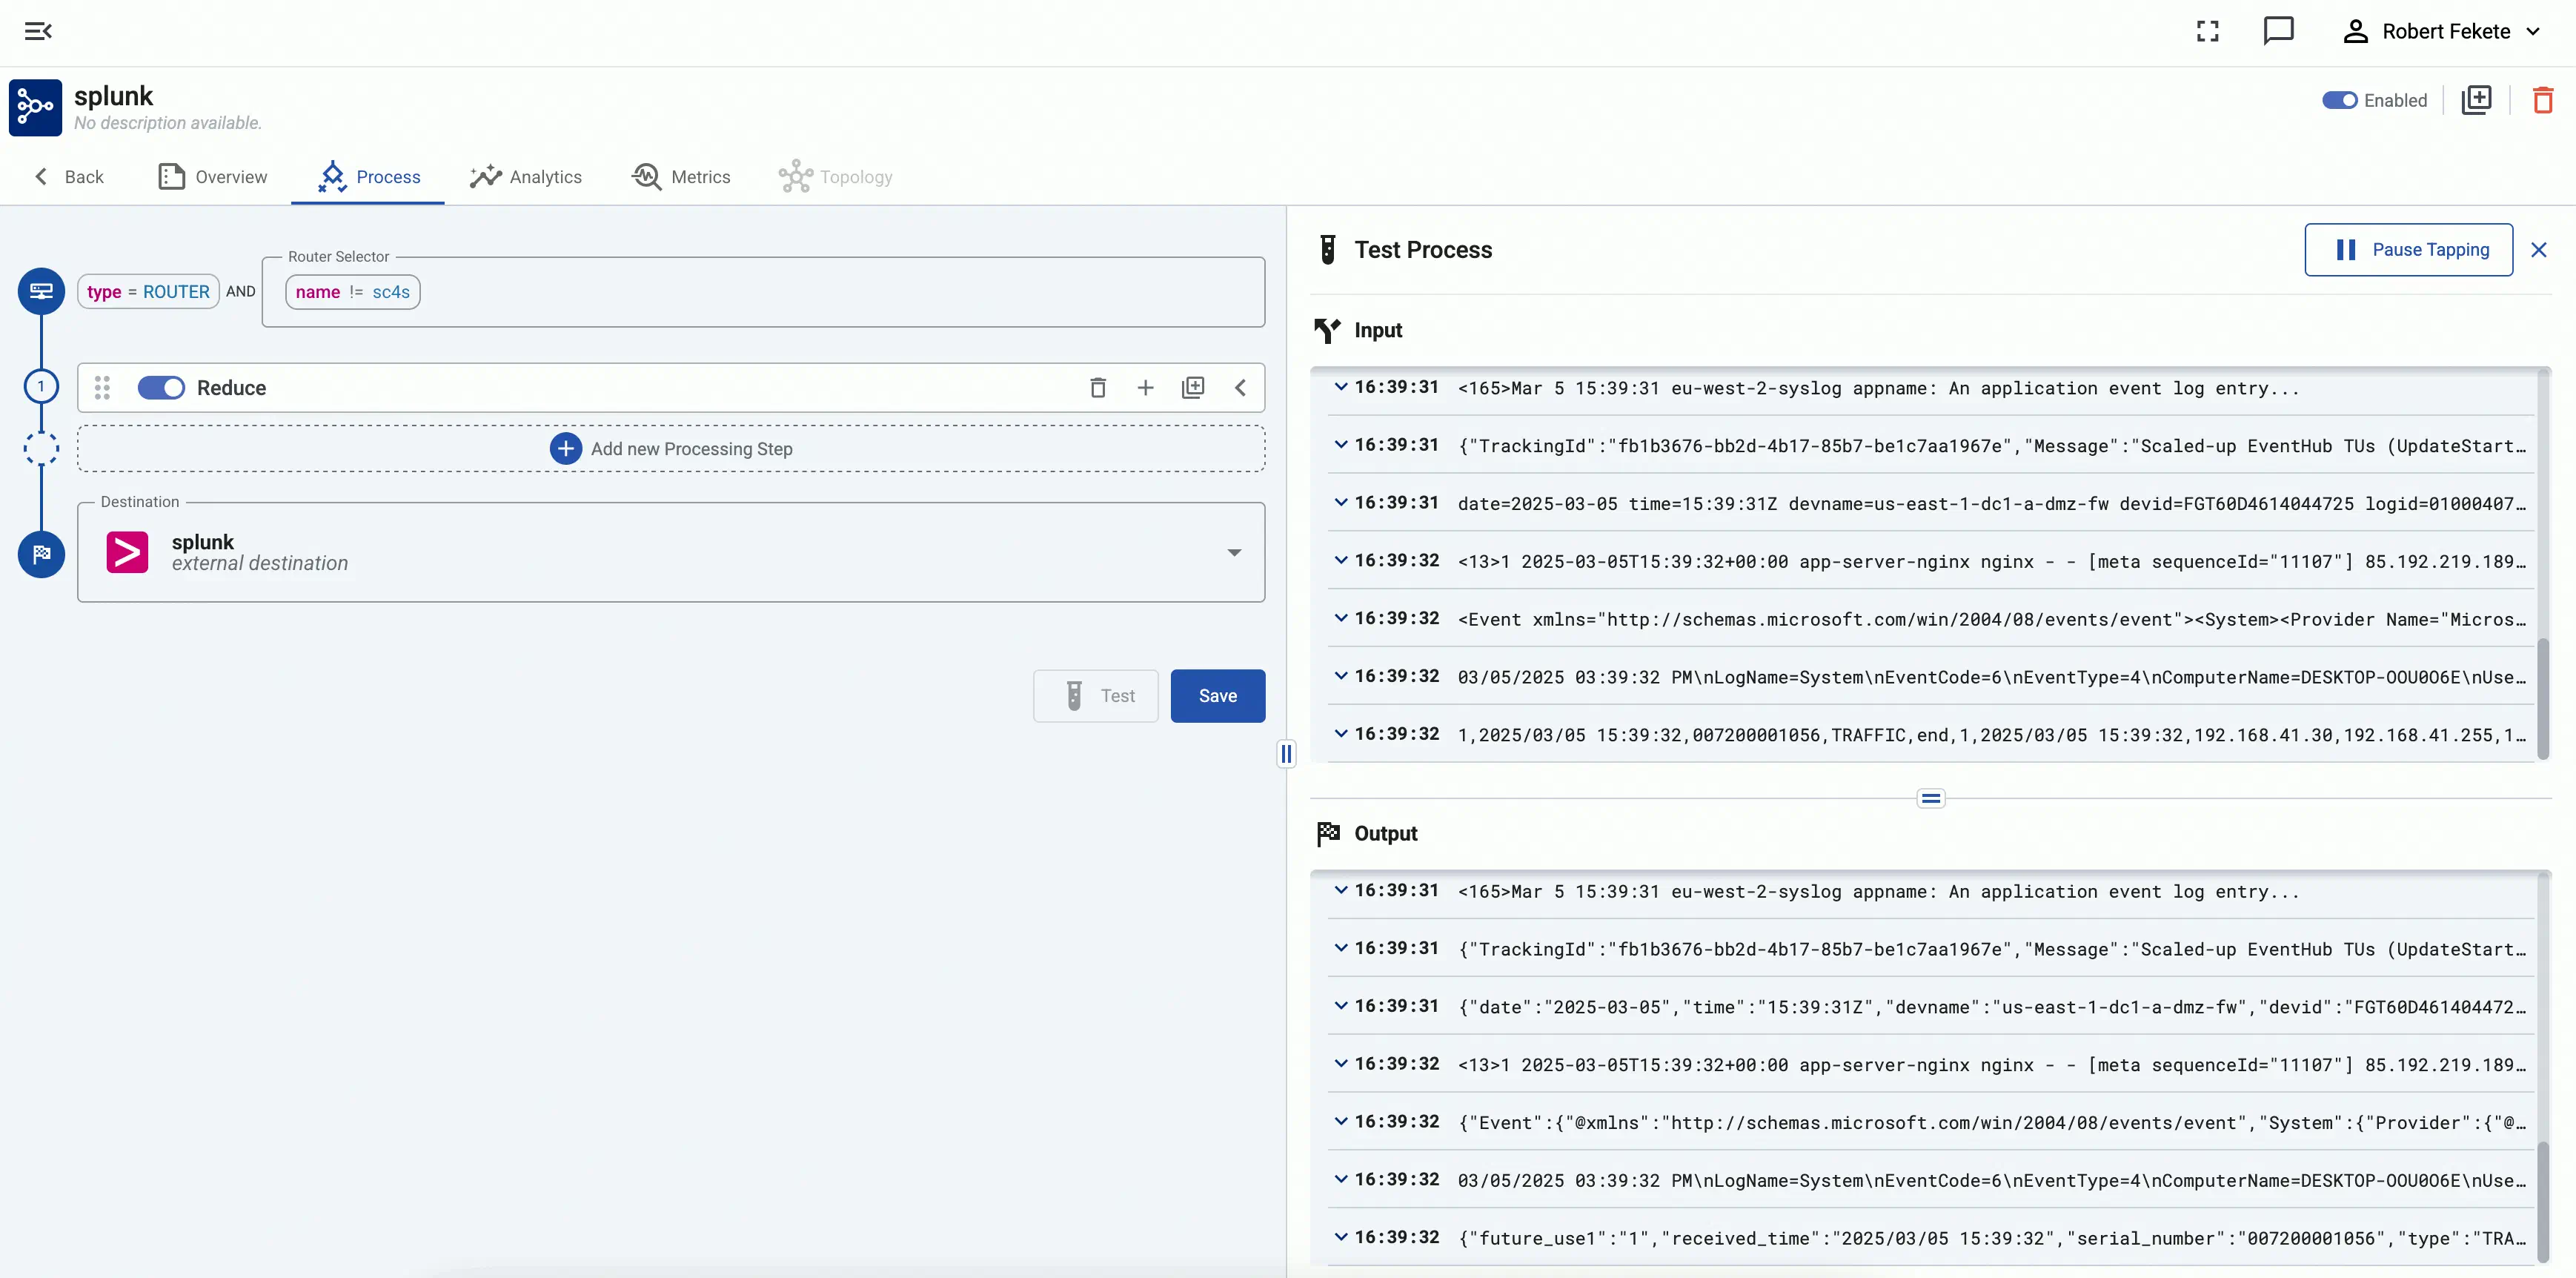
Log tapping in Axoflow samples the log flow. You can use labels to filter for specific messages (like ones with parse errors) and tap only those messages. To not get overwhelmed with events, Axoflow automatically samples the output: if many messages match the selected filter, only a subset is shown (about 1 message per second). Using log tapping, you can quickly troubleshoot both parsing/curation errors and destination ingest (API) errors, and check:
What was in the original message?
What is sent in the final payload to the destination?
Tap into the log flow.
Click your AxoRouter instance on the Topology page, then select ⋮ > Tap log flow.
Tap into the log flow.
To see the input data, select Input log flow > Start.
To see the output data, select Output log flow > Start.
axostore: The service that handles AxoStore on the host. Only available if there are stores configured on the host.
If systemd is available on the host, select Systemd service output to show the logs of the service from the systemd journal. Otherwise, the Internal logs of the service are available.
Select Start. Axoflow displays the log messages of AxoRouter. Check the logs for error messages.
Some common errors include:
Redirected event for unconfigured/disabled/deleted index=netops with source="source::axo" host="host::axosyslog-almalinux" sourcetype="sourcetype::fortigate_event" into the LastChanceIndex. So far received events from 1 missing index(es).: The Splunk index where AxoRouter is trying to send data doesn’t exist. Check which index is missing in the error message and create it in Splunk. (For a list of recommended indices, see the Splunk destination prerequisites.)
http: error sending HTTP request; url='https://prd-p-sp2id.splunkcloud.com:8088/services/collector/event/1.0?index=&source=&sourcetype=', error='SSL peer certificate or SSH remote key was not OK', worker_index='0', driver='splunk--flow-axorouter4-almalinux#0', location='/usr/share/syslog-ng/include/scl/splunk/splunk.conf:104:3': Your Splunk deployment uses an invalid or self-signed certificate, and the Verify server certificate option is enabled in the Splunk destination of Axoflow. Either fix the certificate in Splunk, or: select Topology > <your-splunk-destination>, disable Verify server certificate, then select Update.
6 - Concepts
This section describes the main concepts of Axoflow.
6.1 - Processing elements
Axoflow processes the data transported in your security data pipeline in the following stages:
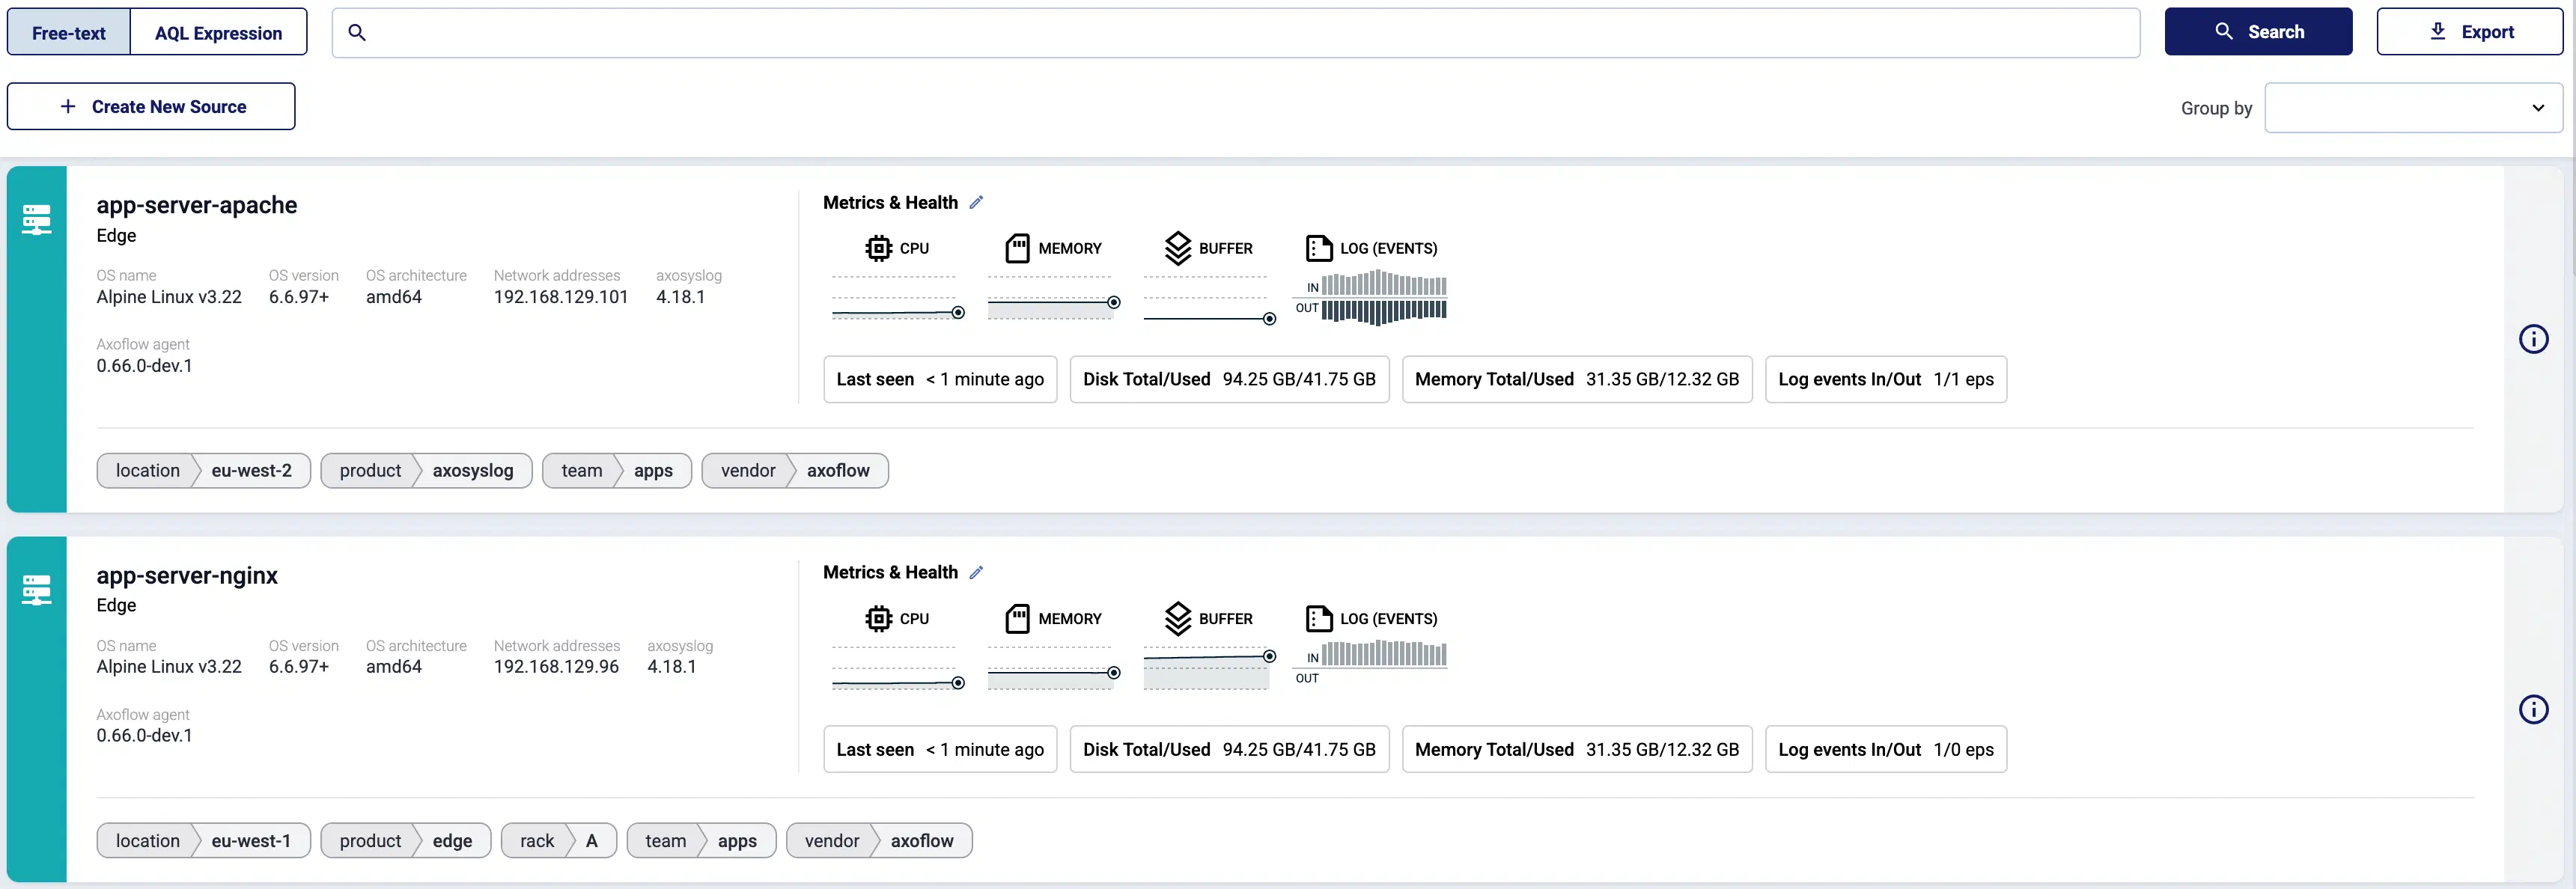
Sources: Data enters the pipeline from a data source. A data source can be an external appliance or application, or a log collector agent managed by Axoflow.
Sources are hosts that are sending data to a data aggregator, like AxoRouter.
Edges are source hosts that are running a collector agent managed by AxoConsole, or have an Axolet agent reporting metrics from the host.
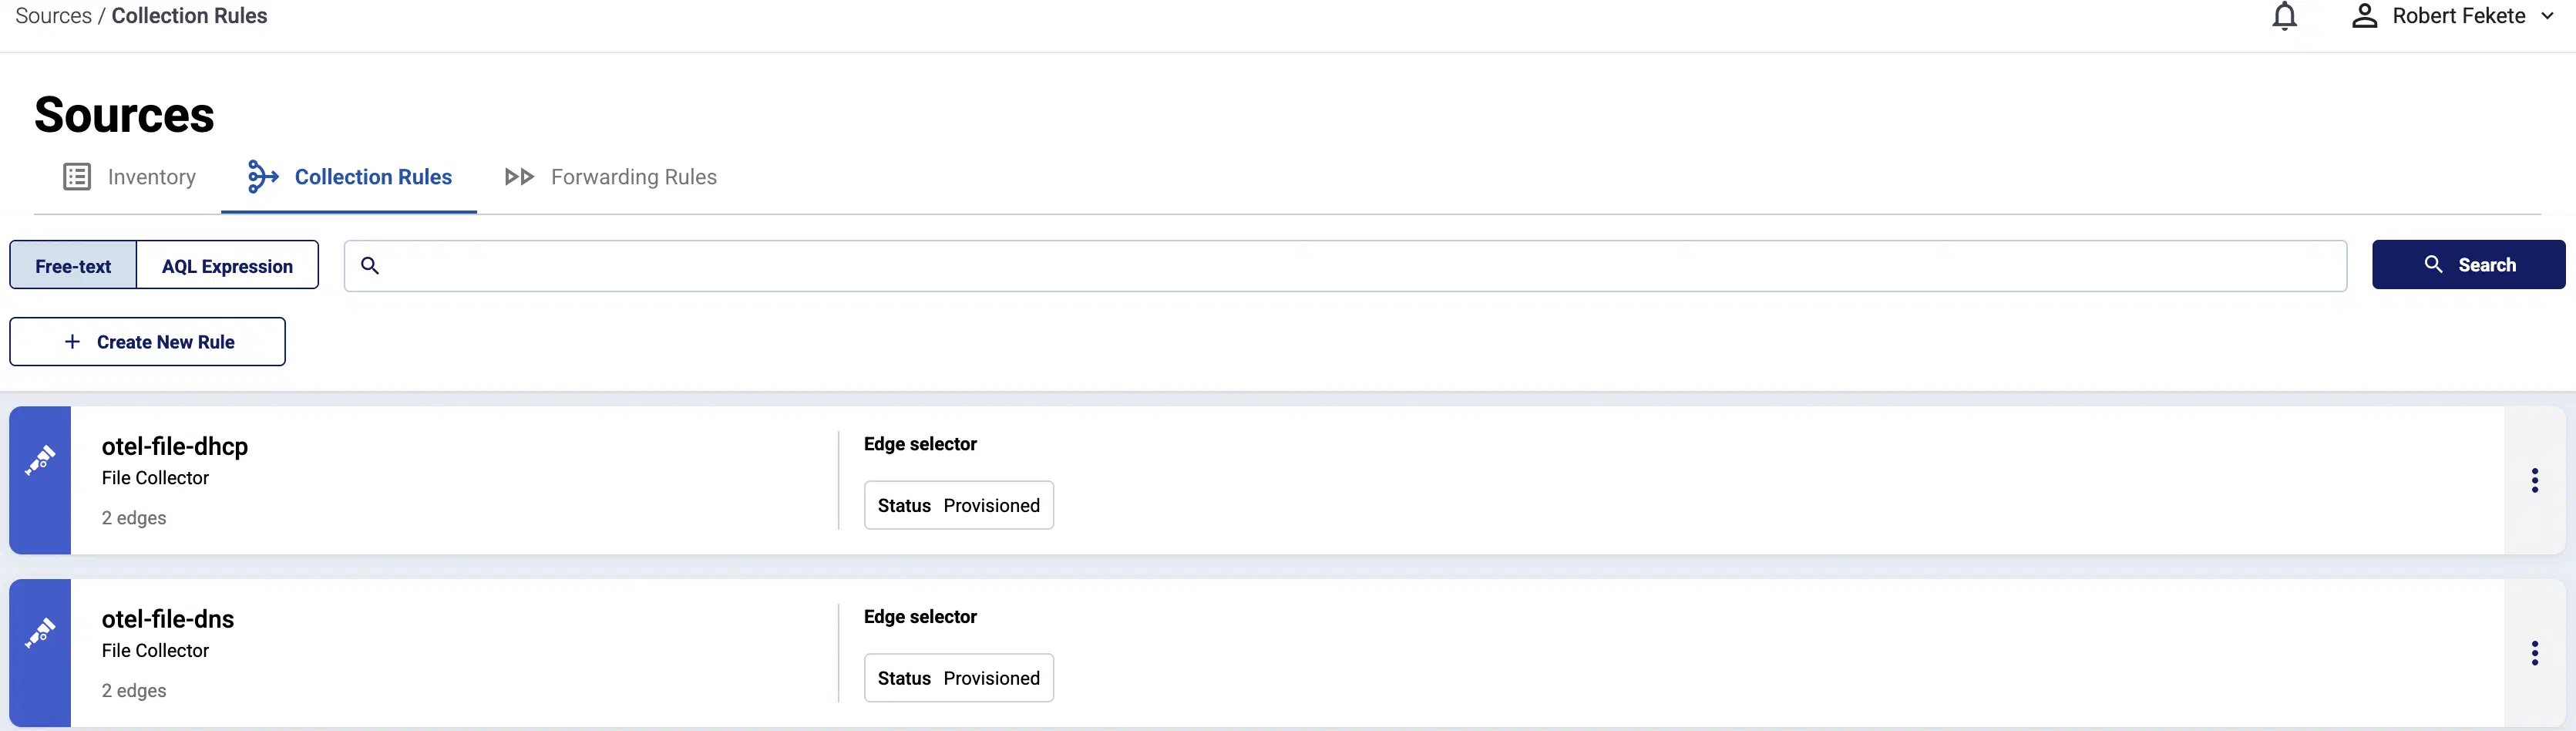
For edge hosts, you can create:
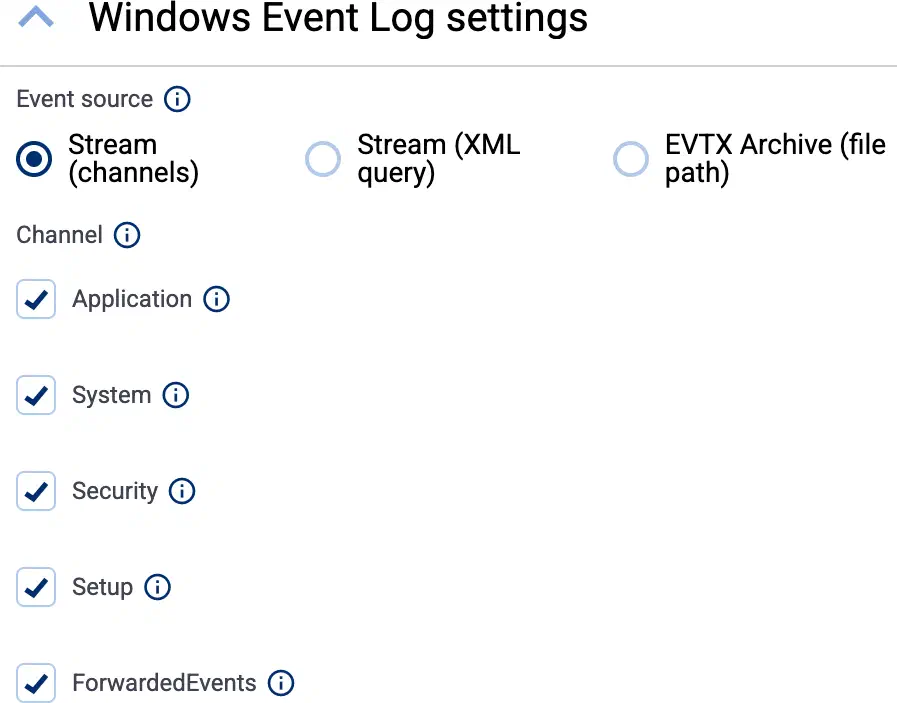
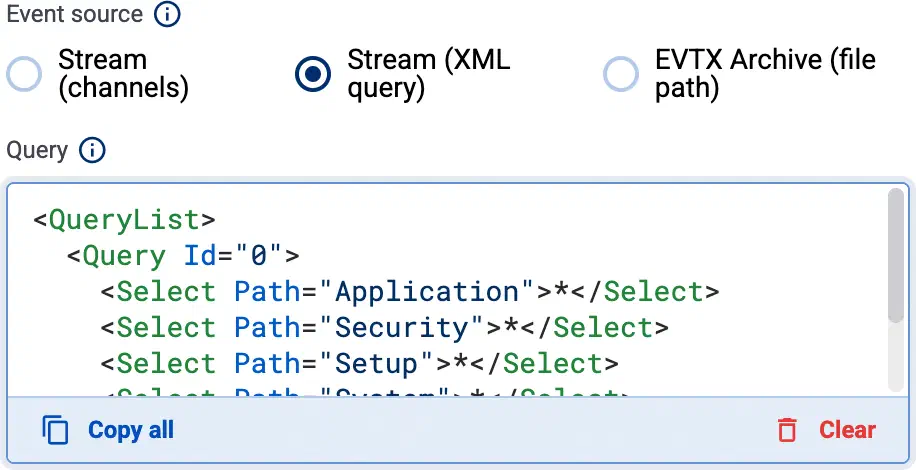
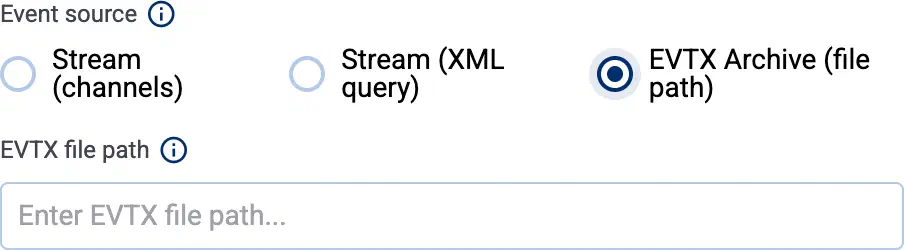
collection rules that collect local data (for example, from log files, or Windows Event Log channels), and
Router: The AxoRouter data aggregator processes the data it receives from the sources:
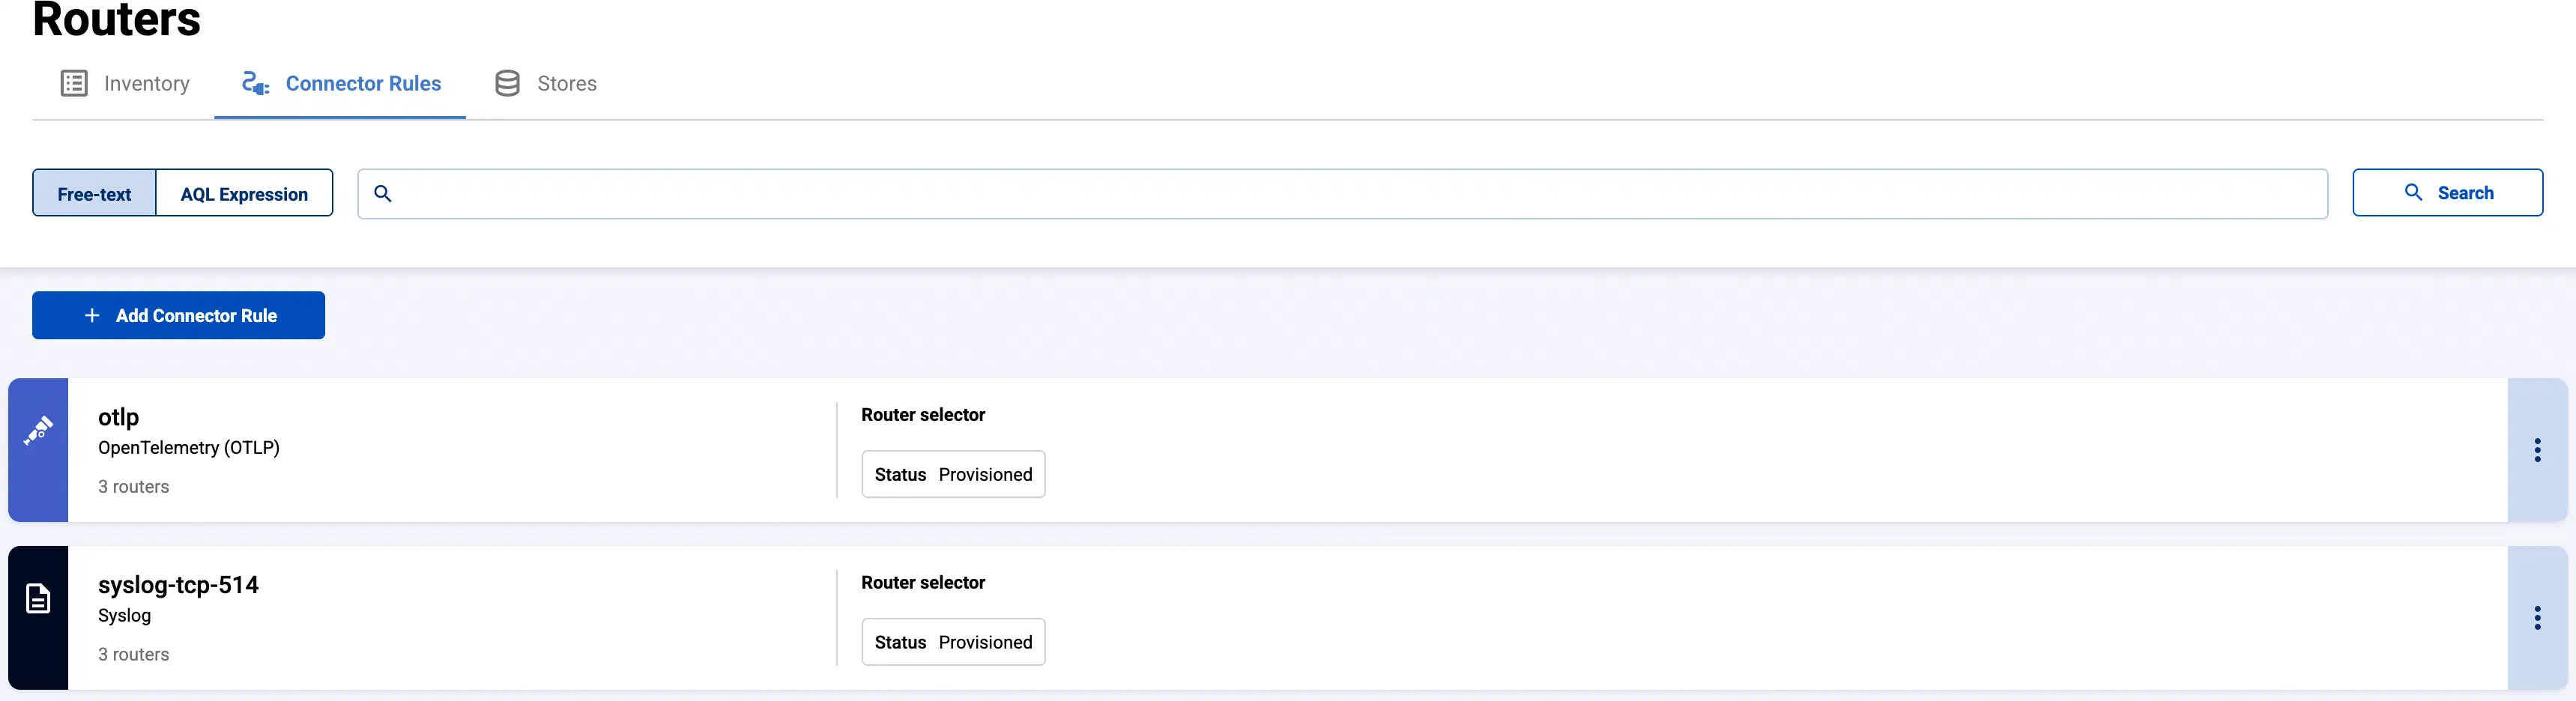
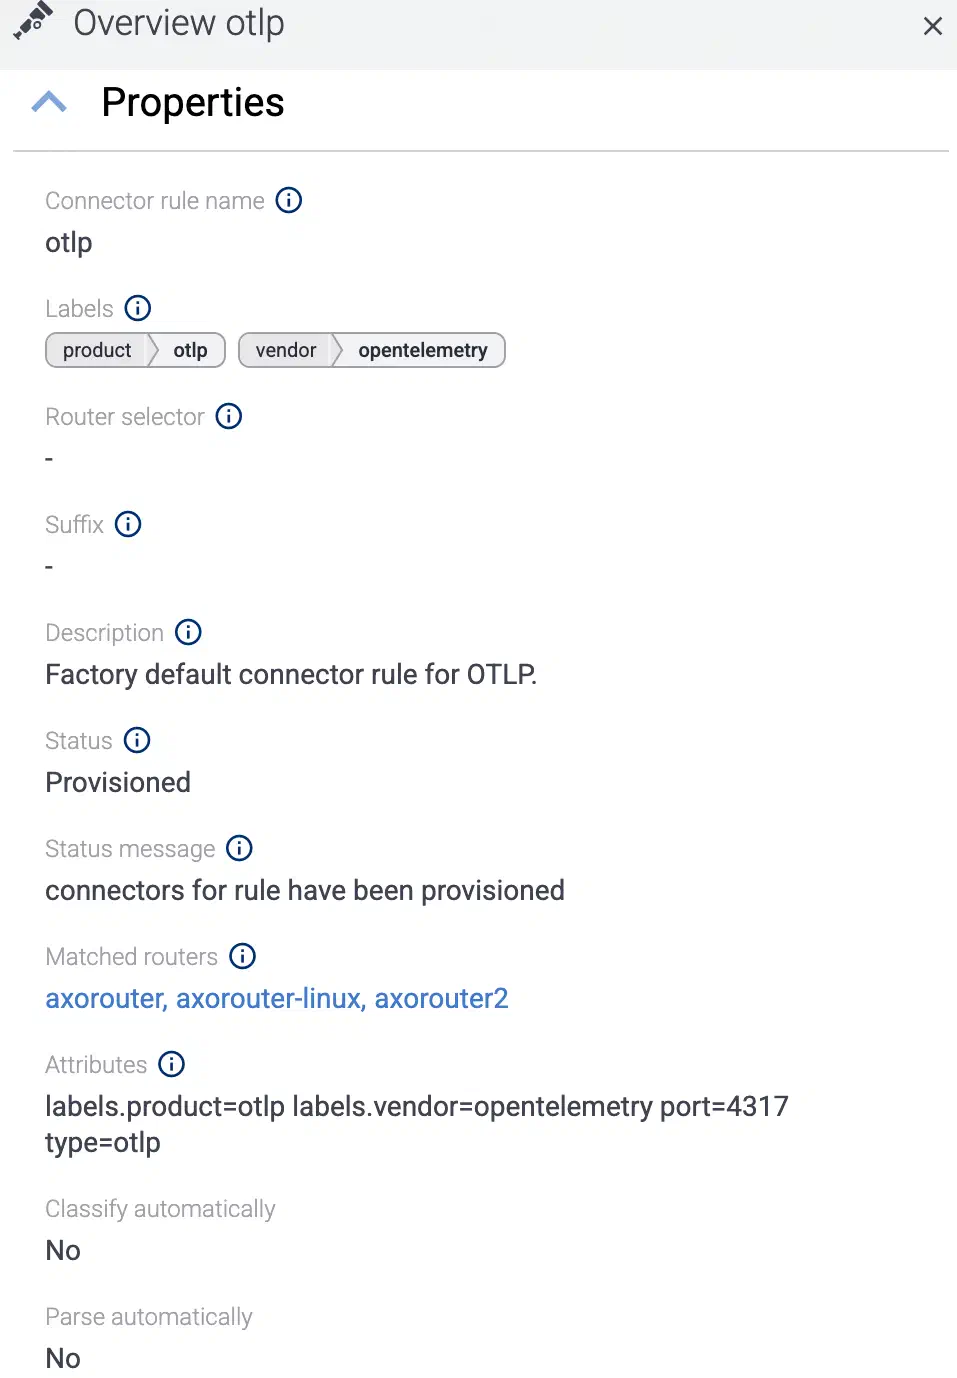
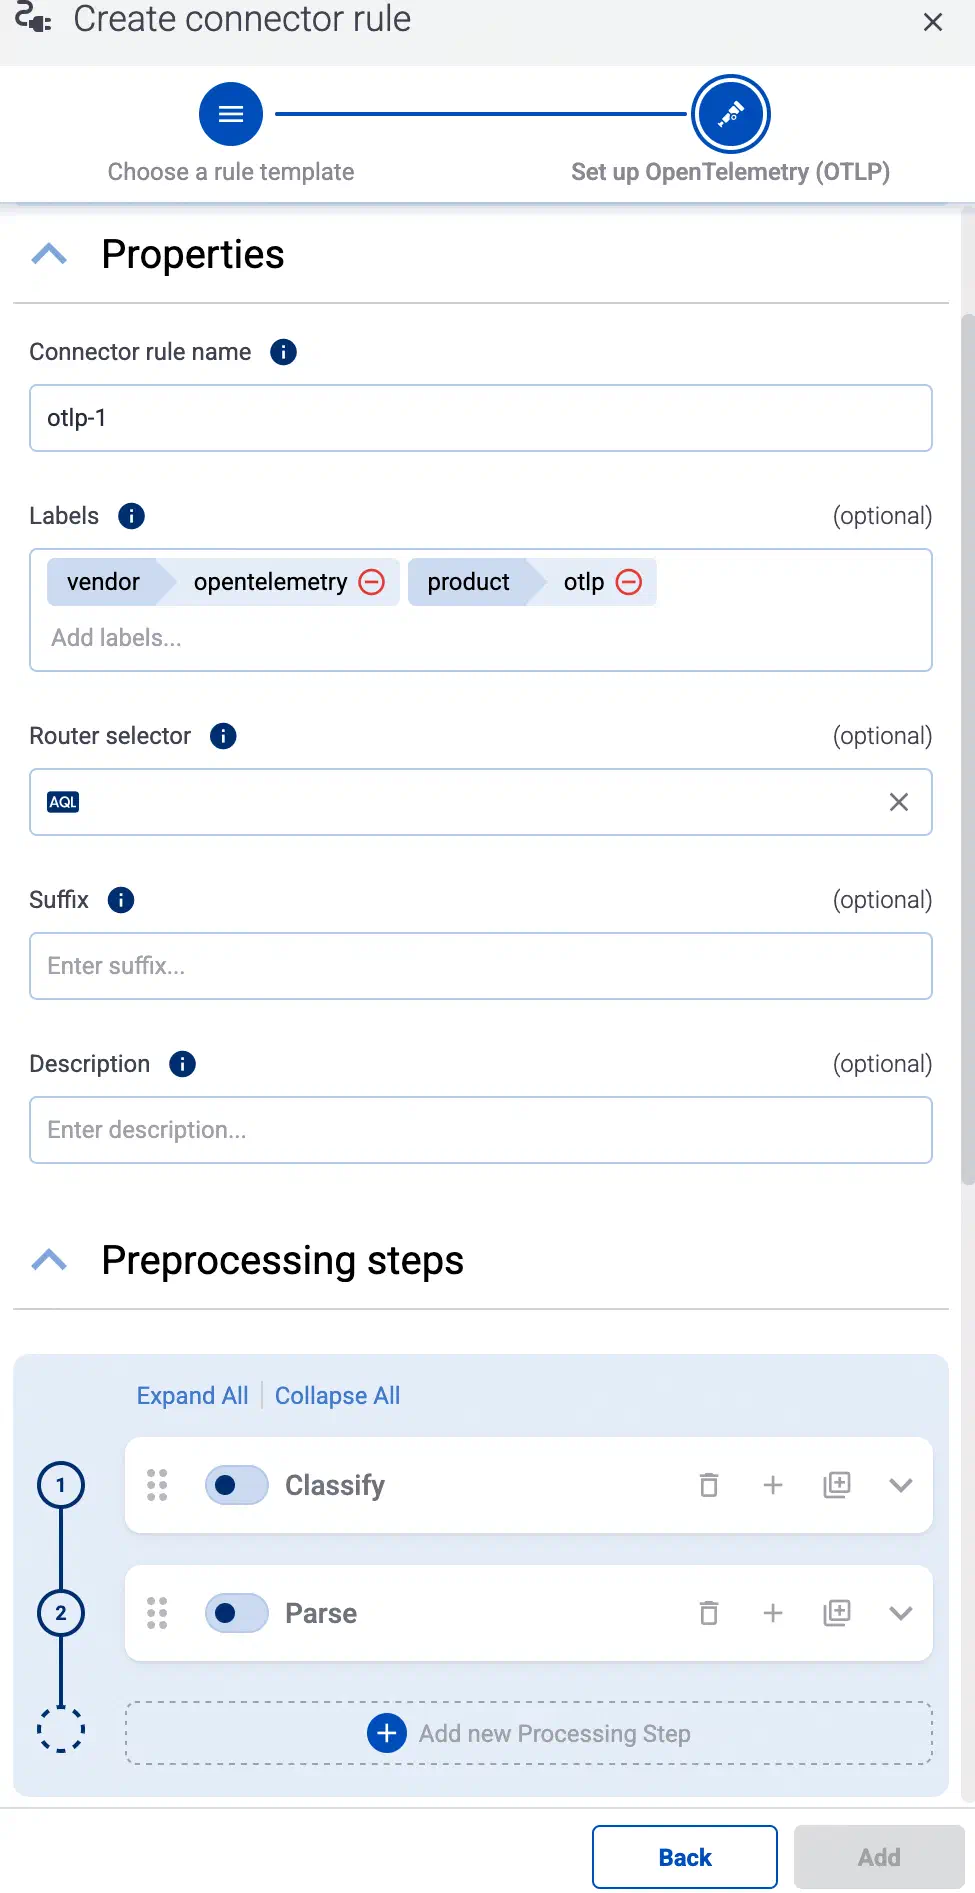
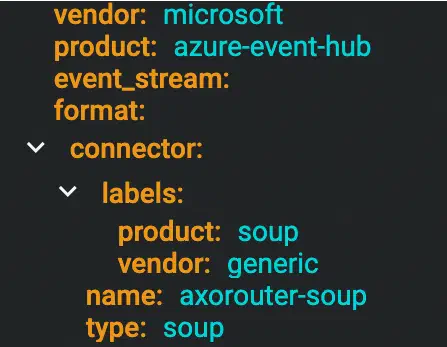
Connector: AxoRouter hosts receive data using source connectors. The different connectors are responsible for different protocols (like Syslog or OpenTelemetry). Some metadata labels are added to the data based on the connector it was received.
Metadata: AxoRouter classifies and identifies the incoming messages and adds metadata, for example, the vendor and product of the identified source.
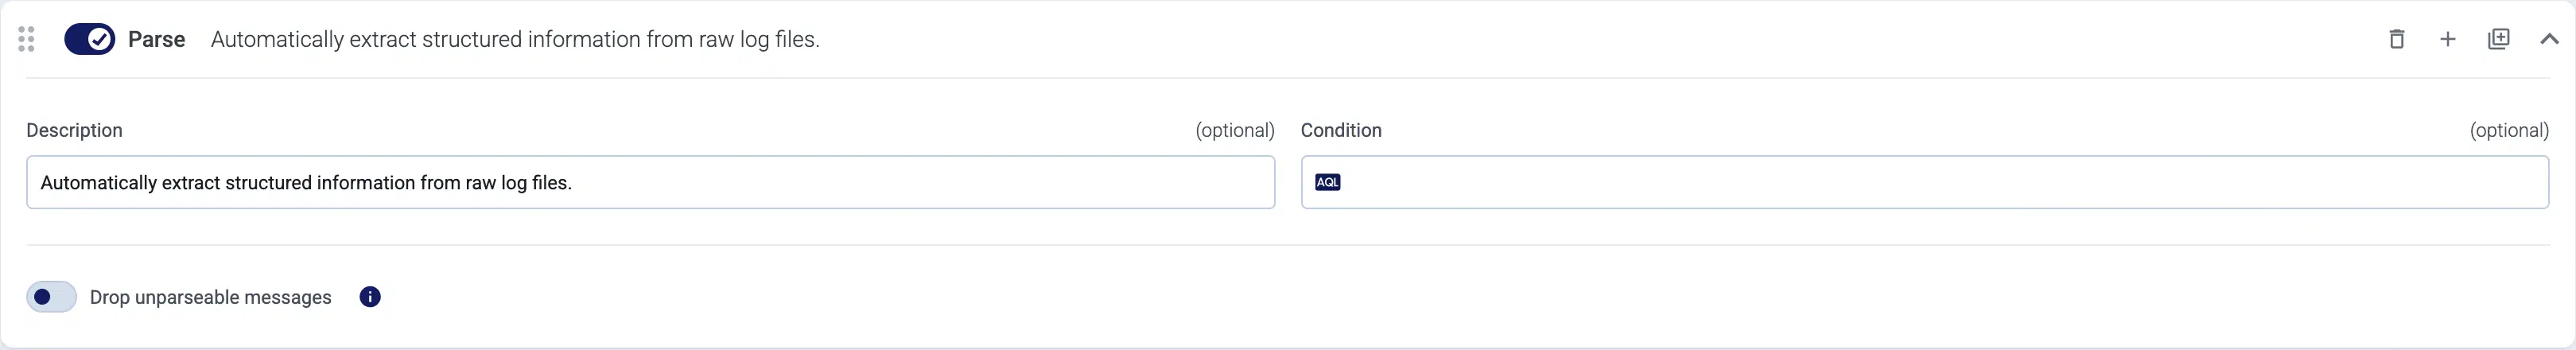
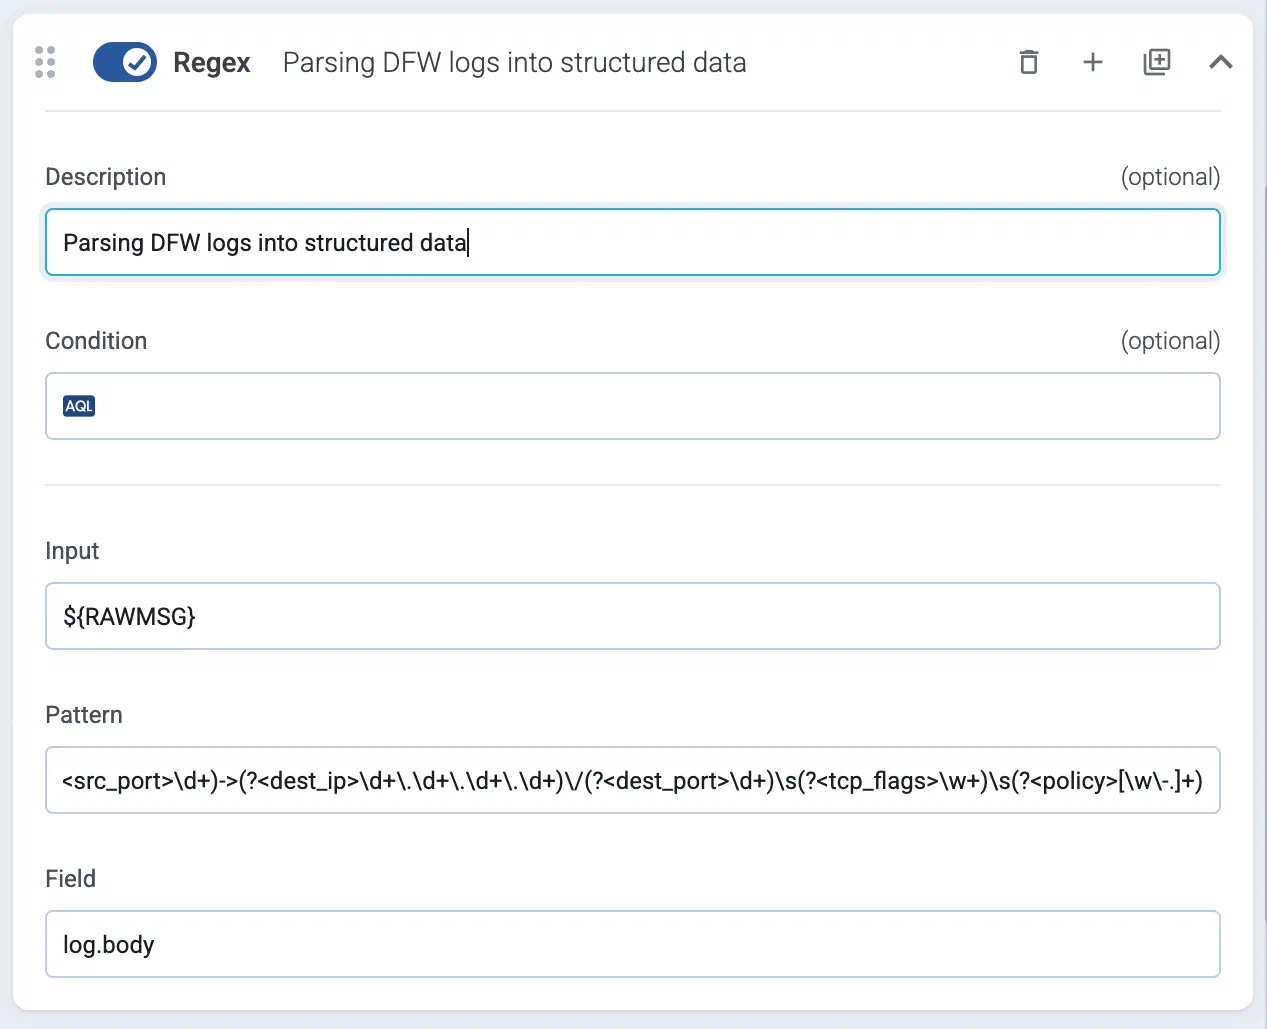
Data extraction: AxoRouter extracts the relevant information from the content of the messages, and makes it available as structured data.
The router can perform other processing steps, as configured in the flows that apply to the specific router (see next step).
Flow: You can configure flows in the AxoConsole that Axoflow uses to configure the AxoRouter instances to filter, route, and process the security data. Flows also allow you to automatically remove unneeded or redundant information from the messages, reducing data volume and SIEM and storage costs.
Destination: The router sends data to the specified destination in a format optimized for the specific destination.
6.2 - Automatic data processing
When forwarding data to your SIEM, poor quality data and malformed logs that lack critical fields like timestamps or hostnames need to be fixed. The usual solutions fix the problem in the SIEM, and involve complex regular expressions, which are difficult to create and maintain. SIEM users often rely on vendors to manage these rules, but support is limited, especially for less popular devices. Axoflow offers a unique solution by automatically processing, curating, and classifying data before it’s sent to the SIEM, ensuring accurate, structured, and optimized data, reducing ingestion costs and improving SIEM performance.
The problem
The main issue related to classification is that many devices send malformed messages: missing timestamp, missing hostname, invalid message format, and so on. Such errors can cause different kinds of problems:
Log messages are often routed to different destinations based on the sender hostname. Missing or invalid hostnames mean that the message is not attributed to the right host, and often doesn’t arrive at its intended destination.
Incorrect timestamp or timezone hampers investigations during an incident, resulting in potentially critical data failing to show up (or extraneous data appearing) in queries for a particular period.
Invalid data can lead to memory leaks or resource overload in the processing software (and to unusable monitoring dashboards) when a sequence number or other rapidly varying field is mistakenly parsed as the hostname, program name, or other low cardinality field.
Overall, they decrease the quality of security data you’re sending to your SIEM tools, which increases false positives, requires secondary data processing to clean, and increases query time – all of which ends up costing firms a lot more.
For instance, this is a log message from a SonicWall firewall appliance:
A well-formed syslog message should look like this:
<priority>timestamp hostname application: message body
As you can see, the SonicWall format is completely invalid after the initial <priority> field. Instead of the timestamp, hostname, and application name comes the free-form part of the message (in this case a whitespace-separated key=value list). Unless you extract the hostname and timestamp from the content of this malformed message, you won’t be able to reconstruct the course of events during a security incident.
Axoflow provides data processing, curation, and classification intelligence that’s built into the data pipeline, so it processes and fixes the data before it’s sent to the SIEM.
Our solution
Our data engine and database solution automatically processes the incoming data: AxoRouter recognizes and classifies the incoming data, applies device-specific fixes for the errors, then enriches and optimizes the formatting for the specific destination (SIEM). This approach has several benefits:
Cost reduction: All data is processed before it’s sent to the SIEM. That way, we can automatically reduce the amount of data sent to the SIEM (for example, by removing empty and redundant fields), cutting your data ingestion costs.
Structured data: Axoflow recognizes the format of the incoming data payload (for example, JSON, CSV, LEEF, free text), and automatically parses the payload into a structured map. This allows us to have detailed, content-based metrics and alerts, and also makes it easy for you to add custom transformations if needed.
SIEM-independent: The structured data representation allows us to support multiple SIEMs (and other destinations) and optimize the data for every destination.
Performance: Compared to the commonly used regular expressions, it’s more robust and has better performance, allowing you to process more data with fewer resources.
Maintained by Axoflow: We maintain the database; you don’t have work with it. This includes updates for new product versions and adding new devices. We proactively monitor and check the new releases of main security devices for logging-related changes and update our database. (If something’s not working as expected, you can easily submit log samples and we’ll fix it ASAP). Currently, we have over 150 application adapters in our database.
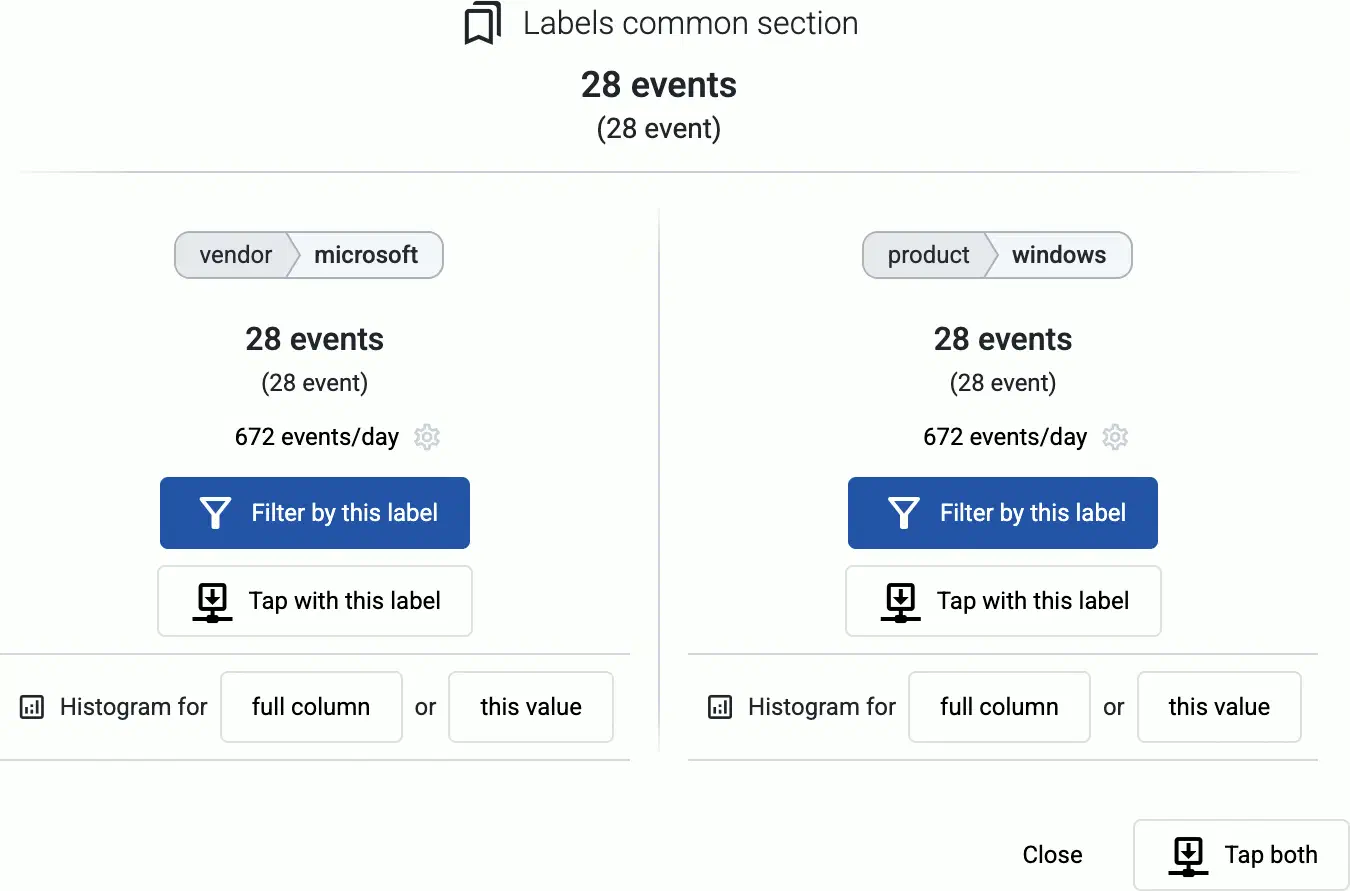
The automatic classification and curation also adds labels and metadata that can be used to make decisions and route your data. Messages with errors are also tagged with error-specific tags. For example, you can easily route all firewall and security logs to your Splunk deployment, and exclude logs (like debug logs) that have no security relevance and shouldn’t be sent to the SIEM.
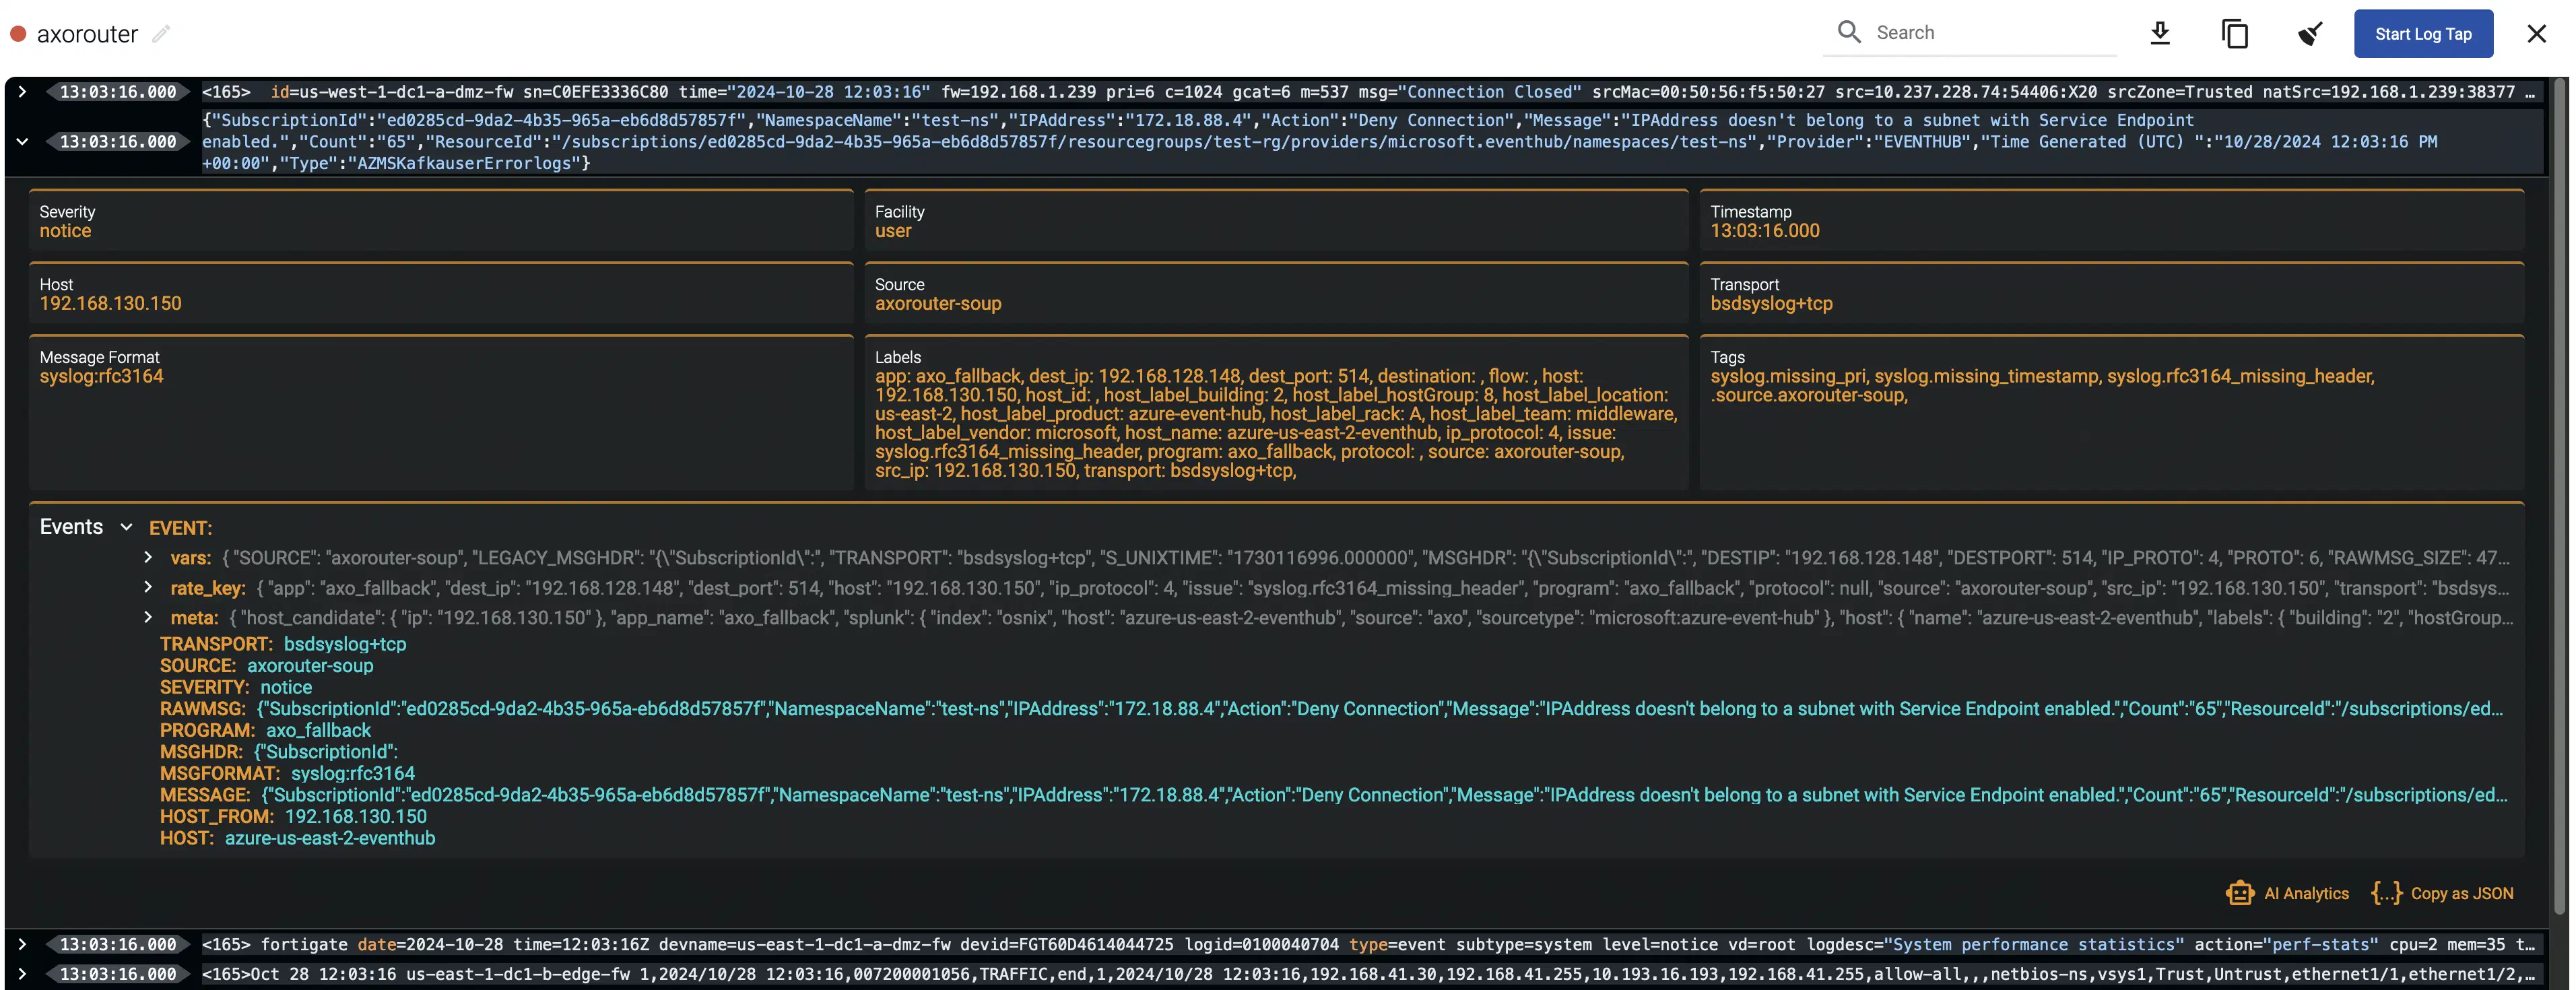
Message fixup
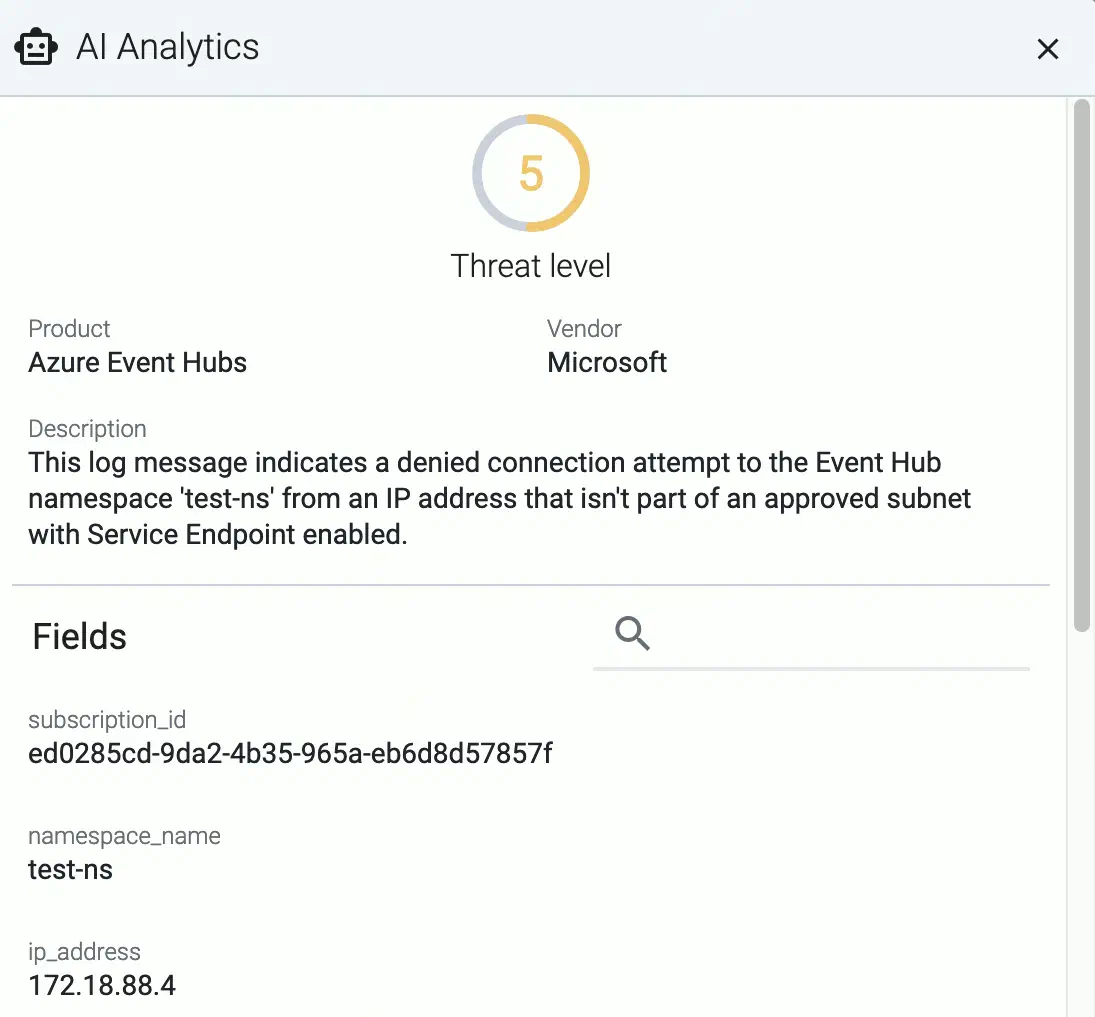
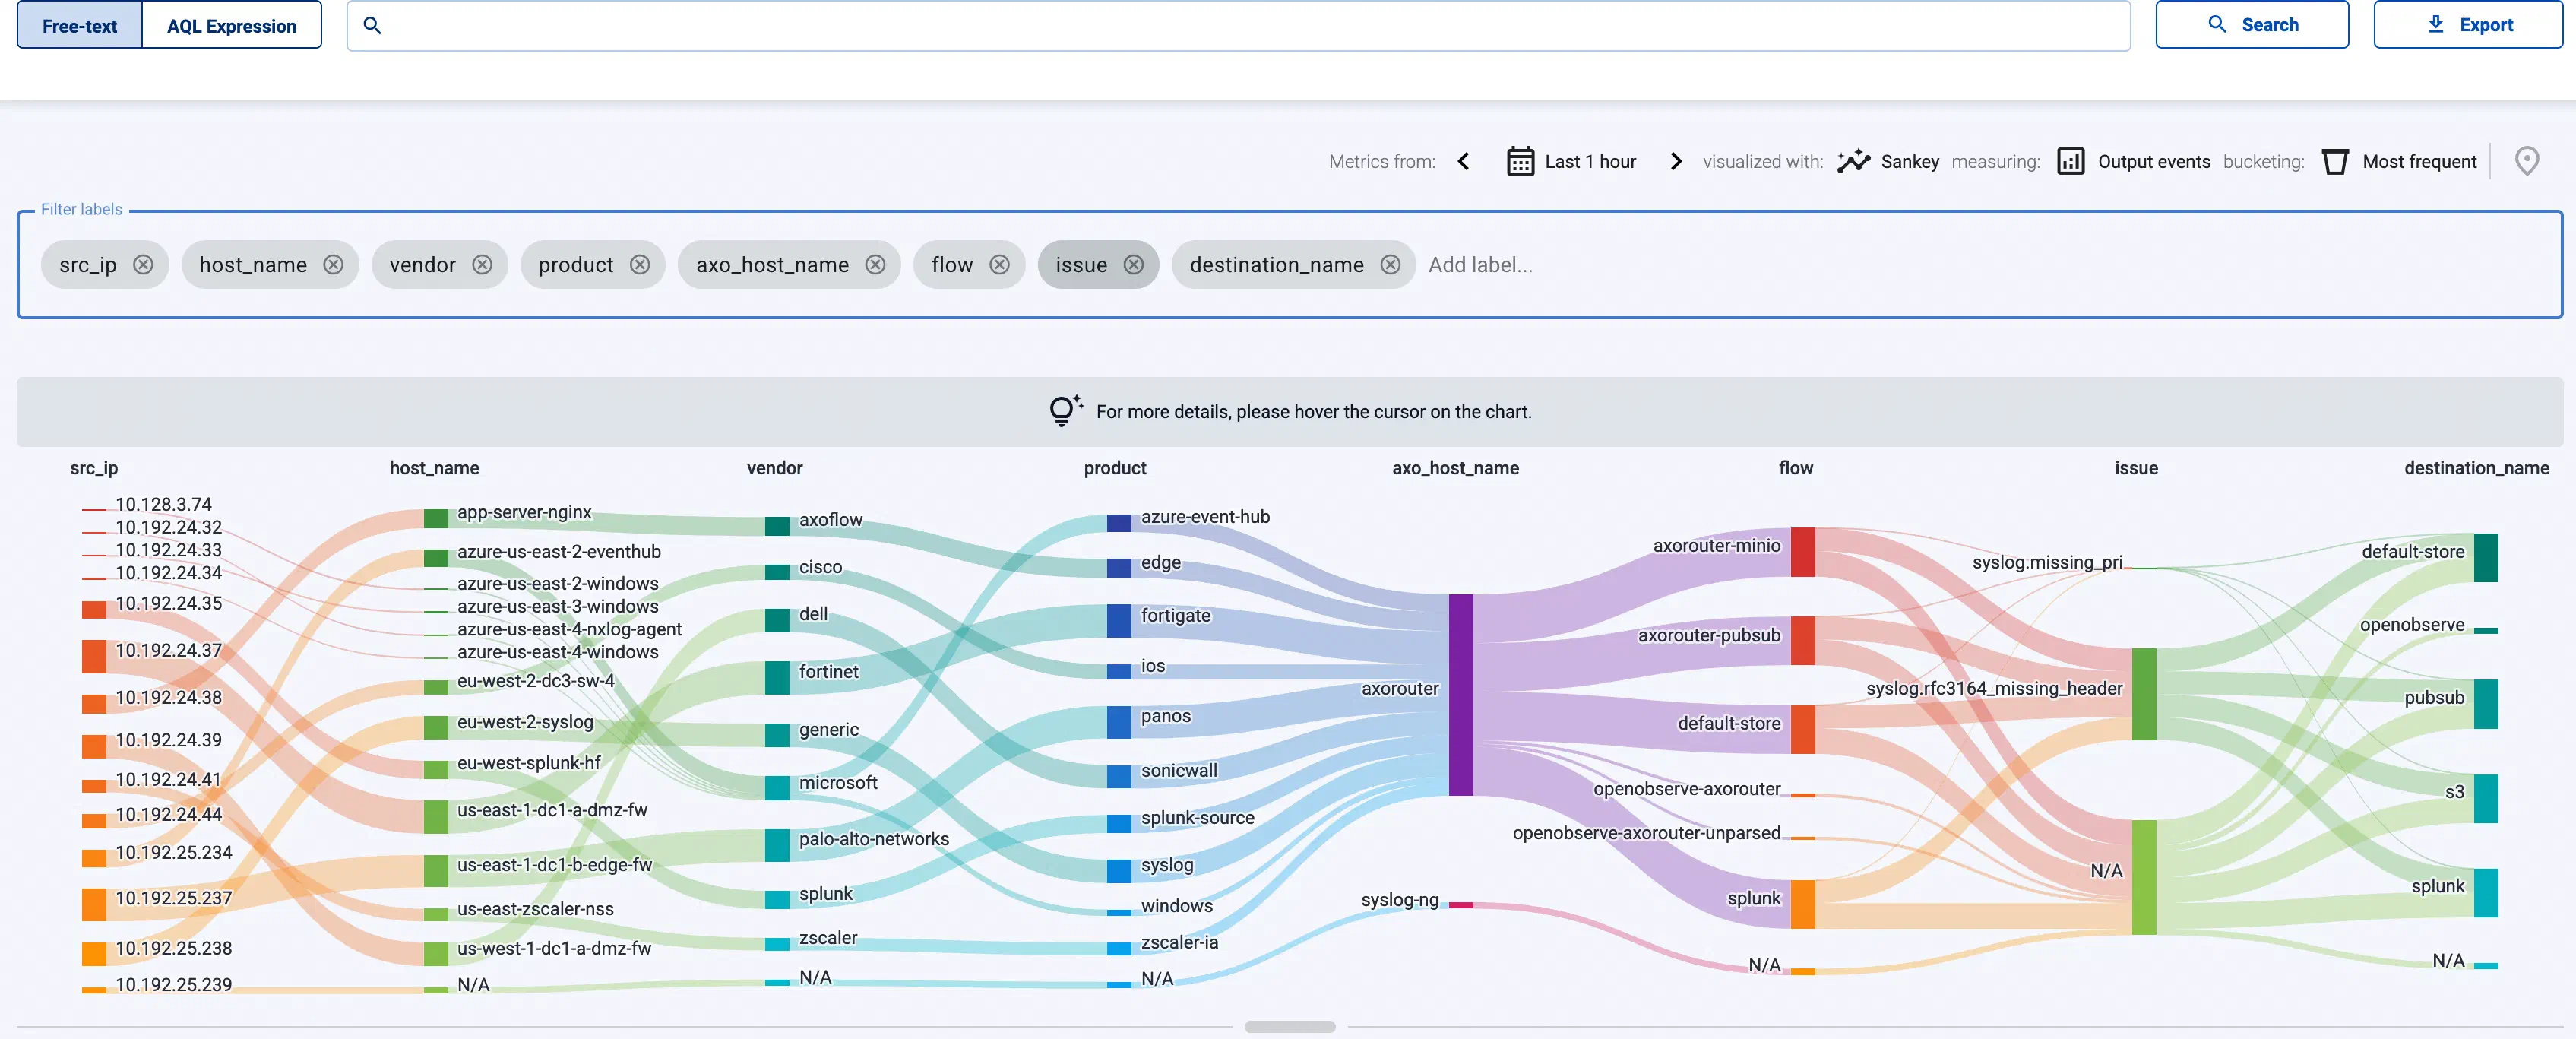
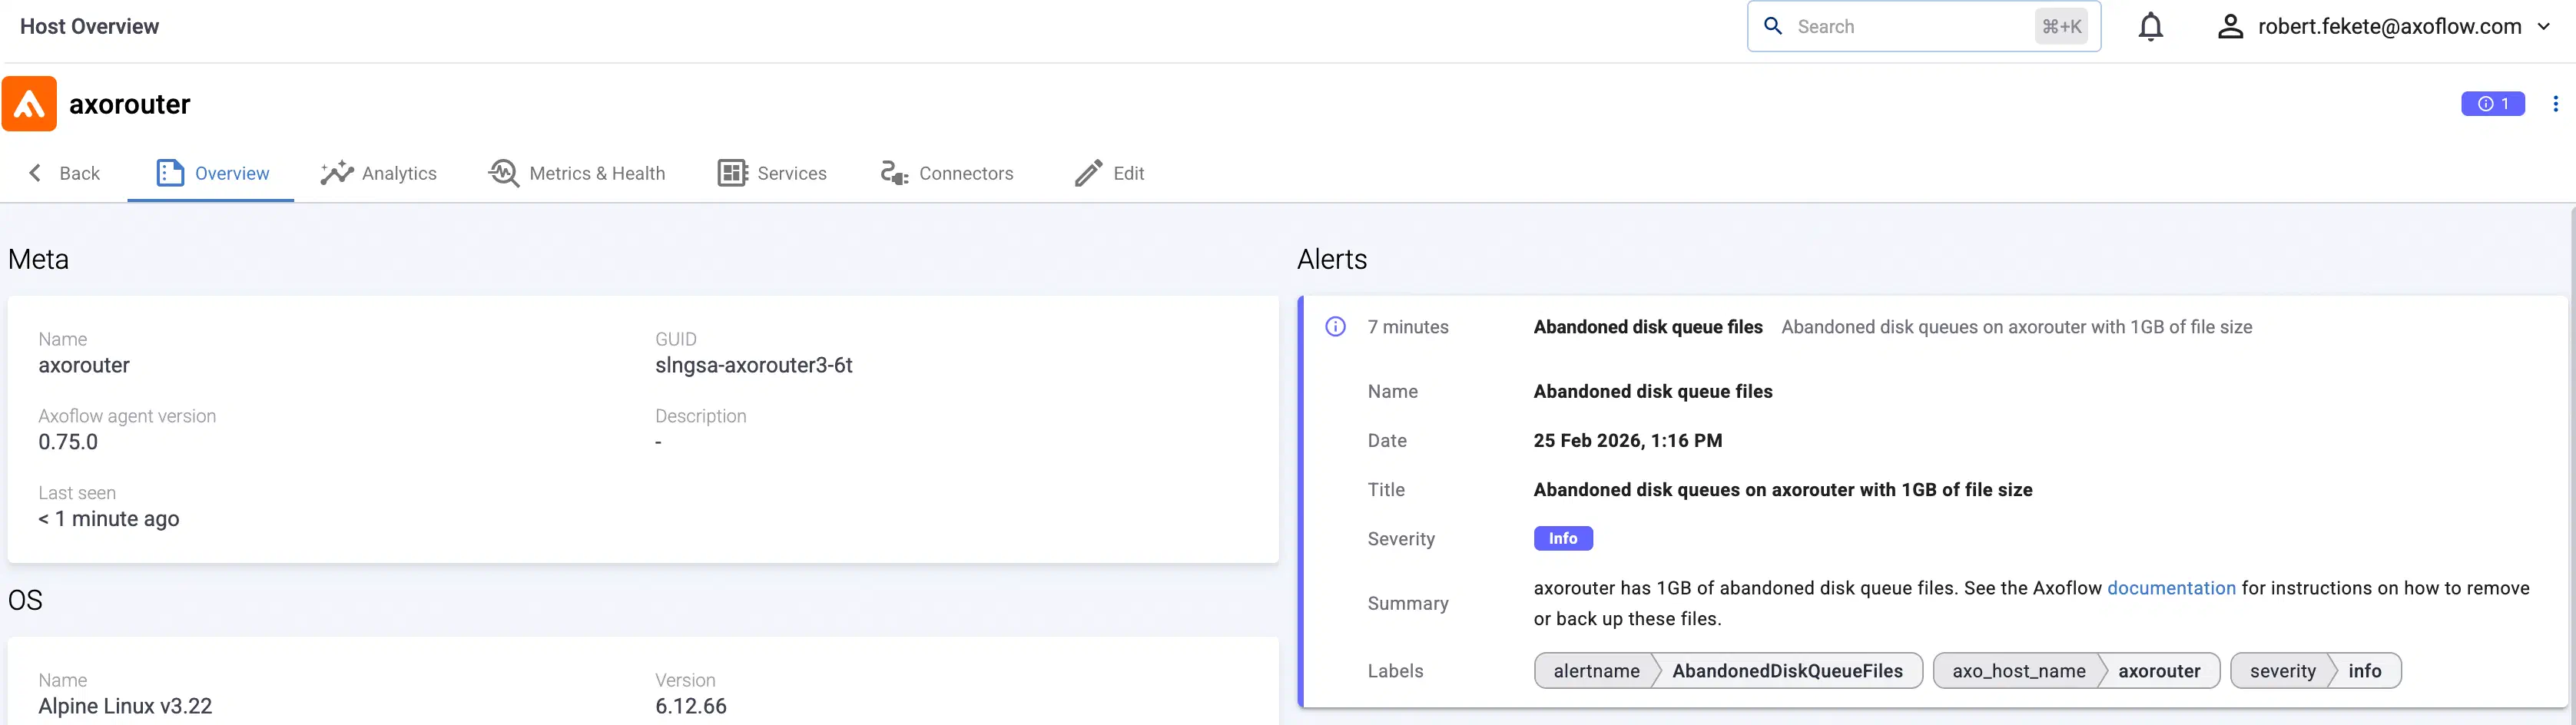
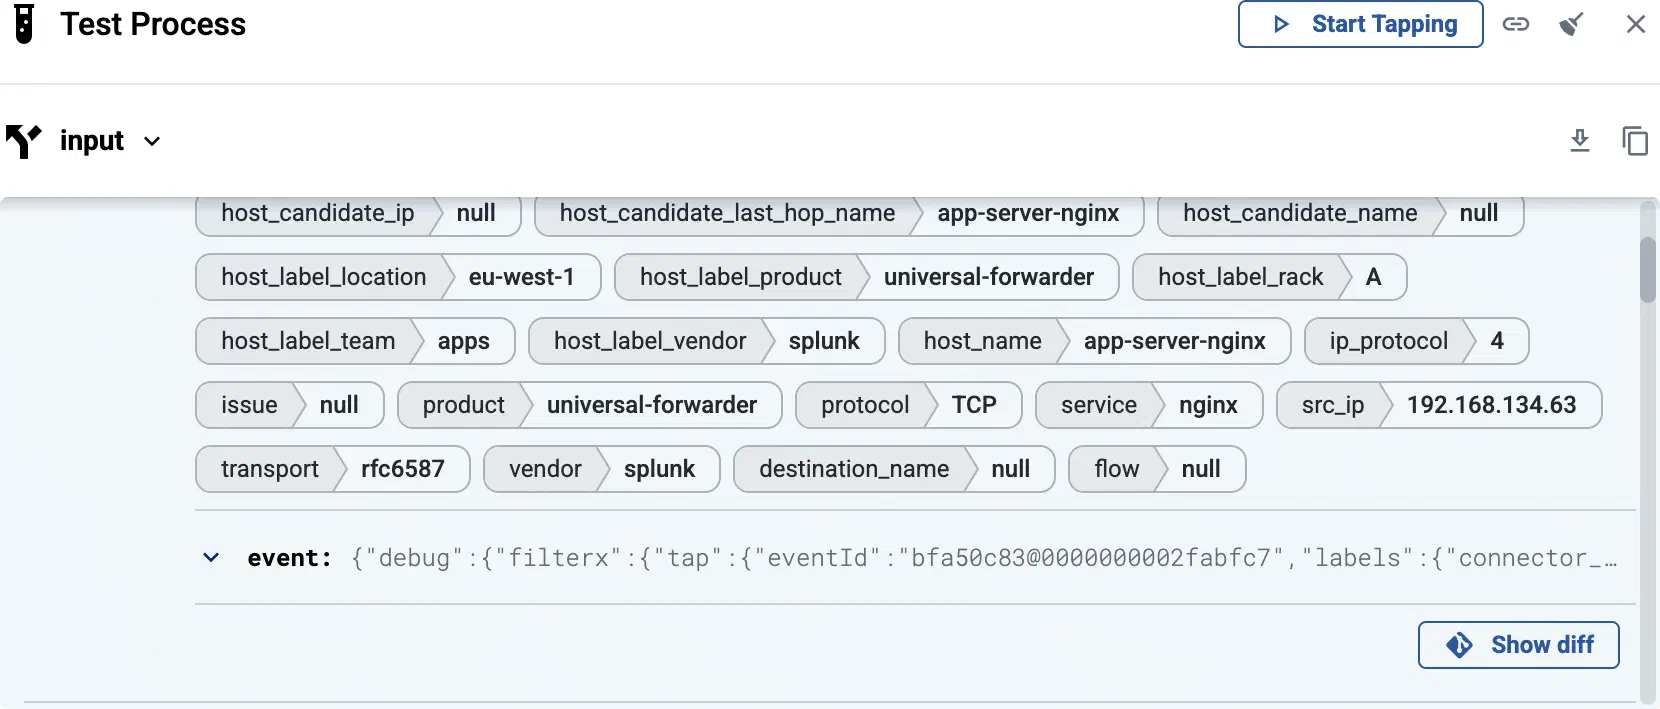
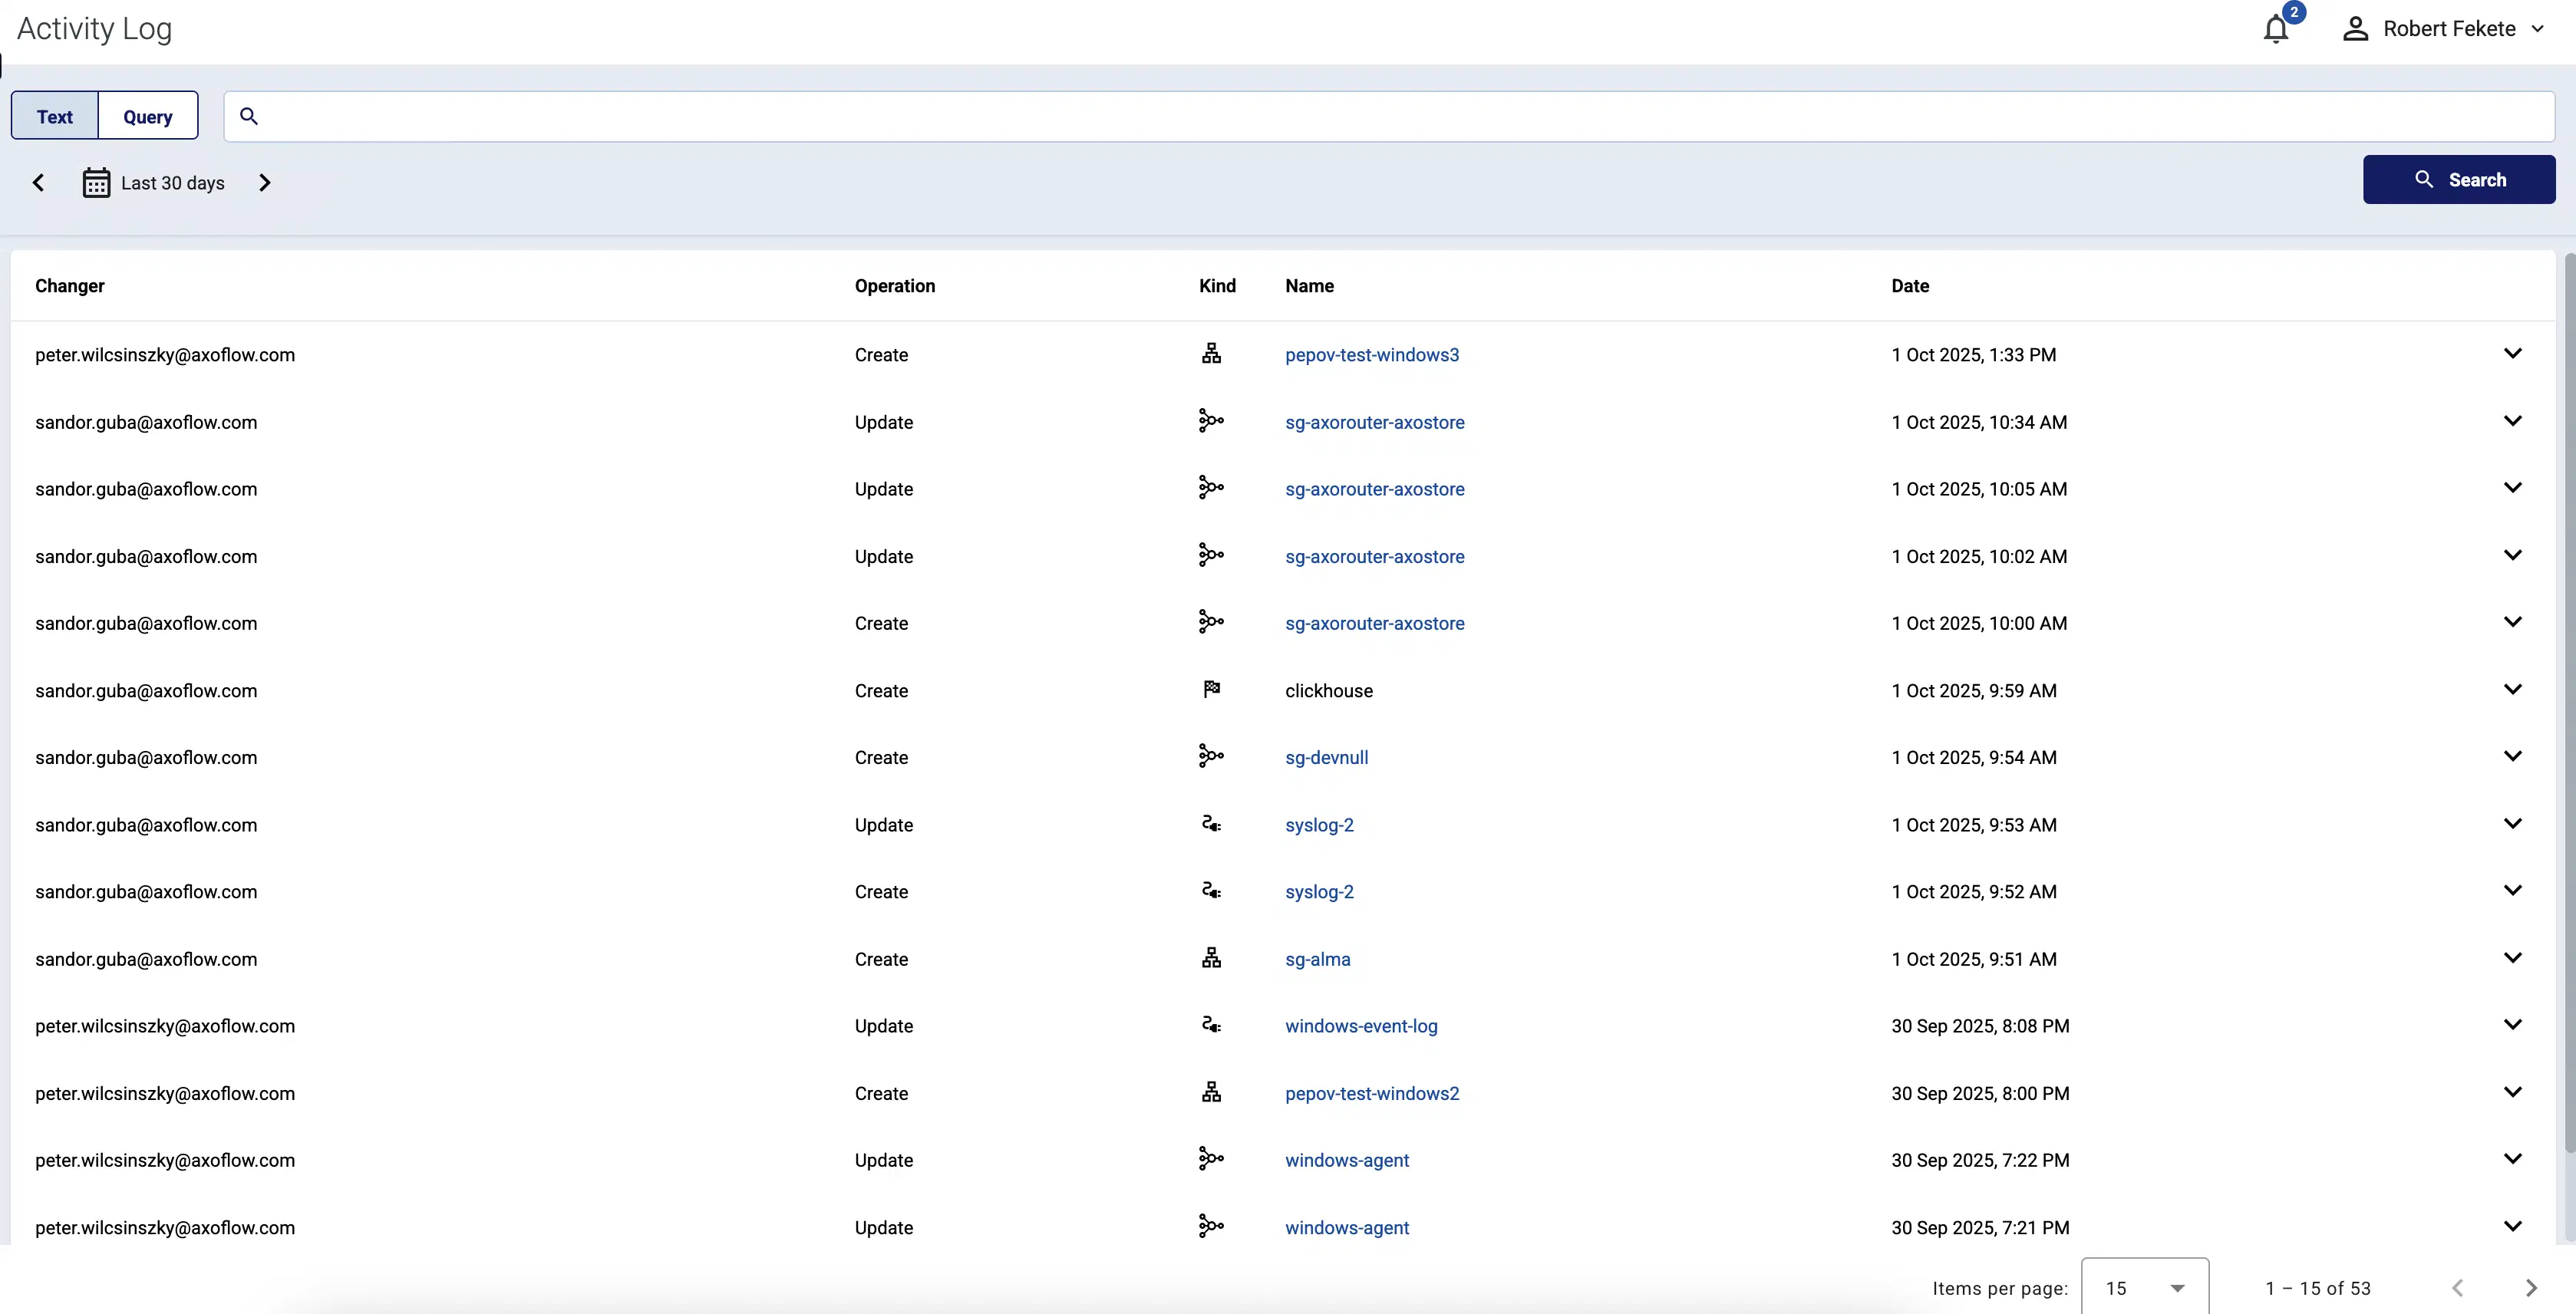
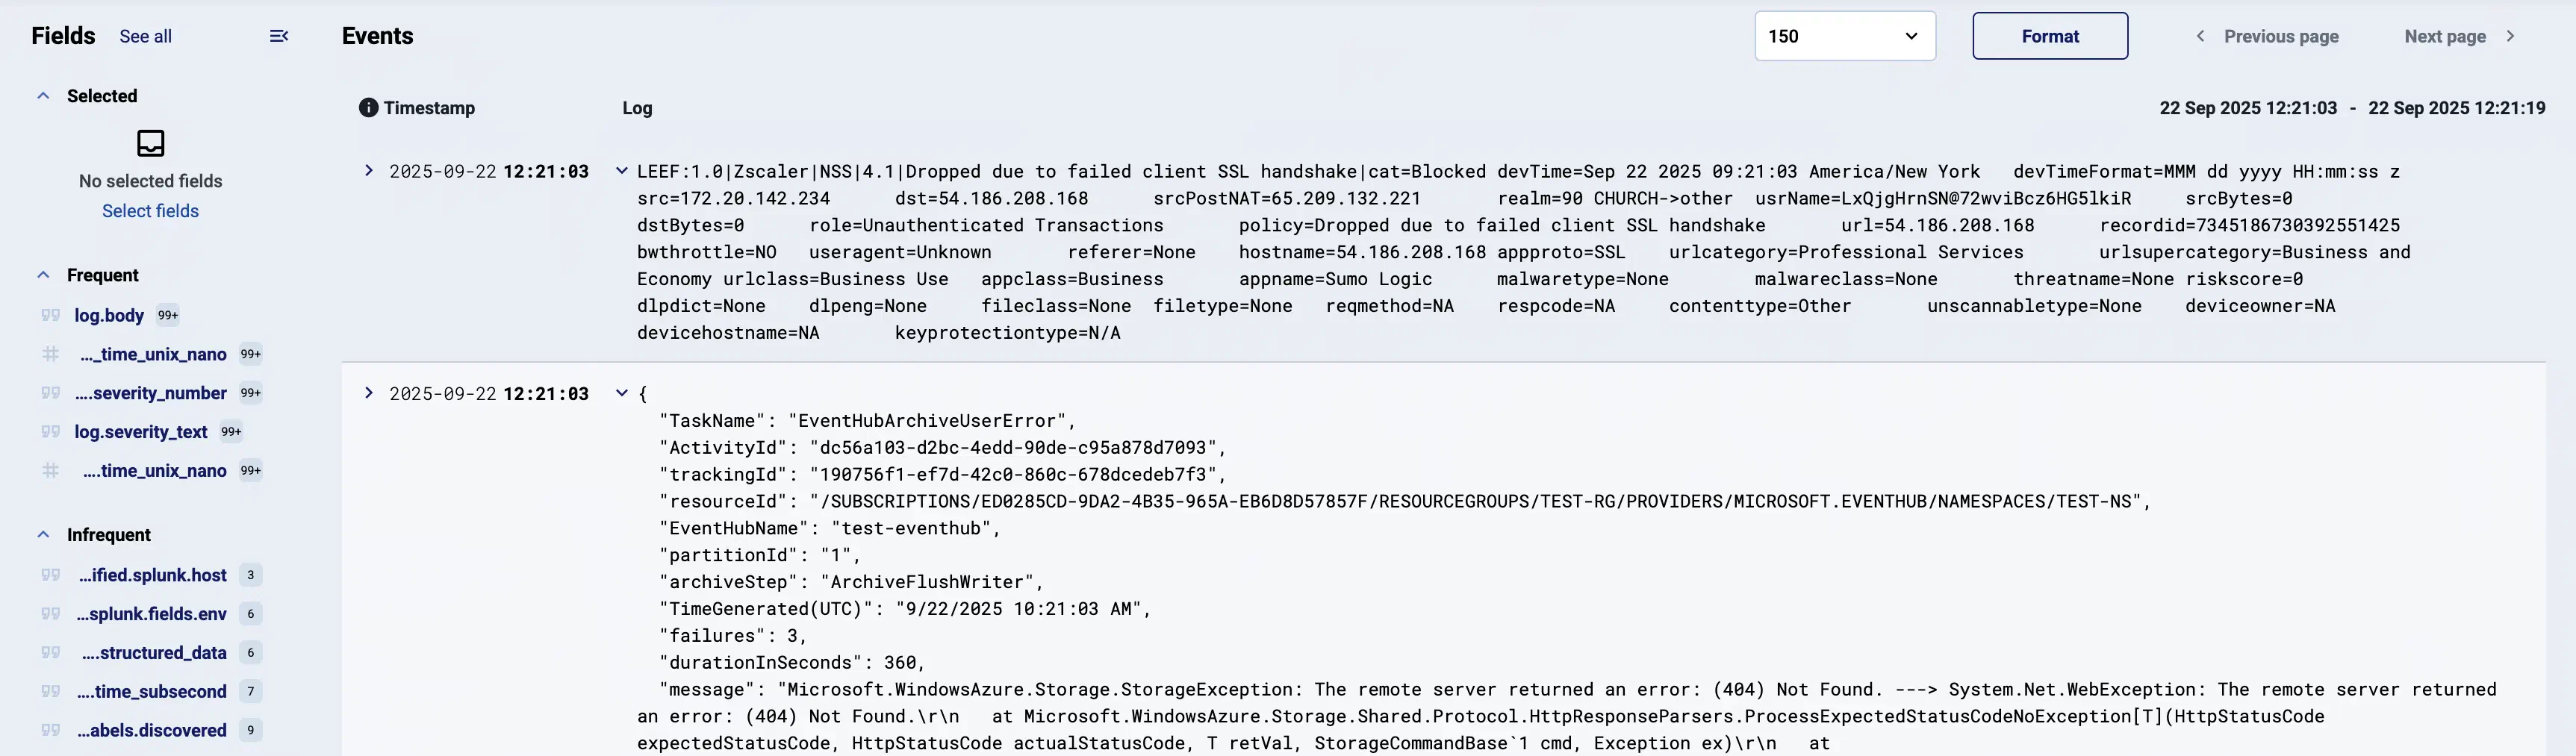
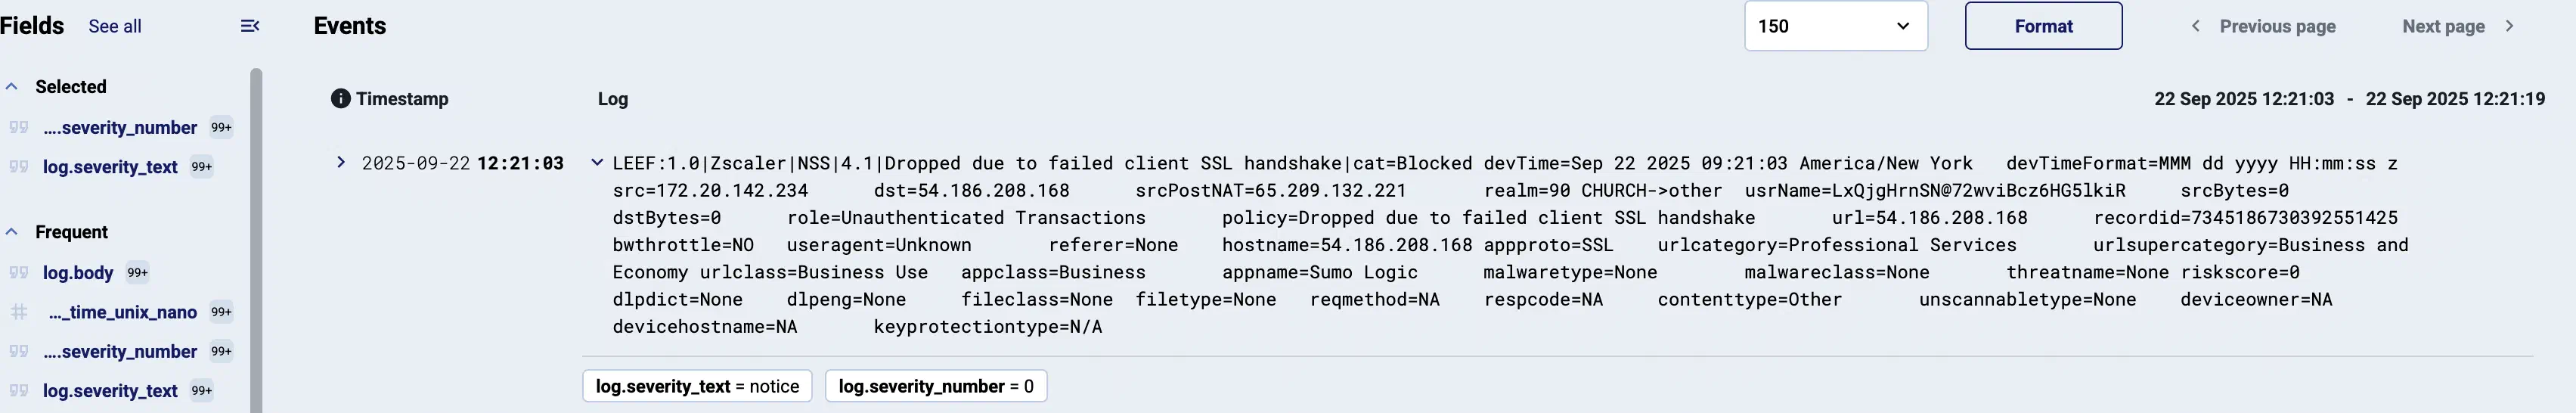
AxoConsole allows you to quickly drill down to find log flows with issues, and to tap into the log flow and see samples of the specific messages that are processed, along with the related parsing information, like tags that describe the errors of invalid messages.
message.utf8_sanitized: The message is not valid UTF-8.
syslog.missing_timestamp: The message has no timestamp.
syslog.invalid_hostname: The hostname field doesn’t seem to be valid, for example, it contains invalid characters.
syslog.missing_pri: The priority (PRI) field is missing from the message.
syslog.unexpected_framing: An octet count was found in front of the message, suggested invalid framing.
syslog.rfc3164_missing_header: The date and the host are missing from the message – practically that’s the entire header of RFC3164-formatted messages.
syslog.rfc5424_unquoted_sdata_value: The message contains an incorrectly quoted RFC5424 SDATA field.
message.parse_error: Some other parsing error occurred.
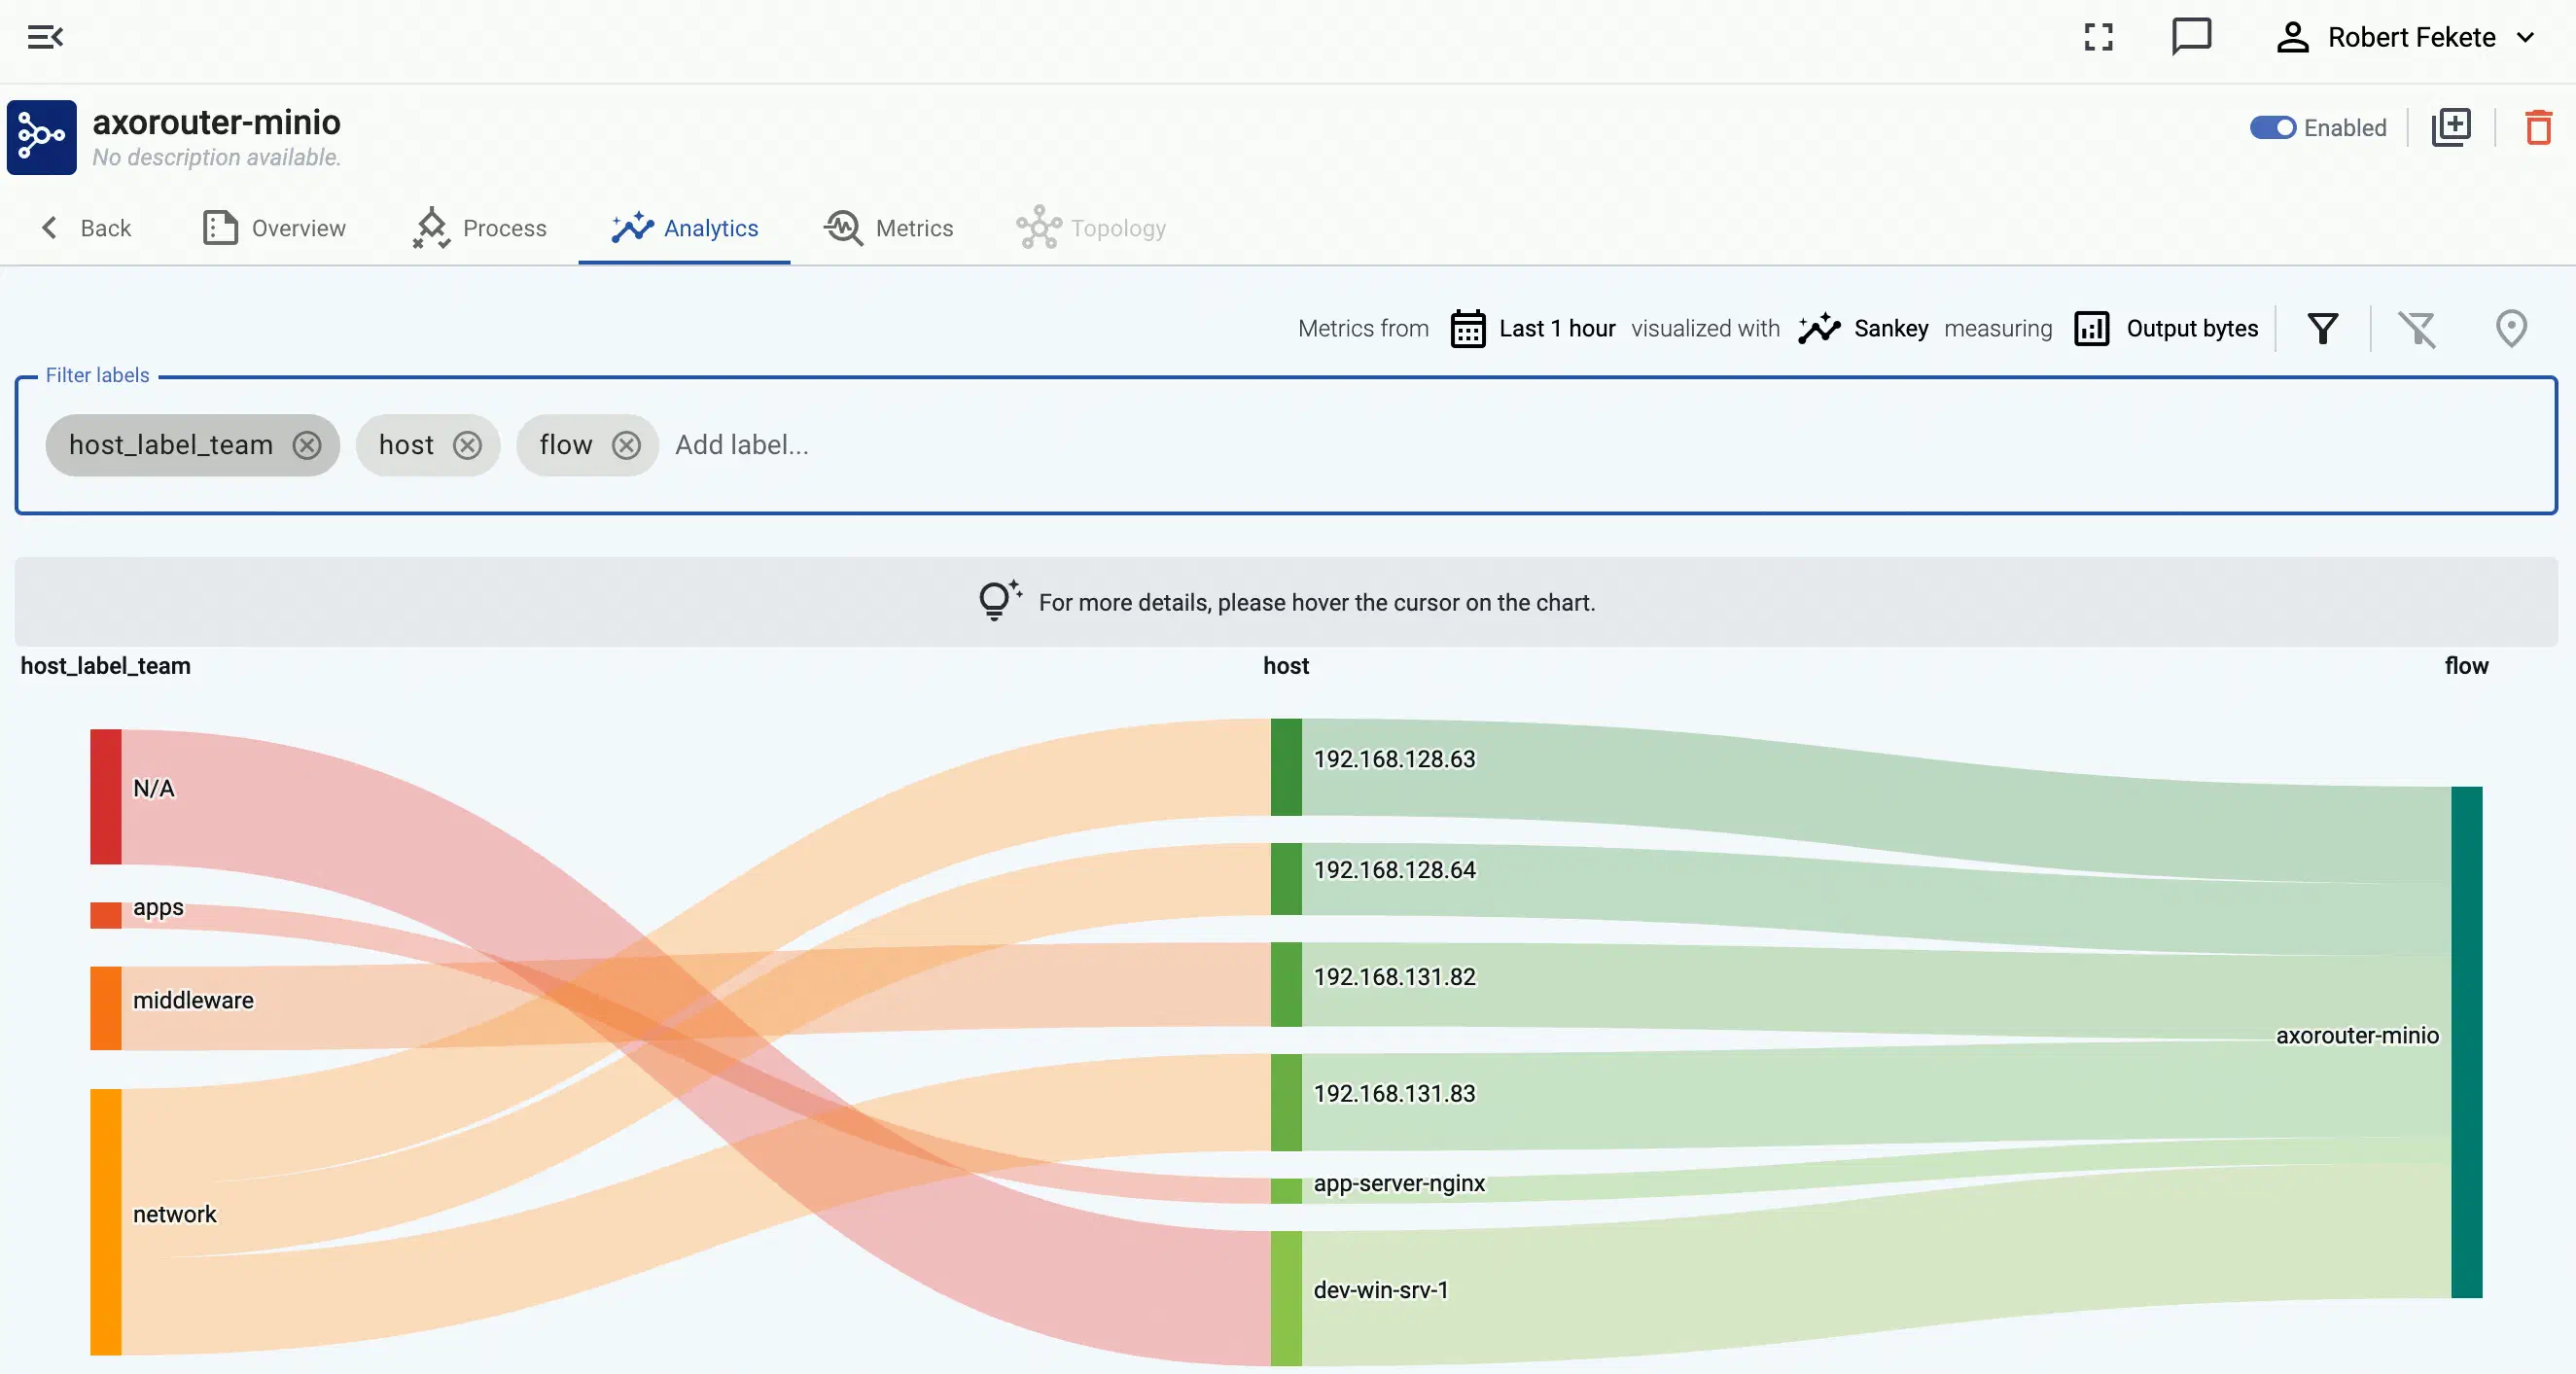
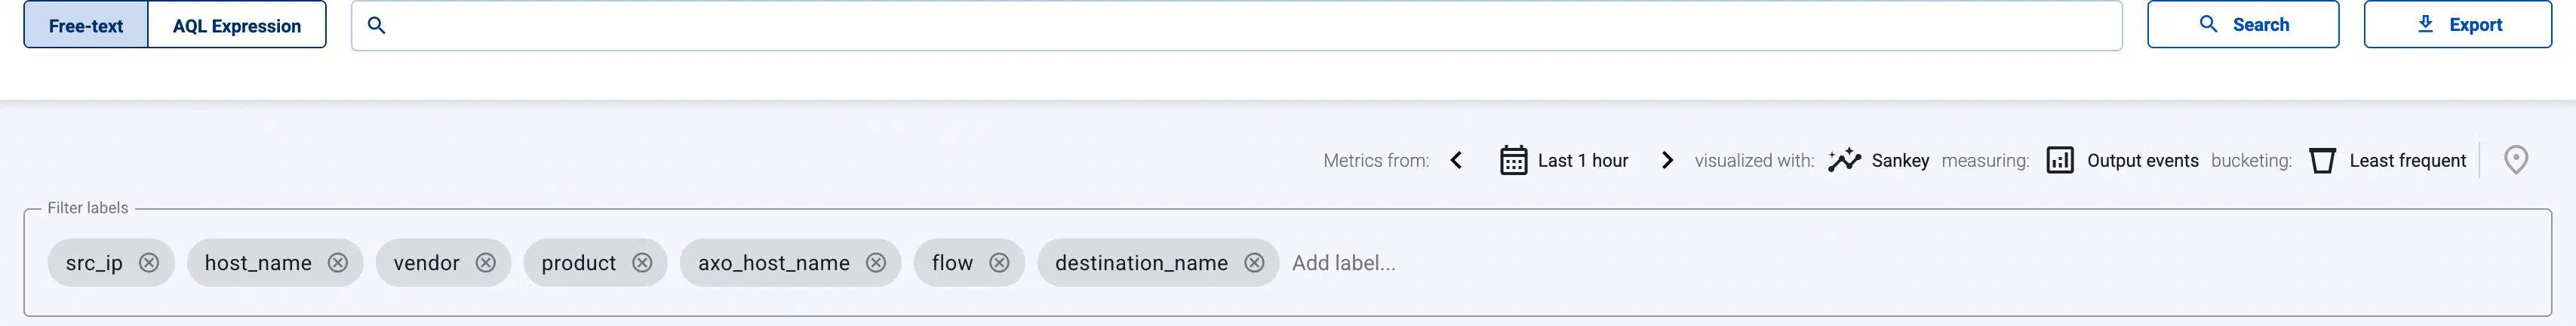
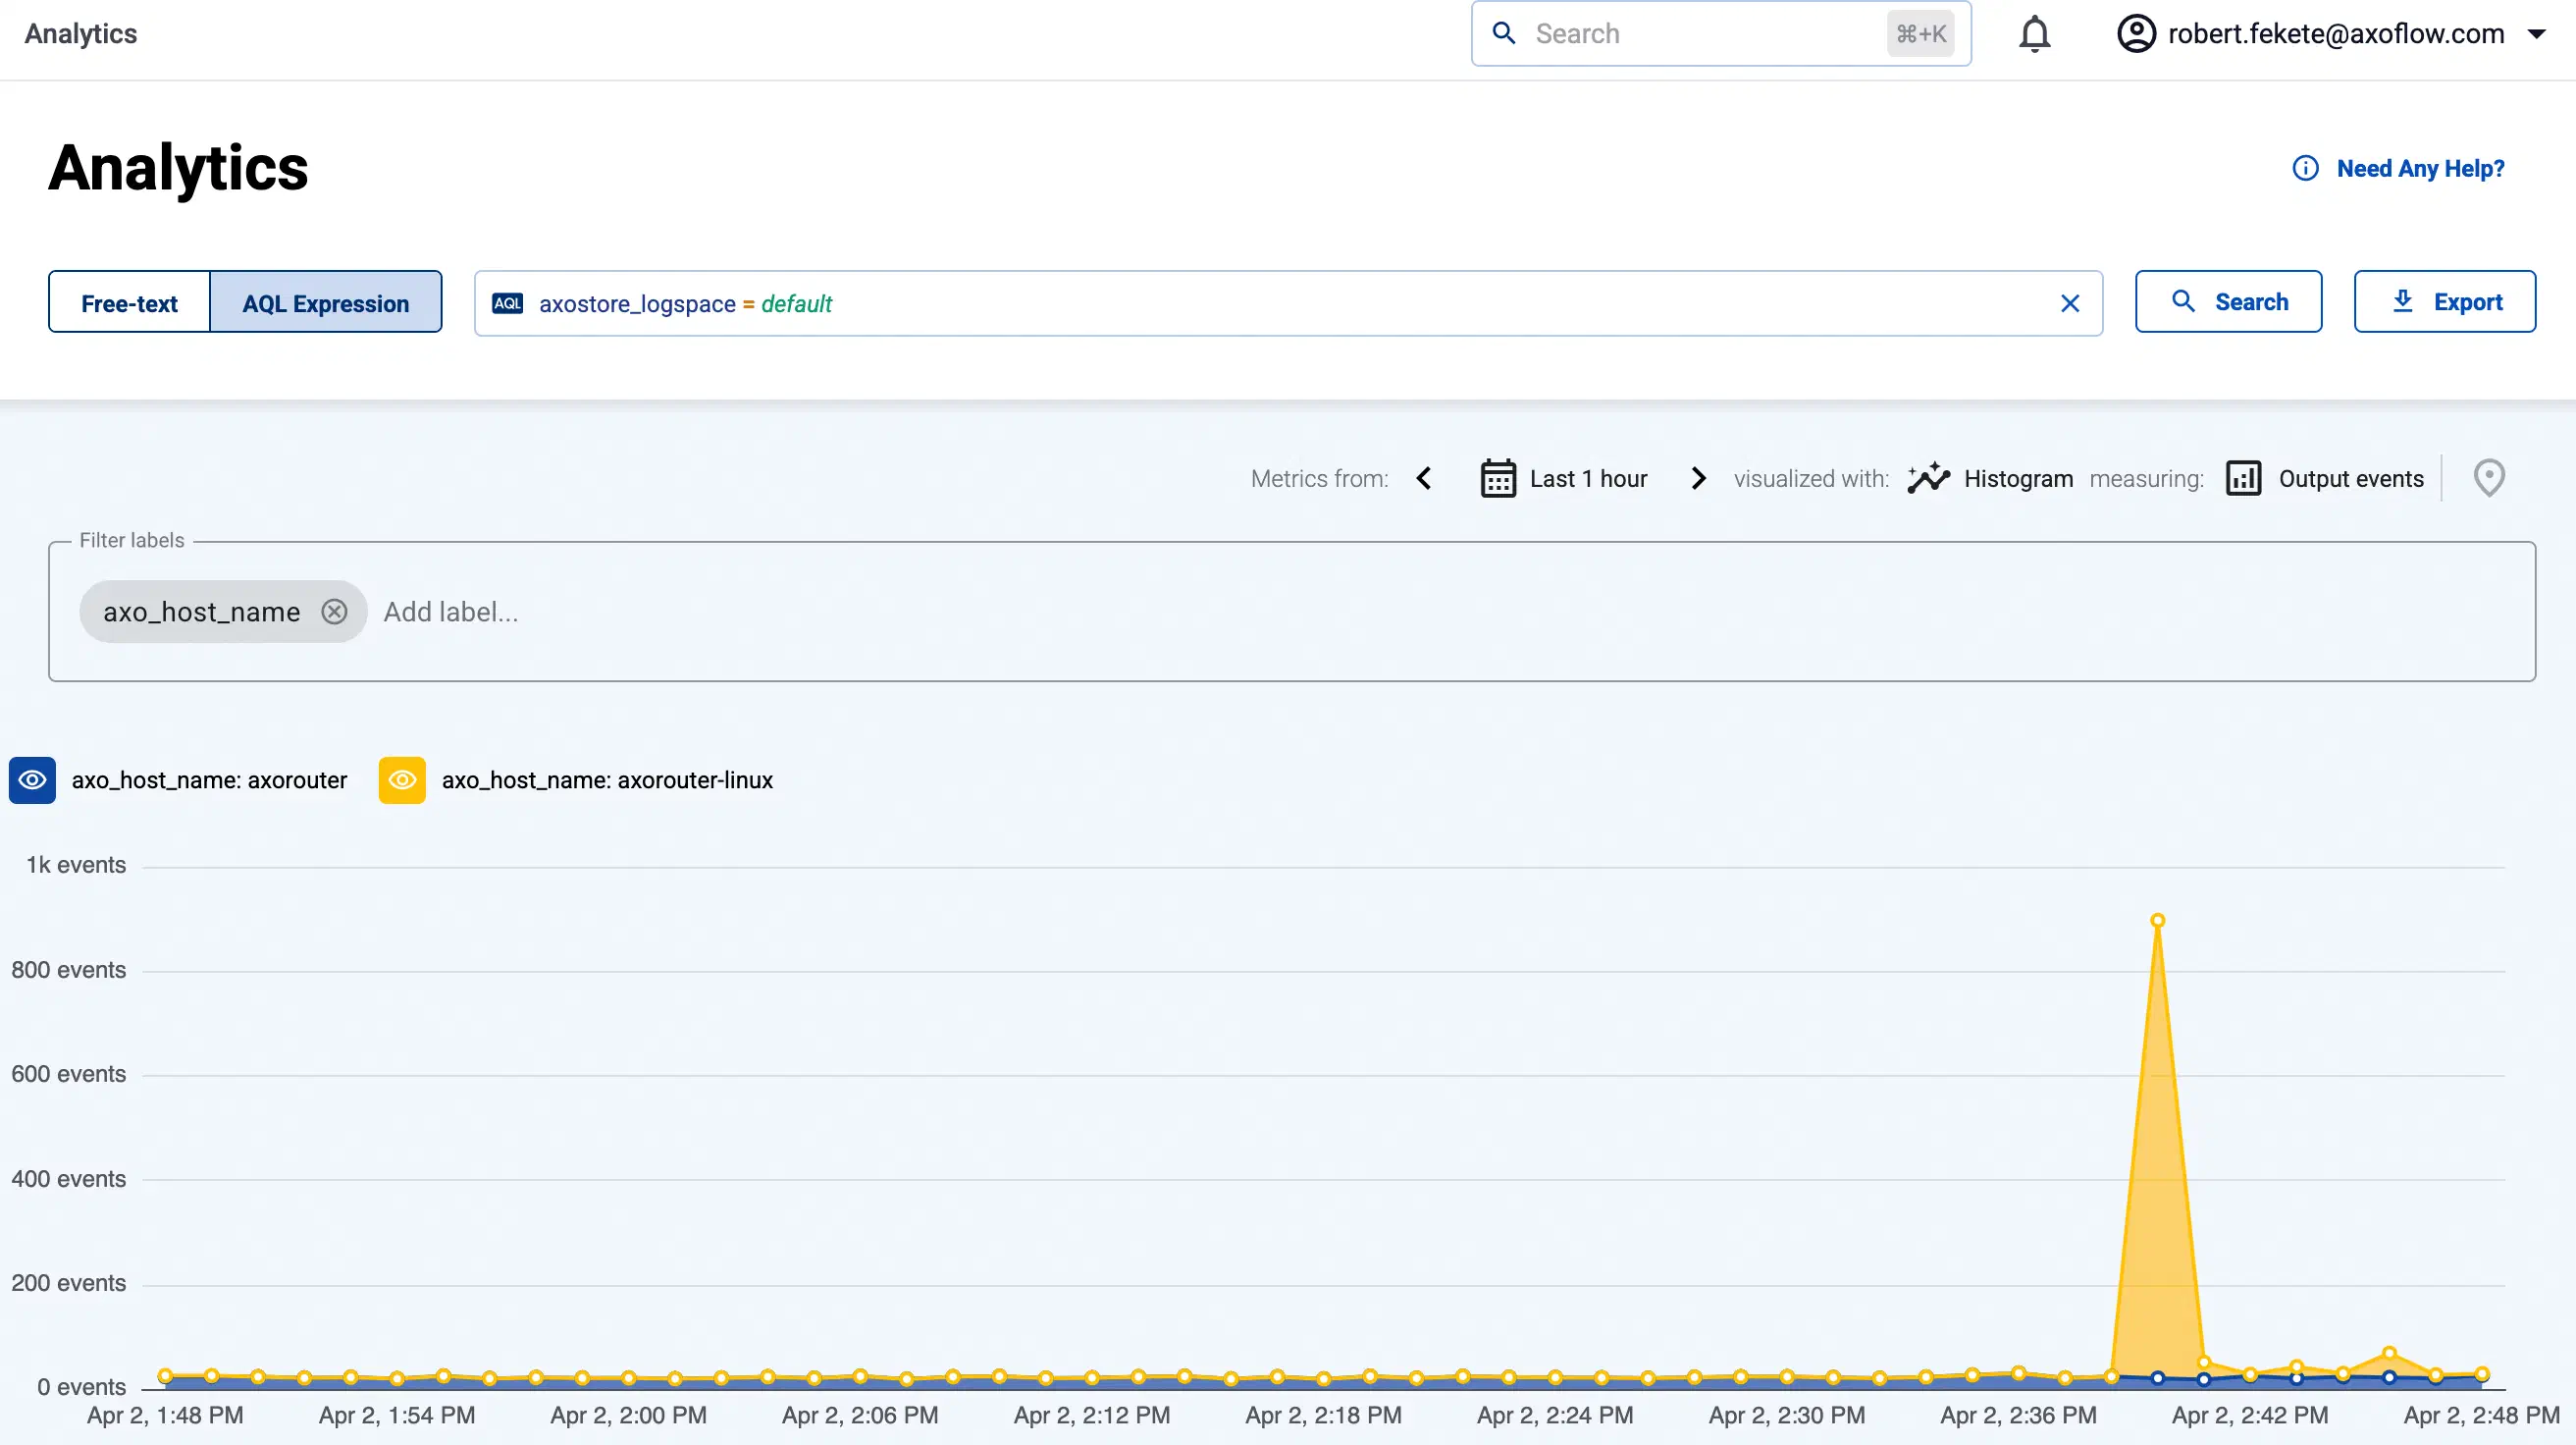
You can get an overview of such problems in your pipeline on the Analytics page by adding issue to the Filter labels field.
6.3 - Host attribution and inventory
Axoflow’s built-in inventory solution enriches your security data with critical metadata (like the origin host) so you can pinpoint the exact source of every data entry, enabling precise, label-based routing and more informed security decisions.
Enterprises and organizations collect security data (like syslog and other event data) from various data sources, including network devices, security devices, servers, and so on. When looking at a particular log entry during a security incident, it’s not always trivial to determine what generated it. Was it an appliance or an application? Which team is the owner of the application or device? If it was a network device like a switch or a Wi-Fi access point (of which even medium-sized organizations have dozens), can you tell which one it was, and where is it located?
Cloud-native environments, like Kubernetes have addressed this issue using resource metadata. You can attach labels to every element of the infrastructure: containers, pods, nodes, and so on, to include region, role, owner or other custom metadata. When collecting log data from the applications running in containers, the log collector agent can retrieve these labels and attach them to the log data as metadata. This helps immensely to associate routing decisions and security conclusions with the source systems.
In non-cloud environments, like traditionally operated physical or virtual machine clusters, the logs of applications, appliances, and other data sources lack such labels. To identify the log source, you’re stuck with the sender’s IP address, the sender’s hostname, and in some cases the path and filename of the log file, plus whatever information is available in the log message.
Why isn’t the IP address or hostname enough?
Source IP addresses are poor identifiers, as they aren’t strongly tied to the host, especially when they’re dynamically allocated using DHCP or when a group of senders are behind a NAT and have the same address.
Some organizations encode metadata into the hostname or DNS record. However, compared to the volume of log messages, DNS resolving is slow. Also, the DNS record is available at the source, but might not be available at the log aggregation device or the log server. As a result, this data is often lost.
Many data sources and devices omit important information from their messages. For example, the log messages of Cisco routers by default omit the hostname. (They can be configured to send their hostname, but unfortunately, often they aren’t.) You can resolve their IP address to obtain the hostname of the device, but that leads back to the problem in the previous point.
In addition, all the above issues are rooted in human configuration practices, which tend to be the main cause of anomalies in the system.
Correlating data to data source
Some SIEMs (like IBM QRadar) rely on the sender IP address to identify the data source. Others, like Splunk, delegate the task of providing metadata to the collector agent, but log sources often don’t supply metadata, and even if they do, the information is based on IP address or DNS.
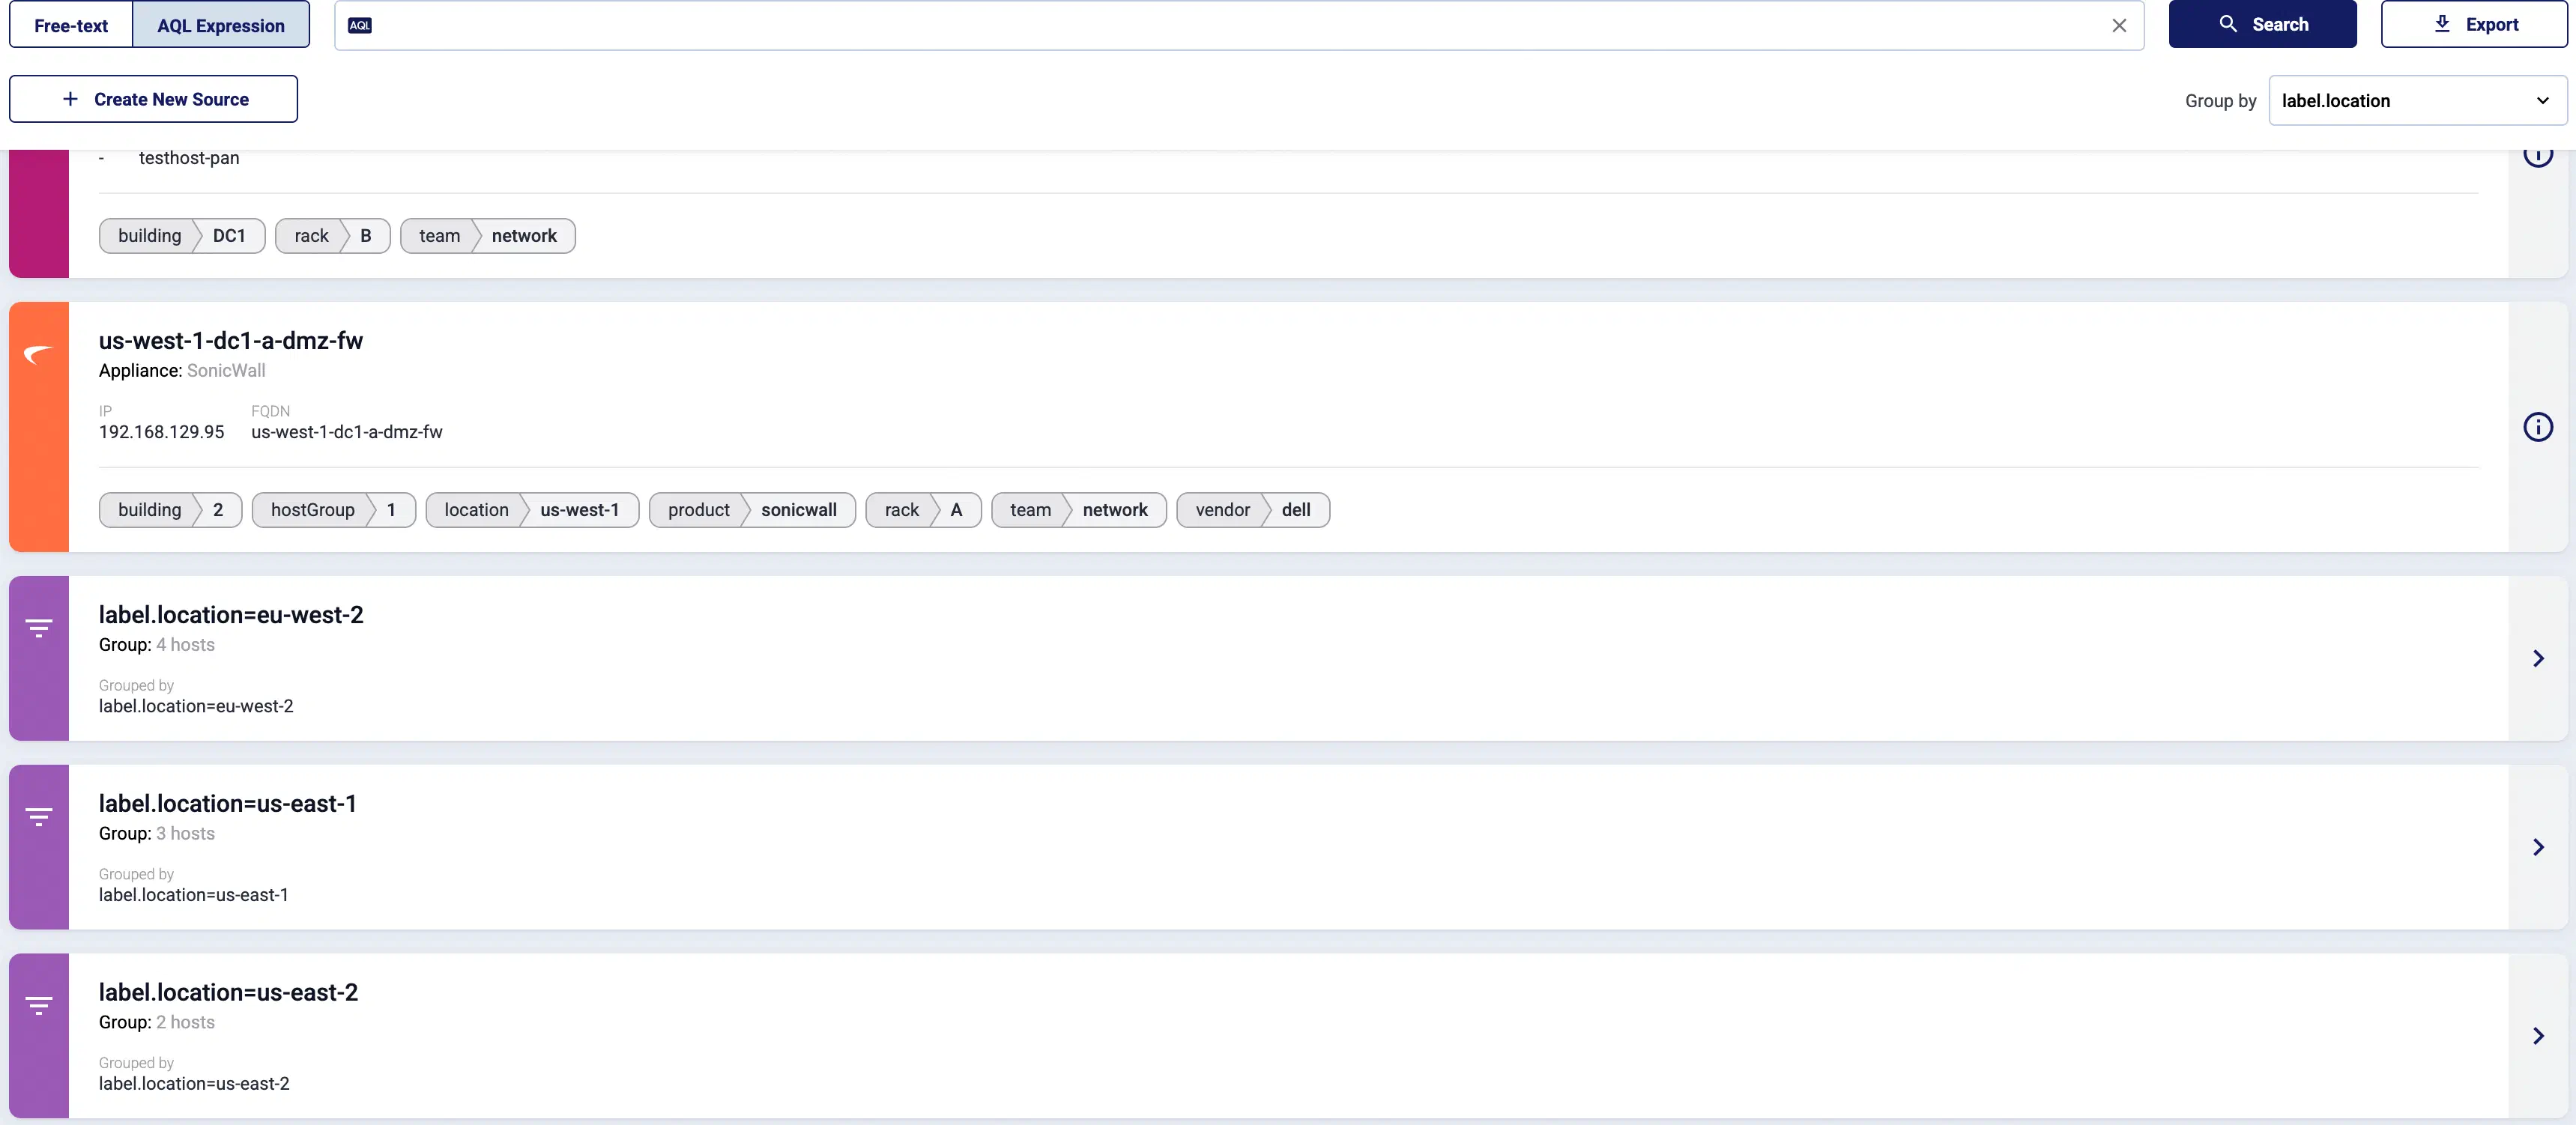
Certain devices, like SonicWall firewalls include a unique device ID in the content of their log messages. Having access to this ID makes attribution straightforward, but logging solutions rarely extract such information. AxoRouter does.
Axoflow builds an inventory to match the messages in your data flow to the available data sources, based on data including:
IP address, host name, and DNS records of the source (if available),
serial number, device ID, and other unique identifiers extracted from the messages, and
metadata based on automatic classification of the log messages, like product and vendor name.
Axoflow (or more precisely, AxoRouter) classifies the processed log data to identify common vendors and products, and automatically applies labels to attach this information.
You can also integrate the telemetry pipeline with external asset management systems to further enrich your security data with custom labels and additional contextual information about your data sources.
6.4 - Policy based routing
Axoflow’s host attribution gives you unprecedented possibilities to route your data. You can tell exactly what kind of data you want to send where. Not only based on technical parameters like sender IP or application name, but using a much more fine-grained inventory that includes information about the devices, their roles, and their location. For example:
The vendor and the product (for example, a SonicWall firewall)
The physical location of the device (geographical location, rack number)
Owner of the device (organization/department/team)
Paired with the information from the content of the messages, all this metadata allows you to formulate high-level, declarative policies and alerts using the metadata labels, for example:
Route the logs of devices to the owner’s Splunk index.
Route every firewall and security log to a specific index.
Let the different teams manage and observe their own devices.
Granular access control based on relevant log content (for example, identify a proxy log-stream based on the upstream address), instead of just device access.
Ensure that specific logs won’t cross geographic borders, violating GDPR or other compliance requirements.
6.5 - Classify and reduce security data
Axoflow provides a robust classification system that actually verifies the data it receives, instead of relying on using dedicated ports. This approach results in automatic data labeling, high-quality data, and volume reduction - out of the box, automated, without coding.
Classify the incoming data
Verifying which device or service a certain message belongs to is difficult: even a single data source (like an appliance) can have different kinds of messages, and you have to be able to recognize each one, uniquely. This requires:
deep, device and vendor-specific understanding of the data, and also
understanding of the syslog data formats and protocols, because oftentimes the data sources send invalid messages that you have to recognize and fix as part of the classification process.
Also, classification needs to be both reliable and performant. A naive implementation using regexps is neither, nevertheless, that’s the solution you find at the core of today’s ingestion pipelines. We at Axoflow understand that creating and maintaining such a classification database is difficult, this is why we decided to make classification a core functionality of the Axoflow Platform, so you will never need to write another parsing regexp. At the moment, Axoflow supports over 90 data sources of well-known vendors.
Classification and the ability to process your security data in the pipeline also allows you to:
Fix the incoming data (like malformed firewall messages) to add missing information, like hostname or timestamp.
Transform the data into an optimized format that the destination can reliably and effortlessly consume. This includes mapping your data to multiple different schemas if you use multiple analytic tools.
Reduce data volume
Classifying and parsing the incoming data allows you to remove the parts that aren’t needed, for example, to:
drop entire messages if they are redundant or not relevant from a security perspective,
remove parts of individual messages, like fields that are non-empty even if they do not convey information (for example, that contain values such as “N/A” or “0”), or
remove redundant fields (where the same data appears multiple times in the message).
As this data reduction happens in the pipeline, before the data arrives in the SIEM or storage, it can save you significant costs, and also improves the quality of the data your detection engineers get to work with.
Palo Alto log reduction example
Let’s see an example on how data reduction works in Axoflow. Here is a log message from a Palo Alto firewall:
Here’s what you can drop from this particular message:
Redundant timestamps: Palo Alto log messages contain up to five, practically identical timestamps (see the Receive time, Generated time, and High resolution timestamp fields in the Traffic Log Fields documentation):
the syslog timestamp in the header (Mar 26 18:41:06),
the time Panorama (the management plane of Palo Alto firewalls) collected the message (2025/03/26 18:41:06), and
the time when the event was generated (2025/03/26 18:41:06).
The sample log message has five timestamps. Leaving only one timestamp can reduce the message size by up to 15%.
The priority field (<165>) is identical in most messages and has no information value. While that takes up only about 1% of the size of the, on high-traffic firewalls even this small change adds up to significant data saving.
Several fields contain default or empty values that provide no information, for example, default internal IP ranges like 192.168.0.0-192.168.255.255. Removing such fields yields over 10% size reduction.
Note that when removing fields, we can delete only the value of the field, because the message format (CSV) relies on having a fixed order of columns for each message type. This also means that we have to individually check what can be removed from each of the 17 Palo Alto log type.
Palo Alto firewalls send this specific message when a connection is closed. They also send a message when a new connection is started, but that doesn’t contain any information that’s not available in the ending message, so it’s completely redundant and can be dropped. As every connection has a beginning and an end, this alone almost halves the size of the data stored per connection. For example:
Axoflow normalizes incoming data and delivers it in a destination-friendly format and schema - covering keys, data types, streams, or indexes - rather than ingesting raw blobs. This includes consistent timestamps and attributes that downstream search queries, alerts, and detection engineers can immediately use. When a destination supports a specific normalization framework, Axoflow applies it by default. For vendor-specific schemas, such as Dynatrace Grail’s semantic dictionary, Axoflow adds native support to ensure seamless integration.
Why Normalization Matters
Logs and security data come in different formats, from different devices, even when referring to the same event, making it difficult to find, understand, and correlate the data. Security events and detection rules should be agnostic to how the data was collected or where it came from. Your detection engineers shouldn’t care about what’s the exact name of the field where your different firewalls store the IP of the client: all such events should refer to a standard name. However, it needs expertise and a lot of legwork to do that properly. There is no one-to-one mapping between sources and schemas. You need to check the schema descriptions, understand the original content and know how the data will be used for analysis. The normalized version of an event helps your security teams best in their detection and investigation, as it makes it easy to correlate events received from different vendors (or different devices).
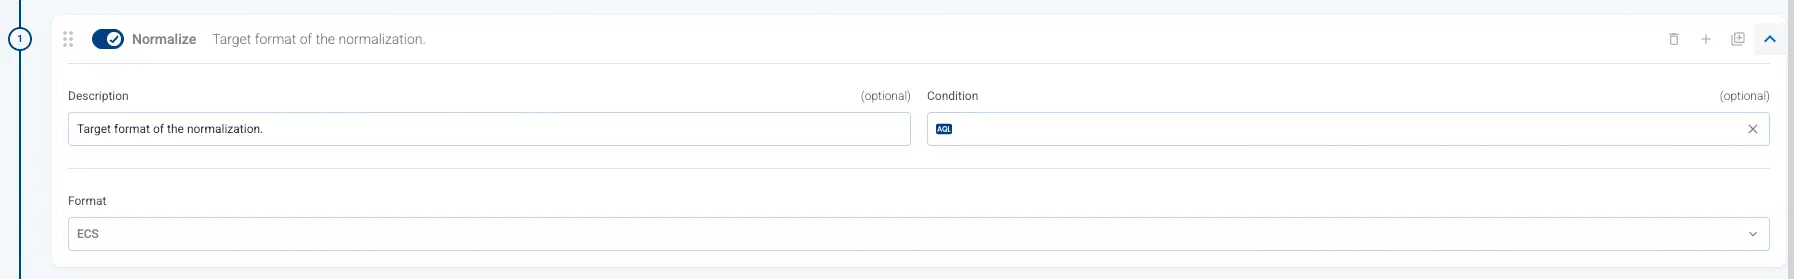
Axoflow builds this intelligence in. By combining AI with our deep data and security expertise, Axoflow automatically normalizes your data in real time within the pipeline. It supports multiple normalization frameworks, including Elastic Common Schema (ECS) and Open Cybersecurity Schema Framework (OCSF), so your security teams can work with normalized data from the start, enabling them to write stronger detection rules and uncover insights faster. You can even send the same data to multiple destinations in the normalized format that the specific destination supports.
We create and maintain our normalization database using an AI-backed process supervised by our engineers, so development is rapid, while it maintains high-quality and consistency.
To sum up, normalizing data:
simplifies data ingestion for your SIEM
improves correlation and detection
speeds up investigations
decreases vendor lock-in and improves flexibility.
6.7 - Reliable transport
Between its components, Axoflow transports data using the reliable OpenTelemetry protocol (OTLP) for high performance, and to avoid losing messages. Under the hood, OpenTelemetry uses gRPC, and has superior performance compared to other log transport protocols, consumes less bandwidth (because it uses protocol buffers), and also provides features like:
on-the-wire compression
authentication
application layer acknowledgement
batched data sending
multi-worker scalability on the client and the server.
In addition, Axoflow components use disk buffers to store data on the local hard disk if the destination (for example, your SIEM) or the network connection to the destination becomes unavailable. When the connection is reestablished, it automatically sends the stored messages to the destination in the order they were received.
7 - Provision pipeline elements
The following sections describe how to register a logging host into the AxoConsole.
For appliances that are specifically supported by Axoflow, see onboarding appliances.
If the host is running one of the following log collector agents and you can install Axolet on the host to receive detailed metrics about the host, the agent, and data flow the agent processes.
Install Axolet on the host. For details, see Axolet.
Configure the log collector agent of the host to integrate with Axolet. For details, see the following pages:
AxoRouter is a key building block of Axoflow that collects, aggregates, transforms and routes all kinds of telemetry and security data automatically. AxoRouter for Linux includes a Podman container running AxoSyslog, Axolet, and other components.
To install AxoRouter on a Linux host, complete the following steps. For other platforms, see AxoRouter.
Note
Note that AxoRouter and Axoflow agent collects detailed, real-time metrics about the data-flows – giving you observability over the health of the security data pipeline and its components. Your security data remains in your self-managed cloud or in your on-prem instance where your sources, destinations, Axoflow agents, and AxoRouters are running, only metrics are forwarded to AxoConsole.
What the install script does
When you deploy AxoRouter, you run a command that installs the required software packages, configures them and sets up the connection with Axoflow.
The installer script installs the axolet packages, then executes the configure-axolet command with the right parameters. (If the packages are already installed, the installer will update them unless the nonepackage format is selected when generating the provisioning command.)
Tests the network connection with the console endpoints.
Checks if the operating system is supported.
Checks if podman is installed.
Downloads and installs the axorouter RPM or DEB package.
The package contains the axorouter-ctl and setup-axorouter commands and the axorouter.container unit files for podman-systemd.
CAUTION:
The package uses docker and standard service units. On older systems (e.g. Ubuntu 22.04 or older) this results in the following limitations:
AxoWec, AxoStore services are not supported.
Some axorouter-ctl commands are not fully supported.
Proxy environment variables need to be added to the docker systemctl configuration manually.
Executes the setup-axorouter command, which
Updates the environment variables used by the axorouter service.
Enables and starts the AxoRouter service.
Downloads and installs the axolet RPM or DEB package.
The package contains the axolet and configure-axolet commands, and the axolet.service systemd unit file.
The configure-axolet command is executed with a configuration snippet on its standard input which contains a token required for registering into the management platform. The command:
Writes the initial /etc/axolet/config.json configuration file.
Note: if the file already exists it will only be overwritten if the Overwrite config option is enabled when generating the provisioning command.
Enables and starts the axolet service.
axolet performs the following main steps on its first execution:
Generates and persists a unique identifier (GUID).
Initiates a cryptographic handshake process to AxoConsole.
AxoConsole issues a client certificate to AxoRouter, which will be stored in the above mentioned config.json file.
The service waits for an approval on AxoConsole. Once you approve the host registration request, axolet starts to manage the local services and send telemetry data to AxoConsole. It keeps doing so as long as the agent is registered.
Prerequisites
AxoRouter should work on most Red Hat and Debian compatible Linux distributions. For production environments, we recommend using Red Hat 9.
Podman must be installed on the host (sudo yum install podman)
For a deployment that handles up to 1TB/day log traffic (~14500 EPS) even with complex routing and processing configurations, we recommend:
4 vCPU
8 GB memory
45 GB disk / hour. AxoRouter buffers incoming log data on disk if the destination or the network connection to the destination becomes unavailable. With a 1TB/day throughput, you need at least 45 GB of disk buffer per hour to avoid putting backpressure on your sources. This doesn’t include any disk for using AxoStore.
If you want to enable AxoStore on the node, you’ll need:
1TB storage for the free tier, or
the storage limit of your AxoStore subscription.
Memory and CPU requirements depend on the incoming data volume, the Config profile you want to use for your AxoStores, and the number and complexity of the queries you’ll be running.
For occasional access to the data, when you’re mostly using the storage as a data warehouse, we recommend 1:80 memory to storage ratio and 6:1 GiB of memory to number of CPU cores ratio. That is, 12GiB memory and 2 CPU cores per 1TB of storage. At least 8GiB of RAM is recommended.
If you’re running frequent analytics and several concurrent queries on the stored data, we recommend 1:60 memory to storage ratio and 4:1 GiB of memory to CPU core ratio. That is, 16GiB memory and 4 CPU cores per 1TB of storage.
The storage must be available on the volume storing the /var/lib/clickhouse folder. Alternatively, you can set a different directory to store your AxoStores using the AXOSTORE_MOUNT environment variable.
Network access
The host must be able to access the following domains related to the AxoConsole:
When using AxoConsole SaaS:
<your-tenant-id>.cloud.axoflow.io: HTTPS traffic on TCP port 443, needed to download the binaries for Axoflow software (like Axolet and AxoRouter).
kcp.<your-tenant-id>.cloud.axoflow.io: HTTPS (mutual TLS) traffic on TCP port 443 for management traffic.
telemetry.<your-tenant-id>.cloud.axoflow.io: HTTPS (mutual TLS) traffic on TCP port 443, where Axolet sends the metrics of the host.
us-docker.pkg.dev: HTTPS traffic on TCP port 443, but only if you’re forcing the installation script to pull the container images from the public repository. The Axolet and AxoRouter for Linux installation scripts download the images directly from AxoConsole.
When using an on-premise AxoConsole:
The following domains should point to AxoConsole IP address to access Axoflow from your desktop and AxoRouter hosts:
your-host.your-domain: The main domain of your AxoConsole deployment.
idp.your-host.your-domain: A subdomain for the identity provider.
kcp.your-host.your-domain: A subdomain for management traffic.
telemetry.your-host.your-domain: A subdomain for agent telemetry.
The AxoConsole host must have the following Open Ports:
Port 80 (HTTP)
Port 443 (HTTPS)
When installing Axoflow agent for Windows or Linux:
github.com: HTTPS traffic on TCP port 443, for downloading installer packages.
Install AxoRouter
Note
When using AxoRouter with an on-premises AxoConsole deployment, you have to prepare the hosts before deploying AxoRouter. These steps are specific to on-premises AxoConsole deployments, and are not needed when using the SaaS AxoConsole.
Select Routers > Add Router.
Select the platform (Linux). The one-liner installation command is displayed.
(Optional) If you don’t want to store any logs locally on AxoRouter, disable AxoStore, select Advanced options, scroll down, and deselect Enable AxoStore.
(Optional)
If needed, set the Advanced options (for example, proxy settings, or External image pull in air-gapped environments) to modify the installation parameters. Usually, you don’t have to use advanced options unless the Axoflow support team instructs you to do so.
Open a terminal on the host where you want to install AxoRouter.
Run the one-liner, then follow the on-screen instructions.
Note
Running the provisioning command with sudo would mask environment variables of the calling shell. Either start the whole procedure from a root shell, or let the install script call sudo when it needs to. In other words: don’t add the sudo command to the provisioning command.
Example output:
Do you want to install AxoRouter now? [Y]% Total % Received % Xferd Average Speed Time Time Time Current
Dload Upload Total Spent Left Speed
1005480100548000320760 --:--:-- --:--:-- --:--:-- 33414Selecting previously unselected package axorouter.
(Reading database ... 17697 files and directories currently installed.)Preparing to unpack axorouter.deb ...
Unpacking axorouter (0.66.0) ...
Setting up axorouter (0.66.0) ...
Low maximum socket receive buffer size value detected: 7500000 bytes (7.2MB).
Do you you want to permanently set the net.core.rmem_max sysctl value to 33554432 bytes (32MB) on this system? [Y]net.core.rmem_max =33554432Created symlink '/etc/systemd/system/multi-user.target.wants/axostore.path' → '/etc/systemd/system/axostore.path'.
Created symlink '/etc/systemd/system/multi-user.target.wants/axorouter-wec.path' → '/etc/systemd/system/axorouter-wec.path'.
% Total % Received % Xferd Average Speed Time Time Time Current
Dload Upload Total Spent Left Speed
100 42.9M 100 42.9M 00 28.1M 0 0:00:01 0:00:01 --:--:-- 28.2M
Selecting previously unselected package axolet.
(Reading database ... 17707 files and directories currently installed.)Preparing to unpack axolet.deb ...
Unpacking axolet (0.66.0) ...
Setting up axolet (0.66.0) ...
Created symlink '/etc/systemd/system/multi-user.target.wants/axolet.service' → '/usr/lib/systemd/system/axolet.service'.
Now continue with onboarding the host on the Axoflow web UI.
Note
If you get the following errors:
AXOROUTER_FUSE envvar is not set. It may mean that the /usr/local/bin/setup-axorouter script is called without proper configuration.
Failed to configure AxoRouter.
Failed to deploy the AxoRouter.
Set the following (or equivalent) in the sudoers file on the host, and rerun the installation command.
Reload the Provisioning page. There should be a registration request for the new AxoRouter deployment. Select ✓.
Select Register to register the host. You can add a description and labels (in label:value format) to the host.
If the primary IP address (the first IP address shown in the Network addresses section on the Routers page for each AxoRouter) is not accessible from your edge hosts, set a Network address override (IP address or an FQDN) that’s accessible. Otherwise, data forwarding from edge hosts will fail.
Select the Topology page. The new AxoRouter instance is displayed.
Run AxoRouter as non-root
By default, the install script runs AxoRouter as root. To configure it to run under a non-root user instead, see Run AxoRouter as non-root.
Create a flow
If you haven’t already done so, create a new destination. If you’ve enabled AxoStore on the node and want to send data into AxoStore, see AxoStore.
Create a flow to connect the new AxoRouter to the destination.
Select Flows.
Select Add Flow > Flow.
To create a fallback flow, select Add Flow > Fallback flow.
Enter a name for the flow, for example, my-test-flow.
In the Router Selector field, enter an expression that matches the router(s) you want to apply the flow. To select a specific router, use a name selector, for example, name = my-axorouter-hostname.
You can use any labels and metadata of the AxoRouter hosts in the Router selectors, for example, the hostname of the AxoRouter, or any custom labels.
If you leave the Router Selector field empty, the selector will match every AxoRouter instance.
To select only a specific AxoRouter instance, set the name field to the name of the instance as selector. For example, name = my-axorouter.
If you set multiple fields in the selector, the selector will match only AxoRouter instances that match all elements of the selector. (There in an AND relationship between the fields.)
Note
You can configure multiple fallback flows, but only one fallback flow can apply to an AxoRouter (so the Router Selector of the fallback flows can’t overlap).
Select the Destination where you want to send your data. If you don’t have any destination configured, you can select + Add in the destination section to create a new destination now. For details on the different destinations, see Destinations.
If you don’t have any destination configured, see Destinations.
If you’ve already created a store, it automatically available as a destination. Note that the Router Selector of the flow must match only AxoRouters that have the selected store available, otherwise you’ll get an error message.
If you want to send data to another AxoRouter, enable the Show all destinations option, and select the connector of the AxoRouter where you want to send the data.
(Optional) To process the data transferred in the flow, select Add New Processing Step. For details, see Processing steps. For example:
Add a Classify, a Parse, and a Reduce step, in that order, to automatically remove redundant and empty fields from your data.
To select which messages are processed by the flow, add a Select Messages step, and enter a filter into the AQL Expression field. For example, to select only the messages received from Fortinet FortiGate firewalls, use the meta.vendor = fortinet AND meta.product = fortigate query.
Save the processing steps.
Select Add.
The new flow appears in the Flows list.
Send logs to AxoRouter
Configure your hosts to send data to AxoRouter.
For appliances that are specifically supported by Axoflow, see Sources.
For other appliances and generic Linux devices, see Generic tips.
For a quick test without an actual source, you can also do the following (requires nc to be installed on the AxoRouter host):
Open the AxoConsole, select Topology, then select the AxoRouter instance you’ve deployed. Alternatively, select ⌘/Ctrl + K and enter the name of the AxoRouter.
This section describes how to start, stop and check the status of the AxoRouter service on Linux.
Start AxoRouter
To start AxoRouter, execute the following command. For example:
systemctl start axorouter
If the service starts successfully, no output will be displayed.
The following message indicates that AxoRouter cannot start (see Check AxoRouter status):
Job for axorouter.service failed because the control process exited with error code. See `systemctl status axorouter.service` and `journalctl -xe`for details.
To restart AxoRouter, execute the following command.
systemctl restart axorouter
Reload the configuration without restarting AxoRouter
To reload the configuration file without restarting AxoRouter, execute the following command.
systemctl reload axorouter
Check the status of AxoRouter service
To check the status of AxoRouter service
Execute the following command.
systemctl --no-pager status axorouter
Check the Active: field, which shows the status of the AxoRouter service. The following statuses are possible:
active (running) - axorouter service is up and running
inactive (dead) - axorouter service is stopped
Upgrade AxoRouter
AxoConsole raises an alert for the host when a new AxoRouter version is available. To upgrade to the new version, re-run the one-liner installation command you used to install AxoRouter, or select Provisioning > Select type and platform to create a new one.
Note that it can take a few minutes until the version numbers of the different services get updated on AxoConsole.
7.1.1.1 - Advanced installation options
When installing AxoRouter, you can set a number of advanced options if needed for your environment. Setting the advanced options in the AxoConsole automatically updates the one-liner command that you can copy and run.
Alternatively, before running the one-liner you can use one of the following methods:
Set the related environment variable for the option. For example:
exportAXO_USER=syslogng
exportAXO_GROUP=syslogng
Set the related URL parameter for the option. For example:
curl -fLsH 'X-AXO-TOKEN:random-generated''https://<your-tenant-id>.cloud.axoflow.io/setup.sh?type=AXOROUTER&platform=LINUX&user=syslogng&group=syslogng'| sh
Proxy settings
Use the HTTP proxy, HTTPS proxy, No proxy parameters to configure HTTP proxy settings for the installer. To avoid using the proxy for the Axolet service, enable the Avoid proxy parameter as well. Lowercase variable names are preferred because they work universally.
Installation options
You can pass the following parameters to the installation script as environment variables, or as URL parameters.
Note
Running the provisioning command with sudo would mask environment variables of the calling shell. Either start the whole procedure from a root shell, or let the install script call sudo when it needs to. In other words: don’t add the sudo command to the provisioning command.
External image pull
Default value:
true
Environment variable
AXO_EXTERNAL_IMAGE_PULL
URL parameter
external_image_pull
Description: If true, the installation script downloads the images from the central Axoflow repository. If false, the script downloads the images from the AxoConsole host. This is useful when deploying AxoRouters in airgapped environments.
Description: Deploy AxoRouter from a custom image repository.
Image version
Default value:
Current Axoflow version
Environment variable
AXO_IMAGE_VERSION
URL parameter
image_version
Description: Deploy the specified AxoRouter version.
Package format
Default value:
auto
Available values:
auto, dep, rpm, tar, none
Environment variable
AXO_INSTALL_PACKAGE
URL parameter
install_package
Description: File format of the installer package.
Start router
Default value:
true
Available values:
true, false
Environment variable
AXO_START_ROUTER
URL parameter
start_router
Description: Start AxoRouter after installation.
Axolet parameters
API server host
Default value:
Environment variable
URL parameter
api_server_host
Description: Override the host part of the API endpoint for the host.
Avoid proxy
Default value:
false
Available values:
true, false
Environment variable
AXO_AVOID_PROXY
URL parameter
avoid_proxy
Description: If set to true, the value of the *_proxy variables will only be used for downloading the installer, but not for the axolet service itself. If set to false, the Axolet service will use the variables from the installer.
Axolet capabilities
Default value:
CAP_SYS_PTRACE CAP_SYS_CHROOT
Available values:
Whitespace-separated list of capability names with CAP_ prefix.
Environment variable
AXO_CAPS
URL parameter
caps
Description: Ambient Linux capabilities the axolet service will use.
Configuration directory
Default value:
/etc/axolet
Environment variable
AXO_CONFIG_DIR
URL parameter
config_dir
Description: The directory where the configuration files are stored.
HTTP proxy
Default value:
empty string
Environment variable
AXO_HTTP_PROXY
URL parameter
http_proxy
Description: Use a proxy to access AxoConsole from the host.
HTTPS proxy
Default value:
empty string
Environment variable
AXO_HTTPS_PROXY
URL parameter
https_proxy
Description: Use a proxy to access AxoConsole from the host.
Initial labels
Default value:
‘product=axorouter,vendor=axoflow’
Environment variable
AXO_INITIAL_LABELS
URL parameter
initial_labels
Description: Comma-separated list of key=value labels. These labels will be suggested for the host when you add the source to AxoConsole. For example, product=windows,team=windows,vendor=microsoft
No proxy
Default value:
empty string
Environment variable
AXO_NO_PROXY
URL parameter
no_proxy
Description: Comma-separated list of hosts that shouldn’t use proxy to access AxoConsole from the host.
Overwrite config
Default value:
false
Available values:
true, false
Environment variable
AXO_CONFIG_OVERWRITE
URL parameter
config_overwrite
Description: If set to true, the configuration process will overwrite existing configuration (/etc/axolet/config.json). This means that the agent will get a new GUID and it will require approval on the AxoConsole.
Service group
Default value:
root
Environment variable
AXO_GROUP
URL parameter
group
Description: Name of the group and Axolet will be running as. It should be either root or the group syslog-ng is running as.
Service user
Default value:
root
Environment variable
AXO_USER
URL parameter
user
Description: Name of the user Axolet will be running as. It should be either root or the user syslog-ng is running as. See also Run axolet as non-root.
Start service
Default value:
true
Available values:
true, false
Environment variable
AXO_START
URL parameter
start
Description: Start axolet agent at the end of installation. Use false for preparing golden images. In this case axolet will generate a new GUID on the first boot after cloning the image.
WEC parameters
These parameters are related to the Windows Event Collector server that can be run on AxoRouter. For details, see Windows Event Collector (WEC).
Description: Deploy the axorouter-resolver from a custom image repository.
axorouter-resolver image version
Default value:
Current Axoflow version
Environment variable
AXORESOLVER_IMAGE_VERSION
URL parameter
axoresolver_image_version
Description: Deploy the specified axorouter-resolver version.
axorouter-resolver persistence directory
Default value:
${AXOROUTER_PERSIST_MOUNT}/axoresolver
Environment variable
AXORESOLVER_PERSIST_DIR
URL parameter
Description: Directory where axorouter-resolver stores persistent data.
axorouter-resolver configuration directory
Default value:
/etc/axorouter/axoresolver
Environment variable
AXORESOLVER_CONFIG_DIR
URL parameter
Description: Directory where axorouter-resolver configuration files are stored.
axorouter-resolver environment file
Default value:
/etc/axorouter/axoresolver.env
Environment variable
AXORESOLVER_ENV_FILE
URL parameter
Description: Path to the axorouter-resolver environment file.
axorouter-resolver configuration file
Default value:
${AXORESOLVER_CONFIG_DIR}/resolvers.json
Environment variable
AXORESOLVER_CONFIG_FILE
URL parameter
Description: Path to the axorouter-resolver configuration file.
axorouter-resolver socket path
Default value:
${AXORESOLVER_PERSIST_DIR}/axoresolver.sock
Environment variable
AXORESOLVER_SOCKET_PATH
URL parameter
Description: Path to the axorouter-resolver socket file.
axorouter-resolver cache file
Default value:
${AXORESOLVER_PERSIST_DIR}/axoresolver-cache.json
Environment variable
AXORESOLVER_CACHE_FILE
URL parameter
Description: Path to the axorouter-resolver cache file.
axorouter-resolver cache write interval
Default value:
10
Environment variable
AXORESOLVER_CACHE_WRITE_INTERVAL
URL parameter
Description: Interval for writing the cache to disk. If you don’t specify the unit, it’s treated as seconds: 10 is the same as 10s. You can use other units as well, for example, m for minutes.
axorouter-resolver log level
Default value:
INFO
Environment variable
AXORESOLVER_LOG_LEVEL
URL parameter
Description: Log level for axorouter-resolver.
AxoStore parameters
These parameters are related to the AxoStore that can be run on AxoRouter. For details, see Storage.
AxoStore enable
Default value:
true
Available values:
true, false
Environment variable
AXO_AXOSTORE_ENABLED
URL parameter
axostore_enabled
Description: Install AxoStore for this AxoRouter deployment.
Description: Deploy the AxoStore from a custom image repository.
AxoStore Image version
Default value:
Current Axoflow version
Environment variable
AXO_AXOSTORE_IMAGE_VERSION
URL parameter
axostore_image_version
Description: Deploy the specified AxoStore version.
AxoStore storage directory
Default value:
/var/lib/clickhouse
Environment variable
AXOSTORE_MOUNT
URL parameter
N/A
Description: The directory where the AxoStores are stored. Make sure that there’s sufficient disk space, especially for long-time retention and/or high data volume.
7.1.1.2 - Run AxoRouter as non-root
To run AxoRouter as a non-root user, set the AXO_USER and AXO_GROUP environment variables to the user’s username and groupname on the host you want to deploy AxoRouter. For details, see Advanced installation options.
Operators must have access to the following commands:
/usr/bin/systemctl * axolet.service: Controls the axolet.service systemd unit. Usually * is start, stop, restart, enable, and status. Used by the operators for troubleshooting.
/usr/local/bin/configure-axolet: Creates initial axolet configuration and enables/starts the axolet service. Executed by the bootstrap script.
Command to install and upgrade the axolet package. Executed by the bootstrap script if the packages aren’t already installed.
On RPM-based Linux distributions: /usr/bin/rpm -Uv axo*.rpm
On DEB-based Linux distributions: /usr/bin/dpkg -i axo*.deb
/usr/bin/systemctl * axorouter.service: Controls the axorouter.service systemd unit. Usually * is start, stop, restart, enable, and status. Used by the operators for troubleshooting.
/usr/local/bin/configure-axorouter: Creates the initial axorouter configuration and enables/starts the axorouter service. Executed by the bootstrap script.
Command to install and upgrade the axorouter and the axolet package. Executed by the bootstrap script if the packages aren’t already installed.
On RPM-based Linux distributions: /usr/bin/rpm -Uv axo*.rpm
On DEB-based Linux distributions: /usr/bin/dpkg -i axo*.deb
You can permit the syslogng user to run these commands by running on of the following:
To install AxoRouter on a Kubernetes cluster, complete the following steps. For other platforms, see AxoRouter.
Note
Note that AxoRouter and Axoflow agent collects detailed, real-time metrics about the data-flows – giving you observability over the health of the security data pipeline and its components. Your security data remains in your self-managed cloud or in your on-prem instance where your sources, destinations, Axoflow agents, and AxoRouters are running, only metrics are forwarded to AxoConsole.
Prerequisites
Kubernetes version 1.29 and newer
Resource requirements
For a deployment that handles up to 1TB/day log traffic (~14500 EPS) even with complex routing and processing configurations, we recommend:
4 vCPU
8 GB memory
45 GB disk / hour. AxoRouter buffers incoming log data on disk if the destination or the network connection to the destination becomes unavailable. With a 1TB/day throughput, you need at least 45 GB of disk buffer per hour to avoid putting backpressure on your sources. This doesn’t include any disk for using AxoStore.
The host must be able to access the following domains related to the AxoConsole:
When using AxoConsole SaaS:
<your-tenant-id>.cloud.axoflow.io: HTTPS traffic on TCP port 443, needed to download the binaries for Axoflow software (like Axolet and AxoRouter).
kcp.<your-tenant-id>.cloud.axoflow.io: HTTPS (mutual TLS) traffic on TCP port 443 for management traffic.
telemetry.<your-tenant-id>.cloud.axoflow.io: HTTPS (mutual TLS) traffic on TCP port 443, where Axolet sends the metrics of the host.
us-docker.pkg.dev: HTTPS traffic on TCP port 443, but only if you’re forcing the installation script to pull the container images from the public repository. The Axolet and AxoRouter for Linux installation scripts download the images directly from AxoConsole.
When using an on-premise AxoConsole:
The following domains should point to AxoConsole IP address to access Axoflow from your desktop and AxoRouter hosts:
your-host.your-domain: The main domain of your AxoConsole deployment.
idp.your-host.your-domain: A subdomain for the identity provider.
kcp.your-host.your-domain: A subdomain for management traffic.
telemetry.your-host.your-domain: A subdomain for agent telemetry.
The AxoConsole host must have the following Open Ports:
Port 80 (HTTP)
Port 443 (HTTPS)
When installing Axoflow agent for Windows or Linux:
github.com: HTTPS traffic on TCP port 443, for downloading installer packages.
Install AxoRouter
Open the AxoConsole.
Select Provisioning.
Select the Host type > AxoRouter > Kubernetes. The one-liner installation command is displayed.
Open a terminal and set your Kubernetes context to the cluster where you want to install AxoRouter.
Run the one-liner, and follow the on-screen instructions.
Current kubernetes context: minikube
Server Version: v1.28.3
Installing to new namespace: axorouter
Do you want to install AxoRouter now? [Y]
Register the host.
Reload the Provisioning page. There should be a registration request for the new AxoRouter deployment. Select ✓.
Select Register to register the host. You can add a description and labels (in label:value format) to the host.
If the primary IP address (the first IP address shown in the Network addresses section on the Routers page for each AxoRouter) is not accessible from your edge hosts, set a Network address override (IP address or an FQDN) that’s accessible. Otherwise, data forwarding from edge hosts will fail.
Select the Topology page. The new AxoRouter instance is displayed.
Create a flow
If you haven’t already done so, create a new destination.
Create a flow to connect the new AxoRouter to the destination.
Select Flows.
Select Add Flow > Flow.
To create a fallback flow, select Add Flow > Fallback flow.
Enter a name for the flow, for example, my-test-flow.
In the Router Selector field, enter an expression that matches the router(s) you want to apply the flow. To select a specific router, use a name selector, for example, name = my-axorouter-hostname.
You can use any labels and metadata of the AxoRouter hosts in the Router selectors, for example, the hostname of the AxoRouter, or any custom labels.
If you leave the Router Selector field empty, the selector will match every AxoRouter instance.
To select only a specific AxoRouter instance, set the name field to the name of the instance as selector. For example, name = my-axorouter.
If you set multiple fields in the selector, the selector will match only AxoRouter instances that match all elements of the selector. (There in an AND relationship between the fields.)
Note
You can configure multiple fallback flows, but only one fallback flow can apply to an AxoRouter (so the Router Selector of the fallback flows can’t overlap).
Select the Destination where you want to send your data. If you don’t have any destination configured, you can select + Add in the destination section to create a new destination now. For details on the different destinations, see Destinations.
If you don’t have any destination configured, see Destinations.
If you’ve already created a store, it automatically available as a destination. Note that the Router Selector of the flow must match only AxoRouters that have the selected store available, otherwise you’ll get an error message.
If you want to send data to another AxoRouter, enable the Show all destinations option, and select the connector of the AxoRouter where you want to send the data.
(Optional) To process the data transferred in the flow, select Add New Processing Step. For details, see Processing steps. For example:
Add a Classify, a Parse, and a Reduce step, in that order, to automatically remove redundant and empty fields from your data.
To select which messages are processed by the flow, add a Select Messages step, and enter a filter into the AQL Expression field. For example, to select only the messages received from Fortinet FortiGate firewalls, use the meta.vendor = fortinet AND meta.product = fortigate query.
Save the processing steps.
Select Add.
The new flow appears in the Flows list.
Send logs to AxoRouter
By default, AxoRouter accepts data on the following ports (unless you’ve modified the default connector rules):
514 UDP and TCP for RFC3164 (BSD-syslog) and RFC5424 (IETF-syslog) formatted traffic. AxoRouter automatically recognizes and handles both formats.
601 TCP for RFC5424 (IETF-syslog) and RFC3164 (BSD-syslog) formatted traffic. AxoRouter automatically recognizes and handles both formats.
6514 TCP for TLS-encrypted syslog traffic.
4317 TCP for OpenTelemetry log data.
To receive data on other ports or other protocols, configure other connector rules for the AxoRouter host.
For TLS-encrypted syslog connections, create a new connector rule or edit an existing one, and configure the keys and certificates needed to encrypt the connections. For details, see Syslog.
Note
Make sure to enable the ports you’re using on the firewall of your host.
Upgrade AxoRouter
AxoConsole raises an alert for the host when a new AxoRouter version is available. To upgrade to the new version, re-run the one-liner installation command you used to install AxoRouter, or select Provisioning > Select type and platform to create a new one.
Note that it can take a few minutes until the version numbers of the different services get updated on AxoConsole.
7.1.2.1 - Advanced installation options
When installing AxoRouter, you can set a number of advanced options if needed for your environment. Setting the advanced options in the AxoConsole automatically updates the one-liner command that you can copy and run.
Alternatively, before running the one-liner you can use one of the following methods:
Set the related environment variable for the option. For example:
Set the related URL parameter for the option. For example:
curl -fLsH 'X-AXO-TOKEN:random-generated''https://<your-tenant-id>.cloud.axoflow.io/setup.sh?type=AXOROUTER&platform=K8S¶meter=value'| sh
Proxy settings
Use the http_proxy=, https_proxy=, no_proxy= parameters to configure HTTP proxy settings for the installer. To configure the Axolet service to use the proxy settings, enable the AXOLET_AVOID_PROXY parameter as well. Lowercase variable names are preferred because they work universally.
Installation options
You can pass the following parameters to the installation script as environment variables, or as URL parameters.
Note
Running the provisioning command with sudo would mask environment variables of the calling shell. Either start the whole procedure from a root shell, or let the install script call sudo when it needs to. In other words: don’t add the sudo command to the provisioning command.
AxoRouter image override
Default value:
empty string
Environment variable
IMAGE
URL parameter
image
Description: Deploy the specified AxoRouter image.
Description: Deploy Axolet from a custom image repository.
Axolet image version
Default value:
Current Axoflow version
Environment variable
AXOLET_IMAGE_VERSION
URL parameter
axolet_image_version
Description: Deploy the specified Axolet version.
Initial GUID
Default value:
Environment variable
URL parameter
initial_guid
Description: Set a static GUID.
7.1.3 - Install multiple AxoRouters in high availability mode
Deploy multiple AxoRouter hosts as a high availability cluster using keepalived to manage a shared virtual IP, so sources keep reaching AxoRouter through host failures.
This guide describes how to deploy multiple AxoRouter hosts as a high availability cluster with keepalived managing a shared virtual IP across the hosts. For an overview of other approaches, see AxoRouter high availability.
The examples in this guide deploy AxoRouter on AlmaLinux 10, but the procedure also works on other supported platforms.
The hosts running AxoRouter can be physical or virtual machines. The recommended layout depends on which you choose:
Physical machines: Install two machines with a dedicated HA link between them to keep the HA traffic separate from the production traffic.
Virtual machines: Set up three VMs with a dedicated (and guaranteed bandwidth) HA link (HA VLAN) spanning across them, to keep the HA traffic separate from the production traffic.
Note
A cluster targeting highly reliable services should ideally consist of at least three nodes to avoid split-brain situations. In a split-brain situation, both nodes think that they are the last surviving node (for example, during a network failure) and bring up their services, leading to several problems.
The setups described here use fewer than the ideal number of nodes for cost reasons. Dedicated HA links provide an additional channel for HA communication independently of the production traffic, and significantly reduce the risk of split-brain scenarios.
At a high level, setting up the cluster involves the following steps:
Prepare every cluster host: deploy AxoRouter, install keepalived, and configure SELinux to let keepalived query the AxoRouter service status.
Configure SELinux so keepalived can monitor the status of AxoRouter. For that, create and load a SELinux policy module that allows keepalived to run the systemctl status command.
Install the selinux-policy-devel package:
sudo dnf install selinux-policy-devel
Create a policy module file.
cat > keepalived-allow-systemctl-status.te <<EOF

module keepalived-allow-systemctl-status 1.0;

require {
        type keepalived_t;
        type syslogd_var_run_t;
        type systemd_systemctl_exec_t;
        type systemd_generator_unit_file_t;
        class file { execute execute_no_trans getattr map open read setattr };
        class dir read;
        class service status;
}

#============= keepalived_t ==============
allow keepalived_t syslogd_var_run_t:dir read;

#!!!! This avc can be allowed using the boolean 'domain_can_mmap_files'
allow keepalived_t systemd_systemctl_exec_t:file { execute execute_no_trans getattr open read setattr };

#!!!! This avc can be allowed using the boolean 'domain_can_mmap_files'
allow keepalived_t systemd_systemctl_exec_t:file map;

allow keepalived_t systemd_generator_unit_file_t:service status;
EOF
Set up the keepalived configuration on the primary node. See the list of main configuration elements after the command.
sudo mv /etc/keepalived/keepalived.conf{,.old} -v
sudo cat > /etc/keepalived/keepalived.conf <<EOF

vrrp_script check_axorouter {
    script  "/usr/bin/systemctl status axorouter"
    interval 5
    timeout  2
    rise     5
    fall     2
    user     root
}

vrrp_instance axorouter_vip {
    state MASTER
    interface enp0s8
    virtual_router_id 51
    priority 254
    advert_int 1
    unicast_src_ip 192.168.56.10
    unicast_peer {
        192.168.56.11
    }
    authentication {
        auth_type PASS
        auth_pass Ax0R0ut3r
    }
    virtual_ipaddress {
        192.168.10.64/25 dev enp0s9
    }
    track_script {
        check_axorouter
    }
    track_interface {
        enp0s9                      # Fail over if public interface dies
        enp0s8                      # Fail over if dedicated HA interface dies
    }
}
EOF
The main configuration elements are:
state: The default state of the node.
interface: The interface keepalived is listening on (in this case the HA interface).
virtual_router_id: This ID should match across the nodes belonging to the same cluster.
priority: An assigned value belonging to the cluster node. During an election, the node with the highest priority wins. The maximum value is 254.
unicast_src_ip: The source IP address keepalived sends its advertisements with (in this case on the HA interface).
unicast_peer: IP addresses of the other cluster nodes (in this case the IP addresses on their respective HA interfaces).
auth_pass: The password can have any value. Maximum length is 8 characters; longer values are truncated. All members of the cluster must have the same value.
virtual_ipaddress: The virtual IP address and the interface it should be configured on (the interface facing the data sources).
track_script: A shell script that can be used to verify the status of the service.
track_interface: A list of network interfaces the status of which keepalived should monitor (the interface keepalived is listening on is in this list by default).
Enable inbound traffic on port 112/TCP on the host’s firewall.
After this, you should have a functional virtual/service IP address so the virtual IP moves to another AxoRouter host if the active one fails.
7.2 - AxoSyslog
Onboarding allows you to collect metrics about the host, display the host on the Topology page, and to tap into the log flow.
Onboarding requires you to modify the host and the configuration of the logging agent (AxoSyslog) running on the host.
Level 1: Install Axolet on the host where AxoSyslog is running. Axolet collects metrics from the host and sends them to the AxoConsole, so you can check host-level metrics on the Metrics & Health page of the host, and displays the host on the Topology page.
Level 2: Instrument the configuration of the logging agent to provide detailed metrics about the traffic flow. This allows you to display data about the host on the Analytics page.
The AxoSyslog host is now visible on the Topology page of the AxoConsole as a source.
Access the AxoSyslog host and edit the configuration of AxoSyslog. Set the statistics-related global options like this (if the options block already exists, add these lines to the bottom of the block):
options { stats( level(2) freq(0)# Inhibit statistics output to stdout);};
(Optional) To get detailed metrics and analytics about the traffic that flows through the host, instrument your AxoSyslog configuration as follows:
Note
You can use Axolet with an un-instrumented AxoSyslog configuration file, but that limits available metrics to host statistics (for example, disk, memory, queue information). You won’t be able to access data about the actual traffic flowing through the host. To collect traffic-related metrics, instrument configuration with metrics-probe() stanzas. The example below shows how to instrument the configuration to highlight common macros such as $HOST and $PROTOCOL. If you want to customize the collected metrics or need help with the instrumentation, contact us.
Download the following configuration snippet to the AxoSyslog host, for example, as /etc/syslog-ng/conf.d/axoflow-instrumentation.conf for AxoSyslog.
# Metrics probe parser definition for a specified destination# This will yield a reasonable number of metrics for common# syslog-ng macrosblock parser metrics-output(destination(undefined)){# This will probe for the number of *events*.# key name is fixed; labels are user-specified metrics-probe( key("classified_output_events_total") labels("host"=> "${HOST}""service"=> "${PROGRAM}""source"=> "${SOURCE}""dest_port"=> "$DESTPORT""dest_ip"=> "$DESTIP""src_ip"=> "$SOURCEIP""protocol"=> "$(if($PROTO== 6) TCP $(if($PROTO== 17) UDP $PROTO))""ip_protocol"=> "$IP_PROTO""transport"=> "$TRANSPORT""destination_name"=> "`destination`""issue"=> "$(or $(tags-head message.parse_error syslog.unexpected_framing syslog.missing_pri syslog.rfc3164_missing_header syslog.invalid_hostname message.utf8_sanitized)'none')"));# This will probe for the number of *bytes*.# key name is fixed; labels are user-specified metrics-probe( key("classified_output_event_bytes_total") increment("${RAWMSG_SIZE}") labels("host"=> "${HOST}""service"=> "${PROGRAM}""source"=> "${SOURCE}""dest_port"=> "$DESTPORT""dest_ip"=> "$DESTIP""src_ip"=> "$SOURCEIP""protocol"=> "$(if($PROTO== 6) TCP $(if($PROTO== 17) UDP $PROTO))""ip_protocol"=> "$IP_PROTO""transport"=> "$TRANSPORT""destination_name"=> "`destination`""issue"=> "$(or $(tags-head message.parse_error syslog.unexpected_framing syslog.missing_pri syslog.rfc3164_missing_header syslog.invalid_hostname message.utf8_sanitized)'none')"));};@define AXOTAP_SOCK "/var/lib/syslog-ng/axotap.sock"destination "d_axotap"{ channel { filter { rate-limit(key("$SOURCE:$PROGRAM:$HOST:$SOURCEIP:$DESTIP") rate(1));}; rewrite { set("$(substr ${MESSAGE}0 32768)" value(MESSAGE)); set("$(substr ${RAWMSG}0 32768)" value(RAWMSG)); set("$(format-json debug.msg=$(format-json --scope all-nv-pairs) log.body=${MESSAGE})" value(".tap.event")); set('{"note":"message object too long for tapping"}' value(".tap.event") condition("$(length ${.tap.event})" > 131072)); set("$(format-json tap=$(format-json tapId=''eventId=${UNIQID}labels=$(format-json)hostCandidate=$(format-json)facility=${FACILITY}format=${MSGFORMAT}hostFrom=${HOST_FROM}message=$(echo${MESSAGE})rawMessage=${RAWMSG}severity=${SEVERITY}source=${SOURCE}tags=${TAGS}timestamp=${ISODATE}transport=${TRANSPORT})event=json(${.tap.event}))" value(".tap.formatted"));}; destination { unix-dgram("`AXOTAP_SOCK`" template("${.tap.formatted}"));};};};
Include it in at the top of your configuration file:
@version: current
@include "axoflow-instrumentation.conf"
Edit every destination statement to include a parser { metrics-output(destination(my-destination)); }; line (making sure to include the channel construct if your destination block does not already contain it):
To enable log tapping for the traffic that flows through the host, add the d_axotap destination in your log paths. This allows the Axolet agent to collect rate-limited log samples from that specific point in the pipeline.
Note
There are multiple ways to add tapping to your configuration, which in some cases can introduce unwanted side effects. Contact us to help you create a safe tapping configuration for your use case!
Find a log path that you want to tap into and add the tap destination in a safe way, for example, by adding it in a separate inner log path:
If AxoSyslog is sending data to an AxoRouter, create a placeholder data forwarding rule where the Edge Selector matches AxoSyslog and the Router connector is the connector of the AxoRouter instance where AxoSyslog is sending the data. This is needed to display AxoSyslog and its data metrics on the Topology page, AxoConsole won’t manage AxoSyslog.
7.3 - Splunk Connect for Syslog (SC4S)
Onboarding allows you to collect metrics about the host, display the host on the Topology page, and to tap into the log flow.
Onboarding requires you to modify the host and the configuration of the logging agent (SC4S) running on the host.
Level 1: Install Axolet on the host where SC4S is running. Axolet collects metrics from the host and sends them to the AxoConsole, so you can check host-level metrics on the Metrics & Health page of the host, and displays the host on the Topology page.
Level 2: Instrument the configuration of the logging agent to provide detailed metrics about the traffic flow. This allows you to display data about the host on the Analytics page.
To generate metrics for the Axoflow platform from an existing Splunk Connect for Syslog (SC4S) instance, you need to configure SC4S to generate these metrics. Complete the following steps.
If you haven’t already done so, install Axolet on the host, then approve its registration on the Provisioning page of the AxoConsole.
Download the following code snippet as axoflow-instrumentation.conf.
If you are running SC4S under podman or docker, copy the file into the /opt/sc4s/local/config/destinations directory. In other deployment methods this might be different, check the SC4S documentation for details.
Check if the metrics are appearing, for example, run the following command on the SC4S host:
syslog-ng-ctl stats prometheus | grep classified
If SC4S is sending data to an AxoRouter, create a placeholder data forwarding rule where the Edge Selector matches SC4S and the Router connector is the connector of the AxoRouter instance where SC4S is sending the data. This is needed to display SC4S and its data metrics on the Topology page, AxoConsole won’t manage SC4S.
7.4 - syslog-ng
Onboarding allows you to collect metrics about the host, display the host on the Topology page, and to tap into the log flow.
Onboarding requires you to modify the host and the configuration of the logging agent (syslog-ng) running on the host.
Level 1: Install Axolet on the host where syslog-ng is running. Axolet collects metrics from the host and sends them to the AxoConsole, so you can check host-level metrics on the Metrics & Health page of the host, and displays the host on the Topology page.
Level 2: Instrument the configuration of the logging agent to provide detailed metrics about the traffic flow. This allows you to display data about the host on the Analytics page.
For syslog-ng PE, version 7.0.33 or newer is required. Note that the 7.0.x product line needs a different configuration snippet than the 8.1.x product line.
For syslog-ng OSE, version 4.1.1 or newer is required, but we recommend using AxoSyslog instead (at least syslog-ng OSE version 4.5.0).
Provision syslog-ng
To onboard an existing syslog-ng instance into Axoflow, complete the following steps.
The syslog-ng host will now be visible on the Topology page of the AxoConsole as a source.
If you've already added the AxoRouter instance or other destination where this newly-registered host is sending data to the AxoConsole, add a path to connect the host to the AxoRouter or the destination.
Select Topology > Add Item > Path.
Select the target router or aggregator this source is sending its data to in the Target host field, for example, axorouter.
Select the Target connector. The connector determines how the destination receives the data (for example, using which protocol or port).
Select Add. The new path appears on the Topology page.
Access the syslog-ng host and edit the configuration of syslog-ng. Set the statistics-related global options like this (if the options block already exists, add these lines to the bottom of the block):
options { stats-level(2); stats-freq(0);# Inhibit statistics output to stdout};
(Optional) To get detailed metrics and analytics about the traffic that flows through the host, instrument your syslog-ng configuration as follows:
Note
You can use Axolet with an un-instrumented syslog-ng configuration file, but that limits available metrics to host statistics (for example, disk, memory, queue information). You won’t be able to access data about the actual traffic flowing through the host. To collect traffic-related metrics, instrument configuration with metrics-probe() stanzas. The example below shows how to instrument the configuration to highlight common macros such as $HOST and $PROTOCOL. If you want to customize the collected metrics or need help with the instrumentation, contact us.
Download the following configuration snippet to the syslog-ng host, for example, as /etc/syslog-ng/conf.d/axoflow-instrumentation.conf for syslog-ng.
For syslog-ng PE, use /opt/syslog-ng/etc/axoflow-instrumentation.conf.
For syslog-ng PE 8.x and newer:
# Metrics probe parser definition for a specified destination# This will yield a reasonable number of metrics for common# syslog-ng macrosblock parser metrics-output(destination(undefined)){# This will probe for the number of *events*.# key name is fixed; labels are user-specified metrics-probe( key("classified_output_events_total") labels("host"=> "${HOST}""service"=> "${PROGRAM}""source"=> "${SOURCE}""dest_port"=> "$DESTPORT""dest_ip"=> "$DESTIP""src_ip"=> "$SOURCEIP""protocol"=> "$(if($PROTO== 6) TCP $(if($PROTO== 17) UDP $PROTO))""ip_protocol"=> "$IP_PROTO""transport"=> "$TRANSPORT""destination_name"=> "`destination`""issue"=> "$(or $(tags-head message.parse_error syslog.unexpected_framing syslog.missing_pri syslog.rfc3164_missing_header syslog.invalid_hostname message.utf8_sanitized)'none')"));# This will probe for the number of *bytes*.# key name is fixed; labels are user-specified metrics-probe( key("classified_output_event_bytes_total") increment("${RAWMSG_SIZE}") labels("host"=> "${HOST}""service"=> "${PROGRAM}""source"=> "${SOURCE}""dest_port"=> "$DESTPORT""dest_ip"=> "$DESTIP""src_ip"=> "$SOURCEIP""protocol"=> "$(if($PROTO== 6) TCP $(if($PROTO== 17) UDP $PROTO))""ip_protocol"=> "$IP_PROTO""transport"=> "$TRANSPORT""destination_name"=> "`destination`""issue"=> "$(or $(tags-head message.parse_error syslog.unexpected_framing syslog.missing_pri syslog.rfc3164_missing_header syslog.invalid_hostname message.utf8_sanitized)'none')"));};# For syslog-ng OSE this should be /var/lib/syslog-ng/axotap.sock@define AXOTAP_SOCK "/opt/syslog-ng/var/axotap.sock"destination "d_axotap"{ channel { filter { rate-limit(key("$SOURCE:$PROGRAM:$HOST:$SOURCEIP:$DESTIP") rate(1));}; rewrite { set("$(substr ${MESSAGE}0 32768)" value(MESSAGE)); set("$(substr ${RAWMSG}0 32768)" value(RAWMSG)); set("$(format-json debug.msg=$(format-json --scope all-nv-pairs) log.body=${MESSAGE})" value(".tap.event")); set('{"note":"message object too long for tapping"}' value(".tap.event") condition("$(length ${.tap.event})" > 131072)); set("$(format-json tap=$(format-json tapId=''eventId=${UNIQID}labels=$(format-json)hostCandidate=$(format-json)facility=${FACILITY}format=${MSGFORMAT}hostFrom=${HOST_FROM}message=$(echo${MESSAGE})rawMessage=${RAWMSG}severity=${SEVERITY}source=${SOURCE}tags=${TAGS}timestamp=${ISODATE}transport=${TRANSPORT})event=json(${.tap.event}))" value(".tap.formatted"));}; destination { unix-dgram("`AXOTAP_SOCK`" template("${.tap.formatted}"));};};};
For syslog-ng PE 7.0.33 and newer 7.0.x, and syslog-ng OSE version 4.1.1-4.4.0:
# Metrics probe parser definition for a specified destination# This will yield a reasonable number of metrics for common# syslog-ng macrosblock parser metrics-output(destination(undefined)){# This will probe for the number of *events*.# key name is fixed; labels are user-specified metrics-probe( key("classified_output_events_total") labels("host"=> "${HOST}""service"=> "${PROGRAM}""source"=> "${SOURCE}""dest_port"=> "$DESTPORT""dest_ip"=> "$DESTIP""src_ip"=> "$SOURCEIP""protocol"=> "$(if($PROTO== 6) TCP $(if($PROTO== 17) UDP $PROTO))""ip_protocol"=> "$IP_PROTO""transport"=> "$TRANSPORT""destination_name"=> "`destination`""issue"=> "$(or $(tags-head message.parse_error syslog.unexpected_framing syslog.missing_pri syslog.rfc3164_missing_header syslog.invalid_hostname message.utf8_sanitized)'none')"));# This will probe for the number of *bytes*.# key name is fixed; labels are user-specified metrics-probe( key("classified_output_event_bytes_total") increment("${RAWMSG_SIZE}") labels("host"=> "${HOST}""service"=> "${PROGRAM}""source"=> "${SOURCE}""dest_port"=> "$DESTPORT""dest_ip"=> "$DESTIP""src_ip"=> "$SOURCEIP""protocol"=> "$(if($PROTO== 6) TCP $(if($PROTO== 17) UDP $PROTO))""ip_protocol"=> "$IP_PROTO""transport"=> "$TRANSPORT""destination_name"=> "`destination`""issue"=> "$(or $(tags-head message.parse_error syslog.unexpected_framing syslog.missing_pri syslog.rfc3164_missing_header syslog.invalid_hostname message.utf8_sanitized)'none')"));};# For syslog-ng OSE this should be /var/lib/syslog-ng/axotap.sock@define AXOTAP_SOCK "/opt/syslog-ng/var/axotap.sock"destination "d_axotap"{ channel { filter { rate-limit(template("$SOURCE:$PROGRAM:$HOST:$SOURCEIP:$DESTIP") rate(1));}; rewrite { set("$(substr ${MESSAGE}0 32768)" value(MESSAGE)); set("$(substr ${RAWMSG}0 32768)" value(RAWMSG)); set("$(format-json debug.msg=$(format-json --scope all-nv-pairs) log.body=${MESSAGE})" value(".tap.event")); set('{"note":"message object too long for tapping"}' value(".tap.event") condition("$(length ${.tap.event})" > 131072)); set("$(format-json tap=$(format-json tapId=''eventId=${UNIQID}labels=$(format-json)hostCandidate=$(format-json)facility=${FACILITY}format=${MSGFORMAT}hostFrom=${HOST_FROM}message=$(echo${MESSAGE})rawMessage=${RAWMSG}severity=${SEVERITY}source=${SOURCE}tags=${TAGS}timestamp=${ISODATE}transport=${TRANSPORT})event=json(${.tap.event}))" value(".tap.formatted"));}; destination { unix-dgram("`AXOTAP_SOCK`" template("${.tap.formatted}"));};};};
Include it in at the top of your configuration file:
@version: current
@include "axoflow-instrumentation.conf"
Edit every destination statement to include a parser { metrics-output(destination(my-destination)); }; line (making sure to include the channel construct if your destination block does not already contain it):
To enable log tapping for the traffic that flows through the host, add the d_axotap destination in your log paths. This allows the Axolet agent to collect rate-limited log samples from that specific point in the pipeline.
Note
There are multiple ways to add tapping to your configuration, which in some cases can introduce unwanted side effects. Contact us to help you create a safe tapping configuration for your use case!
Find a log path that you want to tap into and add the tap destination in a safe way, for example, by adding it in a separate inner log path:
If syslog-ng is sending data to an AxoRouter, create a placeholder data forwarding rule where the Edge Selector matches syslog-ng and the Router connector is the connector of the AxoRouter instance where syslog-ng is sending the data. This is needed to display syslog-ng and its data metrics on the Topology page, AxoConsole won’t manage syslog-ng.
7.5 - Axolet
Axolet is the agent software for Axoflow. Its primary purpose is to discover the log collector services that are running on the host (for example, AxoSyslog or SC4S), and report their operating statistics (counters) to Axoflow.
7.5.1 - Install Axolet
Axolet is the agent software for Axoflow. Its primary purpose is to discover the log collector services that are running on the host (for example, AxoSyslog or SC4S), and report their operating statistics (counters) to Axoflow.
It is simple to install Axolet on individual hosts, or collectively via orchestration tools such as chef or puppet.
What the install script does
When you deploy Axolet, you run a command that installs the required software packages, configures them and sets up the connection with Axoflow.
The installer script installs the axolet packages, then executes the configure-axolet command with the right parameters. (If the packages are already installed, the installer will update them unless the nonepackage format is selected when generating the provisioning command.)
Tests the network connection with the console endpoints.
Checks if the operating system is supported.
Downloads and installs the axolet RPM or DEB package.
The package contains the axolet and configure-axolet commands, and the axolet.service systemd unit file.
The configure-axolet command is executed with a configuration snippet on its standard input which contains a token required for registering into the management platform. The command:
Writes the initial /etc/axolet/config.json configuration file.
Note: if the file already exists it will only be overwritten if the Overwrite config option is enabled when generating the provisioning command.
Enables and starts the axolet service.
axolet performs the following main steps on its first execution:
Generates and persists a unique identifier (GUID).
Initiates a cryptographic handshake process to AxoConsole.
AxoConsole issues a client certificate to Axolet, which will be stored in the above mentioned config.json file.
The service waits for an approval on AxoConsole. Once you approve the host registration request, axolet starts to send telemetry data to AxoConsole. It keeps doing so as long as the agent is registered.
Prerequisites
Axolet should work on most Red Hat and Debian compatible Linux distributions. For production environments, we recommend using Red Hat Enterprise Linux 9.
Network access
The host must be able to access the following domains related to the AxoConsole:
When using AxoConsole SaaS:
<your-tenant-id>.cloud.axoflow.io: HTTPS traffic on TCP port 443, needed to download the binaries for Axoflow software (like Axolet and AxoRouter).
kcp.<your-tenant-id>.cloud.axoflow.io: HTTPS (mutual TLS) traffic on TCP port 443 for management traffic.
telemetry.<your-tenant-id>.cloud.axoflow.io: HTTPS (mutual TLS) traffic on TCP port 443, where Axolet sends the metrics of the host.
us-docker.pkg.dev: HTTPS traffic on TCP port 443, but only if you’re forcing the installation script to pull the container images from the public repository. The Axolet and AxoRouter for Linux installation scripts download the images directly from AxoConsole.
When using an on-premise AxoConsole:
The following domains should point to AxoConsole IP address to access Axoflow from your desktop and AxoRouter hosts:
your-host.your-domain: The main domain of your AxoConsole deployment.
idp.your-host.your-domain: A subdomain for the identity provider.
kcp.your-host.your-domain: A subdomain for management traffic.
telemetry.your-host.your-domain: A subdomain for agent telemetry.
The AxoConsole host must have the following Open Ports:
Port 80 (HTTP)
Port 443 (HTTPS)
When installing Axoflow agent for Windows or Linux:
github.com: HTTPS traffic on TCP port 443, for downloading installer packages.
Install Axolet
To install Axolet on a host and onboard it to Axoflow, complete the following steps. If you need to reinstall Axolet for some reason, see Reinstall Axolet.
Open the AxoConsole at https://<your-tenant-id>.cloud.axoflow.io/.
Select Provisioning > Select type and platform.
Select Edge > Linux.
The curl command can be run manually or inserted into a template in any common software deployment package. When run, a script is downloaded that sets up the Axolet process to run automatically at boot time via systemd. For advanced installation options, see Advanced installation options.
Copy the deployment one-liner and run it on the host you are onboarding into Axoflow.
Note
Running the provisioning command with sudo would mask environment variables of the calling shell. Either start the whole procedure from a root shell, or let the install script call sudo when it needs to. In other words: don’t add the sudo command to the provisioning command.
Example output:
Do you want to install Axolet now? [Y]y
% Total % Received % Xferd Average Speed Time Time Time Current
Dload Upload Total Spent Left Speed
100 31.6M 100 31.6M 00 2127k 0 0:00:15 0:00:15 --:--:-- 2075k
Verifying packages...
Preparing packages...
axolet-0.40.0-1.aarch64
Created symlink /etc/systemd/system/multi-user.target.wants/axolet.service → /usr/lib/systemd/system/axolet.service.
Now continue with onboarding the host on the Axoflow web UI.
On the AxoConsole, reload the Provisioning page. A registration request for the new host should be displayed. Accept it.
Axolet starts sending metrics from the host. Check the Topology page to see the new host.
Continue to onboard the host as described for your specific log collector agent.
Manage Axolet
This section describes how to start, stop and check the status of the Axolet service on Linux.
Start Axolet
To start Axolet, execute the following command. For example:
systemctl start axolet
If the service starts successfully, no output will be displayed.
The following message indicates that Axolet cannot start (see Check Axolet status):
Job for axolet.service failed because the control process exited with error code. See `systemctl status axolet.service` and `journalctl -xe`for details.
Reload the configuration without restarting Axolet
To reload the configuration file without restarting Axolet, execute the following command.
systemctl reload axolet
Check the status of Axolet service
To check the status of Axolet service
Execute the following command.
systemctl --no-pager status axolet
Check the Active: field, which shows the status of the Axolet service. The following statuses are possible:
active (running) - axolet service is up and running
inactive (dead) - axolet service is stopped
For AxoRouter hosts, you can check the Axolet logs from the AxoConsole using Log tapping for Agent logs.
Upgrade Axolet
AxoConsole raises an alert for the host when a new Axolet version is available. To upgrade to the new version, re-run the one-liner installation command you used to install Axolet, or select Provisioning > Select type and platform to create a new one.
Note that it can take a few minutes until the version numbers of the different services get updated on AxoConsole.
Run axolet as non-root
You can run Axolet as non-root user, but operators must have access to the following commands:
/usr/bin/systemctl * axolet.service: Controls the axolet.service systemd unit. Usually * is start, stop, restart, enable, and status. Used by the operators for troubleshooting.
/usr/local/bin/configure-axolet: Creates initial axolet configuration and enables/starts the axolet service. Executed by the bootstrap script.
Command to install and upgrade the axolet package. Executed by the bootstrap script if the packages aren’t already installed.
On RPM-based Linux distributions: /usr/bin/rpm -Uv axo*.rpm
On DEB-based Linux distributions: /usr/bin/dpkg -i axo*.deb
You can permit the syslogng user to run these commands by running on of the following:
sudo tee /etc/sudoers.d/configure-axoflow <<A
syslogng ALL=(ALL) NOPASSWD: /usr/local/bin/configure-axolet
syslogng ALL=(ALL) NOPASSWD: /bin/systemctl * axolet.service
# for rpm installation:syslogng ALL=(ALL) NOPASSWD: /usr/bin/rpm -Uv axo*.rpm
A
sudo tee /etc/sudoers.d/configure-axoflow <<A
syslogng ALL=(ALL) NOPASSWD: /usr/local/bin/configure-axolet
syslogng ALL=(ALL) NOPASSWD: /bin/systemctl * axolet.service
# for deb installation:syslogng ALL=(ALL) NOPASSWD: /usr/bin/dpkg -i axo*.deb
A
7.5.2 - Advanced installation options
When installing Axolet, you can set a number of advanced options if needed for your environment. Setting the advanced options in the AxoConsole automatically updates the one-liner command that you can copy and run.
Alternatively, before running the one-liner you can use one of the following methods:
Set the related environment variable for the option. For example:
Set the related URL parameter for the option. For example:
curl -fLsH 'X-AXO-TOKEN:random-generated''https://<your-tenant-id>.cloud.axoflow.io/setup.sh?type=AXOEDGE&platform=LINUX&user=syslogng&group=syslogng'| sh
Proxy settings
Use the HTTP proxy, HTTPS proxy, No proxy parameters to configure HTTP proxy settings for the installer. To avoid using the proxy for the Axolet service, enable the Avoid proxy parameter as well. Lowercase variable names are preferred because they work universally.
Installation options
You can pass the following parameters to the installation script as environment variables, or as URL parameters.
Note
Running the provisioning command with sudo would mask environment variables of the calling shell. Either start the whole procedure from a root shell, or let the install script call sudo when it needs to. In other words: don’t add the sudo command to the provisioning command.
API server host
Default value:
Environment variable
URL parameter
api_server_host
Description: Override the host part of the API endpoint for the host.
Avoid proxy
Default value:
false
Available values:
true, false
Environment variable
AXOLET_AVOID_PROXY
URL parameter
avoid_proxy
Description: If set to true, the value of the *_proxy variables will only be used for downloading the installer, but not for the axolet service itself. If set to false, the Axolet service will use the variables from the installer.
Capabilities
Default value:
CAP_SYS_PTRACE
Available values:
Whitespace-separated list of capability names with CAP_ prefix.
Environment variable
AXOLET_CAPS
URL parameter
caps
Description: Ambient Linux capabilities the axolet service will use.
Configuration directory
Default value:
/etc/axolet
Environment variable
AXOLET_CONFIG_DIR
URL parameter
config_dir
Description: The directory where the configuration files are stored.
HTTP proxy
Default value:
empty string
Environment variable
AXOLET_HTTP_PROXY
URL parameter
http_proxy
Description: Use a proxy to access AxoConsole from the host.
HTTPS proxy
Default value:
empty string
Environment variable
AXOLET_HTTPS_PROXY
URL parameter
https_proxy
Description: Use a proxy to access AxoConsole from the host.
Initial labels
Default value:
empty string
Environment variable
AXOLET_INITIAL_LABELS
URL parameter
initial_labels
Description: Comma-separated list of key=value labels. These labels will be suggested for the host when you add the source to AxoConsole. For example, product=windows,team=windows,vendor=microsoft
No proxy
Default value:
empty string
Environment variable
AXOLET_NO_PROXY
URL parameter
no_proxy
Description: Destinations that should be reached directly, without going through the proxy.
Overwrite config
Default value:
false
Available values:
true, false
Environment variable
AXOLET_CONFIG_OVERWRITE
URL parameter
config_overwrite
Description: If set to true, the configuration process will overwrite existing configuration (/etc/axolet/config.json). This means that the agent will get a new GUID and it will require approval on the AxoConsole.
Package format
Default value:
auto
Available values:
auto, dep, rpm, tar, none
Environment variable
AXOLET_INSTALL_PACKAGE
URL parameter
install_package
Description: File format of the installer package.
Service group
Default value:
root
Environment variable
AXOLET_GROUP
URL parameter
group
Description: Name of the group and Axolet will be running as. It should be either root or the group syslog-ng is running as.
Service user
Default value:
root
Environment variable
AXOLET_USER
URL parameter
user
Description: Name of the user Axolet will be running as. It should be either root or the user syslog-ng is running as. See also Run axolet as non-root.
Start service
Default value:
AXOLET_START=true
Available values:
true, false
Environment variable
AXOLET_START
URL parameter
start
Description: Start axolet agent at the end of installation. Use false for preparing golden images. In this case axolet will generate a new GUID on the first boot after cloning the image.
If you are preparing a host for cloning with Axolet already installed, set the following environment variable in your (root) shell session, before running the one-liner command. For example:
exportSTART_AXOLET=falsecurl ... # Run the command copied from the Provisioning page
This way Axolet will only start and initialize after the first reboot.
7.5.3 - Run axolet as non-root
If the log collector agent (AxoSyslog or syslog-ng) is running as a non-root user, you may want to configure the Axolet agent to run as the same user.
To do that, set the AXOLET_USER and AXOLET_GROUP environment variables to the user’s username and groupname. For details, see Advanced installation options.
Operators will need to have access to the following commands:
/usr/bin/systemctl * axolet.service: Controls the axolet.service systemd unit. Usually * is start, stop, restart, enable, and status. Used by the operators for troubleshooting.
/usr/local/bin/configure-axolet: Creates initial axolet configuration and enables/starts the axolet service. Executed by the bootstrap script.
Command to install and upgrade the axolet package. Executed by the bootstrap script if the packages aren’t already installed.
On RPM-based Linux distributions: /usr/bin/rpm -Uv axo*.rpm
On DEB-based Linux distributions: /usr/bin/dpkg -i axo*.deb
For example, you can permit the syslogng user to run these commands by running the following commands:
sudo tee /etc/sudoers.d/configure-axoflow <<A
syslogng ALL=(ALL) NOPASSWD: /usr/local/bin/configure-axolet
syslogng ALL=(ALL) NOPASSWD: /bin/systemctl * axolet.service
# for rpm installation:syslogng ALL=(ALL) NOPASSWD: /usr/bin/rpm -Uv axo*.rpm
A
sudo tee /etc/sudoers.d/configure-axoflow <<A
syslogng ALL=(ALL) NOPASSWD: /usr/local/bin/configure-axolet
syslogng ALL=(ALL) NOPASSWD: /bin/systemctl * axolet.service
# for deb installation:syslogng ALL=(ALL) NOPASSWD: /usr/bin/dpkg -i axo*.deb
A
7.5.4 - Reinstall Axolet
Reinstall Axolet to a (cloned) machine
To re-install Axolet on a (cloned) machine that has an earlier installation running, complete the following steps.
Log in to the host as root and execute the following commands:
systemctl stop axolet
rm -r /etc/axolet/
Follow the regular installation steps described in Axolet.
Recover Axolet after the root CA certificate was rotated
Log in to the host as root and execute the following commands:
Tests the network connection with the console endpoints.
Checks if the operating system is supported.
Downloads the installers (.rpm or .deb) of the Axolet agent and the Axoflow agent for Linux.
The installer script installs the packages. If the packages are already installed, the installer will update them to the latest version.
The installer installs:
The collector agent (by default) to /usr/bin/axoflow-otel-collector.
A default configuration file to /etc/axoflow-otel-collector/config.yaml.
The axolet management agent (by default) to /usr/local/bin/axolet.
axolet performs the following main steps on its first execution:
Generates and persists a unique identifier (GUID).
Initiates a cryptographic handshake process to AxoConsole.
AxoConsole issues a client certificate to axolet, which will be stored in the above mentioned config.json file.
The service waits for an approval on AxoConsole. Once you approve the host registration request, axolet starts to manage the local services and send telemetry data to AxoConsole. It keeps doing so as long as the agent is registered.
Note
Note that AxoRouter and Axoflow agent collects detailed, real-time metrics about the data-flows – giving you observability over the health of the security data pipeline and its components. Your security data remains in your self-managed cloud or in your on-prem instance where your sources, destinations, Axoflow agents, and AxoRouters are running, only metrics are forwarded to AxoConsole.
To install Axoflow agent on a Linux host, complete the following steps. For other platforms, see Provision pipeline elements.
Prerequisites
Axoflow agent should work on most Red Hat and Debian compatible Linux distributions. Both x86_64 and arm64 architectures are supported. For production environments, we recommend using Red Hat Enterprise Linux 9.
The host must be able to access the following domains related to the AxoConsole:
When using AxoConsole SaaS:
<your-tenant-id>.cloud.axoflow.io: HTTPS traffic on TCP port 443, needed to download the binaries for Axoflow software (like Axolet and AxoRouter).
kcp.<your-tenant-id>.cloud.axoflow.io: HTTPS (mutual TLS) traffic on TCP port 443 for management traffic.
telemetry.<your-tenant-id>.cloud.axoflow.io: HTTPS (mutual TLS) traffic on TCP port 443, where Axolet sends the metrics of the host.
us-docker.pkg.dev: HTTPS traffic on TCP port 443, but only if you’re forcing the installation script to pull the container images from the public repository. The Axolet and AxoRouter for Linux installation scripts download the images directly from AxoConsole.
When using an on-premise AxoConsole:
The following domains should point to AxoConsole IP address to access Axoflow from your desktop and AxoRouter hosts:
your-host.your-domain: The main domain of your AxoConsole deployment.
idp.your-host.your-domain: A subdomain for the identity provider.
kcp.your-host.your-domain: A subdomain for management traffic.
telemetry.your-host.your-domain: A subdomain for agent telemetry.
The AxoConsole host must have the following Open Ports:
Port 80 (HTTP)
Port 443 (HTTPS)
When installing Axoflow agent for Windows or Linux:
github.com: HTTPS traffic on TCP port 443, for downloading installer packages.
To transport data to an AxoRouter, Axoflow agent must be able to access the OpenTelemetry Connector of the AxoRouter. By default, the connector uses the 4317 TCP port.
Limitations
Communication between the Axoflow agent hosts and AxoRouter hosts uses the OpenTelemetry Protocol (OTLP/gRPC), but currently doesn’t use TLS or authentication.
Install Axoflow agent for Linux
Select Provisioning > Select type and platform.
Select the type (Edge) and platform (Linux). The one-liner installation command is displayed.
If needed, set the Advanced options (for example, proxy settings, or External image pull in air-gapped environments) to modify the installation parameters. Usually, you don’t have to use advanced options unless the Axoflow support team instructs you to do so.
Open a terminal on the host where you want to install Axoflow agent.
Run the one-liner, then follow the on-screen instructions.
Example output:
curl -fLsH 'X-AXO-TOKEN:random-generated''https://<your-tenant-id>.cloud.axoflow.io/setup.sh?type=AXOEDGE&platform=LINUX&install_agent=true'| sh
Do you want to install Axoflow agents now? [Y]Y
Verifying packages...
Preparing packages...
axolet-0.81.1.x86_64
The unique identifier of this installation: 9hrtcd8bz6u61aihd2zd
Verifying packages...
Preparing packages...
axoflow-otel-collector-0.129.0~axoflow.5-1.x86_64
Created symlink /etc/systemd/system/multi-user.target.wants/axoflow-otel-collector.service → /usr/lib/systemd/system/axoflow-otel-collector.service.
Axolet service is running.
Now continue with onboarding the host on the Axoflow web UI.
Verify that the axolet and axoflow-otel-collector services are running by running sudo systemctl list-units | grep axo
On the AxoConsole, reload the Provisioning page. A registration request for the new host should be displayed. Accept it.
The host now appears on the Topology page. To collect data from the host, the host must match the edge selector of an Edge collection rule.
Metadata fields
The AxoRouter connector that receives data from Axoflow agent adds the following fields to the meta variable:
field
Value
meta.connector.type
otlp
meta.connector.name
<name of the connector>
meta.product
opentelemetry
meta.platform
linux
7.8.1 - Manage the Linux agent
This section describes how to start, stop and check the status of the axolet and axoflow-otel-collector services on Linux.
Start the service
To start the axolet or axoflow-otel-collector service, execute the following commands:
systemctl start axolet
systemctl start axoflow-otel-collector
Alternatively, you can restart the service from AxoConsole:
Find the host on the Topology or the Sources page. Alternatively, select ⌘/Ctrl + K and enter the name of the host.
Select the name of the host.
Select Services > Restart.
Stop the service
To stop the axolet or axoflow-otel-collector service, execute the following commands:
systemctl stop axolet
systemctl stop axoflow-otel-collector
Check the status of the service
To check the status of the axolet or axoflow-otel-collector service, execute the following commands:
systemctl status axolet
systemctl status axoflow-otel-collector
For more detailed logs, run:
journalctl -u axolet
journalctl -u axoflow-otel-collector
Upgrade Axoflow agent
AxoConsole raises an alert for the host when a new Axoflow agent version is available. To upgrade to the new version, re-run the one-liner installation command you used to install Axoflow agent, or select Provisioning > Select type and platform to create a new one (make sure to enable the Advanced options > Install Collector agent option).
Note that it can take a few minutes until the version numbers of the different services get updated on AxoConsole.
7.8.2 - Advanced installation options
When installing Axoflow agent for Linux, you can set a number of advanced options if needed for your environment. Setting the advanced options in the AxoConsole automatically updates the one-liner command that you can copy and run.
Alternatively, before running the one-liner you can use one of the following methods:
Set the related environment variable for the option. For example:
Set the related URL parameter for the option. For example:
curl -fLsH 'X-AXO-TOKEN:random-generated''https://<your-tenant-id>.cloud.axoflow.io/setup.sh?type=AXOEDGE&platform=LINUX&initial_labels=initial_labels=team%3Dnetworking%2Cregion%3Dus-east'| sh
Proxy settings
Use the HTTP proxy, HTTPS proxy, No proxy parameters to configure HTTP proxy settings for the installer. To avoid using the proxy for the Axolet service, enable the Avoid proxy parameter as well. Lowercase variable names are preferred because they work universally.
Installation options
You can pass the following parameters to the installation script as environment variables, or as URL parameters.
API server host
Default value:
Environment variable
URL parameter
api_server_host
Description: Override the host part of the API endpoint for the host.
Avoid proxy
Default value:
false
Available values:
true, false
Environment variable
AXOLET_AVOID_PROXY
URL parameter
avoid_proxy
Description: If set to true, the value of the *_proxy variables will only be used for downloading the installer, but not for the axolet service itself. If set to false, the Axolet service will use the variables from the installer.
Capabilities
Default value:
CAP_SYS_PTRACE
Available values:
Whitespace-separated list of capability names with CAP_ prefix.
Environment variable
AXOLET_CAPS
URL parameter
caps
Description: Ambient Linux capabilities the axolet service will use.
Configuration directory
Default value:
/etc/axolet
Environment variable
AXOLET_CONFIG_DIR
URL parameter
config_dir
Description: The directory where the configuration files are stored.
HTTP proxy
Default value:
empty string
Environment variable
AXOLET_HTTP_PROXY
URL parameter
http_proxy
Description: Use a proxy to access AxoConsole from the host.
HTTPS proxy
Default value:
empty string
Environment variable
AXOLET_HTTPS_PROXY
URL parameter
https_proxy
Description: Use a proxy to access AxoConsole from the host.
Initial labels
Default value:
empty string
Environment variable
AXOLET_INITIAL_LABELS
URL parameter
initial_labels
Description: Comma-separated list of key=value labels. These labels will be suggested for the host when you add the source to AxoConsole. For example, product=windows,team=windows,vendor=microsoft
No proxy
Default value:
empty string
Environment variable
AXOLET_NO_PROXY
URL parameter
no_proxy
Description: Destinations that should be reached directly, without going through the proxy.
Overwrite config
Default value:
false
Available values:
true, false
Environment variable
AXOLET_CONFIG_OVERWRITE
URL parameter
config_overwrite
Description: If set to true, the configuration process will overwrite existing configuration (/etc/axolet/config.json). This means that the agent will get a new GUID and it will require approval on the AxoConsole.
Package format
Default value:
auto
Available values:
auto, dep, rpm, tar, none
Environment variable
AXOLET_INSTALL_PACKAGE
URL parameter
install_package
Description: File format of the installer package.
Service group
Default value:
root
Environment variable
AXOLET_GROUP
URL parameter
group
Description: Name of the group and Axolet will be running as. It should be either root or the group syslog-ng is running as.
Service user
Default value:
root
Environment variable
AXOLET_USER
URL parameter
user
Description: Name of the user Axolet will be running as. It should be either root or the user syslog-ng is running as. See also Run axolet as non-root.
Start service
Default value:
AXOLET_START=true
Available values:
true, false
Environment variable
AXOLET_START
URL parameter
start
Description: Start axolet agent at the end of installation. Use false for preparing golden images. In this case axolet will generate a new GUID on the first boot after cloning the image.
If you are preparing a host for cloning with Axolet already installed, set the following environment variable in your (root) shell session, before running the one-liner command. For example:
exportSTART_AXOLET=falsecurl ... # Run the command copied from the Provisioning page
This way Axolet will only start and initialize after the first reboot.
7.8.3 - Configure data collection
To configure the agent to collect data from the edge host and send it to an AxoRouter instance, you must have:
a Collection rule with an Edge Selector that matches this host, and
Tests the network connection with the console endpoints.
Checks if the operating system is supported.
Downloads the installers (.msi) of the Axolet agent and the Axoflow agent for Windows.
The installer script installs the packages. If the packages are already installed, the installer will update them to the latest version.
The installer installs:
The collector agent (by default) to C:\Program Files\Axoflow\OpenTelemetry Collector\axoflow-otel-collector.exe.
A default configuration file to C:\ProgramData\Axoflow\OpenTelemetry Collector\config.yaml.
The axolet management agent (by default) to C:\Program Files\Axoflow\Axolet\axolet.exe.
axolet performs the following main steps on its first execution:
Generates and persists a unique identifier (GUID).
Initiates a cryptographic handshake process to AxoConsole.
AxoConsole issues a client certificate to axolet, which will be stored in the above mentioned config.json file.
The service waits for an approval on AxoConsole. Once you approve the host registration request, axolet starts to send telemetry data to AxoConsole. It keeps doing so as long as the agent is registered.
Note
Note that AxoRouter and Axoflow agent collects detailed, real-time metrics about the data-flows – giving you observability over the health of the security data pipeline and its components. Your security data remains in your self-managed cloud or in your on-prem instance where your sources, destinations, Axoflow agents, and AxoRouters are running, only metrics are forwarded to AxoConsole.
To install Axoflow agent on a Windows host, complete the following steps. For other platforms, see Provision pipeline elements.
Prerequisites
You’ll need Administrator PowerShell access to the Windows host.
Axoflow agent supports the following Windows versions on x86_64 architectures:
The host must be able to access the following domains related to the AxoConsole:
When using AxoConsole SaaS:
<your-tenant-id>.cloud.axoflow.io: HTTPS traffic on TCP port 443, needed to download the binaries for Axoflow software (like Axolet and AxoRouter).
kcp.<your-tenant-id>.cloud.axoflow.io: HTTPS (mutual TLS) traffic on TCP port 443 for management traffic.
telemetry.<your-tenant-id>.cloud.axoflow.io: HTTPS (mutual TLS) traffic on TCP port 443, where Axolet sends the metrics of the host.
us-docker.pkg.dev: HTTPS traffic on TCP port 443, but only if you’re forcing the installation script to pull the container images from the public repository. The Axolet and AxoRouter for Linux installation scripts download the images directly from AxoConsole.
When using an on-premise AxoConsole:
The following domains should point to AxoConsole IP address to access Axoflow from your desktop and AxoRouter hosts:
your-host.your-domain: The main domain of your AxoConsole deployment.
idp.your-host.your-domain: A subdomain for the identity provider.
kcp.your-host.your-domain: A subdomain for management traffic.
telemetry.your-host.your-domain: A subdomain for agent telemetry.
The AxoConsole host must have the following Open Ports:
Port 80 (HTTP)
Port 443 (HTTPS)
When installing Axoflow agent for Windows or Linux:
github.com: HTTPS traffic on TCP port 443, for downloading installer packages.
To transport data to an AxoRouter, Axoflow agent must be able to access the OpenTelemetry Connector of the AxoRouter. By default, the connector uses the 4317 TCP port.
Limitations
Communication between the Axoflow agent hosts and AxoRouter hosts uses the OpenTelemetry Protocol (OTLP/gRPC), but currently doesn’t use TLS or authentication.
Install Axoflow agent for Windows
Select Provisioning > Select type and platform.
Select the type (Edge) and platform (Windows). The one-liner installation command is displayed.
If needed, set the Advanced options (for example, proxy settings, or External image pull in air-gapped environments) to modify the installation parameters. Usually, you don’t have to use advanced options unless the Axoflow support team instructs you to do so.
Open a PowerShell terminal as Administrator on the host where you want to install Axoflow agent.
Only on Windows Server 2016: Explicitly enable TLS1.2 encryption (Windows Server 2016, PowerShell 5.1 defaults to TLS 1.0 or 1.1 for web requests).
On the AxoConsole, reload the Provisioning page. A registration request for the new host should be displayed. Accept it.
The host now appears on the Topology page. To collect data from the host, the host must match the edge selector of an Edge collection rule.
Metadata fields
The AxoRouter connector that receives data from Axoflow agent adds the following fields to the meta variable:
field
Value
meta.connector.type
otlp
meta.connector.name
<name of the connector>
meta.product
windows, windows-dns, windows-dhcp
meta.platform
windows
Troubleshooting
If you run into problems when installing Axoflow agent for Windows, complete the following steps.
Double-check that you’re running the installation command:
as administrator,
in PowerShell, not in Cmd.
Set the following environment variable to store the installation logs. Adjust the directory as needed.
$env:TEMP_DIR ="C:\Temp\axoflow-agent-install"
Re-run the installation command.
Open the Windows Event Viewer and check the Windows Logs > System events at the time of installation for errors or issues logged by the Service Control Manager.
Check that the installation logs of axolet and axoflow-otel-collector are available, for example, the C:\Temp\axoflow-agent-install\axolet-windows-amd64_<version-number>.msi-install.log and C:\Temp\axoflow-agent-install\axoflow-otel-collector_<version-number>-axoflow.1_windows_x64.msi-install.log files exist.
If you suspect that the installer is incorrectly reporting connectivity issues, disable the preflight check and re-run the installation command.
This section describes how to start, stop and check the status of the axolet and axoflow-otel-collector services on Windows. axolet logs are available under C:\Windows\Temp\axolet.log, while Axoflow agent logs are available in the event log under Windows Logs / Application.
Start the service
To start the axolet or axoflow-otel-collector service, execute the following commands:
sc.exe start axolet
sc.exe start axoflow-otel-collector
Alternatively, you can restart the service from AxoConsole:
Find the host on the Topology or the Sources page. Alternatively, select ⌘/Ctrl + K and enter the name of the host.
Select the name of the host.
Select Services > Restart.
Stop the service
To stop the axolet or axoflow-otel-collector service, execute the following commands:
sc.exe stop axolet
sc.exe stop axoflow-otel-collector
Check the status of the service
To check the status of the axolet or axoflow-otel-collector service, execute the following commands:
sc.exe query axolet
sc.exe query axoflow-otel-collector
Upgrade Axoflow agent
AxoConsole raises an alert for the host when a new Axoflow agent version is available. To upgrade to the new version, re-run the one-liner installation command you used to install Axoflow agent, or select Provisioning > Select type and platform to create a new one.
7.9.2 - Advanced installation options
When installing Axoflow agent on Windows, you can set a number of advanced options if needed for your environment. Setting the advanced options in the AxoConsole automatically updates the one-liner command that you can copy and run.
Alternatively, before running the one-liner you can use one of the following methods:
Set the related environment variable for the option. For example:
Use the HTTP proxy, HTTPS proxy, No proxy parameters to configure HTTP proxy settings for the installer. To avoid using the proxy for the Axolet service, enable the Avoid proxy parameter as well. Lowercase variable names are preferred because they work universally.
Installation options
You can pass the following parameters to the installation script as environment variables, or as URL parameters.
API server host
Default value:
Environment variable
URL parameter
api_server_host
Description: Override the host part of the API endpoint for the host.
Avoid proxy
Default value:
false
Available values:
true, false
Environment variable
AXOLET_AVOID_PROXY
URL parameter
avoid_proxy
Description: If set to true, the value of the *_proxy variables will only be used for downloading the installer, but not for the axolet service itself. If set to false, the Axolet service will use the variables from the installer.
Description: The directory where the configuration files are stored.
HTTP proxy
Default value:
empty string
Environment variable
AXOLET_HTTP_PROXY
URL parameter
http_proxy
Description: Use a proxy to access AxoConsole from the host.
HTTPS proxy
Default value:
empty string
Environment variable
AXOLET_HTTPS_PROXY
URL parameter
https_proxy
Description: Use a proxy to access AxoConsole from the host.
Initial labels
Default value:
product=windows,vendor=microsoft
Environment variable
AXOLET_INITIAL_LABELS
URL parameter
initial_labels
Description: Comma-separated list of key=value labels. These labels will be suggested for the host when you add the source to AxoConsole. For example, product=windows,team=windows,vendor=microsoft
Install collector agent
Default value:
true
Available values:
true, false
Environment variable
AXOLET_INSTALL_AGENT
URL parameter
install_agent
Description: Deploy the Axoflow agent. If set to false, only the Axolet agent will be installed.
Non-interactive installation
Default value:
false
Available values:
true, false
Environment variable
AXOLET_NON_INTERACTIVE
URL parameter
non_interactive
Description: Don’t ask for user confirmation during the installation.
No proxy
Default value:
empty string
Environment variable
AXOLET_NO_PROXY
URL parameter
no_proxy
Description: Destinations that should be reached directly, without going through the proxy.
Overwrite config
Default value:
false
Available values:
true, false
Environment variable
AXOLET_CONFIG_OVERWRITE
URL parameter
config_overwrite
Description: If set to true, the configuration process will overwrite existing configuration (/etc/axolet/config.json). This means that the agent will get a new GUID and it will require approval on the AxoConsole.
Start service
Default value:
AXOLET_START=true
Available values:
true, false
Environment variable
AXOLET_START
URL parameter
start
Description: Start axolet agent at the end of installation. Use false for preparing golden images. In this case axolet will generate a new GUID on the first boot after cloning the image.
If you are preparing a host for cloning with Axolet already installed, set the following environment variable in your (root) shell session, before running the one-liner command. For example:
$Env:START_AXOLET=falseInvoke-WebRequest...# Run the command copied from the Provisioning page
This way Axolet will only start and initialize after the first reboot.
7.9.3 - Configure data collection
To configure the agent to collect data from the edge host and send it to an AxoRouter instance, you must have:
a Collection rule with an Edge Selector that matches this host, and
The Dashboard page gives you an overview of your pipeline, and links to relevant pages of pipeline elements. All data is automatically updated every 10 seconds.
The animated section shows a simplified version of the Topology page.
The source side shows the most active source groups.
The destination side shows the three most active destinations and the data reduction achieved.
Data reduction is calculated as follows:
The input is the total data of every flow that sends data to the destination, measured either: before classification and parsing, or at the Probe processing step called filtered if it exists in the flow.
The reduced data is the total amount of data (in bytes) sent to the destination.
The data reduction is the ratio of the reduced data and the input.
The metrics bar shows the number of events and amount of data ingested from the sources and delivered to the destinations during the selected time frame. (You can change the time frame in the top-right of the page.) Note that the small charts under the metrics show the historic value of the related metric for a longer period, not the just within the selected time frame, so the current numbers correspond to the endpoint of the chart.
Further down, the dashboard shows the active alerts (if any), and metrics for the last day and the last 30 days.
8.2 - Topology
Based on the collected metrics, Axoflow visualizes the topology of your security data pipeline. The topology allows you to get a semi-real-time view of how your edge-to-edge data flows, and drill down to the details and metrics of your pipeline elements to quickly find data transport issues.
If a host has active alerts, it’s indicated on the topology as well.
Traffic volume
Select bps or eps in the top bar to show the volume of the data flow on the topology paths in bytes per second or events per second.
Filter hosts
To find or display only specific hosts, you can use the filter bar.
Free-text mode searches in the values of the following fields of the host: Name, IP Address, GUID, FQDN, and the labels of the host.
Basic Search is case insensitive. Adding multiple keywords searches for matches in any of the previous fields. This is equivalent to the @ANY =* keyword1 AND @ANY =* keyword2 AQL query.
AQL Expression mode allows you to search in specific fields or the labels of the hosts.
It also makes more complex filtering possible, using the Equals, Contains (partial match), and Match (regular expression match) operators. Note that:
To execute the search, click Search, or hit ESC then ENTER.
AxoConsole autocompletes the built-in and custom labels and field names, as well as their most frequent values, but doesn’t autocomplete labels and variables created by data parsing and processing steps.
You can use the AND and OR operators to combine expressions, and also parenthesis if needed. For details on AQL, see AQL operator reference.
The precedence of the operators is the following: parentheses, AND, OR, comparison operators.
Use the usual keyboard shortcuts to undo (⌘/Ctrl + Z) or redo (⌘/Ctrl + Shift + Z) your edits.
If a filter is active, by default the AxoConsole will display the matching hosts and the elements that are downstream from the matching hosts. For example, if an aggregator like AxoRouter matches the filter, only the aggregators and destinations where the matching host is sending data are displayed, the sources that are sending data to the matching aggregator aren’t shown. To display only the matching host without the downstream pipeline elements, select Filter strategy > Strict. (For example, the AQL expression type = ROUTER shows only the aggregator hosts.)
The settings of the filter bar change the URL parameters of the page, so you can bookmark it, or share a specific view by sharing the URL.
Grouping hosts
You can select labels to group hosts in the Group by field, so the visualization of large topologies with lots of devices remains useful. AxoConsole automatically adds names to the groups. The following example shows hosts grouped by their region based on their location labels.
You can select one or more features to group hosts by. When multiple features are selected, groups will be formed by combining values of these features. This can be useful in cases where your information is split into multiple features, for example, if you have region (with values eu, us, etc.) and zone (with values central-1, east-1, east-2, west-1, etc.) labels on your hosts and select the label.region and label.zone features for grouping, you’ll groups will be the following:
A cross-product of the selected feature values: eu,central-1, eu,east-1, eu,east-2, eu,west-1, us,central-1, us,east-1, and so on. Obviously, in this example, several of these groups (like eu,east-1, eu-east-2, and us,central-1) will be empty, unless your hosts are mislabeled.
Groups for the individual values, for hosts that have only one of the selected features: eu, us, central-1, east-1, east-2, west-1, etc.
Queues
Select queue in the top bar to show the status of the memory and disk queues of the hosts. Select the status indicators of a host to display the details of the queues.
The following details about the queue help you diagnose which connections of the host are having throughput or connectivity issues:
capacity: The total capacity of the buffer in bytes.
usage: How much of the total capacity is currently in use.
driver: The type of the AxoSyslog driver used for the connection the queue belongs to.
id: The identifier of the connection.
Disk-based queues also have the following information:
path: The location of the disk-buffer file on the host.
reliable: Indicates wether the disk-buffer is set to be reliable or not.
worker: The ID of the AxoSyslog worker thread the queue belongs to.
Both memory-based and disk-based queues have additional details that depend on the destination.
8.3 - Hosts
Axoflow collects and shows you a wealth of information about the hosts of your security data pipeline. Sources and edge hosts are listed on the Sources page, while AxoRouters are shown on the Routers page.
Sources are hosts that are sending data to a data aggregator, like AxoRouter.
Edges are source hosts that are running a collector agent managed by AxoConsole, or have an Axolet agent reporting metrics from the host.
To tap into the logs of the host, see Log tapping.
8.3.1 - Find a host
To find a specific host, you can use any of the following methods:
Start typing the name of the host into the global search field, then select the host from the results. You can also access the global search using the ⌘/Ctrl + K keyboard shortcut.
Find host on the Topology page
Open the Topology page, then click the name of the host you’re interested in.
If you have many host and it’s difficult to find the one you need, use filtering, or grouping.
Find a router or a source host
To find an AxoRouter, open the Routers page. To find a source or an edge host, open the Sources page.
To find or display only specific hosts, you can use the filter bar.
Free-text mode searches in the values of the following fields of the host: Name, IP Address, GUID, FQDN, and the labels of the host.
Basic Search is case insensitive. Adding multiple keywords searches for matches in any of the previous fields. This is equivalent to the @ANY =* keyword1 AND @ANY =* keyword2 AQL query.
AQL Expression mode allows you to search in specific fields or the labels of the hosts.
It also makes more complex filtering possible, using the Equals, Contains (partial match), and Match (regular expression match) operators. Note that:
To execute the search, click Search, or hit ESC then ENTER.
AxoConsole autocompletes the built-in and custom labels and field names, as well as their most frequent values, but doesn’t autocomplete labels and variables created by data parsing and processing steps.
You can use the AND and OR operators to combine expressions, and also parenthesis if needed. For details on AQL, see AQL operator reference.
The precedence of the operators is the following: parentheses, AND, OR, comparison operators.
Use the usual keyboard shortcuts to undo (⌘/Ctrl + Z) or redo (⌘/Ctrl + Shift + Z) your edits.
You can also select one or more features (for example, label.location) to group hosts by in the Group by field. For details on how grouping works, see Grouping hosts.
8.3.2 - Host information
AxoConsole provides a quick overview of every data source and edge host on the Sources page, and AxoRouter on the Routers page. The exact information depends on the type of the host: hosts managed by Axoflow provide more information than external hosts.
The following information is displayed:
Hostname or IP address
Metadata labels. These include labels added automatically during the Axoflow curation process (like product name and vendor labels), as well as any custom labels you’ve assigned to the host.
For edge hosts (hosts that have the Axoflow agent (Axolet) installed):
The version on the agent
The name and version of the log collector running on the host (for example, AxoSyslog or Splunk Connect for Syslog)
Operating system, version, and architecture
When AxoConsole has last received metrics from the host
Resource information: CPU and memory usage, disk buffer usage. Click on a resource to open its resource history on the Metrics & health page of the host.
Traffic information: volume of the incoming and outgoing data traffic on the host.
Cloud-related labels: If the host is running in the cloud, the provider, region, zone labels are automatically available.
An indicator if there are any active alerts on the host.
For more details about the host, select the hostname, or click ⋮.
The host Overview page gives a quick overview of the host, including:
To add custom labels to a host, complete the following steps. Note that these are static labels. To add labels dynamically based on the contents of the processed data, use processing steps in data flows.
Find the host on the Topology page, and click on its hostname. The overview of the host is displayed. (Alternatively, you can find AxoRouters on the Routers page, and source and edge hosts on the Sources page.)
Select Edit.
You can add custom labels in <label-name>:<value> format (for example, the group or department a source device belongs to), or a generic description about the host. You can use the labels for quickly finding the host on the Hosts page, and also for filtering when configuring Flows.
When using labels in filters, processing steps, or search bars, note that:
Labels added to AxoRouter hosts get the axo_host_ prefix.
Labels added to data sources get the host_ prefix. For example, if you add a rack label to an edge host, it’ll be added to the data received from the host as host_rack.
Labels added on edge hosts get the edge_connector_label_ prefix.
On other pages, like the Host Overview page, the labels are displayed without the prefixes.
Select Save.
8.3.4 - Services
The Services page of an AxoRouter or edge host shows information about the data collector or router services running on the host. This page is only available for managed pipeline elements.
The following information is displayed:
Name: Name of the service
Version: Version number of the service
Type: Type of the service (which data collector or processor it’s running), for example, axorouter-syslog, axorouter-wec, or axostore
Supervisor: The type of the supervisor process. For example, Splunk Connect for Syslog (sc4s) runs a syslog-ng process under the hood.
Icons and colors indicate the status of the service: running, stopped, or not registered.
Depending on the configuration of the host, the following services can be available:
axoflow-otel-collector: The collector agent on edge hosts.
axolet: The monitoring and management agent for Axoflow pipeline elements.
axorouter-resolver: A service for retrieving host data from external CMDB systems.
axorouter-syslog: The main processing element of AxoRouter deployments.
axostore: The service that handles AxoStore on the host. Only available if there are stores configured on the host.
Service configuration
To check the configuration of the service, select Configuration. This shows the list of related environment variables and configuration files. Select a file or environment variable to display its value. For example:
To display other details of the service (for example, the location of the configuration file or the binary), select Details.
Manage service
To reload a registered service, select Reload.
To restart a registered service, select Restart.
Register service manually
If Automatic service registration is disabled, or the service discovery is unable to find a running service, you can register it manually by specifying:
the service’s control socket path, or
the name of its managing systemd unit.
To register a service manually, complete the following steps.
Enter a name for the service. This name will be displayed in the services list.
Provide at least one of the following:
Control Socket Path: The path to the Unix domain socket used to communicate with the service, for example, /var/lib/syslog-ng/syslog-ng.ctl.
Systemd unit name: The name of the systemd service of the service you’re registering, for example, syslog-ng.service.
Select Register.
8.4 - Log tapping
Log tapping in Axoflow samples the log flow. You can use labels to filter for specific messages (like ones with parse errors) and tap only those messages. To not get overwhelmed with events, Axoflow automatically samples the output: if many messages match the selected filter, only a subset is shown (about 1 message per second). Using log tapping, you can quickly troubleshoot both parsing/curation errors and destination ingest (API) errors, and check:
What was in the original message?
What is sent in the final payload to the destination?
Note
Neither AxoRouter nor AxoConsole records any log data. The Flow tapping and Log tapping features only send a sample of the data to your browser using encrypted connections while the tapping is active. Only authorized users can use tapping.
Display the logs of the log collector service. Service logs also contain the output of the systemd units used to launch the containers (where applicable).
Tap into the log flow
To tap into your log flow, complete the following steps.
Select the AxoRouter where you want to tap the logs on the Topology or Routers page. Alternatively, select ⌘/Ctrl + K and enter the name of the AxoRouter.
Select ⋮ > Tap log flow.
Tap into the log flow.
To see the input data, select Input log flow > Start.
To see the output data, select Output log flow > Start.
When the logs you’re interested in show up, click Stop Log Tap, then click a log message to see its details. For details about the message schema and the displayed fields, see Message schema reference.
Note
For sources that are not yet registered in the AxoConsole host database, the Register source button is shown at the end of the message. Click it to add the source to AxoConsole: this will allow attributing the logs coming from the given source as such, enriching the messages, the analytics data, as well as the Topology page.
Note
When using Log tapping, ETW events look a bit weird: the body of these events is empty. That’s normal, the reason for that is that everything is sent as metadata.
If you don’t know what the message means, select AI Analytics to ask our AI to interpret it.
Tap service logs
Display the logs of the log collector service, complete the following steps. AxoConsole supports service log tapping on AxoRouter and Axoflow agent for Linux hosts.
Find the host you want to tap.
Select the AxoRouter on the Topology or Routers page.
Select the Axoflow agent on the Topology or Sources page.
Alternatively, select ⌘/Ctrl + K and enter the name of the host.
To start log tapping instantly, select Services > ✓ Service log in the row of the axorouter-syslog or axoflow-otel-collector.service service.
To filter the logs or to tap the logs of a specific service, select ⋮ > Tap service logs and complete the following steps.
Select Service logs.
Set the Service name field to see the logs of a specific service.
Depending on the configuration of the host, the following services can be available:
axoflow-otel-collector: The collector agent on edge hosts.
axolet: The monitoring and management agent for Axoflow pipeline elements.
axorouter-resolver: A service for retrieving host data from external CMDB systems.
axorouter-syslog: The main processing element of AxoRouter deployments.
axostore: The service that handles AxoStore on the host. Only available if there are stores configured on the host.
If systemd is available on the host, select Systemd service output to show the logs of the service from the systemd journal. Otherwise, the Internal logs of the service are available.
When the logs you’re interested in show up, click Stop Log Tap, then click a log message to see its details. For details about the message schema and the displayed fields, see Message schema reference.
Filter the messages
You can add labels to the Filter By Label field to sample only messages matching the filter. If you specify multiple labels, only messages that match all filters will be sampled. For example, the following filter selects messages from a specific source IP, sent to a specific destination IP.
For details about the labels available for filtering, see Metrics schema.
To tap the messages received from edge hosts, you can use the related metrics labels of the edge collector, for example, edge_connector_type:windowsEventLog samples only the event log messages received from edge hosts. For details about the message schema and the available fields, see Message schema reference.
8.5 - Alerts
Axoflow raises alerts for a number of events in your security data pipeline, for example:
a destination becomes unavailable or isn’t accepting messages,
a host is dropping packets or messages,
a host becomes unavailable,
the disk queues of a host are filling up,
abandoned (orphaned) disk buffer files are on the host,
the configuration of a managed host failed to synchronize or reload,
On the Alerting page. Select an alert to display its details.
On the Topology page:
On the Overview page of the host:
On the Metrics & Health page of the host the alerts are shown as an overlay to the metrics:
Filter alerts
You can use the Filter Bar on the Alerts page to search and filter for specific alerts.
The settings of the filter bar change the URL parameters of the page, so you can bookmark it, or share a specific view by sharing the URL.
Free-text mode searches in the following fields of the alerts: Id, Name, Title, Summary, Labels.
Basic Search is case insensitive. Adding multiple keywords searches for matches in any of the previous fields. This is equivalent to the @ANY =* keyword1 AND @ANY =* keyword2 AQL query.
AQL Expression mode allows you to search in specific fields of the activity logs.
It also makes more complex filtering possible, using the Equals, Contains (partial match), and Match (regular expression match) operators. Note that:
To execute the search, click Search, or hit ESC then ENTER.
AxoConsole autocompletes the built-in and custom labels and field names, as well as their most frequent values, but doesn’t autocomplete labels and variables created by data parsing and processing steps.
You can use the AND and OR operators to combine expressions, and also parenthesis if needed. For details on AQL, see AQL operator reference.
The precedence of the operators is the following: parentheses, AND, OR, comparison operators.
Use the usual keyboard shortcuts to undo (⌘/Ctrl + Z) or redo (⌘/Ctrl + Shift + Z) your edits.
Alerts have the following fields:
Name: The name of the alert, for example, Target down.
Related Source: The host where the alert event occurred.
Date: The time when the alert triggered.
Title: The title of the alert, for example, <host> is down.
Severity: The severity level of the alert: Info, Warning, or Critical.
Summary: A detailed description of the alert.
Duration: How long the alert lasted.
Labels: Labels related to the alert.
8.5.1 - Alerts reference
Host down (warning)
host-type host with name 'hostname' isn't reporting data, indicating potential downtime.
An edge or router host has stopped reporting data to the AxoConsole.
Because the system tolerates short reporting gaps, the alert takes around seven minutes to fire after the host actually goes silent.
The usual causes are loss of network connectivity from the host, Axolet being stopped on the host,
or a hardware or operating-system failure on the host itself.
Related metrics: cpu, memory
Cert Expires (info)
host-type host with name 'hostname' uses a certificate that expires in less than 45 days. It should have been renewed automatically.
The client certificate that an edge or router host uses to authenticate to the AxoConsole will expire in less than 45 days.
Certificates should be renewed automatically; if this alert appears, automatic renewal has failed.
Restarting the axolet service on the affected host often triggers another renewal attempt. If the alert doesn't clear within five minutes, contact Axoflow support.
Stats level (info)
'hostname' is configured with a stats level of 0.
An axorouter-syslog (or another AxoSyslog-based) service on a host is configured with a stats level of 0,
so most metrics shown on the AxoConsole will be incomplete or missing for it.
The recommended stats level is 2. Add options { stats(level(2)); }; to the top of the main configuration file and reload the service.
See the AxoSyslog stats option reference.
High CPU (warning)
CPU usage at hostname has been above 90% for the last 15 minutes.
The average CPU usage across all cores on a host has been above 90% for at least 15 minutes.
Sustained high CPU usage can prevent the host from keeping up with its workload, and may lead to message drops,
packet drops, or processing delays.
Related metrics: cpu, droppedPacketsTotal, logInputEvents
Message drop (warning)
Messages have been dropped on hostname in the last 10 minutes.
An axorouter-syslog service on a host has dropped messages in the last 10 minutes.
This happens when a destination can't accept messages fast enough and flow control isn't configured to back-pressure the source.
Once the destination's output buffer overflows, further incoming messages are discarded and can't be recovered.
Related metrics: droppedPacketsTotal, logInputEvents, logOutputEvents
UDP packet drop (warning)
UDP packets have been dropped on hostname in the last 10 minutes.
A host has dropped UDP packets in the last 10 minutes.
The most common cause is that the kernel's UDP receive buffer is full: packets that arrive while the buffer is saturated
are silently discarded by the kernel before the service can read them.
An undersized socket buffer on the receiving connector is a frequent contributor (see also the AxorouterLowRmemMax alert).
Related metrics: droppedPacketsTotal, logInputEvents, logOutputEvents
Abandoned disk queue files (info)
There are abandoned disk queues on hostname. See the Axoflow documentation for instructions on how to remove or back up these files.
A disk queue file on a host is no longer attached to any running axorouter-syslog instance.
Such files occupy disk space and, if they contain messages, those messages remain stranded until they're manually recovered or wiped.
Use dqtool cat <filename> to inspect a file before removing it; see the
axorouter-ctl wipe-disk-buffer documentation
for the supported procedure.
Related metrics: logDiskQueue, logDiskQueueBytes
Abandoned messages (warning)
There are messages abandoned in disk queues. See the Axoflow documentation for instructions on how to remove or back up these files.
A disk queue file on a host is no longer attached to any running axorouter-syslog instance, and that file still contains messages.
Those messages remain stranded until they're manually recovered or the file is wiped.
Use dqtool cat <filename> to inspect a file before removing it; see the
axorouter-ctl wipe-disk-buffer documentation
for the supported procedure.
Related metrics: logDiskQueue, logDiskQueueBytes
Destination unreachable (warning)
Unreachable driver destinations. Check network connectivity and agent logs.
The axorouter-syslog service on a host has been unable to reach a configured destination for at least five minutes.
The alert fires per destination driver and address, so a single host with multiple broken destinations produces multiple concurrent alerts.
The service buffers messages for the unreachable destination in memory or on disk. AxoRouter drops further messages once buffers fill up.
Check the destination's network reachability and the service's logs on the host.
Related metrics: droppedPacketsTotal, logMemoryQueue, logDiskQueue, logMemoryQueueBytes, logDiskQueueBytes, eventDelaySeconds
HTTP 5xx (warning)
High rate of HTTP response-code on hostname to url
HTTP requests sent to a destination URL have been returning 5xx responses in the last minute,
and no 2xx responses have been observed for the same URL in that window.
The alert fires once per destination URL and response code, so a destination returning several distinct 5xx codes can produce several alerts.
A 5xx response typically points to a server-side problem (at the destination, or in a proxy in front of it) rather than to a sender-side configuration mistake.
Related metrics: droppedPacketsTotal, logOutputEvents, logDiskQueueBytes
HTTP 4xx (warning)
Increased rate of HTTP response-code on hostname to url
HTTP requests sent to a destination URL have been returning 4xx responses in the last minute,
and no 2xx responses have been observed for the same URL in that window.
The alert fires once per destination URL and response code, so a destination returning several distinct 4xx codes can produce several alerts.
A 4xx response usually indicates a problem at the sender side rather than a fault at the destination: invalid credentials, missing permissions,
a target resource (bucket, stream, topic) that doesn't exist at the destination, or a malformed request.
Related metrics: droppedPacketsTotal, logOutputEvents, logDiskQueueBytes
gRPC error (warning)
Increased rate of gRPC response-code responses on hostname to driver
gRPC requests sent to a destination have been returning non-ok status codes in the last minute.
The alert fires once per destination URL, driver, topic, and response code.
Common causes include misconfigured credentials, missing permissions, or a target resource (bucket, stream, topic)
that doesn't exist at the destination.
Related metrics: droppedPacketsTotal, logOutputEvents, logDiskQueueBytes
Buffer filling up (warning)
Disk buffer path is predicted to fill up within 10 minutes on hostname
The remaining capacity of a disk buffer on a host is trending down fast enough that, at the current rate,
it's predicted to fill up within the next 10 minutes. The alert fires per disk buffer path, so a host with
multiple buffers can produce multiple alerts. Once a disk buffer fills up entirely, the service stops being
able to enqueue further messages for the affected destination and may start dropping them.
Related metrics: logDiskQueueBytes, networkInputBytes
Buffer is full (critical)
Disk buffer path is filled up on hostname
A disk buffer on a host has filled up: the service can't enqueue further messages for the affected destination.
Messages may be dropped until the buffer drains enough to accept new writes, which requires either the destination
to start accepting traffic again or the buffer to be enlarged.
Related metrics: logDiskQueueBytes, networkInputBytes
Config Sync Error (warning)
An error occurred on host hostname during configuration synchronization for service service-id. Check the axolet logs for details.
Axolet on a host has been unable to write a new configuration to disk for at least five minutes.
The previously synchronized configuration remains in place, so the managed services on the host keep processing traffic,
but changes made in the AxoConsole won't take effect on this host until synchronization succeeds again.
Common causes include a filesystem permissions issue or a missing target directory on the host.
Config Load Error (warning)
Agent configuration load failed on hostname for service service-id. Check the axolet logs for details.
An axorouter-syslog service on a host failed to load a new configuration. The previously loaded configuration remains active,
so traffic processing continues, but changes made in the AxoConsole won't take effect on this host
until the load succeeds. Common causes include a syntactically invalid generated configuration, or a
missing file on the host (see also the ServiceMissingFile alert).
WEC Config Generation Error (warning)
WEC configuration generation failed on 'hostname' for service 'service-id'. Contact Axoflow support.
Configuration generation for the Windows Event Collector service on a host has been failing for at least five minutes.
The host continues to use the last successfully generated WEC configuration, but changes made in the AxoConsole
don't reach this host until generation succeeds again. This typically indicates an internal issue and should be
reported to Axoflow support.
AxoStore Config Generation Error (warning)
AxoStore configuration generation failed on 'hostname' for service 'service-id'. Contact Axoflow support.
Configuration generation for the AxoStore service on a host has been failing for at least five minutes.
The host continues to use the last successfully generated AxoStore configuration, but changes made in the
AxoConsole don't reach this host until generation succeeds again. This typically indicates an internal
issue and should be reported to Axoflow support.
Flow stuck in error state (warning)
Unable to provision paths for Flow flow due to error state. Check AxoConsole for details.
A Flow is in an error state, so the system can't provision its data paths.
The Flow's status on the AxoConsole contains the underlying reason.
Until the error is resolved, traffic that would have flowed through this Flow isn't processed.
Flow has no traffic (warning)
Flow flow has no traffic. Check AxoConsole for details.
A Flow used to have inbound or outbound traffic but currently has none. The alert fires per Flow and traffic direction.
A Flow that has never received traffic doesn't trigger this alert; it only fires when previously flowing traffic has stopped.
Common causes are an upstream source becoming silent, a configuration change that disabled or rerouted the source,
or a Flow selector that no longer matches the intended sources.
Related metrics: logDiskQueueBytes, networkInputBytes
AxoRouter service version mismatch (warning)
AxoRouter hostname has a service service-id (version service-version) that doesn't match its axolet's version version. It may be due to a misconfigured deployment.
An AxoRouter host has a managed service whose binary version doesn't match the host's Axolet version.
Service and Axolet versions normally move together; a mismatch usually points to a misconfigured deployment
or to an in-progress upgrade that didn't complete. Contact Axoflow support if the mismatch doesn't clear on its own.
Suboptimal worker count (info)
Destination id on hostname is using more active partitions than workers. Consider increasing the number of workers.
An output destination on a host is using more active worker partitions than it has configured workers,
which means it could be processing data with more parallelism than it has been allowed.
The alert fires per destination. Increasing the worker count on the destination so it matches or exceeds
the number of active partitions usually improves throughput.
Related metrics: logOutputEvents, eventDelaySeconds
Update available (info)
Axoflow software running on hostname has an update available, as it's running Axolet version while version is available.
A host is running a different Axolet version than the one the AxoConsole offers.
An update is available and can be applied through the standard Axolet upgrade procedure.
The AxoRouter service version normally moves together with the Axolet version, so this alert usually also implies
that a new AxoRouter version is available (see also the AxoRouterServiceVersionMismatch alert).
Host service has a missing file (warning)
Host hostname has a missing file which is required to write/reload config.
A managed service on a host can't have its configuration written or reloaded because a file it depends on is missing on the host.
The alert fires per missing file, so a host with several missing files produces several alerts.
The specific file name is available in the alert details. Place it in the expected location to resolve the issue.
Traffic without flows (warning)
There are no flows that have a router selector matching hostname, but it's receiving traffic. AxoRouter is dropping these events. Create a flow that matches it.
An AxoRouter is receiving input events, but no enabled Flow has a Router selector that matches it,
so all received events are dropped. Either enable or create a Flow whose selector matches this AxoRouter,
adjust the AxoRouter's labels so an existing Flow matches it, or create a Flow that explicitly drops these events
if the traffic is unwanted.
AxoRouter 'hostname' has no axorouter-syslog running
An AxoRouter host has no running axorouter-syslog service registered with the AxoConsole.
The AxoConsole can only configure an AxoRouter that has at least one such managed service present and running.
This usually happens when the service fails to start on the host or when its registration is incomplete.
It can also indicate that automatic service registration has been turned off.
AxoRouter Config Generation Error (warning)
AxoRouter configuration generation failed on 'hostname' for service 'service-id'. Check the axorouter_confgen controller logs in controller-manager for details.
Configuration generation for the AxoRouter service on a host has been failing for at least five minutes.
The host continues to use the last successfully generated configuration, but changes made in the AxoConsole
don't reach this host until generation succeeds again. This typically indicates an internal issue;
the AxoConsole logs contain the underlying error, otherwise contact Axoflow support.
AxoStore Config Load Error (warning)
AxoStore configuration load failed on 'hostname' for service 'service-id'. Check the AxoStore logs for details.
The AxoStore service on a host failed to load its configuration. The previously loaded configuration remains in effect,
so storage continues to operate, but configuration changes won't take effect on this host until the load succeeds.
The AxoStore logs on the host contain the underlying reason.
WEC Unreachable Clients (info)
AxoRouter 'hostname' has value unreachable clients on WEC subscription 'subscription'. Reach out to Axoflow support on how to list unreachable clients.
An AxoRouter has one or more Windows Event Collector clients that have stopped sending heartbeats and are now considered unreachable.
The alert fires per WEC subscription. Common causes are the WEC client service being stopped on the endpoint, a network problem
between the endpoint and the AxoRouter, or a credential or policy change that broke authentication.
Contact Axoflow support to obtain the list of unreachable clients.
Axolet frequently restarts (warning)
Axolet 'hostname' has restarted >3 times in the last 15 minutes. Check the startup logs.
The Axolet process on a host has restarted more than three times in the last 15 minutes, which suggests a crash loop
or repeated process termination. The host's startup logs typically contain the underlying reason; contact Axoflow support
if the cause isn't obvious.
Host service frequently restarts (warning)
'service-id' on 'hostname' has restarted >3 times in the last 15 minutes. Check the startup logs.
A managed service on a host has restarted more than three times in the last 15 minutes, which suggests a crash loop
or repeated process termination. The alert fires per service. The host's startup logs and the service's own logs
typically contain the underlying reason; contact Axoflow support if the cause isn't obvious.
Rejected syslog connections (warning)
AxoRouter 'hostname' has rejected connections in the last 5 minutes.
Check the maximum connections in the connector rule settings for 'id'.
An AxoRouter has rejected incoming syslog source connections in the last five minutes because the configured maximum number
of concurrent connections has been reached. The alert fires per syslog connector.
If the increased connection count is legitimate, raise the Maximum connections setting
on the syslog connector in the AxoConsole.
Related metrics: connections, logInputEvents
Small UDP socket buffer (warning)
'hostname' has an UDP connector with a low socket buffer size configured.
An AxoRouter has at least one UDP connector with a socket receive buffer smaller than 8 MiB, and is actually receiving traffic on it.
An undersized receive buffer is a common cause of UDP packet loss under load.
Raise the net.core.rmem_maxsysctl on the host operating system or increase the socket buffer size in the connector settings;
the recommended size is 32 MiB.
Related metrics: droppedPacketsTotal, logInputEvents
Conflicting flow control parameters on a host (info)
Conflicting flow control parameters on hostname. The combination causes unintended backpressure and reduces throughput. This alert triggers when a router forwards traffic between a source and a destination with Batch Timeout > 0, disk buffering turned off, and Log window size / Maximum connections less than Batch Lines * Number of Workers. See the alert description for remediation steps.
An AxoRouter forwards traffic between a source and a destination whose flow-control parameters conflict:
the destination has Batch Timeout > 0, disk buffering is disabled, and Log window size / Maximum connections
is less than Batch Lines × Number of Workers. This combination can cause unintended backpressure
and reduce throughput. To resolve, do one of the following:
increase Log window size on the source, or
reduce Maximum connections on the source, or
reduce Batch Lines on the destination, or
reduce Number of Workers on the destination.
Conflicting flow control parameters on a destination. (info)
Conflicting flow control parameters on a destination: destination-name. The combination causes unintended backpressure and reduces throughput. This alert triggers when a router forwards traffic between a source and a destination with Batch Timeout > 0, disk buffering turned off, and Log window size / Maximum connections less than Batch Lines * Number of Workers. Batch Lines or Number of Workers is too high to be continuously fed by messages from source connectors.
A destination receives traffic from a source whose flow-control parameters conflict with the destination's:
the destination has Batch Timeout > 0, disk buffering is disabled, and Log window size / Maximum connections
is less than Batch Lines × Number of Workers. Batch Lines or Number of Workers is too high
to be continuously fed from the source connectors, which can cause unintended backpressure and reduce throughput.
To resolve, do one of the following:
increase Log window size on the source, or
reduce Maximum connections on the source, or
reduce Batch Lines on the destination, or
reduce Number of Workers on the destination.
Low disk free space (warning)
There is low disk free space on hostname.
A disk used by the AxoStore on a host has less than 10% free space. The alert fires per disk,
so a host with multiple low disks produces multiple alerts. If a disk fills up entirely, the AxoStore
on this host will be unable to persist new messages.
Store's disk is filling up (warning)
Store's disk is filling up on hostname
A disk used by the AxoStore on a host is filling up fast enough that, at the current rate, it's predicted to be full
within the next six hours. The alert fires per disk. Once a disk fills up entirely, the AxoStore on this host
will be unable to persist new messages.
Store's error rate increased (warning)
Store's error rate increased on hostname
The rate at which the AxoStore on a host emits errors of a given type has risen above the expected baseline.
The alert fires per error type, so a single underlying problem may surface as several concurrent alerts.
A persistent high error rate often degrades storage reliability and should be investigated promptly.
AxoStore doesn't persist messages received from AxoRouter (critical)
AxoStore doesn't persist messages from axorouter-syslog.
An AxoRouter is receiving traffic that's configured to be persisted in the AxoStore, but the AxoStore was unable to persist it.
The unpersisted messages aren't available in the AxoConsole for tapping or search.
Check the AxoConsole for the underlying reason and remediation steps.
8.6 - Private connections
8.6.1 - Google Private Service Connect
If you want your hosts in Google Cloud to access the AxoConsole without leaving the Google network, we recommend that you use Google Cloud Private Service Connect (PSC) to secure the connection from your VPC to Axoflow.
Prerequisites
Contact Axoflow and provide the list of projects so we can set up an endpoint for your PSC. You will receive information from us that you’ll need to properly configure your connection.
You will also need to allocate a dedicated IP address for the connection in a subnet that’s accessible for the hosts.
Steps
After you have received the details of your target endpoint from Axoflow, complete the following steps to configure Google Cloud Private Service Connect from your VPC to AxoConsole.
Set Target service to the service name you’ve received from Axoflow. The service name should be similar to: projects/axoflow-shared/regions/<region-code>/serviceAttachments/<your-tenant-ID>
Set Endpoint name to the name you prefer, or the one recommended by Axoflow. The recommended service name is similar to: psc-axoflow-<your-tenant-ID>
Select your VPC in the Network field.
Set Subnet where the endpoint should appear. Since subnets are regional resources, select a subnet in the region you received from Axoflow.
Select Create IP address and allocate an address for the endpoint. Save the address, you’ll need it later to verify that the connection is working.
Select Enable global access.
There is no need to enable the directory API even if it’s offered by Google.
Select Add endpoint.
Test the connection.
Log in to a machine where you want to use the PSC using SSH.
Test the connection. Run the following command using the IP address you’ve allocated for the endpoint.
It should load an HTML page from the IP address of the endpoint.
If the host is running axolet, restart it by running:
sudo systemctl restart axolet.service
Check the axolet logs to verify that there’re no errors:
sudo journalctl -fu axolet
Deploy the changes of the /etc/hosts file to all your VMs.
Setting up whole VPC networks to use the PSC
Open Google Cloud Console and in the Cloud DNS service navigate to the Create a DNS zone page.
Create a new private zone with the zone name<your-tenant-id>.cloud.axoflow.io, and select the networks you want to use the PSC in.
Add the following three A records, all of which targeted to the <IP-address-allocated-for-the-endpoint>:
<your-tenant-id>.cloud.axoflow.io
kcp.<your-tenant-id>.cloud.axoflow.io
telemetry.<your-tenant-id>.cloud.axoflow.io
9 - Data management
This section describes how data Axoflow processes your security data, and how to configure and monitor your data flows in Axoflow.
9.1 - Flow overview
Axoflow uses flows to manage the routing and processing of security data. A flow applies to one or more AxoRouter instances. The Flows page lists the configured flows, and also highlights if any alerts apply to a flow.
Each flow consists of the following main elements:
A Router selector that specifies the AxoRouter instances the flow applies to. Multiple flows can apply to a single AxoRouter instance.
Processing steps that filter and select the messages to process, set/unset message fields, and perform different data transformation and data reduction.
A Destination where the AxoRouter instances of the flow deliver the data. Destinations can be external destinations (for example, a SIEM), stores or external stores, or other AxoRouter instances.
Based on the flows, AxoConsole automatically generates and deploys the configuration of the AxoRouter instances. Click ⋮ or the name of the flow to display the details of the flow.
Filter flows
To find or display only specific flows, you can use the filter bar.
Free-text mode searches in the following fields of the flow: Name, Destination, Description.
Basic Search is case insensitive. Adding multiple keywords searches for matches in any of the previous fields. This is equivalent to the @ANY =* keyword1 AND @ANY =* keyword2 AQL query.
AQL Expression mode allows you to search in specific fields of the flows.
It also makes more complex filtering possible, using the Equals, Contains (partial match), and Match (regular expression match) operators. Note that:
To execute the search, click Search, or hit ESC then ENTER.
AxoConsole autocompletes the built-in and custom labels and field names, as well as their most frequent values, but doesn’t autocomplete labels and variables created by data parsing and processing steps.
You can use the AND and OR operators to combine expressions, and also parenthesis if needed. For details on AQL, see AQL operator reference.
The precedence of the operators is the following: parentheses, AND, OR, comparison operators.
Use the usual keyboard shortcuts to undo (⌘/Ctrl + Z) or redo (⌘/Ctrl + Shift + Z) your edits.
Fallback flow
Fallback flows process messages that weren’t processed by other, ’non-fallback’ flows. If configured, the fallback flow acts as a default flow: for example, you can use it to send all data to a low-cost storage that other flows haven’t sent to other destinations.
Note
You can configure multiple fallback flows, but only one fallback flow can apply to an AxoRouter (so the Router Selector of the fallback flows can’t overlap).
9.2 - Manage flows
Create flow
To create a new flow, open the AxoConsole, then complete the following steps:
Select Flows.
Select Add Flow > Flow.
To create a fallback flow, select Add Flow > Fallback flow.
Enter a name for the flow, for example, my-test-flow.
In the Router Selector field, enter an expression that matches the router(s) you want to apply the flow. To select a specific router, use a name selector, for example, name = my-axorouter-hostname.
You can use any labels and metadata of the AxoRouter hosts in the Router selectors, for example, the hostname of the AxoRouter, or any custom labels.
If you leave the Router Selector field empty, the selector will match every AxoRouter instance.
To select only a specific AxoRouter instance, set the name field to the name of the instance as selector. For example, name = my-axorouter.
If you set multiple fields in the selector, the selector will match only AxoRouter instances that match all elements of the selector. (There in an AND relationship between the fields.)
Note
You can configure multiple fallback flows, but only one fallback flow can apply to an AxoRouter (so the Router Selector of the fallback flows can’t overlap).
Select the Destination where you want to send your data. If you don’t have any destination configured, you can select + Add in the destination section to create a new destination now. For details on the different destinations, see Destinations.
If you don’t have any destination configured, see Destinations.
If you’ve already created a store, it automatically available as a destination. Note that the Router Selector of the flow must match only AxoRouters that have the selected store available, otherwise you’ll get an error message.
If you want to send data to another AxoRouter, enable the Show all destinations option, and select the connector of the AxoRouter where you want to send the data.
(Optional) To process the data transferred in the flow, select Add New Processing Step. For details, see Processing steps. For example:
Add a Classify, a Parse, and a Reduce step, in that order, to automatically remove redundant and empty fields from your data.
To select which messages are processed by the flow, add a Select Messages step, and enter a filter into the AQL Expression field. For example, to select only the messages received from Fortinet FortiGate firewalls, use the meta.vendor = fortinet AND meta.product = fortigate query.
Save the processing steps.
Select Add.
The new flow appears in the Flows list.
Disable flow
You can disable a flow without deleting it if needed by clicking the toggle on the right of the flow name.
CAUTION:
Disabling a flow immediately stops log forwarding for the flow. Any data that’s not forwarded using another flow can be irrevocably lost.
9.3 - Processing steps
Flows can include a list of processing steps to select and transform the messages. All log messages received by the routers of the flow are fed into the pipeline constructed from the processing steps, then the filtered and processed messages are forwarded to the specified destination.
CAUTION:
Processing steps are executed in the order they appear in the flow. Make sure to arrange the steps in the proper order to avoid problems.
To add processing steps to an existing flow, complete the following steps.
Open the Flows page and select the flow you want to modify. Alternatively, select ⌘/Ctrl + K and enter the name of the flow.
Select Process > Add new Processing Step.
Select the type of the processing step to add.
The following types of processing steps are available:
Classify: Automatically classify the data and assign vendor, product, and service labels. This step (or its equivalent in the Connector rule) is required for the Parse and Reduce steps to work.
Normalize: Normalize the data according to the specified standard: Dynatrace, Elastic Common Schema (ECS), or Open Cybersecurity Schema Framework (OCSF).
Parse: Automatically parse the data to extract structured information from the content of the message. The Classify step (or its equivalent in the Connector rule) is required for the Parse step to work.
Probe: A measurement point that provides metrics about the throughput of the flow.
Reduce: Automatically remove redundant content from the messages. The Classify and Parse steps (or their equivalent in the Connector rule) are required for the Reduce step to work.
Regex: Execute a regular expression on the message.
Select Messages: Filter the messages using a query. Only the matching messages will be processed in subsequent steps.
Set Fields: Set the value of one or more fields on the message object.
Unset Field: Unset the specified field of the message object.
Configure the processing step as needed for your environment.
(Optional) To apply the processing step only to specific messages from the flow, set the Condition field of the step. Conditions act as filters, but apply only to this step. Messages that don’t match the condition will be processed by the subsequent steps. For details about the message schema and the available fields, see Message schema reference.
Conditions use AQL queries, making complex filtering possible, using the Equals, Contains (partial match), and Match (regular expression match) operators. Note that:
AxoConsole autocompletes the built-in and custom labels and field names, as well as their most frequent values, but doesn’t autocomplete labels and variables created by data parsing and processing steps. See the Message schema for details.
You can use the AND and OR operators to combine expressions, and also parenthesis if needed.
(Optional) If needed, drag-and-drop the step to change its location in the flow.
Select Save.
Classify
Automatically classify the data and assign vendor, product, and service labels. This step (or its equivalent in the Connector rule) is a prerequisite for the Parse and Reduce steps, and must be executed before them. AxoRouter can parse data from the supported data sources. If your source isn’t listed, contact us.
FilterX
Execute an arbitrary FilterX snippet. The following example checks if the meta.host.labels.team field exists, and sets the meta.openobserve variable to a JSON value that contains stream as a key with the value of the meta.host.labels.team field.
Normalize
Prerequisite: It’s recommended to enable the Classify step (or its equivalent in the Connector rule) when using the Normalize step. Normalization implicitly performs the Parse step as well.
The Normalize step reformats the content of the message to the selected normalization scheme. The following normalization schemas are supported:
Prerequisite: The Classify step (or its equivalent in the Connector rule) is required for the Parse step to work.
The Parse step automatically parses the data from the content of the message, and replaces the message content (the log.body field in the internal message schema) with the structured information. AxoRouter can parse data from the supported data sources. If your source isn’t listed, contact us. Alternatively, you can create your own parser using FilterX processing steps.
For example, if the message content is in the Common Event Format (CEF), AxoRouter creates a structured FilterX dictionary from its content, like this:
By default, messages that aren’t successfully parsed are forwarded to the next processing step of the flow. If you want to discard such messages instead, enable the Drop unparsable messages option.
Probe
Set a measurement point that provides metrics about the throughput of the flow. Note that:
You can’t name your probes input and output, as these are reserved.
If you add probe called filtered to the flow, this point will be the input metric data point when calculating the data reduction of the flow in the Dashboard page.
Input is an AxoSyslog template string, for example, ${MESSAGE} that the regular expression will be matched with.
Pattern is a Perl Compatible Regular Expression (PCRE). If you want to match the pattern to the whole string, use the ^ and $ anchors at the beginning and end of the pattern.
You can use https://regex101.com/ with the ECMAScript flavor to validate your regex patterns. (When denoting named capture groups, ?P isn’t supported, use ?.)
Named or anonymous capture groups denote the parts of the pattern that will be extracted to the Field field. Named capture groups can be specified like (?<group_name>pattern), which will be available as field_name["group_name"]. Anonymous capture groups will be numbered, for example, the second group from (first.*) (bar|BAR) will be available as field_name["2"]. When specifying variables, note the following points:
If you want to include the results in the outgoing message or in its metadata for other processing steps, you must:
Reference an existing variable or field. This field will be updated with the matches.
For new variables, use names for the variables that start with the $ character, or
declare them explicitly. For details, see the FilterX data model in the AxoSyslog documentation.
The field will be set to an empty dictionary ({}) when the pattern doesn’t match. For details about the message schema and the available fields, see Message schema reference.
Example: Parse the entire raw message
The following processing step parses an unclassified log message from a firewall into a structured format in the log.body field:
The following processing step processes the entire log.body field for messages generated by the AxoSyslog loggen command and stores it in the log.pad field, for example:
Filter the messages using a query. Only the matching messages will be processed in subsequent steps.
The following example selects messages that have the resource.attributes["service.name"] label set to nginx.
You can also select messages using various other metadata about the connection and the host that sent the data, the connector that received the data, the classification results, and also custom labels, for example:
a specific connector: meta.connector.name = axorouter-mysyslog-connector
a type of connector: meta.connector.type = otlp
a sender IP address: meta.connection.src_ip = 192.168.1.1
a specific product, if classification is enabled in an earlier processing step or in the connector that received the message: meta.product = fortigate (see Vendors for the metadata of a particular product)
a custom label you’ve added to the host: meta.host.labels.location = eu-west-1
In addition to exact matches, you can use the following operators:
!= not equal (string match)
=* contains (substring match)
!*: doesn’t contain
=~: matches regular expression
!~: doesn’t match regular expression
==~: matches case sensitive regular expression
!=~: doesn’t match case sensitive regular expression
You can combine multiple expressions using the AND (+) operator. (To delete an expression, hit SHIFT+Backspace.)
Note
To check the metadata of a particular message, you can use Log tapping. The metadata associated with the event is under the Event > meta section.
Set specific field of the message. You can use static values, and also dynamic values that were extracted from the message automatically by Axoflow or manually in a previous processing step. If the field doesn’t exist, it’s automatically created.
The type of the field can be boolean, string, number, and expression. Select expression to set the value of the field using a FilterX expression.
If you start typing the name of the field, the UI shows matching and similar field names based on the message schema:
The following example sets the resource.attributes.format field to parsed.
Set the Splunk source field
The following example sets the Splunk source field to the name of the AxoRouter host. (Set the Condition field to match only the hosts you want the source field, otherwise )
Note
If the Axoflow classification doesn’t set the source field for the message automatically, and you haven’t set it in a flow processing step manually (by setting the meta.destination.splunk.source field), AxoRouter automatically sets the source to the name of the AxoRouter connector that received the message (for example, axorouter-syslog-tcp-514).
Set destination options
If you select the Set Destination Options in the Destination step of the flow, it automatically inserts a special Set Fields processing step into the flow, that allows you to set destination-specific fields, for example, the index for a Splunk destination, or the stream name for an OpenObserve destination. You can insert this processing step multiple times if you want to set the fields to different values using conditions.
When using Set Destination Options, note the if you leave a parameter empty, AxoRouter will send it as an empty field to the destination. If you don’t want to send that field at all, delete the field.
Unset field
Unset a specific field of the message.
9.4 - Flow metrics
The Metrics page of a flow shows the amount of data (in events per second or bytes per second) processed by the flow. By default, the flow provides metrics for the input and the output of the flow. To get more information about the data flow, add Probe steps to the flow. For example, you can add a probe after:
Select Messages steps to check the amount of data that match the filter, or
Reduce steps to check the ratio of data saved.
Note
By default, Axoflow stores metrics for 30 days, unless specified otherwise in your support contract. Contact us if you want to increase the data retention time.
The top of the page is a funnel graph that shows the amount of data (in events/sec or bytes/sec) processed at each probe of the flow. To show the funnel graph between a probe and the output, click the INPUT field on the left of the funnel graph and select a probe. That way you can display a diagram that starts at a probe (for example, after the initial Select Messages step of the flow) and shows all subsequent probes. Note that OUTPUT on the right of the funnel graph shows the relative amount of data at the output compared to the input. This value refers to the entire flow, it’s not affected by selecting a probe for the funnel graph.
The bottom part of the page shows how the amount of data processed by a probe (by default, the input probe) changed over time. Click the name of a probe on the left to show the metrics of a different probe. Click on the timeline to show the input-probe-output states corresponding to the selected timestamp. Clicking the timeline updates the funnel graph as well. You can adjust the time range in the filter bar at the top.
You can adjust the data displayed using the filter bar:
Time period: Select the calendar_month
icon to change the time period that’s displayed on the charts. You can use absolute (calendar) time, or relative time (for example, the last 2 days).
Axoflow stores all dates in Coordinated Universal Time (UTC), and automatically converts it to the timezone of set in your browser/operating system.
Data unit: Select the summarize
icon to change the data unit displayed on the charts (events/second or bytes/second).
The settings of the filter bar change the URL parameters of the page, so you can bookmark it, or share a specific view by sharing the URL.
9.5 - Flow analytics
The Analytics page of a flow allows you to analyze the data throughput of the flow using Sankey and Sunburst diagrams. For details on using these analytics, see Analytics.
9.6 - Flow tapping
Flow tapping allows you to sample the data flowing in a Flow and see how it processes the logs. It’s useful to test the flow when you’re configuring or adjusting Processing Steps.
Note
Neither AxoRouter nor AxoConsole records any log data. The Flow tapping and Log tapping features only send a sample of the data to your browser using encrypted connections while the tapping is active. Only authorized users can use tapping.
Prerequisites
Flow tapping works only on flows that have been deployed to an AxoRouter instance. This means that if you change a processing step in a flow, you must first Save the changes (or select Save and Test).
If you want to experiment with a flow, we recommend that you clone (
) the flow and configure it to use the /dev/null destination, then redo adjusting the final processing steps in the original flow.
Tap into a flow
To tap into a Flow, complete the following steps.
Open AxoConsole and select Flows.
Select the flow you want to tap into, then select Process > Test.
Select the router where you want to tap into the flow, then click Start Log Tapping.
AxoConsole displays a sample of the logs from the data flow in matched pairs for the input and the output of the flow.
The input point is after the source connector finished processing the incoming message (including parsing and classification performed by the connector).
The output shows the messages right before they are formatted according to the specific destination’s requirements.
You can open the details of the messages to compare fields, values, and so on. For details about the message schema and the displayed fields, see Message schema reference.
By default, the messages are linked: opening the details of a message in the output automatically opens the details of the message input window, and vice versa (provided the message you clicked exists in both windows).
If you want to compare a message with other messages, click link
to disable linking.
If the flow contains one or more Probe steps, you can select the probe as the tapping point. That way you can check how the different processing steps modify your messages. You can change the first and the second tapping point by clicking
and
, respectively.
Diff view. To display the line-by-line difference between the state of a message at two stages of processing, scroll down in the details of the message and select Show diff.
The internal JSON representation of the message and its metadata is displayed, compared to the previous probe of the flow. Obviously, at the input of the flow the entire message is new.
You can change the probe in the right-hand pane, and the left side automatically switches to the previous probe in the flow. For example, the following screenshot shows a message after parsing. You can see that the initial string representation of the message body has been replaced with a structured JSON object.
9.7 - Rehydrate data
Rehydrating data allows you to select a set of data stored in AxoStore and send it to any other destination. For example, that way you can send data stored in AxoLake to a SIEM for further analysis.
New Rehydration
To start a new rehydration job, complete the following steps.
Select Rehydration > Start New Rehydration, or select Search logs > Rehydrate.
(Optional) AxoConsole automatically sets a name for the job. Set a custom name for the job if needed. This name is also added to the metadata of the rehydrated logs in the meta.rehydration_name field in a pre-filled processing step, which can be removed or modified if desired.
Specify which logs you want to rehydrate. Like on the Search logs page, you can:
use Free-text or AQL Expression search
select logs from a specific Store or a specific Router
All existing rehydration jobs are listed on the Rehydration page.
For every job the following information is shown:
Name: The name of the job.
Status: In Progress, Completed, Canceled (stopped by a user), or Failed. For failed jobs, check the Details of the job for the error.
The data selectors used for the job.
Rehydration Events: The number of events that matched the selectors, and the number of events sent to the destination.
The progress bar of the job, including the start and end time.
You can perform the following actions on the jobs:
To cancel an on-going job, select cancel
.
To clone a job (and optionally modify its parameters), select library_add
.
To delete a job, select delete
.
Performance considerations
Rehydration jobs use the same AxoRouter destinations that other flows might use. For example, if you’re sending data to Splunk in a flow, and you’re also rehydrating data to the same Splunk destination, then these operations use the same resources (like buffers and bandwidth). As a result, running rehydration on an AxoRouter under heavy load may cause backpressure towards the sources, and slow down data ingestion.
If the AxoRouter host has enough free resources, you can create a duplicate of the destination with a lower number of workers, and use that in the rehydration job. This can help to prevent rehydration jobs causing issues with normal workloads.
10 - Sources
The following chapters show you how to configure specific appliances, applications, and other sources to send their log data to Axoflow.
You can find the inventory of the sources registered in AxoConsole on the Sources page.
For an overview of where the different sources are sending data, see the Topology page.
To analyze your data at various points in your pipeline, see the Analytics page.
10.1 - Generic tips
The following section gives you a generic overview on how to configure a source to send its log data to Axoflow.
If your source has a specific entry in the Vendors section, follow that instead of the generic procedure.
Sources are hosts that are sending data to a data aggregator, like AxoRouter.
Edges are source hosts that are running a collector agent managed by AxoConsole, or have an Axolet agent reporting metrics from the host.
CAUTION:
Make sure to set data forwarding on your appliances/servers as described in this guide. Different settings like alternate message formats or ports might be valid, but can result in data loss or incorrect parsing.
Default connectors
Sources can send their data to an AxoRouter connector. By default, AxoConsole has AxoRouter connector rules that create the following connectors on AxoRouter deployments.
Parsing and classification is enabled for the default connectors. To create other connectors, or modify the default ones see AxoRouter connector rules. (The default connector rules have “Factory default connector rule” in their description.)
Open ports
By default, AxoRouter accepts data on the following ports (unless you’ve modified the default connector rules):
514 UDP and TCP for RFC3164 (BSD-syslog) and RFC5424 (IETF-syslog) formatted traffic. AxoRouter automatically recognizes and handles both formats.
601 TCP for RFC5424 (IETF-syslog) and RFC3164 (BSD-syslog) formatted traffic. AxoRouter automatically recognizes and handles both formats.
6514 TCP for TLS-encrypted syslog traffic.
4317 TCP for OpenTelemetry log data.
To receive data on other ports or other protocols, configure other connector rules for the AxoRouter host.
For TLS-encrypted syslog connections, create a new connector rule or edit an existing one, and configure the keys and certificates needed to encrypt the connections. For details, see Syslog.
Note
Make sure to enable the ports you’re using on the firewall of your host.
Prerequisites
To configure a source to send data to Axoflow, make sure that:
You have administrative access to the device or host.
The date, time, and time zone are correctly set on the source.
You have an AxoRouter deployed and configured with a Syslog connector that has parsing and classification enabled (by default, every AxoRouter has such connectors). This device is going to receive the data from the source.
You know the IP address the AxoRouter. To find it:
Open the AxoConsole.
Select the Routers or the Topology page.
Select on AxoRouter instance that is going to receive the logs.
Check the Networks > Address field.
Steps
Log in to your device. You need administrator privileges to perform the configuration.
If needed, enable syslog forwarding on the device.
Set AxoRouter as the syslog server. Typically, you can configure the following parameters:
Name or IP Address of the syslog server: Set the address of your AxoRouter.
Protocol: If possible, set TCP or TLS.
Note
If you’re sending data over TLS, make sure to configure a TLS-enabled connector rule in Axoflow.
Syslog Format: If possible, set RFC5424 (or equivalent), otherwise leave the default.
Port: Set a port appropriate for the protocol and syslog format you have configured.
By default, AxoRouter accepts data on the following ports (unless you’ve modified the default connector rules):
514 UDP and TCP for RFC3164 (BSD-syslog) and RFC5424 (IETF-syslog) formatted traffic. AxoRouter automatically recognizes and handles both formats.
601 TCP for RFC5424 (IETF-syslog) and RFC3164 (BSD-syslog) formatted traffic. AxoRouter automatically recognizes and handles both formats.
6514 TCP for TLS-encrypted syslog traffic.
4317 TCP for OpenTelemetry log data.
To receive data on other ports or other protocols, configure other connector rules for the AxoRouter host.
For TLS-encrypted syslog connections, create a new connector rule or edit an existing one, and configure the keys and certificates needed to encrypt the connections. For details, see Syslog.
Note
Make sure to enable the ports you’re using on the firewall of your host.
Add the source to AxoConsole.
Open the AxoConsole and select Topology.
Select Add Item > Source.
If the source is actively sending data to an AxoRouter instance, select Detected, then select your source(s) and select Add Selected Source(s).
Otherwise, select the vendor and product corresponding to your source from the Predefined sources, then enter the parameters of the source, like IP address and FQDN.
Note
During log tapping, you can add hosts that are actively sending data to an AxoRouter instance by clicking Register source.
(Optional) Add Path manually. That’s needed only when AxoConsole can’t detect the path based on the IP address and the FQDN, and you haven’t yet configured the source to send data to the router.
Note
If your syslog source is running syslog-ng, Splunk Connect for Syslog (SC4S), or AxoSyslog as its log forwarder agent, consider installing Axolet on the host and instrumenting the configuration of the log forwarder to receive detailed metrics about the host and the processed data. For details, see Manage and monitor the pipeline.
10.2 - Edge collection rules
Collection rules define how edge hosts collect their local data. To collect data from non-edge sources, see AxoRouter connector rules.
Sources are hosts that are sending data to a data aggregator, like AxoRouter.
Edges are source hosts that are running a collector agent managed by AxoConsole, or have an Axolet agent reporting metrics from the host.
Collection rules are high-level policies that determine how data should be collected on a set of edge hosts based on dynamic host labels.
To see every collection rule configured in AxoConsole, select Sources > Collection Rules from the main menu.
Collection rules have the following main elements:
the way they collect data (for example, from files, or Windows Event Logs), and other specific parameters (for example, the path and filename)
the edge selector, which determines the list of edge hosts that will create a collector based on that rule.
You can use any labels and metadata of the edge hosts in the edge selectors, for example, the hostname, or any custom labels. For example, using the label.product = windows selector will create a collector only on Windows hosts.
Selecting a collection rule shows the details of the rule, including:
The list of Matched hosts: the edge hosts that will have a collector based on that rule. If you click on the name of a matched host, the Collection Rules page of the AxoRouter host opens, showing you the collectors configured for that host.
The Status of the rule:
Idle: The rule doesn’t match any hosts currently.
Provisioned: Connectors based on this rule were successfully provisioned for every matching host.
Error: Some error(s) occurred while provisioning connectors based on this rule. See the Status message field for details.
Unknown: The rule is in an unknown state.
Attributes: Various significant attributes of connectors provisioned based on this rule.
Create collection rule
To create a new connector rule, complete the following steps.
Select Routers > Connector Rules > Add Rule. (Alternatively, you can select Add Connector > Create a connector rule on the Connectors page of an AxoRouter host.)
Select the type of collector you want to create. For example, File Collector. The following collector types are available:
For edge-related metrics, see the metrics beginning with edge_connector
Set the Edge Selector for the collection rule. The selector determines which edge hosts will have a collector based on this collection rule.
Only edge hosts will match the rule.
If you leave the Edge Selector field empty, the rule will match every edge host.
To select only a specific host, set the name field to the name of the host as selector.
If you set multiple fields in the selector, the collection rule will apply only to edge hosts that match all elements of the selector. (There in an AND relationship between the fields.) For example, label.location = us-east-1 AND label.product = windows
(Optional) Enter a Suffix for the collection rule. This suffix will be used in the name of the collector instances created on the edge hosts. For example, if the name of a matching edge host is “my-edge”, and the suffix of the rule is “otel-file-collector”, the collector created for the edge will be named “my-edge-otel-file-collector”.
If the Suffix field is empty, the name of the collection rule is used instead.
(Optional) Enter a description for the rule.
Configure the options specific to the collector type. For details, see the specific pages:
Change the Edge Selector of the collection rule to match the new host.
Find the collection rule you want to modify:
Select Sources > Collection Rules from the main menu, then select the collection rule you want to modify.
Alternatively, find the edge host whose collector you want to modify on the Topology page, then select Collection Rules. Find the collection rule you want to modify, then select ⋮ > Edit collection rule.
Modify the configuration of the collection rule as needed.
CAUTION:
The changes are applied immediately after you click Update. Double-check your changes to avoid losing data.
Select Update.
Add edge host to existing collection rule
To add an edge host to an existing collector rule, you have two options, depending on the Edge Selector of the collection rule:
To create a new Collection Rule that collects data from files on edge hosts, complete the following steps:
Select Sources > Collection Rules > Add Rule. (Alternatively, you can select Add Collector > Create a collection rule on the Collectors page of an edge host.)
Select File Collector.
Configure the connector rule.
Enter a name for the collection rule into the Rule Name field.
For edge-related metrics, see the metrics beginning with edge_connector
Set the Edge Selector for the collection rule. The selector determines which edge hosts will have a collector based on this collection rule.
Only edge hosts will match the rule.
If you leave the Edge Selector field empty, the rule will match every edge host.
To select only a specific host, set the name field to the name of the host as selector.
If you set multiple fields in the selector, the collection rule will apply only to edge hosts that match all elements of the selector. (There in an AND relationship between the fields.) For example, label.location = us-east-1 AND label.product = windows
(Optional) Enter a Suffix for the collection rule. This suffix will be used in the name of the collector instances created on the edge hosts. For example, if the name of a matching edge host is “my-edge”, and the suffix of the rule is “otel-file-collector”, the collector created for the edge will be named “my-edge-otel-file-collector”.
If the Suffix field is empty, the name of the collection rule is used instead.
(Optional) Enter a description for the rule.
Enter the path of the log file, or a pattern to match multiple files into the File pattern field, for example: C:\Windows\System32\DNS\dns.log or /path/to/**/*.log
CAUTION:
On Linux hosts, the collector runs as the axoflow-otel-collector user, which is a member of the adm and systemd-journal groups. Make sure that the axoflow-otel-collector user has read access to the file you want to collect logs from. Usually, the adm group can read logs from the /var/log/ directory on Debian-based systems, but not on RHEL-based systems.
You can use the following special characters:
*: Matches one or more characters that aren’t path separators.
/**/: Matches zero or more directories.
?: Matches a single non-path-separator character.
[class]: Matches any single non-path-separator character from the specified class. The following classes are available:
[abc123]: Matches any single character of the specified characters.
[a-z0-9]: Matches any single alphanumeric character in the range of a-z or 0-9.
[^class] or [!class]: Negates the class, so it matches any single character which does not match the class.
To apply a specific parser on the messages of the log file, select it from the Log format field. Currently Windows DNS and DHCP log files are supported.11
Select Add. Based on the collection rule, Axoflow automatically creates collectors on the edge hosts that match the Edge Selector.
CAUTION:
Make sure to configure Data Forwarding Rules for your edge hosts to transfer the collected data to the OpenTelemetry connector of an AxoRouter.
The name of the collector that collected the message.
edge_connector_type
otelFile
edge_connector_label_
Labels set by the collector. By default: vendor:opentelemety, product:otel-file
edge_connector_rule_id
The ID of the Collector Rule resource in Axoflow that created the collector.
edge_flow_name
The name of the data forwarding rule that sent the message.
Advanced options
Exclude file pattern: Exclude some files that match the File pattern. You can use the same special characters as in the File pattern field.
Exclude older than: Exclude files whose modification time is older than the specified value, for example: 1h, 24h, 7d.
Multi-line start pattern: Regex pattern to identify the start of a multi-line log entry. Mutually exclusive with Multi-line end pattern.
Multi-line end pattern: Regex pattern to identify the end of a multi-line log entry. Mutually exclusive with Multi-line start pattern.
Multi-line omit pattern: If enabled, the lines matching the multiline pattern are omitted from the entry.
Force flush period: Always flush the current batch if the after the specified period. Example values: 1s, 5m, 1h. Default value: 500ms
Encoding: Specifies the encoding of the file being read. Default value: utf-8. The following values are supported:
nop: No encoding validation. Treats the file as a stream of raw bytes
utf-8: UTF-8 encoding
utf-8-raw: UTF-8 encoding without replacing invalid UTF-8 bytes
utf-16le: UTF-16 encoding with little-endian byte order
utf-16be: UTF-16 encoding with big-endian byte order
ascii: ASCII encoding
big5: The Big5 Chinese character encoding
Poll interval: The duration between filesystem polls, for example: 1s, 5m, 1h. Default value: 200ms
Retry on failure max elapsed time: Maximum time (including retries) to send a log batch to a downstream consumer before discarding it, for example: 1s, 5m, 1h. Retrying never stops if set to 0. Default value 0
Initial buffer size: The initial size (in KiB) of the buffer to read file headers and logs. The buffer will grow as needed; larger values may cause unnecessary memory allocation, while smaller values may require multiple copies during growth. Default value: 16KiB
Max log size: Maximum size of a log entry in megabytes. Larger log entries will be truncated. Default value: 1MiB
Max concurrent files: Maximal number of files to read from in parallel.
Max batches: Maximum number of batches to keep in memory; applicable only when more than 1024 files match the File pattern.
Compression: Specifies the compression format of the files being read. Possible values are the empty string, gzip, and auto. Use auto when your File pattern matches a mix of compressed and uncompressed files.
Start at: Specifies where to start reading logs on startup: beginning or end of the file. Default value: beginning
10.2.2 - Journald Collector
Collect logs from the journald system service of Linux-based edge hosts.
To create a new Collection Rule that collects logs from journald, complete the following steps:
Select Sources > Collection Rules > Add Rule. (Alternatively, you can select Add Collector > Create a collection rule on the Collectors page of an edge host.)
Select Journald Collector.
Configure the connector rule.
Enter a name for the collection rule into the Rule Name field.
For edge-related metrics, see the metrics beginning with edge_connector
Set the Edge Selector for the collection rule. The selector determines which edge hosts will have a collector based on this collection rule.
Only edge hosts will match the rule.
If you leave the Edge Selector field empty, the rule will match every edge host.
To select only a specific host, set the name field to the name of the host as selector.
If you set multiple fields in the selector, the collection rule will apply only to edge hosts that match all elements of the selector. (There in an AND relationship between the fields.) For example, label.location = us-east-1 AND label.product = windows
(Optional) Enter a Suffix for the collection rule. This suffix will be used in the name of the collector instances created on the edge hosts. For example, if the name of a matching edge host is “my-edge”, and the suffix of the rule is “otel-file-collector”, the collector created for the edge will be named “my-edge-otel-file-collector”.
If the Suffix field is empty, the name of the collection rule is used instead.
(Optional) Enter a description for the rule.
(Optional) To read older entries from the journal files, set Start at to Beginning. Otherwise, Axoflow agent will only forward the journal entries that are created after the collector has been deployed.
(Optional) To read only the entries from specific journald units, list the units in the Filter units field (for example, nginx.service). By default, Axoflow agent reads the entries of every unit. To list the units available on a host, run the following command on the host: sudo systemctl list-units
(Optional) To read only entries with the specified or higher priority, enter the priority value into the Priority filter field. Default value: info (so debug level entries are omitted). The possible values in decreasing order are: emerg, alert, crit, err, warning, notice, info, debug.
The name of the collector that collected the message.
edge_connector_type
otelJournald
edge_connector_label_
Labels set by the collector. By default: vendor:opentelemety, product:otel-journald
edge_connector_rule_id
The ID of the Collector Rule resource in Axoflow that created the collector.
edge_flow_name
The name of the data forwarding rule that sent the message.
Advanced options
Note that if you set more than one filter-like fields (for example, Priority filter and Identifiers), Axoflow agent reads only entries that match all filters (there’s a logical AND operator between the fields). Within a field (for example, if you specify multiple Identifiers) the filters have an OR relation, so any matching entry is read (unless it gets excluded by another filter).
Message filter (grep): Read only entries where the MESSAGE field matches the specified regular expression.
Journal directory: Specifies the directory containing journal files to read entries from. Relative to the Root path. Default value: /run/log/journal or /run/journal, depending on the platform.
Journal files: Specifies the list of journal files to read entries from. Relative to the Root path. By default it’s empty, meaning that all files will be read.
Identifiers: Read only entries of the listed message identifiers (SYSTEMD_IDENTIFIER), for example, 2.
Retry on failure max elapsed time: Maximum amount of time (including retries) spent trying to send a logs batch to AxoRouter, for example, 5 minutes. When this value is reached, the data that wasn’t sent is discarded. Default value: 0 (keep retrying indefinitely)
Root path: The chroot to use when executing the journalctl command. By default, it’s empty (no chroot is used). To set a path, use an absolute path. Note that if you set a root path, other options of the collector must be set relative to the root path (for example, Journal directory), while others must be absolute (for example, Journalctl path).
Journalctl path: The journalctl command to execute. Relative to the Root path, unless the Root path is set, in which case Journalctl path must be absolute. Default value: journalctl
Include very long and misformatted entries: Read very long logs and logs with unprintable characters.
Convert message bytes to string: If the MESSAGE field of an entry incudes an array of bytes, convert the array to string.
Kernel messages only: Read only kernel messages (dmesg). This shows logs from the current boot and that match _TRANSPORT=kernel.
Merge all journals: Read from all available journals, including remote ones.
10.2.3 - Windows Event Log
Collect logs from the Event Log of the host. You can:
To create a new Collection Rule that collects data from files on edge hosts, complete the following steps:
Select Sources > Collection Rules > Add Rule. (Alternatively, you can select Add Collector > Create a collection rule on the Collectors page of an edge host.)
Select Windows Event Log.
Configure the connector rule.
Enter a name for the collection rule into the Rule Name field.
For edge-related metrics, see the metrics beginning with edge_connector
Set the Edge Selector for the collection rule. The selector determines which edge hosts will have a collector based on this collection rule.
Only edge hosts will match the rule.
If you leave the Edge Selector field empty, the rule will match every edge host.
To select only a specific host, set the name field to the name of the host as selector.
If you set multiple fields in the selector, the collection rule will apply only to edge hosts that match all elements of the selector. (There in an AND relationship between the fields.) For example, label.location = us-east-1 AND label.product = windows
(Optional) Enter a Suffix for the collection rule. This suffix will be used in the name of the collector instances created on the edge hosts. For example, if the name of a matching edge host is “my-edge”, and the suffix of the rule is “otel-file-collector”, the collector created for the edge will be named “my-edge-otel-file-collector”.
If the Suffix field is empty, the name of the collection rule is used instead.
(Optional) Enter a description for the rule.
Set how to collect the event logs:
Select which Event Logs to collect.
To collect all Event Logs from the selected built-in channels, select Stream (channels), then the channels to collect data from: Application, System, Security, Setup, and ForwardedEvents.
To use a custom query, select Stream (XML query), then enter the event filter query into the Query field. This query specifies which events are collected by the subscription. For details on the query syntax, see the Microsoft documentation. A single query can retrieve events from a maximum of 256 different channels. For example, the following example queries every event from the Application, Security, System, and Setup channels.
To collect data from an EVTX file, select EVTX Archive (file path), then enter the path to the file to read, for example %SystemRoot%\System32\example.evtx or D:\example.evtx.
The name of the collector that collected the message.
edge_connector_type
windowsEventLog
edge_connector_label_
Labels set by the collector. By default: vendor:microsoft, product:windows-event-log
edge_connector_rule_id
The ID of the Collector Rule resource in Axoflow that created the collector.
edge_flow_name
The name of the data forwarding rule that sent the message.
Advanced options
Max reads: The maximum number of records to read, before beginning a new batch.
Poll interval: The duration between filesystem polls, for example: 1s, 5m, 1h. Default value: 200ms
Retry on failure max elapsed time: Maximum time (including retries) to send a log batch to a downstream consumer before discarding it, for example: 1s, 5m, 1h. Retrying never stops if set to 0. Default value 0
Start at: Specifies where to start reading logs on startup: beginning or end of the file. Default value: beginning
Ignore channel errors: If enabled, the connector keeps working if it cannot open an event log channel.
Raw: If disabled, the body of the emitted log records will contain a structured representation of the event. If enabled, the body will be the original XML string.
Include log.record.original: If enabled, log.record.original is added to the attributes of the event. This stores the original XML string as configured in Suppress rendering info.
Suppress rendering info: If disabled, additional syscalls may be made to retrieve detailed information about the event. If enabled, some unresolved values may be present in the event.
10.2.4 - Windows Event Tracing
Collect logs from Event Tracing for Windows (ETW).
To create a new Collection Rule that collects Event Tracing data from on edge hosts, complete the following steps:
Select Sources > Collection Rules > Add Rule. (Alternatively, you can select Add Collector > Create a collection rule on the Collectors page of an edge host.)
Select Windows Event Tracing.
Configure the connector rule.
Enter a name for the collection rule into the Rule Name field.
For edge-related metrics, see the metrics beginning with edge_connector
Set the Edge Selector for the collection rule. The selector determines which edge hosts will have a collector based on this collection rule.
Only edge hosts will match the rule.
If you leave the Edge Selector field empty, the rule will match every edge host.
To select only a specific host, set the name field to the name of the host as selector.
If you set multiple fields in the selector, the collection rule will apply only to edge hosts that match all elements of the selector. (There in an AND relationship between the fields.) For example, label.location = us-east-1 AND label.product = windows
(Optional) Enter a Suffix for the collection rule. This suffix will be used in the name of the collector instances created on the edge hosts. For example, if the name of a matching edge host is “my-edge”, and the suffix of the rule is “otel-file-collector”, the collector created for the edge will be named “my-edge-otel-file-collector”.
If the Suffix field is empty, the name of the collection rule is used instead.
(Optional) Enter a description for the rule.
Select the configuration profile to use. The following profiles are available:
DNS server (full trace): A pre-defined profile for collecting every available DNS server traces.
DNS server (queries only): A pre-defined profile for collecting only DNS queries.
Note that if you set an advanced option when using a pre-defined profile, your changes override the related default setting of the pre-defined profile.
Select Add. Based on the collection rule, Axoflow automatically creates collectors on the edge hosts that match the Edge Selector.
CAUTION:
Make sure to configure Data Forwarding Rules for your edge hosts to transfer the collected data to the OpenTelemetry connector of an AxoRouter.
Note
When using Log tapping, ETW events look a bit weird: the body of these events is empty. That’s normal, the reason for that is that everything is sent as metadata.
The name of the collector that collected the message.
edge_connector_type
windowsEventTracing
edge_connector_label_
Labels set by the collector. By default: vendor:microsoft, product:windows-event-tracing
edge_connector_rule_id
The ID of the Collector Rule resource in Axoflow that created the collector.
edge_flow_name
The name of the data forwarding rule that sent the message.
Advanced options
Note that if you set an advanced option when using a pre-defined profile, your changes override the related default setting of the pre-defined profile.
Provider: The provider to subscribe to, for example, Microsoft-Windows-DNSServer for DNS logs. For a complete list, open a command prompt on the edge host and run logman query providers.
Note that provider name is case sensitive. Alternatively, you can use the GUID of the provider as well, in the following format: {9e814aad-3204-11d2-9a82-006008a86939}. If you’re manually setting the provider, consider enabling the Ignore missing provider option as well.
Level: Log level of trace events to be included. Specifying a log level means that all higher priority log levels will be collected as well. Possible values are (starting with the highest priority): critical, error, warning, information, verbose.
Ignore missing provider: Continue working if the specified provider is missing from the host.
CAUTION:
If this option is disabled and the provider is missing, the all other connectors of the agent can stop, not just the ETW connectors.
Match any keywords: Collect only traces that match at least one of the specified keywords of the provider. Note that these keywords are not literal strings, but bitmasks that correspond to the specific provider. To match on multiple keywords, you have to add the bitmasks of the corresponding keywords.
Match all keywords: Collect only traces that match all of the specified keywords of the provider. Note that these keywords are not literal strings, but bitmasks that correspond to the specific provider. To match on multiple keywords, you have to add the bitmasks of the corresponding keywords.
Buffer size: Buffer size allocated for each ETW trace session, in kilobytes. Minimum is 4, maximum is 16384.
Minimum buffers: Minimum number of buffers allocated for each ETW trace session. Note that the minimum and maximum buffers behave like hints to the ETW subsystem and aren’t guaranteed to be allocated as specified.
Maximum buffers: Maximum number of buffers allocated for each ETW trace session. Note that the minimum and maximum buffers behave like hints to the ETW subsystem and aren’t guaranteed to be allocated as specified.
Flush time: How often, in seconds, any non-empty trace buffers are flushed. 0 will enable a default timeout of 1 second.
Event buffer size: Number of ETW events the ETW receiver stores in memory for processing.
Number of workers: Number of workers that process ETW events.
10.3 - Data forwarding from edge hosts
To send data from an edge host to an AxoRouter, create a data forwarding rule.
Sources are hosts that are sending data to a data aggregator, like AxoRouter.
Edges are source hosts that are running a collector agent managed by AxoConsole, or have an Axolet agent reporting metrics from the host.
Data forwarding rules are high-level policies that determine how data should be forwarded from a set of edge hosts to an AxoRouter’s OpenTelemetry connector. You can use dynamic host labels to specify the edge hosts that the forwarding rule applies to.
To see every data forwarding rule configured in AxoConsole, select Sources > Forwarding Rules from the main menu.
Data forwarding rules have the following main elements:
the edge selector, which determines the list of edge hosts that will create a data forwarding rule based on that rule.
You can use any labels and metadata of the edge hosts in the edge selectors, for example, the hostname, or any custom labels. For example, using the label.product = windows selector will create a collector only on Windows hosts.
the Router connector to send the data to. This must be an OpenTelemetry connector of an AxoRouter.
Selecting a data forwarding rule shows the details of the rule, including the list of Matched edges.
Create data forwarding rule
To create a new data forwarding rule, complete the following steps.
If the primary IP address (the first IP address shown in the Network addresses section on the Routers page for each AxoRouter) is not accessible from your edge hosts, set a Network address override (IP address or an FQDN) that’s accessible. Otherwise, data forwarding from edge hosts will fail.
Select Sources > Forwarding Rules > Add Rule.
Enter a name for the collection rule into the Rule Name field.
If you leave the Edge Selector field empty, the rule will match every edge host.
To select only a specific host, set the name field to the name of the host as selector.
If you set multiple fields in the selector, the collection rule will apply only to edge hosts that match all elements of the selector. (There in an AND relationship between the fields.) For example, label.location = us-east-1 AND label.product = windows
Select Add to create and immediately apply the data forwarding rule to the matching edge hosts. Alternatively, select Add as draft to create the rule in a disabled state. You can enable the rule later on the Data Sources > Forwarding Rules page.
Modify forwarding rule
To modify an existing data forwarding rule, complete the following steps.
Note
You cannot directly modify the data forwarding settings of an edge host, only via modifying a data forwarding rule.
Modifying a rule affects every edge host that matches the Edge Selector of the rule.
To apply an existing rule to a new edge host, you can:
Change the Edge Selector of the rule to match the new host.
Find the data forwarding rule you want to modify:
Select Sources > Forwarding Rules from the main menu, then select the rule you want to modify.
Alternatively, find the edge host whose data forwarding you want to modify on the Topology page, then select Forwarding Rules. Find the rule you want to modify, click on its name to display its details, then select Edit.
Modify the configuration of the data forwarding rule as needed.
CAUTION:
The changes are applied immediately after you click Update. Double-check your changes to avoid losing data.
Select Update.
Add edge host to existing forwarding rule
To add an edge host to an existing data forwarding rule, you have two options, depending on the Edge Selector of the data forwarding rule:
Modify the labels of the edge host so it matches the edge selector of the rule.
10.4 - AxoRouter connector rules
Connectors define the methods and entry points where AxoRouter receives data from the sources. To collect data from edge hosts, see Edge collection rules.
In addition to providing a simple protocol specific listener, Connectors implement critical processing steps - for example classification and parsing - right at the ingestion point to enrich data before it gets processed by Flows.
On top of this, Connector rules are high-level policies that determine what kind of Connectors should be available on a set of AxoRouter instances based on dynamic host labels.
To see every connector rule configured in AxoConsole, select Routers > Connector Rules from the main menu.
Connector rules have the following main elements:
the way they accept data (for example, via syslog, using the OpenTelemetry protocol), and other protocol-specific parameters (for example, port number)
the router selector, which determines the list of AxoRouter instances that will create a connector based on that rule.
You can use any labels and metadata of the AxoRouter hosts in the Router selectors, for example, the hostname of the AxoRouter, or any custom labels.
If you leave the Router Selector field empty, the selector will match every AxoRouter instance.
To select only a specific AxoRouter instance, set the name field to the name of the instance as selector. For example, name = my-axorouter.
If you set multiple fields in the selector, the selector will match only AxoRouter instances that match all elements of the selector. (There in an AND relationship between the fields.)
For example, using the label.wec = enabled selector on a Windows Event Collector (WEC) rule will create a WEC connector on AxoRouter hosts that have the wec label set to enabled.
Selecting a connector rule shows the details of the connector rule, including:
The list of Matched hosts: the AxoRouter deployments that will have a connector based on that connector rule. If you click on the name of a matched router, the Connectors page of the AxoRouter host opens, showing you the connectors configured for that host.
The Status of the rule:
Idle: The rule doesn’t match any hosts currently.
Provisioned: Connectors based on this rule were successfully provisioned for every matching host.
Error: Some error(s) occurred while provisioning connectors based on this rule. See the Status message field for details.
Unknown: The rule is in an unknown state.
Attributes: Various significant attributes of connectors provisioned based on this rule.
Create connector rule
To create a new connector rule, complete the following steps.
Select Routers > Connector Rules > Add Rule. (Alternatively, you can select Add Connector > Create a connector rule on the Connectors page of an AxoRouter host.)
Select the type of connector you want to create. For example, OpenTelemetry. The following connector types are available:
Enter a name for the connector rule into the Rule Name field.
(Optional) Add labels to the connector rule. You will be able to use these labels in Flow Processing steps, for example, in the Query field of Select Messages steps. For details about the message schema and the related connector-specific fields, see the meta.connector object.
Set the Router Selector for the connector rule. The selector determines which AxoRouter instances will have a connector based on this connector rule.
You can use any labels and metadata of the AxoRouter hosts in the Router selectors, for example, the hostname of the AxoRouter, or any custom labels.
If you leave the Router Selector field empty, the selector will match every AxoRouter instance.
To select only a specific AxoRouter instance, set the name field to the name of the instance as selector. For example, name = my-axorouter.
If you set multiple fields in the selector, the selector will match only AxoRouter instances that match all elements of the selector. (There in an AND relationship between the fields.)
(Optional) Enter a Suffix for the connector rule. This suffix will be used in the name of the connector instances created on the AxoRouter hosts. The name of the connector instance follows the <name-of-AxoRouter>-<name-of-connector-rule>-<suffix> schema. For example, if the name of a matching AxoRouter instance is “my-axorouter”, the name of the connector rule is “otlp-1” and the suffix of the rule is “my-suffix”, the connector created for the AxoRouter will be named “my-axorouter-otlp-1-my-suffix”.
If the Suffix field is empty, the name of the connector rule is used instead.
(Optional) Enter a description for the rule.
If needed, enable the Classify and Parse preprocessing steps so AxoRouter automatically identifies and parses messages sent by supported data sources. If your source is not listed, contact us.
Enabling these options processes all data received by the connectors created based on this connector rule. If you want to apply classification and parsing more selectively, you can use the Classify and Parse processing steps in your Flows.
Note that the Parse processing step requires Classify to be enabled. Parsing automatically parses the data from the content of the message, and replaces the message content (the log.body field in the internal message schema) with the structured information.
(Optional) If needed, you can add other preprocessing steps to the connector rule. You can use the same processing steps as in flows. These can be useful if you use a dedicated connector rule to fix or annotate data coming from some specific sources.
Configure the protocol-specific settings. For details, see the specific pages:
Axoflow automatically creates connectors on the AxoRouter hosts that match the Router Selector.
Make sure to enable the ports you’ve configured in the connector on the firewall of the AxoRouter host, and on other firewalls between the AxoRouter host and your data sources.
Modify connector rule
To modify an existing connector rule, complete the following steps.
Note
You cannot directly modify the connector of an AxoRouter host, only via modifying a connector rule.
Modifying a connector rule affects every AxoRouter that matches the Router Selector of the rule.
To apply an existing connector rule to a new AxoRouter instance, you can:
Change the Router Selector of the connector rule to match the new host.
Find the connector rule you want to modify:
Select Routers > Connector Rules from the main menu, then select the connector rule you want to modify.
Alternatively, find the AxoRouter instance whose connector you want to modify on the Topology page, then select Connector Rules. Find the connector you want to modify, then select ⋮ > Edit connector rule.
Modify the configuration of the connector rule as needed.
CAUTION:
The changes are applied immediately after you click Update. Double-check your changes to avoid losing data.
Select Update.
Add AxoRouter to existing connector rule
To add an AxoRouter to an existing connector rule, you have two options, depending on the Router Selector of the connector rule:
If you want to enable TLS encryption for this connector to encrypt the communication with the sources, you’ll need to set appropriate keys and certificates.
CAUTION:
Copy the keys and certificates to AxoRouter before starting to configure the connector. Otherwise, you won’t be able to make configuration changes that require reloading the AxoRouter service, including starting log tapping or flow tapping.
Note the following points:
Keys and certificates must be in PEM format.
If the file contains a certificate chain, the file must begin with the certificate of the host, followed by the CA certificate that signed the certificate of the host, and any other signing CAs in order.
You must manually copy these files to their place on the AxoRouter host, currently you can’t distribute them from AxoConsole.
The files must be readable by the axorouter service.
The recommended path for certificates is under /etc/axorouter/user-config/ (for example, /etc/axorouter/user-config/tls-key.pem). (If you need to use a different path, you have to append an option like -v /your/path:/your/path to the AXOROUTER_PODMAN_ARGS variable of /etc/axorouter/container.env.)
When referring to the key or certificate during when configuring the connector, use absolute paths (for example, /etc/axorouter/user-config/tls-key.pem).
Add new OpenTelemetry connector
To add a new connector to an AxoRouter host, complete the following steps:
Select Routers > Connector Rules > Add Rule. (Alternatively, you can select Add Connector > Create a connector rule on the Connectors page of an AxoRouter host.)
Select OpenTelemetry.
Configure the connector rule.
Enter a name for the connector rule into the Rule Name field.
(Optional) Add labels to the connector rule. You will be able to use these labels in Flow Processing steps, for example, in the Query field of Select Messages steps. For details about the message schema and the related connector-specific fields, see the meta.connector object.
Set the Router Selector for the connector rule. The selector determines which AxoRouter instances will have a connector based on this connector rule.
You can use any labels and metadata of the AxoRouter hosts in the Router selectors, for example, the hostname of the AxoRouter, or any custom labels.
If you leave the Router Selector field empty, the selector will match every AxoRouter instance.
To select only a specific AxoRouter instance, set the name field to the name of the instance as selector. For example, name = my-axorouter.
If you set multiple fields in the selector, the selector will match only AxoRouter instances that match all elements of the selector. (There in an AND relationship between the fields.)
(Optional) Enter a Suffix for the connector rule. This suffix will be used in the name of the connector instances created on the AxoRouter hosts. The name of the connector instance follows the <name-of-AxoRouter>-<name-of-connector-rule>-<suffix> schema. For example, if the name of a matching AxoRouter instance is “my-axorouter”, the name of the connector rule is “otlp-1” and the suffix of the rule is “my-suffix”, the connector created for the AxoRouter will be named “my-axorouter-otlp-1-my-suffix”.
If the Suffix field is empty, the name of the connector rule is used instead.
(Optional) Enter a description for the rule.
If needed, enable the Classify and Parse preprocessing steps so AxoRouter automatically identifies and parses messages sent by supported data sources. If your source is not listed, contact us.
Enabling these options processes all data received by the connectors created based on this connector rule. If you want to apply classification and parsing more selectively, you can use the Classify and Parse processing steps in your Flows.
Note that the Parse processing step requires Classify to be enabled. Parsing automatically parses the data from the content of the message, and replaces the message content (the log.body field in the internal message schema) with the structured information.
(Optional) If needed, you can add other preprocessing steps to the connector rule. You can use the same processing steps as in flows. These can be useful if you use a dedicated connector rule to fix or annotate data coming from some specific sources.
If needed, configure the port number where you want to receive data.
Configure TLS settings for the connector.
Select Server TLS.
Set the path to the key and certificates.
When using TLS, set the paths for the certificates and keys used for the TLS-encrypted communication with the clients. For details, see Prerequisites.
Server certificate path: The certificate that AxoRouter shows to the clients.
Server private key path: The private key of the server certificate.
CA certificate path: The CA certificate that AxoRouter uses to verify the certificate of the sender if Verify peer certificate is enabled.
To require the certificates of the clients to be valid, select Verify client certificate. When selected, the certificate of the client cannot be self-signed, and its common name must match the hostname or IP address of the client.
(Optional) Adjust the flow-control related options if needed.
Log window size: The size (number of messages) of the initial window used in flow control. For details, see the AxoSyslog documentation.
If you change the value of Log window size, the change will affect only new connections, the Log window size of already established connections will not change. To apply the new Log window size value to every connection, restart the axorouter.service service on the Services page of the matching AxoRouters. A simple configuration reload is NOT sufficient.
If the connector rule is receiving data using the UDP protocol, always restart the axorouter.service service on the Services page of the matching AxoRouters.
Log fetch limit: The maximum number of messages fetched from a source during a single poll loop. For details, see the AxoSyslog documentation.
Select Add.
Axoflow automatically creates connectors on the AxoRouter hosts that match the Router Selector.
Make sure to enable the ports you’ve configured in the connector on the firewall of the AxoRouter host, and on other firewalls between the AxoRouter host and your data sources.
The Syslog connector can receive all kinds of syslog messages. You can configure it to receive data on specific ports, and apply parsing, classification, and enrichment to the messages, in addition to standard syslog parsing.
Prerequisites
If you want to enable TLS encryption for this connector to encrypt the communication with the sources, you’ll need to set appropriate keys and certificates.
CAUTION:
Copy the keys and certificates to AxoRouter before starting to configure the connector. Otherwise, you won’t be able to make configuration changes that require reloading the AxoRouter service, including starting log tapping or flow tapping.
Note the following points:
Keys and certificates must be in PEM format.
If the file contains a certificate chain, the file must begin with the certificate of the host, followed by the CA certificate that signed the certificate of the host, and any other signing CAs in order.
You must manually copy these files to their place on the AxoRouter host, currently you can’t distribute them from AxoConsole.
The files must be readable by the axorouter service.
The recommended path for certificates is under /etc/axorouter/user-config/ (for example, /etc/axorouter/user-config/tls-key.pem). (If you need to use a different path, you have to append an option like -v /your/path:/your/path to the AXOROUTER_PODMAN_ARGS variable of /etc/axorouter/container.env.)
When referring to the key or certificate during when configuring the connector, use absolute paths (for example, /etc/axorouter/user-config/tls-key.pem).
Add new syslog connector
To create a new syslog connector, complete the following steps:
Select Routers > Connector Rules > Add Rule. (Alternatively, you can select Add Connector > Create a connector rule on the Connectors page of an AxoRouter host.)
Select Syslog.
Select the template to use one of the standard syslog ports and networking protocols, for example, UDP 514 for the RFC3164 syslog protocol.
To configure a different port, or to specify the protocol elements manually, select Custom.
Configure the connector rule.
Enter a name for the connector rule into the Rule Name field.
(Optional) Add labels to the connector rule. You will be able to use these labels in Flow Processing steps, for example, in the Query field of Select Messages steps. For details about the message schema and the related connector-specific fields, see the meta.connector object.
Set the Router Selector for the connector rule. The selector determines which AxoRouter instances will have a connector based on this connector rule.
You can use any labels and metadata of the AxoRouter hosts in the Router selectors, for example, the hostname of the AxoRouter, or any custom labels.
If you leave the Router Selector field empty, the selector will match every AxoRouter instance.
To select only a specific AxoRouter instance, set the name field to the name of the instance as selector. For example, name = my-axorouter.
If you set multiple fields in the selector, the selector will match only AxoRouter instances that match all elements of the selector. (There in an AND relationship between the fields.)
(Optional) Enter a Suffix for the connector rule. This suffix will be used in the name of the connector instances created on the AxoRouter hosts. The name of the connector instance follows the <name-of-AxoRouter>-<name-of-connector-rule>-<suffix> schema. For example, if the name of a matching AxoRouter instance is “my-axorouter”, the name of the connector rule is “otlp-1” and the suffix of the rule is “my-suffix”, the connector created for the AxoRouter will be named “my-axorouter-otlp-1-my-suffix”.
If the Suffix field is empty, the name of the connector rule is used instead.
(Optional) Enter a description for the rule.
If needed, enable the Classify and Parse preprocessing steps so AxoRouter automatically identifies and parses messages sent by supported data sources. If your source is not listed, contact us.
Enabling these options processes all data received by the connectors created based on this connector rule. If you want to apply classification and parsing more selectively, you can use the Classify and Parse processing steps in your Flows.
Note that the Parse processing step requires Classify to be enabled. Parsing automatically parses the data from the content of the message, and replaces the message content (the log.body field in the internal message schema) with the structured information.
(Optional) If needed, you can add other preprocessing steps to the connector rule. You can use the same processing steps as in flows. These can be useful if you use a dedicated connector rule to fix or annotate data coming from some specific sources.
Select the protocol to use for receiving syslog data: TCP, UDP, or TLS.
When using TLS, set the paths for the certificates and keys used for the TLS-encrypted communication with the clients. For details, see Prerequisites.
CA certificate path: The CA certificate that AxoRouter uses to authenticate the clients.
Server certificate path: The certificate that AxoRouter shows to the clients.
Server private key path: The private key of the server certificate.
(Optional) If explicitly needed for your use case, you can configure Framing manually when using the TCP and TLS protocols. Otherwise, leave it on Auto.
Auto (newlines or octet counts): Auto-detect RFC 5424 framing or no framing. NUL terminated framing cannot be autodetected currently.
RFC 5424 framing (octet counts): The payload contains the length of the message as specified in RFC6587 3.4.1.
No framing (newline separated): Traditional newline-separated messages (non-transparent-framing) as specified in RFC6587 3.4.2.
NUL terminated: Proprietary protocol where (possibly multi-line) messages are separated by a NUL byte. Use this when receiving messages from Splunk Heavy Forwarders using the Axoflow Forwarder Add-on.
Set the Port of the connector. The port number must be unique on the AxoRouter host. AxoConsole will not provision a connector to an AxoRouter if it would cause a port collision, but other software on the given host may already be using the chosen port number (for example, an SSH server on TCP port 22). In this case, AxoRouter won’t be able to reload the configuration and it will indicate an error.
(Optional) If you’re expecting high-volume UDP traffic on your AxoRouter instances that will have this connector, enable UDP loadbalancing by entering the number of UDP sockets to use into the UDP socket count field. The maximum recommended value is the number of cores available in the AxoRouter host.
If the value of UDP socket count is higher than 1 and EBPF load balancing is disabled, messages from a specific source host is always processed by the same socket (based on its IP address:port).
To loadbalance every message, including messages coming from a single host (for example, a high-traffic firewall that send a high volume of messages from a single IP:port pair), you can enable the EBPF load balancing option. Note that if you enable EBPF loadbalancing, messages of the same high-traffic source may be processed out of order. For details on how eBPF loadbalancing works, see the Scaling syslog to 1M EPS with eBPF blog post.
You can also modify the product and vendor labels of the connector. In that case, Axoflow will treat the incoming messages as it was received and classified as data from the specified product. This is useful if you want to send data from a specific product to a dedicated port.
These labels and other parameters of the connector will be available under the meta.connector key as metadata for the messages received via the connector, and can be used in routing decisions and processing steps. You can check the metadata of the messages using log tapping.
Select Add.
Axoflow automatically creates connectors on the AxoRouter hosts that match the Router Selector.
Make sure to enable the ports you’ve configured in the connector on the firewall of the AxoRouter host, and on other firewalls between the AxoRouter host and your data sources.
Protocol-specific connector options
Encoding: The character set of the messages, for example, UTF-8.
Maximum connections: The maximum number of simultaneous connections the connector can receive.
Socket buffer size: The size of the socket buffer (in bytes).
Processing workers: Number of worker threads to use to process the messages received by the source connector. Note that this enables parallel processing, which might cause that the messages will be processed out of order. Increasing the number of worker threads can drastically improve the performance of the source. For details, see the AxoSyslog documentation.
Flow-control options
Log window size: The size (number of messages) of the initial window used in flow control. For details, see the AxoSyslog documentation.
If you change the value of Log window size, the change will affect only new connections, the Log window size of already established connections will not change. To apply the new Log window size value to every connection, restart the axorouter.service service on the Services page of the matching AxoRouters. A simple configuration reload is NOT sufficient.
If the connector rule is receiving data using the UDP protocol, always restart the axorouter.service service on the Services page of the matching AxoRouters.
Enable dynamic window: Enables the dynamic sizing of memory queues by sharing the configured Log window size between active incoming connections dynamically, instead of allocating the same window size to each possible connection. Only available for TCP and TLS.
Log fetch limit: The maximum number of messages fetched from a source during a single poll loop. For details, see the AxoSyslog documentation.
TCP options
TCP Keepalive Time Interval: The interval (number of seconds) between subsequential keepalive probes, regardless of the traffic exchanged in the connection.
TCP Keepalive Probes: The number of unacknowledged probes to send before considering the connection dead.
TCP Keepalive Time: The interval (in seconds) between the last data packet sent and the first keepalive probe.
TLS options
For TLS, you can use the TCP-specific options, and also the following:
Require MTLS: If enabled, the peers must have a TLS certificate, otherwise AxoRouter will reject the connection.
Verify client certificate: If enabled, AxoRouter verifies certificate of the peer, and rejects connections with invalid certificates.
Labels
The AxoRouter syslog connector adds the following meta labels:
Webhook connectors of AxoRouter can be used to receive log events through HTTP(S) POST requests.
You can specify static and dynamic URLs to receive the data. AxoRouter automatically parses the JSON payload of the request, and adds it to the log.body field of the message as a JSON object. Other types of payload (including invalid JSON objects) is added to the log.body field as a string. Note that you can add further parsing to the body using processing steps in Flows, for example, using FilterX or Regex processing steps.
Prerequisites
To receive data via HTTPS, you’ll need a key and a certificate that the connector will show to the clients.
If you want to enable TLS encryption for this connector to encrypt the communication with the sources, you’ll need to set appropriate keys and certificates.
CAUTION:
Copy the keys and certificates to AxoRouter before starting to configure the connector. Otherwise, you won’t be able to make configuration changes that require reloading the AxoRouter service, including starting log tapping or flow tapping.
Note the following points:
Keys and certificates must be in PEM format.
If the file contains a certificate chain, the file must begin with the certificate of the host, followed by the CA certificate that signed the certificate of the host, and any other signing CAs in order.
You must manually copy these files to their place on the AxoRouter host, currently you can’t distribute them from AxoConsole.
The files must be readable by the axorouter service.
The recommended path for certificates is under /etc/axorouter/user-config/ (for example, /etc/axorouter/user-config/tls-key.pem). (If you need to use a different path, you have to append an option like -v /your/path:/your/path to the AXOROUTER_PODMAN_ARGS variable of /etc/axorouter/container.env.)
When referring to the key or certificate during when configuring the connector, use absolute paths (for example, /etc/axorouter/user-config/tls-key.pem).
Add new webhook connector
To add a new connector to an AxoRouter host, complete the following steps:
Select Routers > Connector Rules > Add Rule. (Alternatively, you can select Add Connector > Create a connector rule on the Connectors page of an AxoRouter host.)
Select Webhook.
Configure the connector rule.
Enter a name for the connector rule into the Rule Name field.
(Optional) Add labels to the connector rule. You will be able to use these labels in Flow Processing steps, for example, in the Query field of Select Messages steps. For details about the message schema and the related connector-specific fields, see the meta.connector object.
Set the Router Selector for the connector rule. The selector determines which AxoRouter instances will have a connector based on this connector rule.
You can use any labels and metadata of the AxoRouter hosts in the Router selectors, for example, the hostname of the AxoRouter, or any custom labels.
If you leave the Router Selector field empty, the selector will match every AxoRouter instance.
To select only a specific AxoRouter instance, set the name field to the name of the instance as selector. For example, name = my-axorouter.
If you set multiple fields in the selector, the selector will match only AxoRouter instances that match all elements of the selector. (There in an AND relationship between the fields.)
(Optional) Enter a Suffix for the connector rule. This suffix will be used in the name of the connector instances created on the AxoRouter hosts. The name of the connector instance follows the <name-of-AxoRouter>-<name-of-connector-rule>-<suffix> schema. For example, if the name of a matching AxoRouter instance is “my-axorouter”, the name of the connector rule is “otlp-1” and the suffix of the rule is “my-suffix”, the connector created for the AxoRouter will be named “my-axorouter-otlp-1-my-suffix”.
If the Suffix field is empty, the name of the connector rule is used instead.
(Optional) Enter a description for the rule.
If needed, enable the Classify and Parse preprocessing steps so AxoRouter automatically identifies and parses messages sent by supported data sources. If your source is not listed, contact us.
Enabling these options processes all data received by the connectors created based on this connector rule. If you want to apply classification and parsing more selectively, you can use the Classify and Parse processing steps in your Flows.
Note that the Parse processing step requires Classify to be enabled. Parsing automatically parses the data from the content of the message, and replaces the message content (the log.body field in the internal message schema) with the structured information.
(Optional) If needed, you can add other preprocessing steps to the connector rule. You can use the same processing steps as in flows. These can be useful if you use a dedicated connector rule to fix or annotate data coming from some specific sources.
Select the protocol you want to use: HTTPS or HTTP.
Set the port number where the webhook will receive the POST requests, for example, 8080.
Set the endpoints where the webhook will receive data in the Paths field. You can use static paths, or regular expressions. In regular expressions you can use named capture groups to automatically set macro values in AxoRouter. For example, the /events/(?P<HOST>.*) path sets the hostname for the data received in the request based on the second part of the URL: a request to the /events/my-example-host URL sets the host field of that message to my-example-host.
By default, the /events and /events/(?P<HOST>.*) paths are active.
For HTTPS endpoints, set the path to the Key and the Certificate files. AxoRouter uses these to encrypt the TLS channel. You can use absolute paths (for example, /etc/axorouter/user-config/tls-key.pem). The key and the certificate must be in PEM format.
You must manually copy these files to their place, currently you can’t distribute them from Axoflow.
Select Add.
Axoflow automatically creates connectors on the AxoRouter hosts that match the Router Selector.
Make sure to enable the ports you’ve configured in the connector on the firewall of the AxoRouter host, and on other firewalls between the AxoRouter host and your data sources.
Send a test request to the webhook.
Open the Overview tab of the AxoRouter host where you’ve created the webhook connector and check the IP address or FQDN of the host.
Open a terminal on your computer and send a POST request to the path you’ve configured in the webhook.
Configure the AxoRouter Windows Events connector to collect logs from Microsoft Windows hosts using Windows Event Forwarding (WEF).
The AxoRouter Windows Events connector can receive Windows Event Logs by running a Windows Event Collector (WEC) server. After enabling the Windows Events connector, you can configure your Microsoft Windows hosts to forward their event logs to AxoRouter using Windows Event Forwarding (WEF).
Windows Event Forwarding (WEF) reads any operational or administrative event logged on a Windows host and forwards the events you choose to a Windows Event Collector (WEC) server, in this case AxoRouter. You can:
read all data from specific Event Log channels,
use a custom event filter query, or
read data from a specific EVTX file.
Prerequisites
When using TLS authentication, you need:
A CA certificate (in PEM format) that AxoRouter uses to authenticate the clients.
A certificate and the matching private key (in PEM format) that AxoRouter shows to the clients.
These files must be available on the AxoRouter host and readable by the axorouter service for the connector to work.
Add new Windows Event Log connector
To add a new connector to an AxoRouter host, complete the following steps.
Note
Currently you can configure one Windows Events connector for an AxoRouter.
Select Routers > Connector Rules > Add Rule. (Alternatively, you can select Add Connector > Create a connector rule on the Connectors page of an AxoRouter host.)
Select Windows Events.
Configure the connector rule.
Enter a name for the connector rule into the Rule Name field.
(Optional) Add labels to the connector rule. You will be able to use these labels in Flow Processing steps, for example, in the Query field of Select Messages steps. For details about the message schema and the related connector-specific fields, see the meta.connector object.
Set the Router Selector for the connector rule. The selector determines which AxoRouter instances will have a connector based on this connector rule.
You can use any labels and metadata of the AxoRouter hosts in the Router selectors, for example, the hostname of the AxoRouter, or any custom labels.
If you leave the Router Selector field empty, the selector will match every AxoRouter instance.
To select only a specific AxoRouter instance, set the name field to the name of the instance as selector. For example, name = my-axorouter.
If you set multiple fields in the selector, the selector will match only AxoRouter instances that match all elements of the selector. (There in an AND relationship between the fields.)
(Optional) Enter a Suffix for the connector rule. This suffix will be used in the name of the connector instances created on the AxoRouter hosts. The name of the connector instance follows the <name-of-AxoRouter>-<name-of-connector-rule>-<suffix> schema. For example, if the name of a matching AxoRouter instance is “my-axorouter”, the name of the connector rule is “otlp-1” and the suffix of the rule is “my-suffix”, the connector created for the AxoRouter will be named “my-axorouter-otlp-1-my-suffix”.
If the Suffix field is empty, the name of the connector rule is used instead.
(Optional) Enter a description for the rule.
If needed, enable the Classify and Parse preprocessing steps so AxoRouter automatically identifies and parses messages sent by supported data sources. If your source is not listed, contact us.
Enabling these options processes all data received by the connectors created based on this connector rule. If you want to apply classification and parsing more selectively, you can use the Classify and Parse processing steps in your Flows.
Note that the Parse processing step requires Classify to be enabled. Parsing automatically parses the data from the content of the message, and replaces the message content (the log.body field in the internal message schema) with the structured information.
(Optional) If needed, you can add other preprocessing steps to the connector rule. You can use the same processing steps as in flows. These can be useful if you use a dedicated connector rule to fix or annotate data coming from some specific sources.
Configure the protocol-level settings of the connector.
(Optional) Set the Hostname field. Clients address this hostname. Note that:
This is the hostname that is configured as the Subscription Manager address in the Group Policy Editor.
If unset, the server automatically detects it from the request’s host header.
(Optional) If for some reason you don’t want to run the connector on the default port (5986), adjust the Port field.
Set the paths for the certificates and keys used for the TLS-encrypted communication with the clients.
Use absolute paths (for example, /etc/axorouter/user-config/tls-key.pem). The key and the certificate must be in PEM format. You have to make sure that these files are available on the AxoRouter host. Currently you can’t distribute them from AxoConsole.
CA certificate path: The CA certificate that AxoRouter uses to authenticate the clients. The file can contain multiple issuer certificates to allow clients connecting from multiple different domains simultaneously. If you want to limit which clients are accepted, set the More options > Certificate subject filter field.
Server certificate path: The certificate that AxoRouter shows to the clients. The Common Name must match the hostname used by the clients to contact the server.
Server private key path: The private key of the server certificate.
(Optional) If needed, set the number of workers.
Processing workers: Number of worker threads to use to process the messages received by the source connector. Note that this enables parallel processing, which might cause that the messages will be processed out of order. Increasing the number of worker threads can drastically improve the performance of the source. For details, see the AxoSyslog documentation.
Configure the subscriptions of the connector.
Select Add new Subscription.
(Optional) Set a name for the subscription. If you leave it empty, AxoConsole automatically generates a name.
Enter the event filter query into the Query field. This query specifies which events are collected by the subscription. For details on the query syntax, see the Microsoft documentation.
A single query can retrieve events from a maximum of 256 different channels.
For example, the following example queries every event from the Security, System, Application, and Setup channels.
(Optional) If needed, you can configure other low-level options in the More options section. For details, see Additional options.
Select Add.
Axoflow automatically creates connectors on the AxoRouter hosts that match the Router Selector.
Make sure to enable the ports you’ve configured in the connector on the firewall of the AxoRouter host, and on other firewalls between the AxoRouter host and your data sources.
You can set the following options of the WEC connector under Subscriptions > More options.
Certificate subject filter: A simple string to filter the clients based on the Common Name of their certificate. You can use the * and ? wildcard characters.
UUID: A unique ID for the subscription. If empty, AxoConsole automatically generates it.
Heartbeat interval: The number of seconds before the client sends a heartbeat message. The client sends heartbeat messages if it has no new events to send. Default value: 3600s
Connection retry interval: Time between reconnection attempts. Default value: 60s
Connection retry count: Number of times the client attempts to reconnect if AxoRouter is unreachable. Default value: 10
Max time: The maximum number of seconds the client aggregates new events before sending them in a batch. Default value: 30s
Max elements: The maximum number of events that the client aggregates before sending them in a batch. By default, it’s empty, meaning that only the Max time and Max envelope size options limit the aggregation. Default value: empty
Max envelope size: The maximum number of bytes in the SOAP envelope used to deliver the events. Default value: 512000 bytes
Locale: The language in which rendering information is expected, for example, en-US. Default value: Client choose
Data locale: The language in which numerical data is expected to be formatted, for example, en-US. Default value: Client choose
Read existing events: If enabled (Yes), the event source sends:
all existing events that match the filter, and
any events that subsequently occur for that event source.
If disabled (No), existing events are ignored.
Default value: No
Ignore channel error: Subscription queries that result in errors terminate the processing of the clients. Enable this option to ignore such errors. Default value: Yes
Content format: Determines whether to include rendering information (RenderedText) with events or not (Raw). Default value: Raw
Configure Windows Event Forwarding
To configure Windows Event Forwarding (WEF) on your Windows clients to forward their events to the AxoRouter WEC connector, complete the following steps.
Configure the host so it can validate the certificate of AxoRouter.
Open the Microsoft Management Console (mmc.exe).
Select File > Add/Remove Snap-ins.
Add the Certificates snap-in.
Select Computer Account.
Right-click Personal, then select All Tasks > Import.
Select and import the client certificate file (.p12). The Windows client shows this certificate to AxoRouter.
Import the CA certificate used to issue the certificate of AxoRouter, then move it to Trusted Root Certification Authorities.
Set forwarding security data.
Open CompMgmt.msc.
On domain controller hosts, navigate to Active Directory Users and Computers, select your domain, then select Builtin.
On generic Windows hosts, navigate to Local Users and Groups > Groups > Event Log Readers, then open Event Log Readers Properties.
Add the NETWORK SERVICE account to the Event Log Readers group.
Reboot the host.
Open a command prompt with elevated privileges and run the following commands.
winrm qc -q
winrm set winrm/config/client/auth @{Certificate="true"}
Add a subscription. Use the hostname or IP address of AxoRouter you’ve set in the connector. For example: Server=https://<FQDN-of-AxoRouter>:5986/wsman/SubscriptionManager/WEC,Refresh=<Refresh-interval-in-seconds>,IssuerCA=<fingerprint-of-AxoRouters-root-CA>
The refresh interval determines how often the client checks for changes in the subscriptions. We recommend using 30 seconds during a test period (while you’re fine-tuning your subscriptions), and an hour (3600) or longer in production environments.
During testing and troubleshooting, the Applications and Services Logs\Microsoft\Windows\Eventlog-ForwardingPlugin and Applications and Services Logs\Microsoft\Windows\Windows Remote Management event log channels can be useful.
Metadata fields
The AxoRouter Windows Events connector adds the following fields to the meta variable:
Onboard vendor-specific source devices and hosts to Axoflow so they appear on the Topology page, send logs to AxoRouter, and report host metrics.
Prerequisites
You have administrative access to the source device or host.
You have an AxoRouter deployed and configured with a Syslog connector that has parsing and classification enabled (by default, every AxoRouter has such connectors). This device is going to receive the data from the source device or host.
You know the IP address the AxoRouter. To find it:
Open the AxoConsole.
Select the Routers or the Topology page.
Select on AxoRouter instance that is going to receive the logs.
Check the Networks > Address field.
Onboard a vendor source
To onboard sources that are specifically supported by Axoflow, complete the following steps. Onboarding allows you to collect metrics about the host, and display the host on the Topology page.
Open the AxoConsole.
Select Topology.
Select Add Item > Source.
Add the source to AxoConsole using one of the following methods:
If the source is already sending logs to an AxoRouter instance that is registered in the AxoConsole, select Detected, then select the source.
You can add multiple detected sources in a single step in bulk.
Otherwise, select the type of the source you want to onboard, and follow the on-screen instructions.
Connect the source to the destination or AxoRouter instance it’s sending logs to. If you’ve added the source from the Detected list, you can skip this step, as the path is created automatically.
Select Topology > Add Item > Path.
Select the target router or aggregator this source is sending its data to in the Target host field, for example, axorouter.
Select the Target connector. The connector determines how the destination receives the data (for example, using which protocol or port).
Select Add. The new path appears on the Topology page.
If you haven’t already done so, configure the source to send logs to an AxoRouter instance. For vendor-specific configuration steps, default metadata (labels), and SIEM-specific metadata, see the page for each source.
Note
Unless instructed otherwise, configure your source to send the logs to the Syslog connector of AxoRouter, using the appropriate port. Use RFC5424 if the source supports it.
514 UDP and TCP for RFC3164 (BSD-syslog) and RFC5424 (IETF-syslog) formatted traffic. AxoRouter automatically recognizes and handles both formats.
601 TCP for RFC5424 (IETF-syslog) and RFC3164 (BSD-syslog) formatted traffic. AxoRouter automatically recognizes and handles both formats.
6514 TCP for TLS-encrypted syslog traffic.
10.9.1 - A10 Networks
10.9.1.1 - vThunder
vThunder:
Delivers application load balancing, traffic management, and DDoS protection for enterprise networks.
When sending the data collected from this source to Splunk, Axoflow uses the following sourcetype and index settings:
sourcetype
source
index
a10networks:vThunder:cef
a10networks:vThunder
netwaf
If the Axoflow classification doesn’t set the source field for the message automatically, and you haven’t set it in a flow processing step manually (by setting the meta.destination.splunk.source field), AxoRouter automatically sets the source to the name of the AxoRouter connector that received the message (for example, axorouter-syslog-tcp-514).
Sending data to Google SecOps
When sending the data collected from this source to a dynamic Google SecOps destination, Axoflow sets the following log type: A10_LOAD_BALANCER.
Sending data to Microsoft Sentinel
When sending the data collected from this source to a Microsoft Sentinel destination, Axoflow normalizes the data and sends it to the following table: Syslog.
10.9.2 - Amazon
10.9.2.1 - CloudWatch
CloudWatch:
Monitors AWS resources and applications by collecting metrics, logs, and setting alarms.
Axoflow can collect data from your Amazon CloudWatch. At a high level, the process looks like this:
Deploy an Axoflow Cloud Connector that will collect the data from your CloudWatch. Axoflow Cloud Connector is a simple container that you can deploy into AWS, another cloud provider, or on-prem.
Configure a Flow on AxoConsole that processes and routes the collected data to your destination (for example, Splunk or another SIEM).
Prerequisites
An AWS account with an active subscription.
A virtual machine or Kubernetes node running to deploy Axoflow Cloud Connector on.
An AxoRouter instance that can receive data from the connector. Verify that it has an OpenTelemetry Connector (it’s enabled by default).
You know the IP address the AxoRouter. To find it:
Open the AxoConsole.
Select the Routers or the Topology page.
Select on AxoRouter instance that is going to receive the logs.
Check the Networks > Address field.
The Axoflow Cloud Connector must be able to access the AxoRouter on the port the OpenTelemetry Connector is listening on (by default, port 4317). Depending on where the Axoflow Cloud Connector and AxoRouter are deployed, you might need to adjust firewall and ingress/egress rules in your environment.
Depending on how you want to authenticate Axoflow Cloud Connector, you’ll need an AWS_PROFILE or AWS access keys.
Steps
To collect data from AWS CloudWatch, complete the following steps.
Deploy an Axoflow Cloud Connector.
Access the Kubernetes node or virtual machine where you want to deploy Axoflow Cloud Connector.
Set the following environment variable to the IP address of the AxoRouter where you want to forward the data from CloudWatch. This IP address must be accessible from the connector. You can find the IP address of AxoRouter on the Routers > AxoRouter > Overview page.
exportAXOROUTER_ENDPOINT=<AxoRouter-IP-address>
(Optional) By default, the connector stores positional and other persistence-related data in the /etc/axoflow-otel-collector/storage directory. In case you want to use a different directory, set the STORAGE_DIRECTORY environment variable.
Run the following command to generate a UUID for the connector. AxoConsole will use this ID to identify the connector.
Set TLS encryption to secure the communication between Axoflow Cloud Connector and AxoRouter.
Configure the TLS-related settings of Axoflow Cloud Connector using the following environment variables.
Variable
Required
Default
Description
AXOROUTER_TLS_INSECURE
No
false
Disables TLS encryption if set to true
AXOROUTER_TLS_INCLUDE_SYSTEM_CA_CERTS_POOL
No
false
Set to true to use the system CA certificates
AXOROUTER_TLS_CA_FILE
No
-
Path to the CA certificate file used to validate the certificate of AxoRouter
AXOROUTER_TLS_CA_PEM
No
-
PEM-encoded CA certificate
AXOROUTER_TLS_INSECURE_SKIP_VERIFY
No
false
Set to true to disable TLS certificate verification of AxoRouter
AXOROUTER_TLS_CERT_FILE
No
-
Path to the certificate file of Axoflow Cloud Connector
AXOROUTER_TLS_CERT_PEM
No
-
PEM-encoded client certificate
AXOROUTER_TLS_KEY_FILE
No
-
Path to the client private key file of Axoflow Cloud Connector
AXOROUTER_TLS_KEY_PEM
No
-
PEM-encoded client private key
AXOROUTER_TLS_MIN_VERSION
No
1.2
Minimum TLS version to use
AXOROUTER_TLS_MAX_VERSION
No
-
Maximum TLS version to use
Note
You’ll have to include the TLS-related environment variables you set in the docker command used to deploy Axoflow Cloud Connector.
Configure the authentication that the Axoflow Cloud Connector will use to access CloudWatch. Set the environment variables for the authentication method you want to use.
AWS Profile with a configuration file: Set the region and the AWS_PROFILE
exportAWS_PROFILE=""exportAWS_REGION=""
AWS Credentials: To use AWS access keys, set an access key and a matching secret.
The Axoflow Cloud Connector starts forwarding logs to the AxoRouter instance.
Add the appliance to AxoConsole.
Open the AxoConsole and select Topology.
Select Add Item > Source.
Select AWS CloudWatch.
Enter the IP address and the FQDN of the Axoflow Cloud Connector instance.
Select Add.
Create a Flow to route the data from the AxoRouter instance to a destination. You can use the Labels of this source to select messages from this source.
Labels
Axoflow automatically adds the following labels to data collected from this source:
When sending the data collected from this source to Splunk, Axoflow uses the following sourcetype and index settings:
sourcetype
index
aws:cloudwatchlogs
aws-activity
If the Axoflow classification doesn’t set the source field for the message automatically, and you haven’t set it in a flow processing step manually (by setting the meta.destination.splunk.source field), AxoRouter automatically sets the source to the name of the AxoRouter connector that received the message (for example, axorouter-syslog-tcp-514).
Sending data to Google SecOps
When sending the data collected from this source to a dynamic Google SecOps destination, Axoflow sets the following log type: AWS_CLOUDWATCH.
Sending data to Microsoft Sentinel
When sending the data collected from this source to a Microsoft Sentinel destination, Axoflow normalizes the data and sends it to the following table: Syslog.
10.9.3 - Axoflow
10.9.3.1 - AxoSyslog
AxoSyslog:
High-performance, configurable syslog service for collecting, processing, and forwarding log data.
For the best integration of your AxoSyslog instances with AxoConsole, see AxoSyslog.
Labels
Enable classification and parsing in the connector rule that receives data from this source. Axoflow will identify the messages and add labels accordingly.
10.9.4 - Broadcom
10.9.4.1 - Edge Secure Web Gateway (Edge SWG)
Edge Secure Web Gateway (Edge SWG):
Secures web traffic through policy enforcement, SSL inspection, and real-time threat protection.
When sending the data collected from this source to Splunk, Axoflow uses the following sourcetype and index settings:
sourcetype
index
bluecoat:proxysg:access:syslog
netops
bluecoat:proxysg:access:kv
netproxy
If the Axoflow classification doesn’t set the source field for the message automatically, and you haven’t set it in a flow processing step manually (by setting the meta.destination.splunk.source field), AxoRouter automatically sets the source to the name of the AxoRouter connector that received the message (for example, axorouter-syslog-tcp-514).
Sending data to Google SecOps
When sending the data collected from this source to a dynamic Google SecOps destination, Axoflow sets the following log type: BROADCOM_EDGE_SWG.
Sending data to Microsoft Sentinel
When sending the data collected from this source to a Microsoft Sentinel destination, Axoflow normalizes the data and sends it to the following table: Syslog.
Earlier name/vendor
Blue Coat Proxy
Blue Coat ProxySG
Symantec ProxySG
Symantec Edge Secure Web Gateway
Symantec Edge SWG
10.9.4.2 - Email Security
Email Security:
Broadcom Email Security is an enterprise-grade, high-accuracy email filtering solution designed to detect and block spam, phishing, and malware.
When sending the data collected from this source to Splunk, Axoflow uses the following sourcetype and index settings:
source
sourcetype
index
bmserver
symantec:smg
email
ecelerity
symantec:smg:ecelerity
email
If the Axoflow classification doesn’t set the source field for the message automatically, and you haven’t set it in a flow processing step manually (by setting the meta.destination.splunk.source field), AxoRouter automatically sets the source to the name of the AxoRouter connector that received the message (for example, axorouter-syslog-tcp-514).
Sending data to Microsoft Sentinel
When sending the data collected from this source to a Microsoft Sentinel destination, Axoflow normalizes the data and sends it to the following table: Syslog.
Earlier name/vendor
Symantec Brightmail
Brightmail
10.9.4.3 - ESX
ESX:
The primary function of ESX is to partition a physical server into multiple virtual machines (VMs), allowing different operating systems to run simultaneously and improving hardware utilization.
When sending the data collected from this source to Splunk, Axoflow uses the following sourcetype and index settings:
source
sourcetype
index
vmware:esxlog:<service-name>
vmware:esxlog:<service-name>
infraops
The service-name in the source and sourcetype is the same as the service label, for example, vmware:esxlog:vmware
If the Axoflow classification doesn’t set the source field for the message automatically, and you haven’t set it in a flow processing step manually (by setting the meta.destination.splunk.source field), AxoRouter automatically sets the source to the name of the AxoRouter connector that received the message (for example, axorouter-syslog-tcp-514).
Sending data to Google SecOps
When sending the data collected from this source to a dynamic Google SecOps destination, Axoflow sets the following log type: VMWARE_ESX.
Sending data to Microsoft Sentinel
When sending the data collected from this source to a Microsoft Sentinel destination, Axoflow normalizes the data and sends it to the following table: Syslog.
Earlier name/vendor
VMware ESX
10.9.4.4 - NSX
NSX:
Provides network virtualization, micro-segmentation, and security for software-defined data centers.
Configure your NSX appliances, NSX Edges, and hypervisors to send their logs to the Syslog (autodetect and classify) connector of an AxoRouter instance. Use either:
The TCP protocol (port 601 when using the default connector), or
TLS-encrypted TCP protocol (port 6514 when using the default connector)
When sending the data collected from this source to Splunk, Axoflow uses the following sourcetype and index settings:
sourcetype
index
vmware:nsxlog:dfwpktlogs
netfw
vmware:nsxlog:firewall-pktlog
netfw
vmware:nsxlog:nsx
infraops
vmware:nsxlog:nsxv
infraops
If the Axoflow classification doesn’t set the source field for the message automatically, and you haven’t set it in a flow processing step manually (by setting the meta.destination.splunk.source field), AxoRouter automatically sets the source to the name of the AxoRouter connector that received the message (for example, axorouter-syslog-tcp-514).
Sending data to Google SecOps
When sending the data collected from this source to a dynamic Google SecOps destination, Axoflow sets the following log type: VMWARE_NSX.
Sending data to Microsoft Sentinel
When sending the data collected from this source to a Microsoft Sentinel destination, Axoflow normalizes the data and sends it to the following table: Syslog.
Earlier name/vendor
VMware NSX
NSX-T Data Center
10.9.4.5 - SSL Visibility Appliance
SSL Visibility Appliance:
Broadcom's SSL Visibility (SSLV) Appliance is a dedicated network security device that decrypts, inspects, and re-encrypts SSL/TLS traffic to expose threats hidden within encrypted communications.
If the Axoflow classification doesn’t set the source field for the message automatically, and you haven’t set it in a flow processing step manually (by setting the meta.destination.splunk.source field), AxoRouter automatically sets the source to the name of the AxoRouter connector that received the message (for example, axorouter-syslog-tcp-514).
Sending data to Google SecOps
When sending the data collected from this source to a dynamic Google SecOps destination, Axoflow sets the following log type: BROADCOM_SSL_VA.
Sending data to Microsoft Sentinel
When sending the data collected from this source to a Microsoft Sentinel destination, Axoflow normalizes the data and sends it to the following table: Syslog.
Earlier name/vendor
Symantec SSL Visibility Appliance
10.9.4.6 - vCenter
vCenter:
vCenter is a centralized management platform that provides a single console for managing an entire VMware vSphere virtual infrastructure, including multiple ESXi hosts and virtual machines.
When sending the data collected from this source to Splunk, Axoflow uses the following sourcetype and index settings:
source
sourcetype
index
vmware:vclog:<service-name>
vmware:vclog:<service-name>
infraops
The service-name in the source and sourcetype is the same as the service label, for example, vmware:vclog:vmon
If the Axoflow classification doesn’t set the source field for the message automatically, and you haven’t set it in a flow processing step manually (by setting the meta.destination.splunk.source field), AxoRouter automatically sets the source to the name of the AxoRouter connector that received the message (for example, axorouter-syslog-tcp-514).
Sending data to Google SecOps
When sending the data collected from this source to a dynamic Google SecOps destination, Axoflow sets the following log type: VMWARE_VCENTER.
Sending data to Microsoft Sentinel
When sending the data collected from this source to a Microsoft Sentinel destination, Axoflow normalizes the data and sends it to the following table: Syslog.
Earlier name/vendor
VMware vCenter
10.9.5 - Check Point
10.9.5.1 - Anti-Bot
Anti-Bot:
Detects and blocks botnet communications and command-and-control traffic to prevent malware infections.
When sending the data collected from this source to Splunk, Axoflow uses the following sourcetype and index settings:
sourcetype
source
index
cp_log
checkpoint:endpoint
netops
If the Axoflow classification doesn’t set the source field for the message automatically, and you haven’t set it in a flow processing step manually (by setting the meta.destination.splunk.source field), AxoRouter automatically sets the source to the name of the AxoRouter connector that received the message (for example, axorouter-syslog-tcp-514).
Sending data to Google SecOps
When sending the data collected from this source to a dynamic Google SecOps destination, Axoflow sets the following log type: CHECKPOINT_EDR.
Sending data to Microsoft Sentinel
When sending the data collected from this source to a Microsoft Sentinel destination, Axoflow normalizes the data and sends it to the following table: Syslog.
10.9.5.2 - Anti-Malware
Anti-Malware:
Protects endpoints from viruses, ransomware, and other malware using signature and behavior analysis.
When sending the data collected from this source to Splunk, Axoflow uses the following sourcetype and index settings:
sourcetype
source
index
cp_log
checkpoint:endpoint
netops
If the Axoflow classification doesn’t set the source field for the message automatically, and you haven’t set it in a flow processing step manually (by setting the meta.destination.splunk.source field), AxoRouter automatically sets the source to the name of the AxoRouter connector that received the message (for example, axorouter-syslog-tcp-514).
Sending data to Google SecOps
When sending the data collected from this source to a dynamic Google SecOps destination, Axoflow sets the following log type: CHECKPOINT_EDR.
Sending data to Microsoft Sentinel
When sending the data collected from this source to a Microsoft Sentinel destination, Axoflow normalizes the data and sends it to the following table: Syslog.
10.9.5.3 - Anti-Phishing
Anti-Phishing:
Prevents phishing attacks by analyzing email content and links to block credential theft attempts.
When sending the data collected from this source to Splunk, Axoflow uses the following sourcetype and index settings:
sourcetype
source
index
cp_log
checkpoint:email
email
If the Axoflow classification doesn’t set the source field for the message automatically, and you haven’t set it in a flow processing step manually (by setting the meta.destination.splunk.source field), AxoRouter automatically sets the source to the name of the AxoRouter connector that received the message (for example, axorouter-syslog-tcp-514).
Sending data to Google SecOps
When sending the data collected from this source to a dynamic Google SecOps destination, Axoflow sets the following log type: CHECKPOINT_EMAIL.
Sending data to Microsoft Sentinel
When sending the data collected from this source to a Microsoft Sentinel destination, Axoflow normalizes the data and sends it to the following table: Syslog.
10.9.5.4 - Anti-Spam and Email Security
Anti-Spam and Email Security:
Blocks spam and malicious email content using reputation checks and email filtering techniques.
When sending the data collected from this source to Splunk, Axoflow uses the following sourcetype and index settings:
sourcetype
source
index
cp_log
checkpoint:email
email
If the Axoflow classification doesn’t set the source field for the message automatically, and you haven’t set it in a flow processing step manually (by setting the meta.destination.splunk.source field), AxoRouter automatically sets the source to the name of the AxoRouter connector that received the message (for example, axorouter-syslog-tcp-514).
Sending data to Google SecOps
When sending the data collected from this source to a dynamic Google SecOps destination, Axoflow sets the following log type: CHECKPOINT_EMAIL.
Sending data to Microsoft Sentinel
When sending the data collected from this source to a Microsoft Sentinel destination, Axoflow normalizes the data and sends it to the following table: Syslog.
10.9.5.5 - CPMI Client
CPMI Client:
Legacy Check Point management client used to interface with security policies and logs.
When sending the data collected from this source to Splunk, Axoflow uses the following sourcetype and index settings:
sourcetype
index
cp_log
netops
If the Axoflow classification doesn’t set the source field for the message automatically, and you haven’t set it in a flow processing step manually (by setting the meta.destination.splunk.source field), AxoRouter automatically sets the source to the name of the AxoRouter connector that received the message (for example, axorouter-syslog-tcp-514).
Sending data to Google SecOps
When sending the data collected from this source to a dynamic Google SecOps destination, Axoflow sets the following log type: CHECKPOINT_FIREWALL.
Sending data to Microsoft Sentinel
When sending the data collected from this source to a Microsoft Sentinel destination, Axoflow normalizes the data and sends it to the following table: Syslog.
10.9.5.6 - cpmidu_update_tool
cpmidu_update_tool:
Utility used to update configuration and database files for Check Point Multi-Domain environments.
When sending the data collected from this source to Splunk, Axoflow uses the following sourcetype and index settings:
sourcetype
source
index
cp_log
checkpoint:audit
netops
If the Axoflow classification doesn’t set the source field for the message automatically, and you haven’t set it in a flow processing step manually (by setting the meta.destination.splunk.source field), AxoRouter automatically sets the source to the name of the AxoRouter connector that received the message (for example, axorouter-syslog-tcp-514).
Sending data to Google SecOps
When sending the data collected from this source to a dynamic Google SecOps destination, Axoflow sets the following log type: CHECKPOINT_FIREWALL.
Sending data to Microsoft Sentinel
When sending the data collected from this source to a Microsoft Sentinel destination, Axoflow normalizes the data and sends it to the following table: Syslog.
10.9.5.7 - Database Tool
Database Tool:
Command-line tool to extract, query, or update Check Point configuration and policy databases.
When sending the data collected from this source to Splunk, Axoflow uses the following sourcetype and index settings:
sourcetype
source
index
cp_log
checkpoint:audit
netops
Sending data to Microsoft Sentinel
When sending the data collected from this source to a Microsoft Sentinel destination, Axoflow normalizes the data and sends it to the following table: Syslog.
10.9.5.8 - Edge Secure Web Gateway (Edge SWG)
Edge Secure Web Gateway (Edge SWG):
Provides configuration profiles for secure mobile access and web filtering on iOS devices.
When sending the data collected from this source to Splunk, Axoflow uses the following sourcetype and index settings:
sourcetype
source
index
cp_log
checkpoint:network
netops
If the Axoflow classification doesn’t set the source field for the message automatically, and you haven’t set it in a flow processing step manually (by setting the meta.destination.splunk.source field), AxoRouter automatically sets the source to the name of the AxoRouter connector that received the message (for example, axorouter-syslog-tcp-514).
Sending data to Google SecOps
When sending the data collected from this source to a dynamic Google SecOps destination, Axoflow sets the following log type: CHECKPOINT_HARMONY.
Sending data to Microsoft Sentinel
When sending the data collected from this source to a Microsoft Sentinel destination, Axoflow normalizes the data and sends it to the following table: Syslog.
10.9.5.9 - Endpoint Compliance
Endpoint Compliance:
Checks endpoint status and posture before granting network access, enforcing security policies.
When sending the data collected from this source to Splunk, Axoflow uses the following sourcetype and index settings:
sourcetype
source
index
cp_log
checkpoint:endpoint
netops
If the Axoflow classification doesn’t set the source field for the message automatically, and you haven’t set it in a flow processing step manually (by setting the meta.destination.splunk.source field), AxoRouter automatically sets the source to the name of the AxoRouter connector that received the message (for example, axorouter-syslog-tcp-514).
Sending data to Google SecOps
When sending the data collected from this source to a dynamic Google SecOps destination, Axoflow sets the following log type: CHECKPOINT_EDR.
Sending data to Microsoft Sentinel
When sending the data collected from this source to a Microsoft Sentinel destination, Axoflow normalizes the data and sends it to the following table: Syslog.
10.9.5.10 - Endpoint Management
Endpoint Management:
Centralized platform for managing endpoint protection, updates, and policy enforcement.
When sending the data collected from this source to Splunk, Axoflow uses the following sourcetype and index settings:
sourcetype
source
index
cp_log
checkpoint:endpoint
netops
Sending data to Google SecOps
When sending the data collected from this source to a dynamic Google SecOps destination, Axoflow sets the following log type: CHECKPOINT_EDR.
Sending data to Microsoft Sentinel
When sending the data collected from this source to a Microsoft Sentinel destination, Axoflow normalizes the data and sends it to the following table: Syslog.
10.9.5.11 - Forensics
Forensics:
Analyzes security incidents on endpoints to uncover attack vectors and malicious activity.
When sending the data collected from this source to Splunk, Axoflow uses the following sourcetype and index settings:
sourcetype
source
index
cp_log
checkpoint:endpoint
netops
If the Axoflow classification doesn’t set the source field for the message automatically, and you haven’t set it in a flow processing step manually (by setting the meta.destination.splunk.source field), AxoRouter automatically sets the source to the name of the AxoRouter connector that received the message (for example, axorouter-syslog-tcp-514).
Sending data to Google SecOps
When sending the data collected from this source to a dynamic Google SecOps destination, Axoflow sets the following log type: CHECKPOINT_EDR.
Sending data to Microsoft Sentinel
When sending the data collected from this source to a Microsoft Sentinel destination, Axoflow normalizes the data and sends it to the following table: Syslog.
10.9.5.12 - GO Password Reset
GO Password Reset:
Facilitates secure password reset processes for users across integrated environments.
When sending the data collected from this source to Splunk, Axoflow uses the following sourcetype and index settings:
sourcetype
source
index
cp_log
checkpoint:audit
netops
If the Axoflow classification doesn’t set the source field for the message automatically, and you haven’t set it in a flow processing step manually (by setting the meta.destination.splunk.source field), AxoRouter automatically sets the source to the name of the AxoRouter connector that received the message (for example, axorouter-syslog-tcp-514).
Sending data to Google SecOps
When sending the data collected from this source to a dynamic Google SecOps destination, Axoflow sets the following log type: CHECKPOINT_AUDIT.
Sending data to Microsoft Sentinel
When sending the data collected from this source to a Microsoft Sentinel destination, Axoflow normalizes the data and sends it to the following table: Syslog.
10.9.5.13 - HTTPS Inspection
HTTPS Inspection:
Decrypts and inspects HTTPS traffic to detect hidden threats within encrypted web sessions.
When sending the data collected from this source to Splunk, Axoflow uses the following sourcetype and index settings:
sourcetype
source
index
cp_log
checkpoint:firewall
netfw
If the Axoflow classification doesn’t set the source field for the message automatically, and you haven’t set it in a flow processing step manually (by setting the meta.destination.splunk.source field), AxoRouter automatically sets the source to the name of the AxoRouter connector that received the message (for example, axorouter-syslog-tcp-514).
Sending data to Google SecOps
When sending the data collected from this source to a dynamic Google SecOps destination, Axoflow sets the following log type: CHECKPOINT_FIREWALL.
Sending data to Microsoft Sentinel
When sending the data collected from this source to a Microsoft Sentinel destination, Axoflow normalizes the data and sends it to the following table: Syslog.
10.9.5.14 - IPS
IPS:
Detects and blocks known and unknown exploits, malware, and vulnerabilities in network traffic.
When sending the data collected from this source to Splunk, Axoflow uses the following sourcetype and index settings:
sourcetype
source
index
cp_log
checkpoint:ids
netids
If the Axoflow classification doesn’t set the source field for the message automatically, and you haven’t set it in a flow processing step manually (by setting the meta.destination.splunk.source field), AxoRouter automatically sets the source to the name of the AxoRouter connector that received the message (for example, axorouter-syslog-tcp-514).
Sending data to Google SecOps
When sending the data collected from this source to a dynamic Google SecOps destination, Axoflow sets the following log type: CHECKPOINT_EDR.
Sending data to Microsoft Sentinel
When sending the data collected from this source to a Microsoft Sentinel destination, Axoflow normalizes the data and sends it to the following table: Syslog.
10.9.5.15 - MDS Query Tool
MDS Query Tool:
CLI tool for querying multi-domain configurations and policies in Check Point environments.
When sending the data collected from this source to Splunk, Axoflow uses the following sourcetype and index settings:
sourcetype
index
cp_log
netops
Sending data to Microsoft Sentinel
When sending the data collected from this source to a Microsoft Sentinel destination, Axoflow normalizes the data and sends it to the following table: Syslog.
10.9.5.16 - Media Encryption & Port Protection
Media Encryption & Port Protection:
Secures USB ports and encrypts removable media to protect sensitive data on endpoints.
When sending the data collected from this source to Splunk, Axoflow uses the following sourcetype and index settings:
sourcetype
source
index
cp_log
checkpoint:endpoint
netops
If the Axoflow classification doesn’t set the source field for the message automatically, and you haven’t set it in a flow processing step manually (by setting the meta.destination.splunk.source field), AxoRouter automatically sets the source to the name of the AxoRouter connector that received the message (for example, axorouter-syslog-tcp-514).
Sending data to Google SecOps
When sending the data collected from this source to a dynamic Google SecOps destination, Axoflow sets the following log type: CHECKPOINT_EDR.
Sending data to Microsoft Sentinel
When sending the data collected from this source to a Microsoft Sentinel destination, Axoflow normalizes the data and sends it to the following table: Syslog.
10.9.5.17 - Mobile Access
Mobile Access:
Enables secure remote access to corporate apps and data from mobile devices.
When sending the data collected from this source to Splunk, Axoflow uses the following sourcetype and index settings:
sourcetype
source
index
cp_log
checkpoint:network
netops
Sending data to Microsoft Sentinel
When sending the data collected from this source to a Microsoft Sentinel destination, Axoflow normalizes the data and sends it to the following table: Syslog.
When sending the data collected from this source to Splunk, Axoflow uses the following sourcetype and index settings:
sourcetype
source
index
cp_log
checkpoint:firewall
netfw
If the Axoflow classification doesn’t set the source field for the message automatically, and you haven’t set it in a flow processing step manually (by setting the meta.destination.splunk.source field), AxoRouter automatically sets the source to the name of the AxoRouter connector that received the message (for example, axorouter-syslog-tcp-514).
Sending data to Google SecOps
When sending the data collected from this source to a dynamic Google SecOps destination, Axoflow sets the following log type: CHECKPOINT_FIREWALL.
Sending data to Microsoft Sentinel
When sending the data collected from this source to a Microsoft Sentinel destination, Axoflow normalizes the data and sends it to the following table: Syslog.
10.9.5.19 - QoS
QoS:
Implements bandwidth control and traffic prioritization policies for optimized network usage.
When sending the data collected from this source to Splunk, Axoflow uses the following sourcetype and index settings:
sourcetype
source
index
cp_log
checkpoint:firewall
netfw
If the Axoflow classification doesn’t set the source field for the message automatically, and you haven’t set it in a flow processing step manually (by setting the meta.destination.splunk.source field), AxoRouter automatically sets the source to the name of the AxoRouter connector that received the message (for example, axorouter-syslog-tcp-514).
Sending data to Google SecOps
When sending the data collected from this source to a dynamic Google SecOps destination, Axoflow sets the following log type: CHECKPOINT_FIREWALL.
Sending data to Microsoft Sentinel
When sending the data collected from this source to a Microsoft Sentinel destination, Axoflow normalizes the data and sends it to the following table: Syslog.
When sending the data collected from this source to Splunk, Axoflow uses the following sourcetype and index settings:
sourcetype
source
index
cp_log
checkpoint:audit
netops
Sending data to Microsoft Sentinel
When sending the data collected from this source to a Microsoft Sentinel destination, Axoflow normalizes the data and sends it to the following table: Syslog.
10.9.5.22 - SmartConsole
SmartConsole:
Graphical interface for managing Check Point security policies, logs, and monitoring.
When sending the data collected from this source to Splunk, Axoflow uses the following sourcetype and index settings:
sourcetype
source
index
cp_log
checkpoint:audit
netops
Sending data to Microsoft Sentinel
When sending the data collected from this source to a Microsoft Sentinel destination, Axoflow normalizes the data and sends it to the following table: Syslog.
10.9.5.23 - SmartUpdate
SmartUpdate:
Tool for updating and managing licenses, software, and hotfixes in Check Point environments.
When sending the data collected from this source to Splunk, Axoflow uses the following sourcetype and index settings:
sourcetype
source
index
cp_log
checkpoint:audit
netops
Sending data to Microsoft Sentinel
When sending the data collected from this source to a Microsoft Sentinel destination, Axoflow normalizes the data and sends it to the following table: Syslog.
10.9.5.24 - Syslog Data
Syslog Data:
Enables export of Check Point logs via syslog to external monitoring and SIEM platforms.
When sending the data collected from this source to Splunk, Axoflow uses the following sourcetype and index settings:
sourcetype
index
nix:syslog
netops
If the Axoflow classification doesn’t set the source field for the message automatically, and you haven’t set it in a flow processing step manually (by setting the meta.destination.splunk.source field), AxoRouter automatically sets the source to the name of the AxoRouter connector that received the message (for example, axorouter-syslog-tcp-514).
Sending data to Microsoft Sentinel
When sending the data collected from this source to a Microsoft Sentinel destination, Axoflow normalizes the data and sends it to the following table: Syslog.
10.9.5.25 - Threat Emulation and Anti-Exploit
Threat Emulation and Anti-Exploit:
Emulates files in a virtual environment to detect and block advanced persistent threats and exploits.
When sending the data collected from this source to Splunk, Axoflow uses the following sourcetype and index settings:
sourcetype
source
index
cp_log
checkpoint:endpoint
netops
If the Axoflow classification doesn’t set the source field for the message automatically, and you haven’t set it in a flow processing step manually (by setting the meta.destination.splunk.source field), AxoRouter automatically sets the source to the name of the AxoRouter connector that received the message (for example, axorouter-syslog-tcp-514).
Sending data to Google SecOps
When sending the data collected from this source to a dynamic Google SecOps destination, Axoflow sets the following log type: CHECKPOINT_EDR.
Sending data to Microsoft Sentinel
When sending the data collected from this source to a Microsoft Sentinel destination, Axoflow normalizes the data and sends it to the following table: Syslog.
10.9.5.26 - URL Filtering
URL Filtering:
Controls and logs web access based on URL categories and custom site rules to enforce policy.
When sending the data collected from this source to Splunk, Axoflow uses the following sourcetype and index settings:
sourcetype
source
index
cp_log
checkpoint:firewall
netfw
If the Axoflow classification doesn’t set the source field for the message automatically, and you haven’t set it in a flow processing step manually (by setting the meta.destination.splunk.source field), AxoRouter automatically sets the source to the name of the AxoRouter connector that received the message (for example, axorouter-syslog-tcp-514).
Sending data to Google SecOps
When sending the data collected from this source to a dynamic Google SecOps destination, Axoflow sets the following log type: CHECKPOINT_FIREWALL.
Sending data to Microsoft Sentinel
When sending the data collected from this source to a Microsoft Sentinel destination, Axoflow normalizes the data and sends it to the following table: Syslog.
10.9.5.27 - Web API
Web API:
Provides programmatic access to Check Point security management through RESTful API endpoints.
When sending the data collected from this source to Splunk, Axoflow uses the following sourcetype and index settings:
sourcetype
source
index
cp_log
checkpoint:audit
netops
Sending data to Microsoft Sentinel
When sending the data collected from this source to a Microsoft Sentinel destination, Axoflow normalizes the data and sends it to the following table: Syslog.
10.9.6 - Cisco
10.9.6.1 - Access Control System (ACS)
Access Control System (ACS):
Centralizes network access control with RADIUS and TACACS+ for authentication and authorization.
When sending the data collected from this source to Splunk, Axoflow uses the following sourcetype and index settings:
sourcetype
index
cisco:acs
netauth
If the Axoflow classification doesn’t set the source field for the message automatically, and you haven’t set it in a flow processing step manually (by setting the meta.destination.splunk.source field), AxoRouter automatically sets the source to the name of the AxoRouter connector that received the message (for example, axorouter-syslog-tcp-514).
Sending data to Google SecOps
When sending the data collected from this source to a dynamic Google SecOps destination, Axoflow sets the following log type: CISCO_ACS.
Sending data to Microsoft Sentinel
When sending the data collected from this source to a Microsoft Sentinel destination, Axoflow normalizes the data and sends it to the following table: Syslog.
10.9.6.2 - Adaptive Security Appliance (ASA)
Adaptive Security Appliance (ASA):
Provides stateful firewall, VPN support, and advanced threat protection for secure network perimeters.
When sending the data collected from this source to Splunk, Axoflow uses the following sourcetype and index settings:
sourcetype
index
cisco:asa
netfw
If the Axoflow classification doesn’t set the source field for the message automatically, and you haven’t set it in a flow processing step manually (by setting the meta.destination.splunk.source field), AxoRouter automatically sets the source to the name of the AxoRouter connector that received the message (for example, axorouter-syslog-tcp-514).
Sending data to Google SecOps
When sending the data collected from this source to a dynamic Google SecOps destination, Axoflow sets the following log type: CISCO_ASA_FIREWALL.
Sending data to Microsoft Sentinel
When sending the data collected from this source to a Microsoft Sentinel destination, Axoflow normalizes the data and sends it to the following table: Syslog.
10.9.6.3 - Application Control Engine (ACE)
Application Control Engine (ACE):
Provides application-aware load balancing, SSL offload, and traffic control for Cisco networks.
When sending the data collected from this source to Splunk, Axoflow uses the following sourcetype and index settings:
sourcetype
index
cisco:ace
netops
If the Axoflow classification doesn’t set the source field for the message automatically, and you haven’t set it in a flow processing step manually (by setting the meta.destination.splunk.source field), AxoRouter automatically sets the source to the name of the AxoRouter connector that received the message (for example, axorouter-syslog-tcp-514).
Sending data to Google SecOps
When sending the data collected from this source to a dynamic Google SecOps destination, Axoflow sets the following log type: CISCO_ACE.
Sending data to Microsoft Sentinel
When sending the data collected from this source to a Microsoft Sentinel destination, Axoflow normalizes the data and sends it to the following table: Syslog.
10.9.6.4 - Cisco IOS
Cisco IOS:
Network operating system for Cisco routers and switches, enabling routing, switching, and security.
When sending the data collected from this source to Splunk, Axoflow uses the following sourcetype and index settings:
sourcetype
index
cisco:ios
netops
If the Axoflow classification doesn’t set the source field for the message automatically, and you haven’t set it in a flow processing step manually (by setting the meta.destination.splunk.source field), AxoRouter automatically sets the source to the name of the AxoRouter connector that received the message (for example, axorouter-syslog-tcp-514).
Sending data to Google SecOps
When sending the data collected from this source to a dynamic Google SecOps destination, Axoflow sets the following log type: CISCO_IOS.
Sending data to Microsoft Sentinel
When sending the data collected from this source to a Microsoft Sentinel destination, Axoflow normalizes the data and sends it to the following table: Syslog.
10.9.6.5 - Digital Network Architecture (DNA)
Digital Network Architecture (DNA):
Provides software-defined networking, policy automation, and analytics for enterprise infrastructure.
When sending the data collected from this source to Splunk, Axoflow uses the following sourcetype and index settings:
sourcetype
index
cisco:dna
netops
If the Axoflow classification doesn’t set the source field for the message automatically, and you haven’t set it in a flow processing step manually (by setting the meta.destination.splunk.source field), AxoRouter automatically sets the source to the name of the AxoRouter connector that received the message (for example, axorouter-syslog-tcp-514).
Sending data to Google SecOps
When sending the data collected from this source to a dynamic Google SecOps destination, Axoflow sets the following log type: CISCO_DNAC.
Sending data to Microsoft Sentinel
When sending the data collected from this source to a Microsoft Sentinel destination, Axoflow normalizes the data and sends it to the following table: Syslog.
10.9.6.6 - Email Security Appliance (ESA)
Email Security Appliance (ESA):
Protects email systems from spam, phishing, malware, and data loss with advanced threat filtering.
If the Axoflow classification doesn’t set the source field for the message automatically, and you haven’t set it in a flow processing step manually (by setting the meta.destination.splunk.source field), AxoRouter automatically sets the source to the name of the AxoRouter connector that received the message (for example, axorouter-syslog-tcp-514).
Sending data to Google SecOps
When sending the data collected from this source to a dynamic Google SecOps destination, Axoflow sets the following log type: CISCO_EMAIL_SECURITY.
Sending data to Microsoft Sentinel
When sending the data collected from this source to a Microsoft Sentinel destination, Axoflow normalizes the data and sends it to the following table: Syslog.
10.9.6.7 - Firepower
Firepower:
Provides next-gen firewall features including intrusion prevention, app control, and malware protection.
When sending the data collected from this source to Splunk, Axoflow uses the following sourcetype and index settings:
sourcetype
index
cisco:firepower:syslog
netids
If the Axoflow classification doesn’t set the source field for the message automatically, and you haven’t set it in a flow processing step manually (by setting the meta.destination.splunk.source field), AxoRouter automatically sets the source to the name of the AxoRouter connector that received the message (for example, axorouter-syslog-tcp-514).
Sending data to Google SecOps
When sending the data collected from this source to a dynamic Google SecOps destination, Axoflow sets the following log type: CISCO_FIREPOWER_FIREWALL.
Sending data to Microsoft Sentinel
When sending the data collected from this source to a Microsoft Sentinel destination, Axoflow normalizes the data and sends it to the following table: Syslog.
10.9.6.8 - Firepower Threat Defence (FTD)
Firepower Threat Defence (FTD):
Unifies firewall, VPN, and intrusion prevention into a single software for comprehensive threat defense.
When sending the data collected from this source to Splunk, Axoflow uses the following sourcetype and index settings:
sourcetype
index
cisco:ftd
netfw
Sending data to Google SecOps
When sending the data collected from this source to a dynamic Google SecOps destination, Axoflow sets the following log type: CISCO_FIREPOWER_FIREWALL.
Sending data to Microsoft Sentinel
When sending the data collected from this source to a Microsoft Sentinel destination, Axoflow normalizes the data and sends it to the following table: Syslog.
When sending the data collected from this source to Splunk, Axoflow uses the following sourcetype and index settings:
sourcetype
index
cisco:fwsm
netfw
If the Axoflow classification doesn’t set the source field for the message automatically, and you haven’t set it in a flow processing step manually (by setting the meta.destination.splunk.source field), AxoRouter automatically sets the source to the name of the AxoRouter connector that received the message (for example, axorouter-syslog-tcp-514).
Sending data to Google SecOps
When sending the data collected from this source to a dynamic Google SecOps destination, Axoflow sets the following log type: CISCO_FWSM.
Sending data to Microsoft Sentinel
When sending the data collected from this source to a Microsoft Sentinel destination, Axoflow normalizes the data and sends it to the following table: Syslog.
10.9.6.10 - HyperFlex (HX, UCSH)
HyperFlex (HX, UCSH):
Infrastructure solution combining compute, storage, and networking in a single system.
When sending the data collected from this source to Splunk, Axoflow uses the following sourcetype and index settings:
sourcetype
index
cisco:ucsh:hx
infraops
If the Axoflow classification doesn’t set the source field for the message automatically, and you haven’t set it in a flow processing step manually (by setting the meta.destination.splunk.source field), AxoRouter automatically sets the source to the name of the AxoRouter connector that received the message (for example, axorouter-syslog-tcp-514).
Sending data to Google SecOps
When sending the data collected from this source to a dynamic Google SecOps destination, Axoflow sets the following log type: CISCO_UCS.
Sending data to Microsoft Sentinel
When sending the data collected from this source to a Microsoft Sentinel destination, Axoflow normalizes the data and sends it to the following table: Syslog.
10.9.6.11 - Identity Services Engine (ISE)
Identity Services Engine (ISE):
Manages network access control and enforces policies with user and device authentication capabilities.
When sending the data collected from this source to Splunk, Axoflow uses the following sourcetype and index settings:
sourcetype
index
cisco:ise:syslog
netauth
If the Axoflow classification doesn’t set the source field for the message automatically, and you haven’t set it in a flow processing step manually (by setting the meta.destination.splunk.source field), AxoRouter automatically sets the source to the name of the AxoRouter connector that received the message (for example, axorouter-syslog-tcp-514).
Sending data to Google SecOps
When sending the data collected from this source to a dynamic Google SecOps destination, Axoflow sets the following log type: CISCO_ISE.
Sending data to Microsoft Sentinel
When sending the data collected from this source to a Microsoft Sentinel destination, Axoflow normalizes the data and sends it to the following table: Syslog.
When sending the data collected from this source to Splunk, Axoflow uses the following sourcetype and index settings:
sourcetype
index
cisco:cimc
infraops
Sending data to Google SecOps
When sending the data collected from this source to a dynamic Google SecOps destination, Axoflow sets the following log type: CISCO_UCS.
Sending data to Microsoft Sentinel
When sending the data collected from this source to a Microsoft Sentinel destination, Axoflow normalizes the data and sends it to the following table: Syslog.
10.9.6.13 - IOS XR
IOS XR:
High-performance, modular network operating system for carrier-grade routing and scalability.
When sending the data collected from this source to Splunk, Axoflow uses the following sourcetype and index settings:
sourcetype
index
cisco:xr
netops
Sending data to Google SecOps
When sending the data collected from this source to a dynamic Google SecOps destination, Axoflow sets the following log type: CISCO_ROUTER.
Sending data to Microsoft Sentinel
When sending the data collected from this source to a Microsoft Sentinel destination, Axoflow normalizes the data and sends it to the following table: Syslog.
10.9.6.14 - Meeting Management
Meeting Management:
Cisco Meeting Management is a management tool for Cisco Meeting Server, an on-premises video meeting platform.
When sending the data collected from this source to Splunk, Axoflow uses the following sourcetype and index settings:
source
sourcetype
index
cmm-<service-name>
cisco:mm:system
netops
If the Axoflow classification doesn’t set the source field for the message automatically, and you haven’t set it in a flow processing step manually (by setting the meta.destination.splunk.source field), AxoRouter automatically sets the source to the name of the AxoRouter connector that received the message (for example, axorouter-syslog-tcp-514).
Sending data to Google SecOps
When sending the data collected from this source to a dynamic Google SecOps destination, Axoflow sets the following log type: CISCO_CALL_MANAGER.
Sending data to Microsoft Sentinel
When sending the data collected from this source to a Microsoft Sentinel destination, Axoflow normalizes the data and sends it to the following table: Syslog.
10.9.6.15 - Meraki MX
Meraki MX:
Cloud-managed network appliance offering firewall, VPN, SD-WAN, and security in a single platform.
If the Axoflow classification doesn’t set the source field for the message automatically, and you haven’t set it in a flow processing step manually (by setting the meta.destination.splunk.source field), AxoRouter automatically sets the source to the name of the AxoRouter connector that received the message (for example, axorouter-syslog-tcp-514).
Sending data to Google SecOps
When sending the data collected from this source to a dynamic Google SecOps destination, Axoflow sets the following log type: CISCO_MERAKI.
Sending data to Microsoft Sentinel
When sending the data collected from this source to a Microsoft Sentinel destination, Axoflow normalizes the data and sends it to the following table: Syslog.
10.9.6.16 - Private Internet eXchange (PIX)
Private Internet eXchange (PIX):
Legacy firewall appliance delivering stateful inspection and secure network access control.
When sending the data collected from this source to Splunk, Axoflow uses the following sourcetype and index settings:
sourcetype
index
cisco:pix
netfw
If the Axoflow classification doesn’t set the source field for the message automatically, and you haven’t set it in a flow processing step manually (by setting the meta.destination.splunk.source field), AxoRouter automatically sets the source to the name of the AxoRouter connector that received the message (for example, axorouter-syslog-tcp-514).
Sending data to Google SecOps
When sending the data collected from this source to a dynamic Google SecOps destination, Axoflow sets the following log type: CISCO_PIX_FIREWALL.
Sending data to Microsoft Sentinel
When sending the data collected from this source to a Microsoft Sentinel destination, Axoflow normalizes the data and sends it to the following table: Syslog.
10.9.6.17 - TelePresence Video Communication Server (VCS)
TelePresence Video Communication Server (VCS):
Enables video conferencing control and call routing for Cisco TelePresence systems and endpoints.
When sending the data collected from this source to Splunk, Axoflow uses the following sourcetype and index settings:
sourcetype
index
cisco:tvcs
main
Sending data to Microsoft Sentinel
When sending the data collected from this source to a Microsoft Sentinel destination, Axoflow normalizes the data and sends it to the following table: Syslog.
10.9.6.18 - Unified Computing System Manager (UCSM)
Unified Computing System Manager (UCSM):
Centralized management platform for Cisco Unified Computing System (UCS) servers and resources.
When sending the data collected from this source to Splunk, Axoflow uses the following sourcetype and index settings:
sourcetype
index
cisco:ucs
infraops
If the Axoflow classification doesn’t set the source field for the message automatically, and you haven’t set it in a flow processing step manually (by setting the meta.destination.splunk.source field), AxoRouter automatically sets the source to the name of the AxoRouter connector that received the message (for example, axorouter-syslog-tcp-514).
Sending data to Google SecOps
When sending the data collected from this source to a dynamic Google SecOps destination, Axoflow sets the following log type: CISCO_UCS.
Sending data to Microsoft Sentinel
When sending the data collected from this source to a Microsoft Sentinel destination, Axoflow normalizes the data and sends it to the following table: Syslog.
10.9.6.19 - Unified Communications Manager (UCM)
Unified Communications Manager (UCM):
Delivers unified voice, video, messaging, and mobility services in enterprise IP telephony systems.
When sending the data collected from this source to Splunk, Axoflow uses the following sourcetype and index settings:
sourcetype
index
cisco:ucm
netops
If the Axoflow classification doesn’t set the source field for the message automatically, and you haven’t set it in a flow processing step manually (by setting the meta.destination.splunk.source field), AxoRouter automatically sets the source to the name of the AxoRouter connector that received the message (for example, axorouter-syslog-tcp-514).
Sending data to Google SecOps
When sending the data collected from this source to a dynamic Google SecOps destination, Axoflow sets the following log type: CISCO_UCM.
Sending data to Microsoft Sentinel
When sending the data collected from this source to a Microsoft Sentinel destination, Axoflow normalizes the data and sends it to the following table: Syslog.
10.9.6.20 - Viptela
Viptela:
Software-defined WAN solution providing secure connectivity, centralized control, and traffic optimization.
When sending the data collected from this source to Splunk, Axoflow uses the following sourcetype and index settings:
sourcetype
index
cisco:viptela
netops
If the Axoflow classification doesn’t set the source field for the message automatically, and you haven’t set it in a flow processing step manually (by setting the meta.destination.splunk.source field), AxoRouter automatically sets the source to the name of the AxoRouter connector that received the message (for example, axorouter-syslog-tcp-514).
Sending data to Google SecOps
When sending the data collected from this source to a dynamic Google SecOps destination, Axoflow sets the following log type: CISCO_VIPTELA.
Sending data to Microsoft Sentinel
When sending the data collected from this source to a Microsoft Sentinel destination, Axoflow normalizes the data and sends it to the following table: Syslog.
10.9.7 - Citrix
10.9.7.1 - Netscaler
Netscaler:
Offers application delivery, load balancing, and security features for optimized app performance.
When sending the data collected from this source to Splunk, Axoflow uses the following sourcetype and index settings:
sourcetype
index
citrix:netscaler:appfw:cef
netfw
citrix:netscaler:syslog
netfw
citrix:netscaler:appfw
netfw
If the Axoflow classification doesn’t set the source field for the message automatically, and you haven’t set it in a flow processing step manually (by setting the meta.destination.splunk.source field), AxoRouter automatically sets the source to the name of the AxoRouter connector that received the message (for example, axorouter-syslog-tcp-514).
Sending data to Google SecOps
When sending the data collected from this source to a dynamic Google SecOps destination, Axoflow sets the following log type: CITRIX_NETSCALER_WEB_LOGS.
Sending data to Microsoft Sentinel
When sending the data collected from this source to a Microsoft Sentinel destination, Axoflow normalizes the data and sends it to the following table: Syslog.
10.9.8 - Corelight
10.9.8.1 - Open Network Detection & Response (NDR)
Open Network Detection & Response (NDR):
Provides network detection and response by analyzing traffic for advanced threats and anomalous behavior.
When sending the data collected from this source to Splunk, Axoflow uses the following sourcetype, source, and index settings:
sourcetype
index
corelight_alerts
main
corelight_conn
main
corelight_corelight
main
corelight_corelight_metrics_bro
main
corelight_corelight_metrics_iface
main
corelight_dhcp
main
corelight_dpd
main
corelight_etc_viz
main
corelight_evt_all
main
corelight_evt_http
main
corelight_evt_suri
main
corelight_files
main
corelight_ftp
main
corelight_http
main
corelight_http_red
main
corelight_idx
main
corelight_irc
main
corelight_kerberos
main
corelight_metrics_bro
main
corelight_metrics_iface
main
corelight_rdp
main
corelight_smb
main
corelight_smb_files
main
corelight_socks
main
corelight_ssh
main
corelight_ssh_red
main
corelight_ssl
main
corelight_st_base
main
corelight_suri
main
corelight_suricata_corelight
main
corelight_x509
main
If the Axoflow classification doesn’t set the source field for the message automatically, and you haven’t set it in a flow processing step manually (by setting the meta.destination.splunk.source field), AxoRouter automatically sets the source to the name of the AxoRouter connector that received the message (for example, axorouter-syslog-tcp-514).
Sending data to Google SecOps
When sending the data collected from this source to a dynamic Google SecOps destination, Axoflow sets the following log type: CORELIGHT.
Sending data to Microsoft Sentinel
When sending the data collected from this source to a Microsoft Sentinel destination, Axoflow normalizes the data and sends it to the following table: Syslog.
10.9.9 - CrowdStrike
10.9.9.1 - CrowdStrike Falcon Platform
CrowdStrike Falcon Platform:
Endpoint management and security software that provides organizations with visibility and control across their IT environments.
When sending the data collected from this source to a dynamic Google SecOps destination, Axoflow sets the following log type: CS_STREAM.
Sending data to Microsoft Sentinel
When sending the data collected from this source to a Microsoft Sentinel destination, Axoflow normalizes the data and sends it to the following table: CommonSecurityLog.
10.9.10 - CyberArk
10.9.10.1 - Privileged Threat Analytics (PTA)
Privileged Threat Analytics (PTA):
Analyzes privileged account behavior to detect threats and suspicious activity in real time.
When sending the data collected from this source to Splunk, Axoflow uses the following sourcetype and index settings:
sourcetype
index
cyberark:pta:cef
main
If the Axoflow classification doesn’t set the source field for the message automatically, and you haven’t set it in a flow processing step manually (by setting the meta.destination.splunk.source field), AxoRouter automatically sets the source to the name of the AxoRouter connector that received the message (for example, axorouter-syslog-tcp-514).
Sending data to Google SecOps
When sending the data collected from this source to a dynamic Google SecOps destination, Axoflow sets the following log type: CYBERARK_PTA.
Sending data to Microsoft Sentinel
When sending the data collected from this source to a Microsoft Sentinel destination, Axoflow normalizes the data and sends it to the following table: Syslog.
10.9.10.2 - Vault
Vault:
Stores and manages privileged credentials, session recordings, and access control policies securely.
When sending the data collected from this source to Splunk, Axoflow uses the following sourcetype and index settings:
sourcetype
index
cyberark:epv:cef
netauth
If the Axoflow classification doesn’t set the source field for the message automatically, and you haven’t set it in a flow processing step manually (by setting the meta.destination.splunk.source field), AxoRouter automatically sets the source to the name of the AxoRouter connector that received the message (for example, axorouter-syslog-tcp-514).
Sending data to Google SecOps
When sending the data collected from this source to a dynamic Google SecOps destination, Axoflow sets the following log type: CYBERARK.
Sending data to Microsoft Sentinel
When sending the data collected from this source to a Microsoft Sentinel destination, Axoflow normalizes the data and sends it to the following table: Syslog.
10.9.11 - F5 Networks
10.9.11.1 - BIG-IP
BIG-IP:
Provides load balancing, traffic management, and application security for optimized service delivery.
Note that the device can be configured to send logs formatted as plain-text syslog, JSON, or key-value pairs. AxoRouter can automatically parse all flavors.
Labels
Axoflow automatically adds the following labels to data collected from this source:
If the Axoflow classification doesn’t set the source field for the message automatically, and you haven’t set it in a flow processing step manually (by setting the meta.destination.splunk.source field), AxoRouter automatically sets the source to the name of the AxoRouter connector that received the message (for example, axorouter-syslog-tcp-514).
Sending data to Google SecOps
When sending the data collected from this source to a dynamic Google SecOps destination, Axoflow sets the following log type: F5_BIGIP_APM.
Sending data to Microsoft Sentinel
When sending the data collected from this source to a Microsoft Sentinel destination, Axoflow normalizes the data and sends it to the following table: Syslog.
10.9.12 - FireEye
10.9.13 - Forcepoint
10.9.13.1 - Email Security
Email Security:
Protects email systems from spam, phishing, malware, and data exfiltration using advanced threat defense.
When sending the data collected from this source to Splunk, Axoflow uses the following sourcetype, source, and index settings:
sourcetype
index
forcepoint:email:cef
email
forcepoint:email:kv
email
forcepoint:email:leef
email
If the Axoflow classification doesn’t set the source field for the message automatically, and you haven’t set it in a flow processing step manually (by setting the meta.destination.splunk.source field), AxoRouter automatically sets the source to the name of the AxoRouter connector that received the message (for example, axorouter-syslog-tcp-514).
Sending data to Google SecOps
When sending the data collected from this source to a dynamic Google SecOps destination, Axoflow sets the following log type: FORCEPOINT_EMAILSECURITY.
Sending data to Microsoft Sentinel
When sending the data collected from this source to a Microsoft Sentinel destination, Axoflow normalizes the data and sends it to the following table: Syslog.
Earlier name/vendor
Websense Email Security
10.9.13.2 - Next-Generation Firewall (NGFW)
Next-Generation Firewall (NGFW):
Next-gen firewall with deep packet inspection, policy enforcement, and integrated intrusion prevention.
When sending the data collected from this source to Splunk, Axoflow uses the following sourcetype, source, and index settings:
sourcetype
index
websense:cg:cef
netproxy
If the Axoflow classification doesn’t set the source field for the message automatically, and you haven’t set it in a flow processing step manually (by setting the meta.destination.splunk.source field), AxoRouter automatically sets the source to the name of the AxoRouter connector that received the message (for example, axorouter-syslog-tcp-514).
Sending data to Google SecOps
When sending the data collected from this source to a dynamic Google SecOps destination, Axoflow sets the following log type: FORCEPOINT_FIREWALL.
Sending data to Microsoft Sentinel
When sending the data collected from this source to a Microsoft Sentinel destination, Axoflow normalizes the data and sends it to the following table: Syslog.
When sending the data collected from this source to Splunk, Axoflow uses the following sourcetype, source, and index settings:
sourcetype
index
websense:cg:cef
netproxy
websense:cg:kv
netproxy
websense:cg:leef
netproxy
Sending data to Microsoft Sentinel
When sending the data collected from this source to a Microsoft Sentinel destination, Axoflow normalizes the data and sends it to the following table: Syslog.
Earlier name/vendor
Websense Firewall
10.9.14 - Fortinet
10.9.14.1 - FortiGate firewalls
FortiGate firewalls:
Enterprise firewall platform offering threat protection, VPN, and traffic filtering for secure networking.
Make sure to set data forwarding on your appliances/servers as described in this guide. Different settings like alternate message formats or ports might be valid, but can result in data loss or incorrect parsing.
Prerequisites
You have administrative access to the firewall.
The date, time, and time zone are correctly set on the firewall.
You have an AxoRouter deployed and configured with a Syslog connector that has parsing and classification enabled (by default, every AxoRouter has such connectors). This device is going to receive the data from the firewall.
You know the IP address the AxoRouter. To find it:
Open the AxoConsole.
Select the Routers or the Topology page.
Select on AxoRouter instance that is going to receive the logs.
Check the Networks > Address field.
Steps
Note: The steps involving the FortiGate user interface are just for your convenience, for details, see the official FortiGate documentation.
Log in to your FortiGate device. You need administrator privileges to perform the configuration.
Register the address of your AxoRouter as an Address Object.
Select Log & Report > Log Settings > Global Settings.
Configure the following settings:
Event Logging: Click All.
Local traffic logging: Click All.
Syslog logging: Enable this option.
IP address/FQDN: Enter the address of your AxoRouter: %axorouter-ip%
Click Apply.
Add the source to AxoConsole.
Open the AxoConsole and select Topology.
Select Add Item > Source.
If the source is actively sending data to an AxoRouter instance, select Detected, then select your source(s) and select Add Selected Source(s).
Otherwise, select the vendor and product corresponding to your source from the Predefined sources, then enter the parameters of the source, like IP address and FQDN.
Note
During log tapping, you can add hosts that are actively sending data to an AxoRouter instance by clicking Register source.
(Optional) Add Path manually. That’s needed only when AxoConsole can’t detect the path based on the IP address and the FQDN, and you haven’t yet configured the source to send data to the router.
Labels
Axoflow automatically adds the following labels to data collected from this source:
If the Axoflow classification doesn’t set the source field for the message automatically, and you haven’t set it in a flow processing step manually (by setting the meta.destination.splunk.source field), AxoRouter automatically sets the source to the name of the AxoRouter connector that received the message (for example, axorouter-syslog-tcp-514).
Sending data to Google SecOps
When sending the data collected from this source to a dynamic Google SecOps destination, Axoflow sets the following log type: FORTINET_FIREWALL.
Sending data to Microsoft Sentinel
When sending the data collected from this source to a Microsoft Sentinel destination, Axoflow normalizes the data and sends it to the following table: Syslog.
10.9.14.2 - FortiMail
FortiMail:
Secures inbound and outbound email with spam filtering, malware protection, and advanced threat detection.
If the Axoflow classification doesn’t set the source field for the message automatically, and you haven’t set it in a flow processing step manually (by setting the meta.destination.splunk.source field), AxoRouter automatically sets the source to the name of the AxoRouter connector that received the message (for example, axorouter-syslog-tcp-514).
Sending data to Google SecOps
When sending the data collected from this source to a dynamic Google SecOps destination, Axoflow sets the following log type: FORTINET_FORTIMAIL.
Sending data to Microsoft Sentinel
When sending the data collected from this source to a Microsoft Sentinel destination, Axoflow normalizes the data and sends it to the following table: Syslog.
10.9.14.3 - FortiProxy
FortiProxy:
Protects from internet threats like malware, phishing, and data loss by inspecting web traffic, filtering content, controlling applications, and enforcing security policies
To send logs from FortiProxy to AxoRouter, configure remote logging to a syslog server on FortiProxy. Use the IP address of AxoRouter as the syslog server IP address. Set FortiProxy to send logs in the default format. (If you need to send the logs in CEF format, contact our support team). For details, see Generic tips.
Labels
Axoflow automatically adds the following labels to data collected from this source:
When sending the data collected from this source to Splunk, Axoflow uses the following sourcetype and index settings:
sourcetype
index
fortiproxy_anomaly
netfw
fortiproxy_event
netops
fortiproxy_traffic
netfw
fortiproxy_utm
netfw
If the Axoflow classification doesn’t set the source field for the message automatically, and you haven’t set it in a flow processing step manually (by setting the meta.destination.splunk.source field), AxoRouter automatically sets the source to the name of the AxoRouter connector that received the message (for example, axorouter-syslog-tcp-514).
Sending data to Google SecOps
When sending the data collected from this source to a dynamic Google SecOps destination, Axoflow sets the following log type: FORTINET_WEBPROXY.
Sending data to Microsoft Sentinel
When sending the data collected from this source to a Microsoft Sentinel destination, Axoflow normalizes the data and sends it to the following table: Syslog.
10.9.14.4 - FortiWeb
FortiWeb:
Web application firewall protecting websites from attacks like XSS, SQL injection, and bot threats.
If the Axoflow classification doesn’t set the source field for the message automatically, and you haven’t set it in a flow processing step manually (by setting the meta.destination.splunk.source field), AxoRouter automatically sets the source to the name of the AxoRouter connector that received the message (for example, axorouter-syslog-tcp-514).
Sending data to Google SecOps
When sending the data collected from this source to a dynamic Google SecOps destination, Axoflow sets the following log type: FORTINET_FORTIWEB.
Sending data to Microsoft Sentinel
When sending the data collected from this source to a Microsoft Sentinel destination, Axoflow normalizes the data and sends it to the following table: Syslog.
10.9.15 - Fortra
10.9.15.1 - Powertech SIEM Agent for IBM i
Powertech SIEM Agent for IBM i:
Monitors IBM i system activity and forwards security events for centralized analysis in SIEM platforms.
When sending the data collected from this source to Splunk, Axoflow uses the following sourcetype, source, and index settings:
sourcetype
source
index
PowerTech:SIEMAgent:cef
PowerTech:SIEMAgent
netops
PowerTech:SIEMAgent:leef
PowerTech:SIEMAgent
netops
If the Axoflow classification doesn’t set the source field for the message automatically, and you haven’t set it in a flow processing step manually (by setting the meta.destination.splunk.source field), AxoRouter automatically sets the source to the name of the AxoRouter connector that received the message (for example, axorouter-syslog-tcp-514).
Sending data to Google SecOps
When sending the data collected from this source to a dynamic Google SecOps destination, Axoflow sets the following log type: FORTRA_POWERTECH_SIEM_AGENT.
Sending data to Microsoft Sentinel
When sending the data collected from this source to a Microsoft Sentinel destination, Axoflow normalizes the data and sends it to the following table: Syslog.
Earlier name/vendor
Powertech Interact
10.9.16 - General Unix/Linux host
10.9.16.1 - Generic Linux services
Generic Linux services:
A generic placeholder for program classifications
These classifications include non-vendor specific services and applications commonly found on Linux/Unix hosts.
If the Axoflow classification doesn’t set the source field for the message automatically, and you haven’t set it in a flow processing step manually (by setting the meta.destination.splunk.source field), AxoRouter automatically sets the source to the name of the AxoRouter connector that received the message (for example, axorouter-syslog-tcp-514).
Sending data to Google SecOps
When sending the data collected from this source to a dynamic Google SecOps destination, Axoflow sets the following log type: BIND_DNS, ISC_DHCP, NIX_SYSTEM, or OPENSSH.
Sending data to Microsoft Sentinel
When sending the data collected from this source to a Microsoft Sentinel destination, Axoflow normalizes the data and sends it to the following table: Syslog.
10.9.17 - Imperva
10.9.17.1 - Incapsula
Incapsula:
Cloud-based WAF, DDoS protection, and bot mitigation service for securing web applications and APIs.
When sending the data collected from this source to Splunk, Axoflow uses the following sourcetype, source, and index settings:
sourcetype
source
index
cef
Imperva:Incapsula
netwaf
If the Axoflow classification doesn’t set the source field for the message automatically, and you haven’t set it in a flow processing step manually (by setting the meta.destination.splunk.source field), AxoRouter automatically sets the source to the name of the AxoRouter connector that received the message (for example, axorouter-syslog-tcp-514).
Sending data to Google SecOps
When sending the data collected from this source to a dynamic Google SecOps destination, Axoflow sets the following log type: IMPERVA_CEF.
Sending data to Microsoft Sentinel
When sending the data collected from this source to a Microsoft Sentinel destination, Axoflow normalizes the data and sends it to the following table: Syslog.
10.9.17.2 - SecureSphere
SecureSphere:
Provides on-prem web application, database, and file security with granular activity monitoring.
When sending the data collected from this source to Splunk, Axoflow uses the following sourcetype, source, and index settings:
sourcetype
index
imperva:waf:firewall:cef
netwaf
imperva:waf:security:cef
netwaf
imperva:waf
netwaf
If the Axoflow classification doesn’t set the source field for the message automatically, and you haven’t set it in a flow processing step manually (by setting the meta.destination.splunk.source field), AxoRouter automatically sets the source to the name of the AxoRouter connector that received the message (for example, axorouter-syslog-tcp-514).
Sending data to Google SecOps
When sending the data collected from this source to a dynamic Google SecOps destination, Axoflow sets the following log type: IMPERVA_SECURESPHERE.
Sending data to Microsoft Sentinel
When sending the data collected from this source to a Microsoft Sentinel destination, Axoflow normalizes the data and sends it to the following table: Syslog.
10.9.18 - Infoblox
10.9.18.1 - NIOS
NIOS:
Delivers secure DNS, DHCP, and IPAM (DDI) services with centralized network control and automation.
If the Axoflow classification doesn’t set the source field for the message automatically, and you haven’t set it in a flow processing step manually (by setting the meta.destination.splunk.source field), AxoRouter automatically sets the source to the name of the AxoRouter connector that received the message (for example, axorouter-syslog-tcp-514).
Sending data to Google SecOps
When sending the data collected from this source to a dynamic Google SecOps destination, Axoflow sets the following log type: INFOBLOX, INFOBLOX_DNS.
Sending data to Microsoft Sentinel
When sending the data collected from this source to a Microsoft Sentinel destination, Axoflow normalizes the data and sends it to the following table: Syslog.
10.9.19 - Ivanti
10.9.19.1 - Connect secure
Connect secure:
Provides dynamic IP address assignment and network configuration for DHCP-enabled devices.
When sending the data collected from this source to Splunk, Axoflow uses the following sourcetype, source, and index settings:
sourcetype
source
index
pulse:connectsecure
netfw
pulse:connectsecure:web
netproxy
If the Axoflow classification doesn’t set the source field for the message automatically, and you haven’t set it in a flow processing step manually (by setting the meta.destination.splunk.source field), AxoRouter automatically sets the source to the name of the AxoRouter connector that received the message (for example, axorouter-syslog-tcp-514).
Sending data to Google SecOps
When sending the data collected from this source to a dynamic Google SecOps destination, Axoflow sets the following log type: IVANTI_CONNECT_SECURE.
Sending data to Microsoft Sentinel
When sending the data collected from this source to a Microsoft Sentinel destination, Axoflow normalizes the data and sends it to the following table: Syslog.
Earlier name/vendor
Pulse Connect Secure
10.9.20 - Juniper
10.9.20.1 - Junos OS
Junos OS:
Junos OS is the network operating system for Juniper physical and virtual networking and security products.
If the Axoflow classification doesn’t set the source field for the message automatically, and you haven’t set it in a flow processing step manually (by setting the meta.destination.splunk.source field), AxoRouter automatically sets the source to the name of the AxoRouter connector that received the message (for example, axorouter-syslog-tcp-514).
Sending data to Google SecOps
When sending the data collected from this source to a dynamic Google SecOps destination, Axoflow sets the following log type: JUNIPER_JUNOS.
Sending data to Microsoft Sentinel
When sending the data collected from this source to a Microsoft Sentinel destination, Axoflow normalizes the data and sends it to the following table: Syslog.
10.9.21 - Kaspersky
10.9.21.1 - Endpoint Security
Endpoint Security:
Protects endpoints from malware, ransomware, and intrusions with antivirus, firewall, and threat detection.
Note that the device can be configured to send plain syslog text, LEEF, or CEF-formatted output.
Sending data to Splunk
When sending the data collected from this source to Splunk, Axoflow uses the following sourcetype and index settings:
sourcetype
index
kaspersky:cef
epav
kaspersky:es
epav
kaspersky:gnrl
epav
kaspersky:klau
epav
kaspersky:klbl
epav
kaspersky:klmo
epav
kaspersky:klna
epav
kaspersky:klpr
epav
kaspersky:klsr
epav
kaspersky:leef
epav
kaspersky:sysl
epav
If the Axoflow classification doesn’t set the source field for the message automatically, and you haven’t set it in a flow processing step manually (by setting the meta.destination.splunk.source field), AxoRouter automatically sets the source to the name of the AxoRouter connector that received the message (for example, axorouter-syslog-tcp-514).
Sending data to Google SecOps
When sending the data collected from this source to a dynamic Google SecOps destination, Axoflow sets the following log type: KASPERSKY_ENDPOINT.
Sending data to Microsoft Sentinel
When sending the data collected from this source to a Microsoft Sentinel destination, Axoflow normalizes the data and sends it to the following table: Syslog.
Azure Event Hubs:
Big data streaming platform to ingest and process events.
Axoflow can collect data from your Azure Event Hubs using an Axoflow Cloud Connector. At a high level, the process looks like this:
Deploy an Axoflow Cloud Connector that will collect the data from your Event Hub. Axoflow Cloud Connector is a simple container that you can deploy into Azure, another cloud provider, or on-prem.
Configure a Flow on AxoConsole that processes and routes the collected data to your destination (for example, Splunk or another SIEM).
Prerequisites
An Azure account with an active subscription.
A virtual machine or Kubernetes node to deploy Axoflow Cloud Connector on. This can be the same host that’ll run AxoRouter.
An AxoRouter instance that can receive data from the connector. Verify that it has an OpenTelemetry Connector (it’s enabled by default). This can be the same host that’ll run Axoflow Cloud Connector.
You know the IP address the AxoRouter. To find it:
Open the AxoConsole.
Select the Routers or the Topology page.
Select on AxoRouter instance that is going to receive the logs.
Check the Networks > Address field.
The Axoflow Cloud Connector must be able to access the AxoRouter on the port the OpenTelemetry Connector is listening on (by default, port 4317). Depending on where the Axoflow Cloud Connector and AxoRouter are deployed, you might need to adjust firewall and ingress/egress rules in your environment.
Axoflow Cloud Connector and AxoRouter on the same host
To collect data from Azure Event Hubs when Axoflow Cloud Connector and AxoRouter are running on the same host, complete the following steps. This scenario assumes that the host isn’t running in Azure. Alternatively, you can use separate hosts.
Deploy AxoRouter on a Linux virtual machine: select Provisioning > AxoRouter > Linux, then run the one-liner provisioning command on the host.
Download the Axoflow Cloud Connector image. The host must be able to access ghcr.io on TCP port 443 for this step.
The Axoflow Cloud Connector starts forwarding logs to the AxoRouter instance.
Add the appliance to AxoConsole.
Open the AxoConsole and select Topology.
Select Add Item > Source.
If the Axoflow Cloud Connector is already sending logs to an AxoRouter instance that is registered in the AxoConsole, select Detected, then select the source.
Otherwise, select Azure Event Hubs, and follow the on-screen instructions.
Enter the IP address and the FQDN of the Axoflow Cloud Connector instance.
Select Add.
Create a Flow to route the data from the AxoRouter instance to a destination. You can use the Labels of this source to select messages from this source.
Axoflow Cloud Connector and AxoRouter on a separate host
To collect data from Azure Event Hubs when Axoflow Cloud Connector and AxoRouter are running on separate hosts, complete the following steps. This scenario assumes that Axoflow Cloud Connector will be deployed in Azure. Alternatively, you can deploy both components on the same host.
Deploy an Axoflow Cloud Connector into Azure.
Access the Kubernetes node or virtual machine.
Set the following environment variable to the IP address of the AxoRouter where you want to forward the data from Event Hubs. This IP address must be accessible from the connector. You can find the IP address of AxoRouter on the Routers > AxoRouter > Overview page.
exportAXOROUTER_ENDPOINT=<AxoRouter-IP-address>
(Optional) By default, the connector stores positional and other persistence-related data in the /etc/axoflow-otel-collector/storage directory. In case you want to use a different directory, set the STORAGE_DIRECTORY environment variable.
Run the following command to generate a UUID for the connector. AxoConsole will use this ID to identify the connector.
The Axoflow Cloud Connector starts forwarding logs to the AxoRouter instance.
Add the appliance to AxoConsole.
Open the AxoConsole and select Topology.
Select Add Item > Source.
If the Axoflow Cloud Connector is already sending logs to an AxoRouter instance that is registered in the AxoConsole, select Detected, then select the source.
Otherwise, select Azure Event Hubs, and follow the on-screen instructions.
Enter the IP address and the FQDN of the Axoflow Cloud Connector instance.
Select Add.
Create a Flow to route the data from the AxoRouter instance to a destination. You can use the Labels of this source to select messages from this source.
Labels
Axoflow automatically adds the following labels to data collected from this source:
When sending the data collected from this source to Splunk, Axoflow uses the following sourcetype and index settings:
sourcetype
index
mscs:azure:eventhub:log
azure-activity
If the Axoflow classification doesn’t set the source field for the message automatically, and you haven’t set it in a flow processing step manually (by setting the meta.destination.splunk.source field), AxoRouter automatically sets the source to the name of the AxoRouter connector that received the message (for example, axorouter-syslog-tcp-514).
Sending data to Google SecOps
When sending the data collected from this source to a dynamic Google SecOps destination, Axoflow sets the following log type: AZURE_EVENTHUB.
Sending data to Microsoft Sentinel
When sending the data collected from this source to a Microsoft Sentinel destination, Axoflow normalizes the data and sends it to the following table: Syslog.
10.9.24.2 - Cloud App Security (MCAS)
Cloud App Security (MCAS):
Monitors cloud app usage, detects anomalies, and enforces security policies across SaaS services.
When sending the data collected from this source to Splunk, Axoflow uses the following sourcetype and index settings:
sourcetype
source
index
cef
microsoft:cas
main
If the Axoflow classification doesn’t set the source field for the message automatically, and you haven’t set it in a flow processing step manually (by setting the meta.destination.splunk.source field), AxoRouter automatically sets the source to the name of the AxoRouter connector that received the message (for example, axorouter-syslog-tcp-514).
Sending data to Google SecOps
When sending the data collected from this source to a dynamic Google SecOps destination, Axoflow sets the following log type: MICROSOFT_DEFENDER_CLOUD_ALERTS.
Sending data to Microsoft Sentinel
When sending the data collected from this source to a Microsoft Sentinel destination, Axoflow normalizes the data and sends it to the following table: Syslog.
10.9.24.3 - Windows hosts
Windows hosts:
Event logs from core services like security, system, DNS, and DHCP for operational and forensic analysis.
To collect event logs from Microsoft Windows hosts, Axoflow supports both agent-based and agentless methods.
For a collector agent, we recommend using the Axoflow OpenTelemetry Collector distribution. For details, see Windows host - agent based solution.
When sending the data collected from this source to Splunk, Axoflow uses the following sourcetype and index settings:
sourcetype
index
windows:eventlog:snare
oswin
windows:eventlog:xml
oswin
If the Axoflow classification doesn’t set the source field for the message automatically, and you haven’t set it in a flow processing step manually (by setting the meta.destination.splunk.source field), AxoRouter automatically sets the source to the name of the AxoRouter connector that received the message (for example, axorouter-syslog-tcp-514).
Sending data to Google SecOps
When sending the data collected from this source to a dynamic Google SecOps destination, Axoflow sets the following log type: WINEVTLOG, WINEVTLOG_XML, WINDOWS_DHCP, WINDOWS_DNS.
Sending data to Microsoft Sentinel
When sending the data collected from this source to a Microsoft Sentinel destination, Axoflow normalizes the data and sends it to the following tables.
Event logs from the Security channel: SecurityEvent
Event logs from the System channel: SecurityEvent
Other event logs: WindowsEvent
10.9.25 - MikroTik
10.9.25.1 - RouterOS
RouterOS:
Router operating system providing firewall, bandwidth management, routing, and hotspot functionality.
When sending the data collected from this source to Splunk, Axoflow uses the following sourcetype and index settings:
sourcetype
index
routeros
netfw
routeros
netops
If the Axoflow classification doesn’t set the source field for the message automatically, and you haven’t set it in a flow processing step manually (by setting the meta.destination.splunk.source field), AxoRouter automatically sets the source to the name of the AxoRouter connector that received the message (for example, axorouter-syslog-tcp-514).
Sending data to Google SecOps
When sending the data collected from this source to a dynamic Google SecOps destination, Axoflow sets the following log type: MIKROTIK_ROUTER.
Sending data to Microsoft Sentinel
When sending the data collected from this source to a Microsoft Sentinel destination, Axoflow normalizes the data and sends it to the following table: Syslog.
10.9.26 - NetFlow Logic
10.9.26.1 - NetFlow Optimizer
NetFlow Optimizer:
Aggregates and transforms flow data (NetFlow, IPFIX) into actionable security and performance insights.
The following sections show you how to configure NetFlow Optimizer to send their log data to Axoflow.
CAUTION:
Make sure to set data forwarding on your appliances/servers as described in this guide. Different settings like alternate message formats or ports might be valid, but can result in data loss or incorrect parsing.
Prerequisites
You have administrative access to NetFlow Optimizer.
You have an AxoRouter deployed and configured with a Syslog connector that has parsing and classification enabled (by default, every AxoRouter has such connectors). This device is going to receive the data from NetFlow Optimizer.
You know the IP address the AxoRouter. To find it:
Open the AxoConsole.
Select the Routers or the Topology page.
Select on AxoRouter instance that is going to receive the logs.
Check the Networks > Address field.
Steps
Note: The steps involving the NetFlow Optimizer user interface are just for your convenience, for details, see the official documentation.
Name: Enter a name for the output, for example, Axoflow.
Address: The IP address of the AxoRouter instance where you want to send the messages.
Port: Set this parameter to 514.
Click Save.
Add the source to AxoConsole.
Open the AxoConsole and select Topology.
Select Add Item > Source.
If the source is actively sending data to an AxoRouter instance, select Detected, then select your source(s) and select Add Selected Source(s).
Otherwise, select the vendor and product corresponding to your source from the Predefined sources, then enter the parameters of the source, like IP address and FQDN.
Note
During log tapping, you can add hosts that are actively sending data to an AxoRouter instance by clicking Register source.
(Optional) Add Path manually. That’s needed only when AxoConsole can’t detect the path based on the IP address and the FQDN, and you haven’t yet configured the source to send data to the router.
Labels
Axoflow automatically adds the following labels to data collected from this source:
Network Conversations Monitor, SNMP Custom OID Sets Monitor, Sampling Monitor, SNMP Information Monitor, DNS Service Monitor, DNS Users Monitor, Network Subnets Monitor, Asset Access Monitor, Services Performance Monitor, Top Bandwidth Consumers for Cisco ASA, Top Traffic Destinations for Cisco ASA, Top Policy Violators for Cisco ASA, Top Hosts with most Connections for Cisco ASA, Outbound Mail Spammers Monitor, Inbound Mail Spammers Monitor, Unauthorized Mail Servers Monitor, Rejected Emails Monitor, Top Bandwidth Consumers for Palo Alto Networks Firewall, Top Traffic Destinations for Palo Alto Networks Firewall, Hosts with Most Policy Violations for Palo Alto Networks Firewall, Most Active Hosts for Palo Alto Networks Firewall, Bandwidth Consumption per Application for Palo Alto Networks Firewall, Bandwidth Consumption per Application/User for Palo Alto Networks, Top Applications Traffic Monitor, Top Applications Host Pairs Monitor, Visitors by Country, Botnet C&C Traffic Monitor, Custom Threat lists Monitor, Host Reputation Monitor, Threat Feeds Traffic Monitor, TCP Health Monitor, Network Conversations Monitor, Top Connections Monitor, Top Pairs Monitor, CBQoS Monitor, Traffic by Autonomous Systems, Top Traffic Monitor, Top Packets Monitor, SNMP Custom OID Sets Monitor, Top Bandwidth Consumers for NSX Distributed Firewall, Top Traffic Destinations for NSX Distributed Firewall, Top Policy Violators for NSX Distributed Firewall, Top Hosts with most Connections for NSX Distributed Firewall, Top Host VM:Host Pairs, Top VM:Host Traffic Monitor, AWS VPC Flow logs, Micro-segmentation Top Pairs Monitor, AWS Top Traffic Monitor, GCP VPC Flow Logs, GCP Top Traffic Monitor, Azure NSG Flow Logs, Cisco AVC Top Applications Monitor, Cisco AVC Bandwidth Consumption Monitor, Azure Top Traffic Monitor, Cisco AnyConnect Top Traffic Monitor, SNMP Traps Monitor, Auto-discovery Reporter, Top Traffic Monitor Geo City, Top Traffic Monitor Geo Country, Flow Data
If the Axoflow classification doesn’t set the source field for the message automatically, and you haven’t set it in a flow processing step manually (by setting the meta.destination.splunk.source field), AxoRouter automatically sets the source to the name of the AxoRouter connector that received the message (for example, axorouter-syslog-tcp-514).
Sending data to Google SecOps
When sending the data collected from this source to a dynamic Google SecOps destination, Axoflow sets the following log type: PFSENSE.
Sending data to Microsoft Sentinel
When sending the data collected from this source to a Microsoft Sentinel destination, Axoflow normalizes the data and sends it to the following table: Syslog.
10.9.28 - Netmotion
10.9.28.1 - Netmotion
Netmotion:
Provides secure, optimized remote access with performance monitoring for mobile and distributed workforces.
If the Axoflow classification doesn’t set the source field for the message automatically, and you haven’t set it in a flow processing step manually (by setting the meta.destination.splunk.source field), AxoRouter automatically sets the source to the name of the AxoRouter connector that received the message (for example, axorouter-syslog-tcp-514).
Sending data to Google SecOps
When sending the data collected from this source to a dynamic Google SecOps destination, Axoflow sets the following log type: NETMOTION.
Sending data to Microsoft Sentinel
When sending the data collected from this source to a Microsoft Sentinel destination, Axoflow normalizes the data and sends it to the following table: Syslog.
10.9.29 - NETSCOUT
10.9.29.1 - Arbor Edge Defense (AED)
Arbor Edge Defense (AED):
Edge-based DDoS protection and threat mitigation system to block attacks before they enter the network.
When sending the data collected from this source to Splunk, Axoflow uses the following sourcetype, source, and index settings:
sourcetype
source
index
netscout:aed
netscout:aed
netids
If the Axoflow classification doesn’t set the source field for the message automatically, and you haven’t set it in a flow processing step manually (by setting the meta.destination.splunk.source field), AxoRouter automatically sets the source to the name of the AxoRouter connector that received the message (for example, axorouter-syslog-tcp-514).
Sending data to Google SecOps
When sending the data collected from this source to a dynamic Google SecOps destination, Axoflow sets the following log type: ARBOR_EDGE_DEFENSE.
Sending data to Microsoft Sentinel
When sending the data collected from this source to a Microsoft Sentinel destination, Axoflow normalizes the data and sends it to the following table: Syslog.
10.9.29.2 - Arbor Pravail (APS)
Arbor Pravail (APS):
Monitors and mitigates advanced persistent threats and malware with inline packet inspection.
When sending the data collected from this source to Splunk, Axoflow uses the following sourcetype, source, and index settings:
sourcetype
source
index
netscout:aps
netscout:aps
netids
If the Axoflow classification doesn’t set the source field for the message automatically, and you haven’t set it in a flow processing step manually (by setting the meta.destination.splunk.source field), AxoRouter automatically sets the source to the name of the AxoRouter connector that received the message (for example, axorouter-syslog-tcp-514).
Sending data to Google SecOps
When sending the data collected from this source to a dynamic Google SecOps destination, Axoflow sets the following log type: ARBOR_EDGE_DEFENSE.
Sending data to Microsoft Sentinel
When sending the data collected from this source to a Microsoft Sentinel destination, Axoflow normalizes the data and sends it to the following table: Syslog.
Earlier name/vendor
Arbor Networks Pravail (APS)
10.9.30 - Omnissa
Earlier name/vendor
VMware Horizon
10.9.30.1 - Horizon
Horizon:
Horizon is a platform for managing and delivering virtual desktops and applications to end-users across a variety of devices and locations.
When sending the data collected from this source to Splunk, Axoflow uses the following sourcetype and index settings:
sourcetype
index
vmware:horizon
infraops
If the Axoflow classification doesn’t set the source field for the message automatically, and you haven’t set it in a flow processing step manually (by setting the meta.destination.splunk.source field), AxoRouter automatically sets the source to the name of the AxoRouter connector that received the message (for example, axorouter-syslog-tcp-514).
Sending data to Google SecOps
When sending the data collected from this source to a dynamic Google SecOps destination, Axoflow sets the following log type: VMWARE_HORIZON.
Sending data to Microsoft Sentinel
When sending the data collected from this source to a Microsoft Sentinel destination, Axoflow normalizes the data and sends it to the following table: Syslog.
Earlier name/vendor
VMware Horizon
10.9.31 - OpenText
10.9.31.1 - ArcSight
ArcSight:
SIEM platform for collecting, correlating, and analyzing security event data across IT environments.
When sending the data collected from this source to Splunk, Axoflow uses the following sourcetype, source, and index settings:
sourcetype
source
index
cef
ArcSight:ArcSight
main
If the Axoflow classification doesn’t set the source field for the message automatically, and you haven’t set it in a flow processing step manually (by setting the meta.destination.splunk.source field), AxoRouter automatically sets the source to the name of the AxoRouter connector that received the message (for example, axorouter-syslog-tcp-514).
Sending data to Google SecOps
When sending the data collected from this source to a dynamic Google SecOps destination, Axoflow sets the following log type: ARCSIGHT_CEF.
Sending data to Microsoft Sentinel
When sending the data collected from this source to a Microsoft Sentinel destination, Axoflow normalizes the data and sends it to the following table: Syslog.
Earlier name/vendor
MicroFocus ArcSight
10.9.31.2 - Self Service Password Reset (SSPR)
Self Service Password Reset (SSPR):
Allows users to securely reset their own passwords without IT assistance, reducing helpdesk load.
When sending the data collected from this source to Splunk, Axoflow uses the following sourcetype, source, and index settings:
sourcetype
source
index
cef
tim:cef
infraops
If the Axoflow classification doesn’t set the source field for the message automatically, and you haven’t set it in a flow processing step manually (by setting the meta.destination.splunk.source field), AxoRouter automatically sets the source to the name of the AxoRouter connector that received the message (for example, axorouter-syslog-tcp-514).
Sending data to Google SecOps
When sending the data collected from this source to a dynamic Google SecOps destination, Axoflow sets the following log type: PAN_XSOAR.
Sending data to Microsoft Sentinel
When sending the data collected from this source to a Microsoft Sentinel destination, Axoflow normalizes the data and sends it to the following table: Syslog.
Earlier name/vendor
Threat Intelligence Management (TIM)
10.9.32.2 - Palo Alto firewalls
Palo Alto firewalls:
Firewall operating system delivering network security features including traffic control and threat prevention.
Make sure to set data forwarding on your appliances/servers as described in this guide. Different settings like alternate message formats or ports might be valid, but can result in data loss or incorrect parsing.
Prerequisites
You have administrative access to the firewall.
The date, time, and time zone are correctly set on the firewall.
You have an AxoRouter deployed and configured with a Syslog connector that has parsing and classification enabled (by default, every AxoRouter has such connectors). This device is going to receive the data from the firewall.
You know the IP address the AxoRouter. To find it:
Open the AxoConsole.
Select the Routers or the Topology page.
Select on AxoRouter instance that is going to receive the logs.
Check the Networks > Address field.
Steps
Note: The steps involving the Palo Alto Networks Next-Generation Firewall user interface are just for your convenience, for details, see the official PAN-OS® documentation.
Log in to your firewall device. You need administrator privileges to perform the configuration.
Configure a Syslog server profile.
Select Device > Server Profiles > Syslog.
Click Add and enter a Name for the profile, for example, axorouter.
Configure the following settings:
Syslog Server: Enter the IP address of your AxoRouter: %axorouter-ip%
Transport: Select TCP or TLS.
Port: Set the port to 601. (This is needed for the recommended IETF log format. If for some reason you need to use the BSD format, set the port to 514.)
Format: Select IETF.
Syslog logging: Enable this option.
Click OK.
Configure syslog forwarding for Traffic, Threat, and WildFire Submission logs. For details, see Configure Log Forwarding the official PAN-OS® documentation.
Select Objects > Log Forwarding.
Click Add.
Enter a Name for the profile, for example, axoflow.
For each log type, severity level, or WildFire verdict, select the Syslog server profile.
Click OK.
Assign the log forwarding profile to a security policy to trigger log generation and forwarding.
Select Policies > Security and select a policy rule.
Select Actions, then select the Log Forwarding profile you created (for example, axoflow).
For Traffic logs, select one or both of the Log at Session Start and Log At Session End options.
Click OK.
Configure syslog forwarding for System, Config, HIP Match, and Correlation logs.
Select Device > Log Settings.
For System and Correlation logs, select each Severity level, select the Syslog server profile, and click OK.
For Config, HIP Match, and Correlation logs, edit the section, select the Syslog server profile, and click OK.
Click Commit.
Add the source to AxoConsole.
Open the AxoConsole and select Topology.
Select Add Item > Source.
If the source is actively sending data to an AxoRouter instance, select Detected, then select your source(s) and select Add Selected Source(s).
Otherwise, select the vendor and product corresponding to your source from the Predefined sources, then enter the parameters of the source, like IP address and FQDN.
Note
During log tapping, you can add hosts that are actively sending data to an AxoRouter instance by clicking Register source.
(Optional) Add Path manually. That’s needed only when AxoConsole can’t detect the path based on the IP address and the FQDN, and you haven’t yet configured the source to send data to the router.
Labels
Axoflow automatically adds the following labels to data collected from this source:
If the Axoflow classification doesn’t set the source field for the message automatically, and you haven’t set it in a flow processing step manually (by setting the meta.destination.splunk.source field), AxoRouter automatically sets the source to the name of the AxoRouter connector that received the message (for example, axorouter-syslog-tcp-514).
Sending data to Google SecOps
When sending the data collected from this source to a dynamic Google SecOps destination, Axoflow sets the following log type: PAN_FIREWALL.
Sending data to Microsoft Sentinel
When sending the data collected from this source to a Microsoft Sentinel destination, Axoflow normalizes the data and sends it to the following table: CommonSecurityLog.
10.9.33 - Ping Identity
10.9.33.1 - PingAccess
PingAccess:
A centralized access security solution which provides secure access to applications and APIs down to the URL level
When sending the data collected from this source to a dynamic Google SecOps destination, Axoflow sets the following log type: PING_ACCESS.
Sending data to Microsoft Sentinel
When sending the data collected from this source to a Microsoft Sentinel destination, Axoflow normalizes the data and sends it to the following table: Syslog.
10.9.34 - Powertech
10.9.35 - Progress
10.9.35.1 - Flowmon Anomaly Detection System (ADS)
Flowmon Anomaly Detection System (ADS):
Detects network anomalies and threats through flow-based behavior analysis and machine learning.
When sending the data collected from this source to Splunk, Axoflow uses the following sourcetype and index settings:
sourcetype
index
flowmon-ads
netids
Sending data to Microsoft Sentinel
When sending the data collected from this source to a Microsoft Sentinel destination, Axoflow normalizes the data and sends it to the following table: Syslog.
Earlier name/vendor
Flowmon Networks
10.9.36 - Riverbed
10.9.36.1 - SteelConnect
SteelConnect:
WAN optimization appliance that accelerates application performance and reduces bandwidth usage.
When sending the data collected from this source to Splunk, Axoflow uses the following sourcetype and index settings:
sourcetype
index
riverbed:syslog
netops
If the Axoflow classification doesn’t set the source field for the message automatically, and you haven’t set it in a flow processing step manually (by setting the meta.destination.splunk.source field), AxoRouter automatically sets the source to the name of the AxoRouter connector that received the message (for example, axorouter-syslog-tcp-514).
Sending data to Google SecOps
When sending the data collected from this source to a dynamic Google SecOps destination, Axoflow sets the following log type: STEELHEAD.
Sending data to Microsoft Sentinel
When sending the data collected from this source to a Microsoft Sentinel destination, Axoflow normalizes the data and sends it to the following table: Syslog.
10.9.36.2 - SteelHead
SteelHead:
Software-defined WAN solution for centralized network management and secure cloud connectivity.
When sending the data collected from this source to Splunk, Axoflow uses the following sourcetype and index settings:
sourcetype
index
riverbed:steelhead
netops
If the Axoflow classification doesn’t set the source field for the message automatically, and you haven’t set it in a flow processing step manually (by setting the meta.destination.splunk.source field), AxoRouter automatically sets the source to the name of the AxoRouter connector that received the message (for example, axorouter-syslog-tcp-514).
Sending data to Google SecOps
When sending the data collected from this source to a dynamic Google SecOps destination, Axoflow sets the following log type: RIVERBED.
Sending data to Microsoft Sentinel
When sending the data collected from this source to a Microsoft Sentinel destination, Axoflow normalizes the data and sends it to the following table: Syslog.
10.9.37 - RSA
10.9.37.1 - Authentication Manager
Authentication Manager:
Manages two-factor authentication using RSA SecurID tokens for secure access to enterprise resources.
When sending the data collected from this source to Splunk, Axoflow uses the following sourcetype and index settings:
sourcetype
index
rsa:securid:admin:syslog
netauth
rsa:securid:system:syslog
netauth
rsa:securid:runtime:syslog
netauth
rsa:securid:syslog
netauth
If the Axoflow classification doesn’t set the source field for the message automatically, and you haven’t set it in a flow processing step manually (by setting the meta.destination.splunk.source field), AxoRouter automatically sets the source to the name of the AxoRouter connector that received the message (for example, axorouter-syslog-tcp-514).
Sending data to Google SecOps
When sending the data collected from this source to a dynamic Google SecOps destination, Axoflow sets the following log type: RSA_AUTH_MANAGER.
Sending data to Microsoft Sentinel
When sending the data collected from this source to a Microsoft Sentinel destination, Axoflow normalizes the data and sends it to the following table: Syslog.
10.9.38 - rsyslog
Axoflow treats rsyslog sources as a generic syslog source. To send data from rsyslog to Axoflow, just configure rsyslog to send data to an AxoRouter instance using the syslog protocol.
Note that even if rsyslog is acting as a relay (receiving data from other clients and forwarding them to AxoRouter), on the Topology page it will be displayed as a data source.
Prerequisites
You have administrative access to the device running rsyslog.
The date, time, and time zone are correctly set on the appliance.
You have an AxoRouter deployed and configured with a Syslog connector that has parsing and classification enabled (by default, every AxoRouter has such connectors). This device is going to receive the data from the source.
You know the IP address the AxoRouter. To find it:
Open the AxoConsole.
Select the Routers or the Topology page.
Select on AxoRouter instance that is going to receive the logs.
Check the Networks > Address field.
10.9.39 - SecureAuth
10.9.39.1 - Identity Platform
Identity Platform:
Delivers identity and access management with adaptive authentication and single sign-on capabilities.
If the Axoflow classification doesn’t set the source field for the message automatically, and you haven’t set it in a flow processing step manually (by setting the meta.destination.splunk.source field), AxoRouter automatically sets the source to the name of the AxoRouter connector that received the message (for example, axorouter-syslog-tcp-514).
Sending data to Google SecOps
When sending the data collected from this source to a dynamic Google SecOps destination, Axoflow sets the following log type: SECUREAUTH_SSO.
Sending data to Microsoft Sentinel
When sending the data collected from this source to a Microsoft Sentinel destination, Axoflow normalizes the data and sends it to the following table: Syslog.
10.9.40 - Skyhigh Security
10.9.40.1 - Secure Web Gateway
Secure Web Gateway:
Inspects and filters web traffic to protect against malware, enforce policies, and prevent data loss.
When sending the data collected from this source to Splunk, Axoflow uses the following sourcetype and index settings:
sourcetype
source
index
mcafee:wg:leef
mcafee:wg
netproxy
mcafee:wg:kv
mcafee:wg
netproxy
If the Axoflow classification doesn’t set the source field for the message automatically, and you haven’t set it in a flow processing step manually (by setting the meta.destination.splunk.source field), AxoRouter automatically sets the source to the name of the AxoRouter connector that received the message (for example, axorouter-syslog-tcp-514).
Sending data to Google SecOps
When sending the data collected from this source to a dynamic Google SecOps destination, Axoflow sets the following log type: MCAFEE_WEBPROXY.
Sending data to Microsoft Sentinel
When sending the data collected from this source to a Microsoft Sentinel destination, Axoflow normalizes the data and sends it to the following table: Syslog.
Earlier name/vendor
McAfee Secure Web Gateway
10.9.41 - SonicWall
10.9.41.1 - SonicWall
SonicWall:
Delivers firewall, VPN, and deep packet inspection to protect networks from cyber threats and intrusions.
The following sections show you how to configure SonicWall firewalls to send their log data to Axoflow.
CAUTION:
Make sure to set data forwarding on your appliances/servers as described in this guide. Different settings like alternate message formats or ports might be valid, but can result in data loss or incorrect parsing.
Prerequisites
You have administrative access to the firewall.
The date, time, and time zone are correctly set on the firewall.
You have an AxoRouter deployed and configured with a Syslog connector that has parsing and classification enabled (by default, every AxoRouter has such connectors). This device is going to receive the data from the firewall.
You know the IP address the AxoRouter. To find it:
Open the AxoConsole.
Select the Routers or the Topology page.
Select on AxoRouter instance that is going to receive the logs.
Check the Networks > Address field.
Steps for SonicOS 7.x
Note: The steps involving the SonicWall user interface are just for your convenience, for details, see the official SonicWall documentation.
Log in to your SonicWall device. You need administrator privileges to perform the configuration.
Register the address of your AxoRouter as an Address Object.
Select MENU > OBJECT.
Select Match Objects > Addresses > Address objects.
Click Add Address.
Configure the following settings:
Name: Enter a name for the AxoRouter, for example, AxoRouter.
Zone Assignment: Select the correct zone.
Type: Select Host.
IP Address: Enter the IP address of your AxoRouter: %axorouter-ip%
Click Save.
Set your AxoRouter as a syslog server.
Navigate to Device > Log > Syslog.
Select the Syslog Servers tab.
Click Add.
Configure the following options:
Name or IP Address: Select the Address Object of AxoRouter.
Server Type: Select Syslog Server.
Syslog Format: Select Enhanced.
If your Syslog server does not use default port 514, type the port number in the Port field.
By default, AxoRouter accepts data on the following ports (unless you’ve modified the default connector rules):
514 UDP and TCP for RFC3164 (BSD-syslog) and RFC5424 (IETF-syslog) formatted traffic. AxoRouter automatically recognizes and handles both formats.
601 TCP for RFC5424 (IETF-syslog) and RFC3164 (BSD-syslog) formatted traffic. AxoRouter automatically recognizes and handles both formats.
6514 TCP for TLS-encrypted syslog traffic.
4317 TCP for OpenTelemetry log data.
To receive data on other ports or other protocols, configure other connector rules for the AxoRouter host.
For TLS-encrypted syslog connections, create a new connector rule or edit an existing one, and configure the keys and certificates needed to encrypt the connections. For details, see Syslog.
Note
Make sure to enable the ports you’re using on the firewall of your host.
Add the source to AxoConsole.
Open the AxoConsole and select Topology.
Select Add Item > Source.
If the source is actively sending data to an AxoRouter instance, select Detected, then select your source(s) and select Add Selected Source(s).
Otherwise, select the vendor and product corresponding to your source from the Predefined sources, then enter the parameters of the source, like IP address and FQDN.
Note
During log tapping, you can add hosts that are actively sending data to an AxoRouter instance by clicking Register source.
(Optional) Add Path manually. That’s needed only when AxoConsole can’t detect the path based on the IP address and the FQDN, and you haven’t yet configured the source to send data to the router.
Steps for SonicOS 6.x
Note: The steps involving the SonicWall user interface are just for your convenience, for details, see the official SonicWall documentation.
Log in to your SonicWall device. You need administrator privileges to perform the configuration.
Register the address of your AxoRouter as an Address Object.
Name: Enter a name for the AxoRouter, for example, AxoRouter.
Zone Assignment: Select the correct zone.
Type: Select Host.
IP Address: Enter the IP address of your AxoRouter: %axorouter-ip%
Click Add.
Set your AxoRouter as a syslog server.
Navigate to MANAGE > Log Settings > SYSLOG.
Click ADD.
Configure the following options:
Syslog ID: Enter an ID for the firewall. This ID will be used as the hostname in the log messages.
Name or IP Address: Select the Address Object of AxoRouter.
Server Type: Select Syslog Server.
Enable the Enhanced Syslog Fields Settings.
Click OK.
Add the source to AxoConsole.
Open the AxoConsole and select Topology.
Select Add Item > Source.
If the source is actively sending data to an AxoRouter instance, select Detected, then select your source(s) and select Add Selected Source(s).
Otherwise, select the vendor and product corresponding to your source from the Predefined sources, then enter the parameters of the source, like IP address and FQDN.
Note
During log tapping, you can add hosts that are actively sending data to an AxoRouter instance by clicking Register source.
(Optional) Add Path manually. That’s needed only when AxoConsole can’t detect the path based on the IP address and the FQDN, and you haven’t yet configured the source to send data to the router.
Labels
Axoflow automatically adds the following labels to data collected from this source:
If the Axoflow classification doesn’t set the source field for the message automatically, and you haven’t set it in a flow processing step manually (by setting the meta.destination.splunk.source field), AxoRouter automatically sets the source to the name of the AxoRouter connector that received the message (for example, axorouter-syslog-tcp-514).
Sending data to Google SecOps
When sending the data collected from this source to a dynamic Google SecOps destination, Axoflow sets the following log type: SONIC_FIREWALL.
Sending data to Microsoft Sentinel
When sending the data collected from this source to a Microsoft Sentinel destination, Axoflow normalizes the data and sends it to the following table: Syslog.
10.9.42 - Splunk
10.9.42.1 - Heavy Forwarder
Heavy Forwarder:
Receive data from Splunk.
This page describes how to configure your Splunk Heavy Forwarders to send data to AxoRouter.
Forwarding considerations
The Axoflow Forwarder for Splunk App works beside an existing Splunk configuration by creating an axoflow server group. Messages get cloned to the axoflow group separately during a transformation process.
The axoflow server group should not be part of the defaultGroup in the [tcpout] stanza otherwise all messages will be sent to AxoRouter twice. If the defaultGroup is not configured already, you can either:
Disable forwarding completely.
[tcpout]defaultGroup=NoForward
Use a specific default group. For example, use default-autolb-group, as servers added through the UI will be part of it by default.
[tcpout]defaultGroup=default-autolb-group
Prerequisites
Once you made sure defaultGroup is configured correctly, download the latest release of Axoflow Forwarder for Splunk App, you’ll need to install it on your Heavy Forwarders. The releases are published on the Axoflow Forwarder for Splunk App GitHub page: find the Assets section of the latest release, and download the axoflow_forwarder-<version-number>.spl file.
You know the IP address the AxoRouter. To find it:
Open the AxoConsole.
Select the Routers or the Topology page.
Select on AxoRouter instance that is going to receive the logs.
Check the Networks > Address field.
Steps
To configure your Splunk Heavy Forwarders to send data to AxoRouter. Complete the following steps.
Set the Router Selector so it matches the AxoRouter instances where your Splunk Heavy Forwarders will be forwarding their data. If you leave the Router Selector field empty, the rule will match all AxoRouters.
You can use any labels and metadata of the AxoRouter hosts in the Router selectors, for example, the hostname of the AxoRouter, or any custom labels.
If you leave the Router Selector field empty, the selector will match every AxoRouter instance.
To select only a specific AxoRouter instance, set the name field to the name of the instance as selector. For example, name = my-axorouter.
If you set multiple fields in the selector, the selector will match only AxoRouter instances that match all elements of the selector. (There in an AND relationship between the fields.)
In the Preprocessing steps section, enable Classify.
In the Syslog settings section:
Select the TCP protocol.
Select NUL terminated framing.
Enter 9900 into the Port field.
Select Add.
Install the Axoflow Forwarder for Splunk App you’ve downloaded from the GitHub Releases Page on your Splunk Heavy Forwarders.
Configure name resolution for the axorouter host by completing one of the following:
Add axorouter to the /etc/hosts file to resolve to the IP address of your AxoRouter instance where this host is sending data.
Alternatively, you can add the following snippet to your /opt/splunk/etc/system/local/outputs.conf file:
[tcpout:axoflow]server=<AXOROUTER_IP1>:9900,<AXOROUTER_IP2>:9900# configure maxQueueSize to allow for a temporary in-memory buffer if the destination is slow or unavailable# maxQueueSize = 100MB# configure a persistentQueueSize to allow for data to be queued on disk if the destination is slow or unavailable# persistentQueueSize = 1GB
Note that if you set multiple AxoRouters in the server field, the forwarder will load-balance among them.
Configure either in-memory (maxQueueSize) or on-disk (persistentQueueSize) queueing to avoid data loss in case the destination is slow or unavailable.
Install the Axoflow Forwarder for Splunk App using the Splunk UI.
Restart splunkd.
Add the source to AxoConsole.
Open the AxoConsole and select Topology.
Select Add Item > Source.
If the source is actively sending data to an AxoRouter instance, select Detected, then select your source(s) and select Add Selected Source(s).
Otherwise, select the vendor and product corresponding to your source from the Predefined sources, then enter the parameters of the source, like IP address and FQDN.
Note
During log tapping, you can add hosts that are actively sending data to an AxoRouter instance by clicking Register source.
(Optional) Add Path manually. That’s needed only when AxoConsole can’t detect the path based on the IP address and the FQDN, and you haven’t yet configured the source to send data to the router.
Classification on AxoRouter
Note that when AxoRouter receives logs from Splunk HF using the Axoflow Forwarder for Splunk App:
If classification is disabled on AxoRouter, the original source, sourcetype, index, timestamp and host metadata are preserved.
If classification is enabled, then a successful classification overrides the sourcetype and the index, while the timestamp and host are overwritten if the original message contains these more specific information.
If you want to disable the automatic classification on AxoRouter for certain messages received from the Axoflow Forwarder for Splunk App, add a Condition to the Classify processing step in the related flow, so the Condition won’t match the sourcetype. For example: meta.envelope.splunk.sourcetype != your-sourcetype
10.9.43 - Superna
10.9.43.1 - Eyeglass
Eyeglass:
Manages and automates data protection, DR, and reporting for PowerScale environments.
The following sections show you how to configure Superna Eyeglass to send their log data to Axoflow.
CAUTION:
Make sure to set data forwarding on your appliances/servers as described in this guide. Different settings like alternate message formats or ports might be valid, but can result in data loss or incorrect parsing.
Prerequisites
You have administrative access to Superna Eyeglass.
You know the IP address the AxoRouter. To find it:
Open the AxoConsole.
Select the Routers or the Topology page.
Select on AxoRouter instance that is going to receive the logs.
Check the Networks > Address field.
Steps
Note: The steps involving the Superna Eyeglass user interface are just for your convenience, for details, see the official documentation.
Log in to Ransomware Defender and open the Zero Trust menu.
Click the plus sign to add a webhook target.
Set the parameters of the webhook.
Name: Enter a name for the webhook, for example, Axoflow.
URL: Enter the URL of the webhook connector of the AxoRouter instance where you want to post messages.
Event Severity Filter: Select the severities of the events that you want to forward to the webhook.
Lifecycle filter: Select the lifecycle changes that trigger a post message to the webhook.
Click Save, then the Test webhooks button. This will send a post message with a sample payload.
Add the source to AxoConsole.
Open the AxoConsole and select Topology.
Select Add Item > Source.
If the source is actively sending data to an AxoRouter instance, select Detected, then select your source(s) and select Add Selected Source(s).
Otherwise, select the vendor and product corresponding to your source from the Predefined sources, then enter the parameters of the source, like IP address and FQDN.
Note
During log tapping, you can add hosts that are actively sending data to an AxoRouter instance by clicking Register source.
(Optional) Add Path manually. That’s needed only when AxoConsole can’t detect the path based on the IP address and the FQDN, and you haven’t yet configured the source to send data to the router.
Labels
Axoflow automatically adds the following labels to data collected from this source:
When sending the data collected from this source to Splunk, Axoflow uses the following sourcetype and index settings:
sourcetype
index
superna:eyeglass
main
If the Axoflow classification doesn’t set the source field for the message automatically, and you haven’t set it in a flow processing step manually (by setting the meta.destination.splunk.source field), AxoRouter automatically sets the source to the name of the AxoRouter connector that received the message (for example, axorouter-syslog-tcp-514).
Sending data to Google SecOps
When sending the data collected from this source to a dynamic Google SecOps destination, Axoflow sets the following log type: SUPERNA_EYEGLASS.
Sending data to Microsoft Sentinel
When sending the data collected from this source to a Microsoft Sentinel destination, Axoflow normalizes the data and sends it to the following table: Syslog.
The easiest way to send data from syslog-ng to Axoflow is to configure it to send data to an AxoRouter instance using the syslog protocol.
If you’re using syslog-ng Open Source Edition version 4.4 or newer, use the syslog-ng-otlp() driver to send data to AxoRouter using the OpenTelemetry Protocol.
Note that even if syslog-ng is acting as a relay (receiving data from other clients and forwarding them to AxoRouter), on the Topology page it will be displayed as a data source.
Prerequisites
You have administrative access to the device running syslog-ng.
The date, time, and time zone are correctly set on the appliance.
You have an AxoRouter deployed and configured with a Syslog connector that has parsing and classification enabled (by default, every AxoRouter has such connectors). This device is going to receive the data from the source.
You know the IP address the AxoRouter. To find it:
Open the AxoConsole.
Select the Routers or the Topology page.
Select on AxoRouter instance that is going to receive the logs.
When sending the data collected from this source to a dynamic Google SecOps destination, Axoflow sets the following log type: TANIUM_QUESTION.
Sending data to Microsoft Sentinel
When sending the data collected from this source to a Microsoft Sentinel destination, Axoflow normalizes the data and sends it to the following table: Syslog.
10.9.46 - Thales
10.9.46.1 - Vormetric Data Security Platform
Vormetric Data Security Platform:
Provides data encryption, key management, and access controls across cloud and on-premise environments.
When sending the data collected from this source to Splunk, Axoflow uses the following sourcetype and index settings:
sourcetype
index
thales:vormetric
netauth
If the Axoflow classification doesn’t set the source field for the message automatically, and you haven’t set it in a flow processing step manually (by setting the meta.destination.splunk.source field), AxoRouter automatically sets the source to the name of the AxoRouter connector that received the message (for example, axorouter-syslog-tcp-514).
Sending data to Google SecOps
When sending the data collected from this source to a dynamic Google SecOps destination, Axoflow sets the following log type: VORMETRIC.
Sending data to Microsoft Sentinel
When sending the data collected from this source to a Microsoft Sentinel destination, Axoflow normalizes the data and sends it to the following table: Syslog.
10.9.47 - Trellix
10.9.47.1 - Central Management System (CMS)
Central Management System (CMS):
Centralized policy and configuration management platform for Trellix security products.
When sending the data collected from this source to Splunk, Axoflow uses the following sourcetype and index settings:
sourcetype
source
index
trellix:cms
trellix:cms
netops
If the Axoflow classification doesn’t set the source field for the message automatically, and you haven’t set it in a flow processing step manually (by setting the meta.destination.splunk.source field), AxoRouter automatically sets the source to the name of the AxoRouter connector that received the message (for example, axorouter-syslog-tcp-514).
Sending data to Google SecOps
When sending the data collected from this source to a dynamic Google SecOps destination, Axoflow sets the following log type: FIREEYE_CMS.
Sending data to Microsoft Sentinel
When sending the data collected from this source to a Microsoft Sentinel destination, Axoflow normalizes the data and sends it to the following table: Syslog.
10.9.47.2 - Email Threat Prevention (ETP)
Email Threat Prevention (ETP):
Analyzes and filters email traffic to block phishing, malware, and targeted email-based threats.
When sending the data collected from this source to Splunk, Axoflow uses the following sourcetype and index settings:
sourcetype
index
fe_etp
fireeye
If the Axoflow classification doesn’t set the source field for the message automatically, and you haven’t set it in a flow processing step manually (by setting the meta.destination.splunk.source field), AxoRouter automatically sets the source to the name of the AxoRouter connector that received the message (for example, axorouter-syslog-tcp-514).
Sending data to Google SecOps
When sending the data collected from this source to a dynamic Google SecOps destination, Axoflow sets the following log type: FIREEYE_ETP.
Sending data to Microsoft Sentinel
When sending the data collected from this source to a Microsoft Sentinel destination, Axoflow normalizes the data and sends it to the following table: Syslog.
10.9.47.3 - Endpoint Security (HX)
Endpoint Security (HX):
Detects and responds to advanced threats on endpoints using behavior-based analysis and threat intel.
If the Axoflow classification doesn’t set the source field for the message automatically, and you haven’t set it in a flow processing step manually (by setting the meta.destination.splunk.source field), AxoRouter automatically sets the source to the name of the AxoRouter connector that received the message (for example, axorouter-syslog-tcp-514).
Sending data to Google SecOps
When sending the data collected from this source to a dynamic Google SecOps destination, Axoflow sets the following log type: FIREEYE_HX.
Sending data to Microsoft Sentinel
When sending the data collected from this source to a Microsoft Sentinel destination, Axoflow normalizes the data and sends it to the following table: Syslog.
Earlier name/vendor
FireEye Endpoint Security (HX)
10.9.47.4 - ePolicy Orchestrator (EPO)
ePolicy Orchestrator (EPO):
Analyzes and filters email traffic to block phishing, malware, and targeted email-based threats.
When sending the data collected from this source to Splunk, Axoflow uses the following sourcetype and index settings:
sourcetype
index
source
mcafee:epo:syslog
epav
trellix_endpoint_security
If the Axoflow classification doesn’t set the source field for the message automatically, and you haven’t set it in a flow processing step manually (by setting the meta.destination.splunk.source field), AxoRouter automatically sets the source to the name of the AxoRouter connector that received the message (for example, axorouter-syslog-tcp-514).
Sending data to Google SecOps
When sending the data collected from this source to a dynamic Google SecOps destination, Axoflow sets the following log type: MCAFEE_EPO.
Sending data to Microsoft Sentinel
When sending the data collected from this source to a Microsoft Sentinel destination, Axoflow normalizes the data and sends it to the following table: Syslog.
Earlier name/vendor
McAfee ePolicy Orchestrator (EPO)
10.9.47.5 - Intrusion Prevention System
Intrusion Prevention System:
Trellix Intrusion Prevention System is an NDR-ready, next-generation IPS that detects and blocks sophisticated malware threats across the network.
If the Axoflow classification doesn’t set the source field for the message automatically, and you haven’t set it in a flow processing step manually (by setting the meta.destination.splunk.source field), AxoRouter automatically sets the source to the name of the AxoRouter connector that received the message (for example, axorouter-syslog-tcp-514).
Sending data to Google SecOps
When sending the data collected from this source to a dynamic Google SecOps destination, Axoflow sets the following log type: MCAFEE_NSP.
Sending data to Microsoft Sentinel
When sending the data collected from this source to a Microsoft Sentinel destination, Axoflow normalizes the data and sends it to the following table: Syslog.
Earlier name/vendor
McAfee Network Security Platform
10.9.47.6 - MPS
MPS:
Appliance for detecting and blocking advanced threats through inline malware inspection.
When sending the data collected from this source to Splunk, Axoflow uses the following sourcetype and index settings:
sourcetype
index
deepsecurity
epintel
deepsecurity-system_events
epintel
deepsecurity-intrusion_prevention
epintel
deepsecurity-firewall
epintel
deepsecurity-antimalware
epintel
deepsecurity-integrity_monitoring
epintel
deepsecurity-log_inspection
epintel
deepsecurity-web_reputation
epintel
deepsecurity-app_control
epintel
deepsecurity-system_events
epintel
If the Axoflow classification doesn’t set the source field for the message automatically, and you haven’t set it in a flow processing step manually (by setting the meta.destination.splunk.source field), AxoRouter automatically sets the source to the name of the AxoRouter connector that received the message (for example, axorouter-syslog-tcp-514).
Sending data to Google SecOps
When sending the data collected from this source to a dynamic Google SecOps destination, Axoflow sets the following log type: TRENDMICRO_DEEP_SECURITY.
Sending data to Microsoft Sentinel
When sending the data collected from this source to a Microsoft Sentinel destination, Axoflow normalizes the data and sends it to the following table: Syslog.
10.9.49 - Ubiquiti
10.9.49.1 - Unifi
Unifi:
Manages network devices including routers, switches, and access points with centralized control.
When sending the data collected from this source to Splunk, Axoflow uses the following sourcetype and index settings:
sourcetype
index
ubnt
netops
ubnt:cef
netops
ubnt:dhcp
netops
ubnt:dnsmasq
netops
ubnt:edgeswitch
netops
ubnt:hostapd
netops
ubnt:link
netops
ubnt:mcad
netops
ubnt:sudo
netops
ubnt:wireless
netops
ubnt:fw
netfw
ubnt:fw:cef
netfw
If the Axoflow classification doesn’t set the source field for the message automatically, and you haven’t set it in a flow processing step manually (by setting the meta.destination.splunk.source field), AxoRouter automatically sets the source to the name of the AxoRouter connector that received the message (for example, axorouter-syslog-tcp-514).
Sending data to Google SecOps
When sending the data collected from this source to a dynamic Google SecOps destination, Axoflow sets the following log type: UBIQUITI_SWITCH.
Sending data to Microsoft Sentinel
When sending the data collected from this source to a Microsoft Sentinel destination, Axoflow normalizes the data and sends it to the following table: Syslog.
10.9.50 - Varonis
10.9.50.1 - DatAdvantage
DatAdvantage:
Monitors data access and permissions to detect insider threats and automate compliance reporting.
When sending the data collected from this source to Splunk, Axoflow uses the following sourcetype and index settings:
sourcetype
index
varonis:ta
main
If the Axoflow classification doesn’t set the source field for the message automatically, and you haven’t set it in a flow processing step manually (by setting the meta.destination.splunk.source field), AxoRouter automatically sets the source to the name of the AxoRouter connector that received the message (for example, axorouter-syslog-tcp-514).
Sending data to Google SecOps
When sending the data collected from this source to a dynamic Google SecOps destination, Axoflow sets the following log type: VARONIS.
Sending data to Microsoft Sentinel
When sending the data collected from this source to a Microsoft Sentinel destination, Axoflow normalizes the data and sends it to the following table: Syslog.
10.9.51 - Vectra AI
Earlier name/vendor
Vectra Cognito
10.9.51.1 - AI Platform
AI Platform:
Detects and investigates cyberattacks across cloud, data center, and enterprise networks using AI.
When sending the data collected from this source to Splunk, Axoflow uses the following sourcetype and index settings:
sourcetype
index
vectra:cognito:detect
main
vectra:cognito:accountdetect
main
vectra:cognito:accountscoring
main
vectra:cognito:audit
main
vectra:cognito:campaigns
main
vectra:cognito:health
main
vectra:cognito:hostscoring
main
vectra:cognito:accountlockdown
main
If the Axoflow classification doesn’t set the source field for the message automatically, and you haven’t set it in a flow processing step manually (by setting the meta.destination.splunk.source field), AxoRouter automatically sets the source to the name of the AxoRouter connector that received the message (for example, axorouter-syslog-tcp-514).
Sending data to Google SecOps
When sending the data collected from this source to a dynamic Google SecOps destination, Axoflow sets the following log type: VECTRA_DETECT.
Sending data to Microsoft Sentinel
When sending the data collected from this source to a Microsoft Sentinel destination, Axoflow normalizes the data and sends it to the following table: Syslog.
Earlier name/vendor
Cognito Detect
Vectra Detect
10.9.52 - Zscaler appliances
10.9.52.1 - Zscaler Nanolog Streaming Service
Zscaler Nanolog Streaming Service:
Cloud-based secure internet gateway that inspects traffic for threats and enforces policies.
If the Axoflow classification doesn’t set the source field for the message automatically, and you haven’t set it in a flow processing step manually (by setting the meta.destination.splunk.source field), AxoRouter automatically sets the source to the name of the AxoRouter connector that received the message (for example, axorouter-syslog-tcp-514).
Sending data to Google SecOps
When sending the data collected from this source to a dynamic Google SecOps destination, Axoflow sets the following log type: ZSCALER_INTERNET_ACCESS.
Sending data to Microsoft Sentinel
When sending the data collected from this source to a Microsoft Sentinel destination, Axoflow normalizes the data and sends it to the following table: Syslog.
10.9.52.2 - Zscaler Log Streaming Service
Zscaler Log Streaming Service:
Provides secure remote access to internal apps without exposing them to the public internet.
If the Axoflow classification doesn’t set the source field for the message automatically, and you haven’t set it in a flow processing step manually (by setting the meta.destination.splunk.source field), AxoRouter automatically sets the source to the name of the AxoRouter connector that received the message (for example, axorouter-syslog-tcp-514).
Sending data to Google SecOps
When sending the data collected from this source to a dynamic Google SecOps destination, Axoflow sets the following log type: ZSCALER_ZPA, ZSCALER_ZPA_AUDIT.
Sending data to Microsoft Sentinel
When sending the data collected from this source to a Microsoft Sentinel destination, Axoflow normalizes the data and sends it to the following table: Syslog.
11 - Destinations
The following chapters show you how to configure Axoflow to send your data to specific destinations, like SIEMs or object storage solutions.
You can find the list of existing destinations on the Destinations page.
To modify an existing destination, select its name from the list, then select Edit.
Stores and External Stores are also listed as destinations.
AxoStore stores logs locally on the AxoRouter that processed the messages.
External stores use a separately deployed AxoLake or an existing compatible ClickHouse cluster.
To create a new destination, select Add Destination. See the section of the specific destination for details.
11.1 - Amazon
11.1.1 - Amazon S3
Amazon S3:
Scalable cloud storage service for storing and retrieving any amount of data via object storage.
To add an Amazon S3 destination to Axoflow, complete the following steps.
Prerequisites
An existing S3 bucket configured for programmatic access, and the related ACCESS_KEY and SECRET_KEY of a user that can access it. The user needs to have the following permissions:
To configure Axoflow, you’ll need the bucket name, region (or URL), access key, and the secret key of the bucket.
Steps
Create a new destination.
Open the AxoConsole.
Select Destinations > + Add Destination.
Configure the destination.
Select Amazon S3.
Enter a name for the destination.
Enter the name of the bucket you want to use.
Enter the region code of the bucket into the Region field (for example, us-east-1.), or select the Use custom endpoint URL option, and enter the URL of the endpoint into the URL field.
Enter the Access key and the Secret key for the account you want to use.
Enter the Object key (or key name), which uniquely identifies the object in an Amazon S3 bucket, for example: my-logs/${HOSTNAME}/.
Select the Object key timestamp format you want to use, or select Use custom object key timestamp and enter a custom template. For details on the available date-related macros, see the AxoSyslog documentation.
Set the maximal size of the S3 object in the Maximum object size field. If an object reaches this size, Axoflow appends an index ("-1", “-2”, …) to the end of the object key and starts a new object after rotation.
(Optional) If needed, adjust the size of messages written to the S3 object in a batch using the Chunk size field.
(Optional) Set other options as needed for your environment.
Message Format: Specifies the message format and normalization. Possible values:
Elastic Common Schema (ECS): Normalize the data using the ECS schema.
Open Cybersecurity Schema Framework (OCSF): Normalize the data using the OCSF schema.
Parsed: Send the parsed data without further normalization.
To create a fallback flow, select Add Flow > Fallback flow.
Enter a name for the flow, for example, my-test-flow.
In the Router Selector field, enter an expression that matches the router(s) you want to apply the flow. To select a specific router, use a name selector, for example, name = my-axorouter-hostname.
You can use any labels and metadata of the AxoRouter hosts in the Router selectors, for example, the hostname of the AxoRouter, or any custom labels.
If you leave the Router Selector field empty, the selector will match every AxoRouter instance.
To select only a specific AxoRouter instance, set the name field to the name of the instance as selector. For example, name = my-axorouter.
If you set multiple fields in the selector, the selector will match only AxoRouter instances that match all elements of the selector. (There in an AND relationship between the fields.)
Note
You can configure multiple fallback flows, but only one fallback flow can apply to an AxoRouter (so the Router Selector of the fallback flows can’t overlap).
Select the Destination where you want to send your data. If you don’t have any destination configured, you can select + Add in the destination section to create a new destination now. For details on the different destinations, see Destinations.
If you don’t have any destination configured, see Destinations.
If you’ve already created a store, it automatically available as a destination. Note that the Router Selector of the flow must match only AxoRouters that have the selected store available, otherwise you’ll get an error message.
If you want to send data to another AxoRouter, enable the Show all destinations option, and select the connector of the AxoRouter where you want to send the data.
(Optional) To process the data transferred in the flow, select Add New Processing Step. For details, see Processing steps. For example:
Add a Classify, a Parse, and a Reduce step, in that order, to automatically remove redundant and empty fields from your data.
To select which messages are processed by the flow, add a Select Messages step, and enter a filter into the AQL Expression field. For example, to select only the messages received from Fortinet FortiGate firewalls, use the meta.vendor = fortinet AND meta.product = fortigate query.
Apache Kafka:
Distributed event streaming platform used for building real-time data pipelines and stream processing.
If you’d like to send data from AxoRouter to this destination, contact our support team for details.
11.3 - AxoStore
AxoStore is a lightweight, queryable, temporary storage option that stores data locally on the AxoRouter host. AxoConsole provides federated search for every AxoRouter that has AxoStore deployed, so you can simultaneously run queries on every AxoStore.
AxoStore is automatically available for all Axoflow customers, for each AxoRouter node, with 7 days retention, and up to 1TB of storage. For longer retention time or bigger storage, you need an extended AxoStore subscription. Contact us for the details.
You can retrieve selected data from AxoStore and (rehydrate) it to other destinations for further analysis as needed.
To send data to AxoStore, complete the following steps.
Prerequisites
AxoStore is available only if you’ve deployed a AxoRouter instance with AxoStore enabled. For details, see Install AxoRouter on Linux.
AxoStore is a local storage on the AxoRouter node. Only data received by the AxoRouter node can be sent to the AxoStore.
By default, there are no stores defined. See Create Store.
Steps
Create a flow to route data received by AxoRouter to the local AxoStore destination. Note the following points:
The amount of data you can store in AxoStore and its retention time is limited depending on your Axoflow subscription.
By default, AxoStore is enabled on every AxoRouter instance. If you’ve disabled it on some instances, make sure that the Router Selector matches only AxoRouter instances that have AxoStore enabled.
Enter the token you’ve created into the Token field.
Select the Dynatrace Bucket type (Logs or Security events) where you want to send the data. Where exactly the data will be stored in Dynatrace depends on your Bucket assignment rules.
Select the type of Dynatrace Collector where you want to send the data:
Cloud: Send data directly to your Dynatrace SaaS subscription.
ActiveGate: Send data directly to a local ActiveGate endpoint.
Advanced: Specify a custom URL endpoint.
If nothing prevents it, we recommend using the Cloud collector.
Configure the endpoint of the destination, depending on the collector type you’ve selected.
Cloud: Provide your Environment Id for your Dynatrace SaaS subscription.
ActiveGate:
Provide your Environment Id for your Dynatrace SaaS subscription.
Enter the Domain (or hostname) where your Dynatrace ActiveGate is running.
Enter the Port number where ActiveGate is listening on. Usually it’s 9999. and optionally the Port of the ActiveGate endpoint where you want to send your data.
Advanced: Specify a custom URL endpoint.
(Optional) Set other options as needed for your environments.
Timeout: The number of seconds to wait for a log-forwarding request to complete, and attempt to reconnect the server if exceeded. If the timeout is exceeded, AxoRouter attempts to reconnect the destination. The default (0) is unlimited. For more details, see the AxoSyslog documentation.
Disk Buffer: Explicitly enable or disable disk buffer on AxoRouter. Default value: Enabled.
AxoRouter can store messages on the local disk if the destination or the network connection to the destination becomes unavailable. AxoRouter automatically sends the stored messages (in the order they were received) to the destination when the connection is reestablished. Note that the disk buffer is separate from AxoStore.
Disk buffer capacity (bytes per worker): Size of the disk buffer files in bytes. This value applies for each worker. Default value is 100MiB (104857600 bytes), which is also the recommended minimum.
The disk required for using disk buffering is **Disk buffer capacity (bytes per worker)***Number of Workers for each destination of AxoRouter.
Batch Bytes: Sets the maximum size of payload in a batch. If the size of the messages reaches this value, AxoRouter sends the batch to the destination even if the number of messages is less than the value of the batch lines option.
CAUTION:
When setting Batch Bytes:
Note that the actual HTTP request will be about 4KB larger because of the request headers.
Check the configuration of your destination, as SaaS solutions and ingress controllers often limit the maximal size of HTTP requests. If the sum of Batch Bytes and the request headers exceeds this limit, the data will be rejected. (In case of NGINX, with a client intended to send too large body error message.)
Batch Lines: Number of lines sent to the destination in one batch. AxoRouter waits for this number of lines to accumulate and sends them off in a single batch. Increasing this number increases throughput as more messages are sent in a single batch, but also increases message latency.
Note that Initial window size * Maximum Connections must be greater or equal than Batch lines * Number of workers for all the sources that feeds a given destination. Otherwise, the destination worker might be unable to send data until Batch timeout expires, even if there’s data available.
Batch Timeout: Maximal time in milliseconds to wait for a batch to be filled before sending it. The default value (-1) means that the batch should be full before sending, which may result in a long wait if the incoming traffic is low. For more details, see the AxoSyslog documentation.
Content compression: Specifies the compression to use when sending data to the destination. No compression explicitly disables compression. Other possible values: Gzip, Deflate. Select only compression that your destination supports and has enabled. Default value: No compression
Number of Workers: Used for scaling the destination in case of high message load. Specifies the number of worker threads AxoRouter uses for sending messages to the destination. The default is 1. If high message throughput is not a concern, leave it on 1. For maximum performance, increase it up to the number of CPU cores available on AxoRouter. For more details, see the AxoSyslog documentation.
Response actions: Specifies what AxoRouter does with the log message, based on the response code received from the destination.
If the status code begins with 2 (for example, 200), AxoRouter assumes the message was successfully sent.
If you’ve configured a custom action in AxoConsole for the status code, AxoRouter performs the specified action.
To create a fallback flow, select Add Flow > Fallback flow.
Enter a name for the flow, for example, my-test-flow.
In the Router Selector field, enter an expression that matches the router(s) you want to apply the flow. To select a specific router, use a name selector, for example, name = my-axorouter-hostname.
You can use any labels and metadata of the AxoRouter hosts in the Router selectors, for example, the hostname of the AxoRouter, or any custom labels.
If you leave the Router Selector field empty, the selector will match every AxoRouter instance.
To select only a specific AxoRouter instance, set the name field to the name of the instance as selector. For example, name = my-axorouter.
If you set multiple fields in the selector, the selector will match only AxoRouter instances that match all elements of the selector. (There in an AND relationship between the fields.)
Note
You can configure multiple fallback flows, but only one fallback flow can apply to an AxoRouter (so the Router Selector of the fallback flows can’t overlap).
Select the Destination where you want to send your data. If you don’t have any destination configured, you can select + Add in the destination section to create a new destination now. For details on the different destinations, see Destinations.
If you don’t have any destination configured, see Destinations.
If you’ve already created a store, it automatically available as a destination. Note that the Router Selector of the flow must match only AxoRouters that have the selected store available, otherwise you’ll get an error message.
If you want to send data to another AxoRouter, enable the Show all destinations option, and select the connector of the AxoRouter where you want to send the data.
(Optional) To process the data transferred in the flow, select Add New Processing Step. For details, see Processing steps. For example:
Add a Classify, a Parse, and a Reduce step, in that order, to automatically remove redundant and empty fields from your data.
To select which messages are processed by the flow, add a Select Messages step, and enter a filter into the AQL Expression field. For example, to select only the messages received from Fortinet FortiGate firewalls, use the meta.vendor = fortinet AND meta.product = fortigate query.
To configure Axoflow, you’ll need the username, password, and the Elasticsearch index where you want to send your data.
Steps
Create a new destination.
Open the AxoConsole.
Select Destinations > + Add Destination.
Configure the destination.
Select Elasticsearch.
Select which type of configuration you want to use:
Simple: Send all data into a single index.
Dynamic: Send data to an index based on the content or metadata of the incoming messages (or to a default index).
Advanced: Allows you to specify a custom URL endpoint.
Enter a name for the destination.
Configure the endpoint of the destination.
Advanced: Enter your Elasticsearch URL into the URL field, for example, http://my-elastic-server:9200/_bulk
Simple and Dynamic:
Select the HTTPS or HTTP protocol to use to access your destination.
Enter the Hostname and Port of the destination.
Specify the Elasticsearch index to send the data to.
Simple: Enter the expression that specifies the Elasticsearch index to use into the Index field, for example: test-${YEAR}${MONTH}${DAY}. All data will be sent into this index.
Dynamic and Advanced: Enter the expression that specifies the default index. The data will be sent into this index if no other index is set during the processing of the message (for example, by the processing steps of the Flow).
Enter the username and password for the account you want to use.
(Optional)
By default, Axoflow rejects connections to the destination server if the certificate of the server is invalid (for example, it’s expired, signed by an unknown CA, or its CN and the name of the server is mismatched: the Common Name or the subject_alt_name parameter of the peer’s certificate must contain the hostname or the IP address (as resolved from AxoRouter) of the peer).
Warning
When validating a certificate, the entire certificate chain must be valid, including the CA certificate. If any certificate of the chain is invalid, Axoflow will reject the connection.
If you want to accept invalid certificates (or no certificate) from the destination servers, disable the Verify server certificate option.
(Optional) Set other options as needed for your environments.
Timeout: The number of seconds to wait for a log-forwarding request to complete, and attempt to reconnect the server if exceeded. If the timeout is exceeded, AxoRouter attempts to reconnect the destination. The default (0) is unlimited. For more details, see the AxoSyslog documentation.
Disk Buffer: Explicitly enable or disable disk buffer on AxoRouter. Default value: Enabled.
AxoRouter can store messages on the local disk if the destination or the network connection to the destination becomes unavailable. AxoRouter automatically sends the stored messages (in the order they were received) to the destination when the connection is reestablished. Note that the disk buffer is separate from AxoStore.
Disk buffer capacity (bytes per worker): Size of the disk buffer files in bytes. This value applies for each worker. Default value is 100MiB (104857600 bytes), which is also the recommended minimum.
The disk required for using disk buffering is **Disk buffer capacity (bytes per worker)***Number of Workers for each destination of AxoRouter.
Batch Bytes: Sets the maximum size of payload in a batch. If the size of the messages reaches this value, AxoRouter sends the batch to the destination even if the number of messages is less than the value of the batch lines option.
CAUTION:
When setting Batch Bytes:
Note that the actual HTTP request will be about 4KB larger because of the request headers.
Check the configuration of your destination, as SaaS solutions and ingress controllers often limit the maximal size of HTTP requests. If the sum of Batch Bytes and the request headers exceeds this limit, the data will be rejected. (In case of NGINX, with a client intended to send too large body error message.)
Batch Lines: Number of lines sent to the destination in one batch. AxoRouter waits for this number of lines to accumulate and sends them off in a single batch. Increasing this number increases throughput as more messages are sent in a single batch, but also increases message latency.
Note that Initial window size * Maximum Connections must be greater or equal than Batch lines * Number of workers for all the sources that feeds a given destination. Otherwise, the destination worker might be unable to send data until Batch timeout expires, even if there’s data available.
Batch Timeout: Maximal time in milliseconds to wait for a batch to be filled before sending it. The default value (-1) means that the batch should be full before sending, which may result in a long wait if the incoming traffic is low. For more details, see the AxoSyslog documentation.
Content compression: Specifies the compression to use when sending data to the destination. No compression explicitly disables compression. Other possible values: Gzip, Deflate. Select only compression that your destination supports and has enabled. Default value: No compression
Number of Workers: Used for scaling the destination in case of high message load. Specifies the number of worker threads AxoRouter uses for sending messages to the destination. The default is 1. If high message throughput is not a concern, leave it on 1. For maximum performance, increase it up to the number of CPU cores available on AxoRouter. For more details, see the AxoSyslog documentation.
Response actions: Specifies what AxoRouter does with the log message, based on the response code received from the destination.
If the status code begins with 2 (for example, 200), AxoRouter assumes the message was successfully sent.
If you’ve configured a custom action in AxoConsole for the status code, AxoRouter performs the specified action.
To create a fallback flow, select Add Flow > Fallback flow.
Enter a name for the flow, for example, my-test-flow.
In the Router Selector field, enter an expression that matches the router(s) you want to apply the flow. To select a specific router, use a name selector, for example, name = my-axorouter-hostname.
You can use any labels and metadata of the AxoRouter hosts in the Router selectors, for example, the hostname of the AxoRouter, or any custom labels.
If you leave the Router Selector field empty, the selector will match every AxoRouter instance.
To select only a specific AxoRouter instance, set the name field to the name of the instance as selector. For example, name = my-axorouter.
If you set multiple fields in the selector, the selector will match only AxoRouter instances that match all elements of the selector. (There in an AND relationship between the fields.)
Note
You can configure multiple fallback flows, but only one fallback flow can apply to an AxoRouter (so the Router Selector of the fallback flows can’t overlap).
Select the Destination where you want to send your data. If you don’t have any destination configured, you can select + Add in the destination section to create a new destination now. For details on the different destinations, see Destinations.
If you don’t have any destination configured, see Destinations.
If you’ve already created a store, it automatically available as a destination. Note that the Router Selector of the flow must match only AxoRouters that have the selected store available, otherwise you’ll get an error message.
If you want to send data to another AxoRouter, enable the Show all destinations option, and select the connector of the AxoRouter where you want to send the data.
(Optional) To process the data transferred in the flow, select Add New Processing Step. For details, see Processing steps. For example:
Add a Classify, a Parse, and a Reduce step, in that order, to automatically remove redundant and empty fields from your data.
To select which messages are processed by the flow, add a Select Messages step, and enter a filter into the AQL Expression field. For example, to select only the messages received from Fortinet FortiGate firewalls, use the meta.vendor = fortinet AND meta.product = fortigate query.
/dev/null:
Blackhole destination for testing or discarding events without storing them.
This is a null destination that discards (drops) every data it receives, but reports that it has successfully received the data. This is useful sometimes for testing and performance measurements, for example, to find out if a real destination is the bottleneck, or another element in the upstream pipeline.
CAUTION:
All data that’s sent to the /dev/null destination only is irrevocably lost.
To create a fallback flow, select Add Flow > Fallback flow.
Enter a name for the flow, for example, my-test-flow.
In the Router Selector field, enter an expression that matches the router(s) you want to apply the flow. To select a specific router, use a name selector, for example, name = my-axorouter-hostname.
You can use any labels and metadata of the AxoRouter hosts in the Router selectors, for example, the hostname of the AxoRouter, or any custom labels.
If you leave the Router Selector field empty, the selector will match every AxoRouter instance.
To select only a specific AxoRouter instance, set the name field to the name of the instance as selector. For example, name = my-axorouter.
If you set multiple fields in the selector, the selector will match only AxoRouter instances that match all elements of the selector. (There in an AND relationship between the fields.)
Note
You can configure multiple fallback flows, but only one fallback flow can apply to an AxoRouter (so the Router Selector of the fallback flows can’t overlap).
Select the Destination where you want to send your data. If you don’t have any destination configured, you can select + Add in the destination section to create a new destination now. For details on the different destinations, see Destinations.
If you don’t have any destination configured, see Destinations.
If you’ve already created a store, it automatically available as a destination. Note that the Router Selector of the flow must match only AxoRouters that have the selected store available, otherwise you’ll get an error message.
If you want to send data to another AxoRouter, enable the Show all destinations option, and select the connector of the AxoRouter where you want to send the data.
(Optional) To process the data transferred in the flow, select Add New Processing Step. For details, see Processing steps. For example:
Add a Classify, a Parse, and a Reduce step, in that order, to automatically remove redundant and empty fields from your data.
To select which messages are processed by the flow, add a Select Messages step, and enter a filter into the AQL Expression field. For example, to select only the messages received from Fortinet FortiGate firewalls, use the meta.vendor = fortinet AND meta.product = fortigate query.
Save the processing steps.
Select Add.
The new flow appears in the Flows list.
11.8.2 - syslog
syslog:
Standard protocol for system logs. Our source automatically detects, parses, and classifies incoming syslog events without pre-configuration.
The syslog destination forwards your security data in an RFC-3164 or RFC-5424 compliant syslog format, using the UDP, TCP, or TLS-encrypted TCP protocols.
Prerequisites
If you want to enable TLS encryption for this connector to encrypt the communication with the sources, you’ll need to set appropriate keys and certificates.
CAUTION:
Copy the keys and certificates to AxoRouter before starting to configure the connector. Otherwise, you won’t be able to make configuration changes that require reloading the AxoRouter service, including starting log tapping or flow tapping.
Note the following points:
Keys and certificates must be in PEM format.
If the file contains a certificate chain, the file must begin with the certificate of the host, followed by the CA certificate that signed the certificate of the host, and any other signing CAs in order.
You must manually copy these files to their place on the AxoRouter host, currently you can’t distribute them from AxoConsole.
The files must be readable by the axorouter service.
The recommended path for certificates is under /etc/axorouter/user-config/ (for example, /etc/axorouter/user-config/tls-key.pem). (If you need to use a different path, you have to append an option like -v /your/path:/your/path to the AXOROUTER_PODMAN_ARGS variable of /etc/axorouter/container.env.)
When referring to the key or certificate during when configuring the connector, use absolute paths (for example, /etc/axorouter/user-config/tls-key.pem).
Steps
Create a new destination.
Open the AxoConsole.
Select Destinations > + Add Destination.
Configure the destination.
Select Syslog.
Select the template to use one of the standard syslog ports and transport protocols—for example, UDP port 514, which is commonly used for the RFC3164 syslog protocol.
To configure a different port, or to specify the protocol elements manually, select Custom.
Enter a name for the destination.
(Optional): Add custom labels to the destination.
Select the protocol to use for sending syslog data: TCP, UDP, or TLS.
Select the syslog format to use: BSD (RFC3164) or Syslog (RFC5424).
(Optional) If explicitly needed for your use case, you can configure *Framing manually when using the Syslog (RFC5424) format. Enable framing (On) if the payload contains the length of the message as specified in RFC6587 3.4.1. Disable (Off) for non-transparent-framing RFC6587 3.4.2.
If you’ve selected Protocol > TLS, set the TLS-related options.
When using TLS, set the paths for the certificates and keys used for the TLS-encrypted communication with the clients. For details, see Prerequisites.
Client certificate path: The certificate that AxoRouter shows to the destination server.
Client private key path: The private key of the client certificate.
CA certificate path: The CA certificate that AxoRouter uses to verify the certificate of the destination if Verify peer certificate is enabled.
Set the Address and the Port of the destination. Usually:
514 UDP and TCP for RFC3164 (BSD-syslog) and RFC5424 (IETF-syslog) formatted traffic. AxoRouter automatically recognizes and handles both formats.
601 TCP for RFC5424 (IETF-syslog) and RFC3164 (BSD-syslog) formatted traffic. AxoRouter automatically recognizes and handles both formats.
6514 TCP for TLS-encrypted syslog traffic.
(Optional) To rate-limit the output of the destination, set the number of messages (per second) to send in the Throttle field.
To create a fallback flow, select Add Flow > Fallback flow.
Enter a name for the flow, for example, my-test-flow.
In the Router Selector field, enter an expression that matches the router(s) you want to apply the flow. To select a specific router, use a name selector, for example, name = my-axorouter-hostname.
You can use any labels and metadata of the AxoRouter hosts in the Router selectors, for example, the hostname of the AxoRouter, or any custom labels.
If you leave the Router Selector field empty, the selector will match every AxoRouter instance.
To select only a specific AxoRouter instance, set the name field to the name of the instance as selector. For example, name = my-axorouter.
If you set multiple fields in the selector, the selector will match only AxoRouter instances that match all elements of the selector. (There in an AND relationship between the fields.)
Note
You can configure multiple fallback flows, but only one fallback flow can apply to an AxoRouter (so the Router Selector of the fallback flows can’t overlap).
Select the Destination where you want to send your data. If you don’t have any destination configured, you can select + Add in the destination section to create a new destination now. For details on the different destinations, see Destinations.
If you don’t have any destination configured, see Destinations.
If you’ve already created a store, it automatically available as a destination. Note that the Router Selector of the flow must match only AxoRouters that have the selected store available, otherwise you’ll get an error message.
If you want to send data to another AxoRouter, enable the Show all destinations option, and select the connector of the AxoRouter where you want to send the data.
(Optional) To process the data transferred in the flow, select Add New Processing Step. For details, see Processing steps. For example:
Add a Classify, a Parse, and a Reduce step, in that order, to automatically remove redundant and empty fields from your data.
To select which messages are processed by the flow, add a Select Messages step, and enter a filter into the AQL Expression field. For example, to select only the messages received from Fortinet FortiGate firewalls, use the meta.vendor = fortinet AND meta.product = fortigate query.
Save the processing steps.
Select Add.
The new flow appears in the Flows list.
Protocol-specific destination options
If needed, select More options to set the following when using the TCP or TLS protocol:
TCP Keepalive Time Interval: The interval (number of seconds) between subsequential keepalive probes, regardless of the traffic exchanged in the connection.
TCP Keepalive Probes: The number of unacknowledged probes to send before considering the connection dead.
TCP Keepalive Time: The interval (in seconds) between the last data packet sent and the first keepalive probe.
Advanced options
Disk Buffer: Explicitly enable or disable disk buffer on AxoRouter. Default value: Enabled.
AxoRouter can store messages on the local disk if the destination or the network connection to the destination becomes unavailable. AxoRouter automatically sends the stored messages (in the order they were received) to the destination when the connection is reestablished. Note that the disk buffer is separate from AxoStore.
Disk buffer capacity (bytes per worker): Size of the disk buffer files in bytes. This value applies for each worker. Default value is 100MiB (104857600 bytes), which is also the recommended minimum.
The disk required for using disk buffering is **Disk buffer capacity (bytes per worker)***Number of Workers for each destination of AxoRouter.
11.9 - Google
11.9.1 - BigQuery
Axoflow will soon support sending data to Google BigQuery using a high-performance gRPC-based destination.
Alternatively, you can set up AxoRouter to send data through a Google Pub/Sub destination.
If you’d like to send data from AxoRouter to this destination, contact our support team for details.
11.9.2 - Google Cloud Pub/Sub
Google Cloud Pub/Sub:
Asynchronous messaging service for ingesting and distributing event data between services and applications.
To add a Google Cloud Pub/Sub destination to Axoflow, complete the following steps. Axoflow can send data to Google Cloud Pub/Sub using its gRPC interface.
Select which type of configuration you want to use:
Simple: Send all data into a project and topic.
Dynamic: Send data to a project and topic based on the content or metadata of the incoming messages (or to a default project/topic).
Enter a name for the destination.
Specify the project and topic to send the data to.
Simple: Enter the ID of the GCP Project and the Topic. All data will be sent to this topic.
Dynamic: Enter the expression that specifies the default Project and Topic. The data will be sent here unless it is set during the processing of the message (for example, by the processing steps of the Flow).
Configure the authentication method to access the GCP project.
Automatic (ADC): Use the service account attached to the cloud resource (VM) that hosts AxoRouter.
Service Account File: Specify the path where a service account key file is located (for example, /etc/axorouter/user-config/). You must manually copy that file to its place, currently you can’t distribute it from Axoflow.
None: Disable authentication completely. Only available when the More options > Service Endpoint option is set.
CAUTION:
Do not disable authentication in production.
(Optional) Set other options as needed for your environments.
Service Endpoint: Use a custom API endpoint. Leave it empty to use the default: https://pubsub.googleapis.com
Disk Buffer: Explicitly enable or disable disk buffer on AxoRouter. Default value: Enabled.
AxoRouter can store messages on the local disk if the destination or the network connection to the destination becomes unavailable. AxoRouter automatically sends the stored messages (in the order they were received) to the destination when the connection is reestablished. Note that the disk buffer is separate from AxoStore.
Disk buffer capacity (bytes per worker): Size of the disk buffer files in bytes. This value applies for each worker. Default value is 100MiB (104857600 bytes), which is also the recommended minimum.
The disk required for using disk buffering is **Disk buffer capacity (bytes per worker)***Number of Workers for each destination of AxoRouter.
Batch Bytes: Sets the maximum size of payload in a batch. If the size of the messages reaches this value, AxoRouter sends the batch to the destination even if the number of messages is less than the value of the batch lines option.
CAUTION:
When setting Batch Bytes:
Note that the actual HTTP request will be about 4KB larger because of the request headers.
Check the configuration of your destination, as SaaS solutions and ingress controllers often limit the maximal size of HTTP requests. If the sum of Batch Bytes and the request headers exceeds this limit, the data will be rejected. (In case of NGINX, with a client intended to send too large body error message.)
Batch Lines: Number of lines sent to the destination in one batch. AxoRouter waits for this number of lines to accumulate and sends them off in a single batch. Increasing this number increases throughput as more messages are sent in a single batch, but also increases message latency.
Note that Initial window size * Maximum Connections must be greater or equal than Batch lines * Number of workers for all the sources that feeds a given destination. Otherwise, the destination worker might be unable to send data until Batch timeout expires, even if there’s data available.
Batch Timeout: Maximal time in milliseconds to wait for a batch to be filled before sending it. The default value (-1) means that the batch should be full before sending, which may result in a long wait if the incoming traffic is low. For more details, see the AxoSyslog documentation.
Number of Workers: Used for scaling the destination in case of high message load. Specifies the number of worker threads AxoRouter uses for sending messages to the destination. The default is 1. If high message throughput is not a concern, leave it on 1. For maximum performance, increase it up to the number of CPU cores available on AxoRouter. For more details, see the AxoSyslog documentation.
To create a fallback flow, select Add Flow > Fallback flow.
Enter a name for the flow, for example, my-test-flow.
In the Router Selector field, enter an expression that matches the router(s) you want to apply the flow. To select a specific router, use a name selector, for example, name = my-axorouter-hostname.
You can use any labels and metadata of the AxoRouter hosts in the Router selectors, for example, the hostname of the AxoRouter, or any custom labels.
If you leave the Router Selector field empty, the selector will match every AxoRouter instance.
To select only a specific AxoRouter instance, set the name field to the name of the instance as selector. For example, name = my-axorouter.
If you set multiple fields in the selector, the selector will match only AxoRouter instances that match all elements of the selector. (There in an AND relationship between the fields.)
Note
You can configure multiple fallback flows, but only one fallback flow can apply to an AxoRouter (so the Router Selector of the fallback flows can’t overlap).
Select the Destination where you want to send your data. If you don’t have any destination configured, you can select + Add in the destination section to create a new destination now. For details on the different destinations, see Destinations.
If you don’t have any destination configured, see Destinations.
If you’ve already created a store, it automatically available as a destination. Note that the Router Selector of the flow must match only AxoRouters that have the selected store available, otherwise you’ll get an error message.
If you want to send data to another AxoRouter, enable the Show all destinations option, and select the connector of the AxoRouter where you want to send the data.
(Optional) To process the data transferred in the flow, select Add New Processing Step. For details, see Processing steps. For example:
Add a Classify, a Parse, and a Reduce step, in that order, to automatically remove redundant and empty fields from your data.
To select which messages are processed by the flow, add a Select Messages step, and enter a filter into the AQL Expression field. For example, to select only the messages received from Fortinet FortiGate firewalls, use the meta.vendor = fortinet AND meta.product = fortigate query.
Add the meta.pubsub.attributes = json(); line to add an empty JSON object to the messages.
Set your custom attributes under the meta.pubsub.attributes key. For example, if you want to include the timestamp as a custom attribute as well, you can use:
Google Security Operations (SecOps):
A cloud service designed for enterprises to privately retain, analyze, and search the massive amounts of security and network telemetry they generate.
Select which type of configuration you want to use:
Simple: Send all data into a namespace with a single log type.
Dynamic: Send data to a namespace with a log type based on the content or metadata of the incoming messages (or to a default namespace/log type).
Advanced: Specify the full endpoint URL.
Enter a name for the destination.
Enter the URL endpoint for the destination.
Simple and Dynamic: Enter base URL for the regional service endpoint to use into the Service Endpoint field, for example, https://malachiteingestion-pa.googleapis.com for the US region.
Advanced: Enter the full URL to use for ingesting logs into the Endpoint URL field, for example, https://malachiteingestion-pa.googleapis.com/v2/unstructuredlogentries:batchCreate.
Specify the log type to send the data to.
Simple and Advanced: Enter the Log type to assign to the data. All data will be assigned the specified log type.
Dynamic: Enter the Default log type. The data will be sent with the specified log type unless it is set during the processing of the message (for example, by the automatic classification, or the processing steps of the Flow).
Enter the unique ID of your Google SecOps instance into the Customer ID field.
(Optional) Specify the namespace to send the data to. Usually it’s not needed to use namespaces.
Simple and Advanced: Enter the Namespace where to send the data. All data will be sent to this namespace.
Dynamic: Enter the Default namespace. The data will be sent into this namespace unless it is set during the processing of the message (for example, by the processing steps of the Flow).
Configure the authentication method to access the GCP project.
Automatic (ADC): Use the service account attached to the cloud resource (VM) that hosts AxoRouter.
Service Account File: Specify the path where a service account key file is located (for example, /etc/axorouter/user-config/serviceaccount.json). You must manually copy that file to its place, currently you can’t distribute it from Axoflow.
(Optional) Set other options as needed for your environments.
Timeout: The number of seconds to wait for a log-forwarding request to complete, and attempt to reconnect the server if exceeded. If the timeout is exceeded, AxoRouter attempts to reconnect the destination. The default (0) is unlimited. For more details, see the AxoSyslog documentation.
Disk Buffer: Explicitly enable or disable disk buffer on AxoRouter. Default value: Enabled.
AxoRouter can store messages on the local disk if the destination or the network connection to the destination becomes unavailable. AxoRouter automatically sends the stored messages (in the order they were received) to the destination when the connection is reestablished. Note that the disk buffer is separate from AxoStore.
Disk buffer capacity (bytes per worker): Size of the disk buffer files in bytes. This value applies for each worker. Default value is 100MiB (104857600 bytes), which is also the recommended minimum.
The disk required for using disk buffering is **Disk buffer capacity (bytes per worker)***Number of Workers for each destination of AxoRouter.
Batch Bytes: Sets the maximum size of payload in a batch. If the size of the messages reaches this value, AxoRouter sends the batch to the destination even if the number of messages is less than the value of the batch lines option.
CAUTION:
When setting Batch Bytes:
Note that the actual HTTP request will be about 4KB larger because of the request headers.
Check the configuration of your destination, as SaaS solutions and ingress controllers often limit the maximal size of HTTP requests. If the sum of Batch Bytes and the request headers exceeds this limit, the data will be rejected. (In case of NGINX, with a client intended to send too large body error message.)
Batch Lines: Number of lines sent to the destination in one batch. AxoRouter waits for this number of lines to accumulate and sends them off in a single batch. Increasing this number increases throughput as more messages are sent in a single batch, but also increases message latency.
Note that Initial window size * Maximum Connections must be greater or equal than Batch lines * Number of workers for all the sources that feeds a given destination. Otherwise, the destination worker might be unable to send data until Batch timeout expires, even if there’s data available.
Batch Timeout: Maximal time in milliseconds to wait for a batch to be filled before sending it. The default value (-1) means that the batch should be full before sending, which may result in a long wait if the incoming traffic is low. For more details, see the AxoSyslog documentation.
Content compression: Specifies the compression to use when sending data to the destination. No compression explicitly disables compression. Other possible values: Gzip, Deflate. Select only compression that your destination supports and has enabled. Default value: No compression
Number of Workers: Used for scaling the destination in case of high message load. Specifies the number of worker threads AxoRouter uses for sending messages to the destination. The default is 1. If high message throughput is not a concern, leave it on 1. For maximum performance, increase it up to the number of CPU cores available on AxoRouter. For more details, see the AxoSyslog documentation.
Response actions: Specifies what AxoRouter does with the log message, based on the response code received from the destination.
If the status code begins with 2 (for example, 200), AxoRouter assumes the message was successfully sent.
If you’ve configured a custom action in AxoConsole for the status code, AxoRouter performs the specified action.
To create a fallback flow, select Add Flow > Fallback flow.
Enter a name for the flow, for example, my-test-flow.
In the Router Selector field, enter an expression that matches the router(s) you want to apply the flow. To select a specific router, use a name selector, for example, name = my-axorouter-hostname.
You can use any labels and metadata of the AxoRouter hosts in the Router selectors, for example, the hostname of the AxoRouter, or any custom labels.
If you leave the Router Selector field empty, the selector will match every AxoRouter instance.
To select only a specific AxoRouter instance, set the name field to the name of the instance as selector. For example, name = my-axorouter.
If you set multiple fields in the selector, the selector will match only AxoRouter instances that match all elements of the selector. (There in an AND relationship between the fields.)
Note
You can configure multiple fallback flows, but only one fallback flow can apply to an AxoRouter (so the Router Selector of the fallback flows can’t overlap).
Select the Destination where you want to send your data. If you don’t have any destination configured, you can select + Add in the destination section to create a new destination now. For details on the different destinations, see Destinations.
If you don’t have any destination configured, see Destinations.
If you’ve already created a store, it automatically available as a destination. Note that the Router Selector of the flow must match only AxoRouters that have the selected store available, otherwise you’ll get an error message.
If you want to send data to another AxoRouter, enable the Show all destinations option, and select the connector of the AxoRouter where you want to send the data.
(Optional) To process the data transferred in the flow, select Add New Processing Step. For details, see Processing steps. For example:
Add a Classify, a Parse, and a Reduce step, in that order, to automatically remove redundant and empty fields from your data.
To select which messages are processed by the flow, add a Select Messages step, and enter a filter into the AQL Expression field. For example, to select only the messages received from Fortinet FortiGate firewalls, use the meta.vendor = fortinet AND meta.product = fortigate query.
For example, you can add your custom labels using a Set Fields processing step to meta.destination.google_secops.labels:
Note that sending custom labels to SecOps can have significant performance impact. Make sure to increase the number of workers (More options > Number of Workers), ideally to have at least one worker for each custom label.
11.10 - Grafana
11.10.1 - Grafana Loki
Grafana Loki:
Scalable log aggregation system optimized for storing and querying logs by labels using Grafana.
If you’d like to send data from AxoRouter to this destination, contact our support team for details.
11.11 - Microsoft
11.11.1 - Azure Monitor
Sending data to Azure Monitor is practically identical to using the Sentinel destination. Follow the procedure described in Microsoft Sentinel.
11.11.2 - Microsoft Sentinel
Microsoft Sentinel:
Cloud-native SIEM and SOAR platform for collecting, analyzing, and responding to security threats.
To add a Microsoft Sentinel or Azure Monitor destination to Axoflow, complete the following steps. AxoConsole can configure your AxoRouters to send data to the built-in CommonSecurityLog, SecurityEvents, Syslog, WindowsEvents tables of Azure Monitor. To send data to custom tables, contact our support team.
Prerequisites
The following list is a quick overview of the things you need to configure in Sentinel. For detailed instructions, see Configure Sentinel.
Configure the credentials needed for authentication.
Tenant ID: Directory (tenant) ID of the environment where you’re sending the data. (Practically everything belongs to the tenant ID: the Entra ID application, the Log analytics workspace, Sentinel, the DCE and the DCR, and so on.)
Application ID: Application (client) ID of the Microsoft Entra ID application.
Application secret: The Client secret of the Microsoft Entra ID application.
Scope: The scope for the authentication token. Usually you can leave empty to use the default value (https://monitor.azure.com//.default).
Specify the details of the table to send the data to.
DCR Immutable ID: The immutable ID property of the Azure Monitor Data Collection Rule (DCR) where AxoRouter sends the data.
Stream name: The name of the stream where AxoRouter sends the data. Use Custom-Syslog-Stream if you are in doubt. It is available in the provided templates and used as the default normalization scheme.
Select More options, and set the batch size for sending data to Sentinel. Recommended batch configuration:
Batch bytes: By default, this is set to 960000 (960kB). Don’t increase it over 1000000 to make sure the request body is smaller than the 1MB limit in Sentinel.
Batch timeout: Set 10000 (10s) to control the delay of log ingestion.
(Optional) Set other options as needed for your environments.
Timeout: The number of seconds to wait for a log-forwarding request to complete, and attempt to reconnect the server if exceeded. If the timeout is exceeded, AxoRouter attempts to reconnect the destination. The default (0) is unlimited. For more details, see the AxoSyslog documentation.
Disk Buffer: Explicitly enable or disable disk buffer on AxoRouter. Default value: Enabled.
AxoRouter can store messages on the local disk if the destination or the network connection to the destination becomes unavailable. AxoRouter automatically sends the stored messages (in the order they were received) to the destination when the connection is reestablished. Note that the disk buffer is separate from AxoStore.
Disk buffer capacity (bytes per worker): Size of the disk buffer files in bytes. This value applies for each worker. Default value is 100MiB (104857600 bytes), which is also the recommended minimum.
The disk required for using disk buffering is **Disk buffer capacity (bytes per worker)***Number of Workers for each destination of AxoRouter.
Batch Bytes: Sets the maximum size of payload in a batch. If the size of the messages reaches this value, AxoRouter sends the batch to the destination even if the number of messages is less than the value of the batch lines option.
CAUTION:
When setting Batch Bytes:
Note that the actual HTTP request will be about 4KB larger because of the request headers.
Check the configuration of your destination, as SaaS solutions and ingress controllers often limit the maximal size of HTTP requests. If the sum of Batch Bytes and the request headers exceeds this limit, the data will be rejected. (In case of NGINX, with a client intended to send too large body error message.)
Batch Lines: Number of lines sent to the destination in one batch. AxoRouter waits for this number of lines to accumulate and sends them off in a single batch. Increasing this number increases throughput as more messages are sent in a single batch, but also increases message latency.
Note that Initial window size * Maximum Connections must be greater or equal than Batch lines * Number of workers for all the sources that feeds a given destination. Otherwise, the destination worker might be unable to send data until Batch timeout expires, even if there’s data available.
Batch Timeout: Maximal time in milliseconds to wait for a batch to be filled before sending it. The default value (-1) means that the batch should be full before sending, which may result in a long wait if the incoming traffic is low. For more details, see the AxoSyslog documentation.
Content compression: Specifies the compression to use when sending data to the destination. No compression explicitly disables compression. Other possible values: Gzip, Deflate. Select only compression that your destination supports and has enabled. Default value: No compression
Number of Workers: Used for scaling the destination in case of high message load. Specifies the number of worker threads AxoRouter uses for sending messages to the destination. The default is 1. If high message throughput is not a concern, leave it on 1. For maximum performance, increase it up to the number of CPU cores available on AxoRouter. For more details, see the AxoSyslog documentation.
Response actions: Specifies what AxoRouter does with the log message, based on the response code received from the destination.
If the status code begins with 2 (for example, 200), AxoRouter assumes the message was successfully sent.
If you’ve configured a custom action in AxoConsole for the status code, AxoRouter performs the specified action.
To create a fallback flow, select Add Flow > Fallback flow.
Enter a name for the flow, for example, my-test-flow.
In the Router Selector field, enter an expression that matches the router(s) you want to apply the flow. To select a specific router, use a name selector, for example, name = my-axorouter-hostname.
You can use any labels and metadata of the AxoRouter hosts in the Router selectors, for example, the hostname of the AxoRouter, or any custom labels.
If you leave the Router Selector field empty, the selector will match every AxoRouter instance.
To select only a specific AxoRouter instance, set the name field to the name of the instance as selector. For example, name = my-axorouter.
If you set multiple fields in the selector, the selector will match only AxoRouter instances that match all elements of the selector. (There in an AND relationship between the fields.)
Note
You can configure multiple fallback flows, but only one fallback flow can apply to an AxoRouter (so the Router Selector of the fallback flows can’t overlap).
Select the Destination where you want to send your data. If you don’t have any destination configured, you can select + Add in the destination section to create a new destination now. For details on the different destinations, see Destinations.
If you don’t have any destination configured, see Destinations.
If you’ve already created a store, it automatically available as a destination. Note that the Router Selector of the flow must match only AxoRouters that have the selected store available, otherwise you’ll get an error message.
If you want to send data to another AxoRouter, enable the Show all destinations option, and select the connector of the AxoRouter where you want to send the data.
(Optional) To process the data transferred in the flow, select Add New Processing Step. For details, see Processing steps. For example:
Add a Classify, a Parse, and a Reduce step, in that order, to automatically remove redundant and empty fields from your data.
To select which messages are processed by the flow, add a Select Messages step, and enter a filter into the AQL Expression field. For example, to select only the messages received from Fortinet FortiGate firewalls, use the meta.vendor = fortinet AND meta.product = fortigate query.
To send data from AxoRouter to Microsoft Sentinel, you have to configure a number of things in Sentinel before configuring a destination in AxoConsole. Complete the following steps.
Create an Azure App
Create an Azure (Microsoft Entra) application and credentials for it.
Navigate to App registrations on the Azure Portal.
Click New registration and register an application (for example AxoflowIngestion).
Save the Application (Client) ID and the Directory (Tenant) ID (you’ll need these later to configure Axoflow).
Go to Certificates & secrets > Client secrets > + New client secret.
Add a description and expiration, click Add, and record the secret value (OAuth secret). You’ll need this later to configure Axoflow.
NOTE: Set a reminder to renew the secret and update your Axoflow configuration before it expires, otherwise your AxoRouters won’t be able to send data to Sentinel, possibly causing data loss.
Enable Microsoft Sentinel on a Log Analytics Workspace
In the Azure Portal search for Microsoft Sentinel.
Select an existing workspace or create a new one (choose Resource Group and Region).
Once added, select the workspace and open Tables.
You should see the CommonSecurityLog, SecurityEvents, Syslog, WindowsEvents built-in tables. Sometimes the Syslog table appears only when it has data.
From the workspace Overview, open JSON View and record the Workspace Resource ID (needed in templates).
Search for Deploy a custom template in Azure services.
Choose Build your own template in the editor.
Download the Axoflow DCE template, and upload or paste it into the template editor. Click Save.
Set the parameters of the DCE. Make sure Region matches your Sentinel workspace.
After creation, open it and copy its endpoint URL (that’s logsIngestion.endpoint in the JSON view) and its Resource ID (id). You’ll need the endpoint later to configure Axoflow, and the resource ID to configure the data collection rule.
To configure Axoflow, you’ll need the username, password, the name of your organization, and the name of the OpenObserve stream where you want to send your data.
Steps
Create a new destination.
Open the AxoConsole.
Select Destinations > + Add Destination.
Configure the destination.
Select OpenObserve.
Select which type of configuration you want to use:
Simple: Send all data into a single stream of an organization.
Dynamic: Send data to an organization and stream based on the content or metadata of the incoming messages (or to the default stream of the default organization).
Advanced: Allows you to specify a custom URL endpoint.
Enter a name for the destination.
Configure the endpoint of the destination.
Advanced: Enter your OpenObserve URL into the URL field, for example, https://example.com/api/my-org/my-stream/_json
Simple and Dynamic:
Select the HTTPS or HTTP protocol to use to access your destination.
Simple: Enter name of the Organization and the Stream where you want to send the data. All data will be sent into this stream.
Dynamic: Enter the expression that specifies the default Default Organization and teh Default Stream. The data will be sent into this stream if no other organization and stream is set during the processing of the message (for example, by the processing steps of the Flow).
Enter the username and password for the account you want to use.
(Optional)
By default, Axoflow rejects connections to the destination server if the certificate of the server is invalid (for example, it’s expired, signed by an unknown CA, or its CN and the name of the server is mismatched: the Common Name or the subject_alt_name parameter of the peer’s certificate must contain the hostname or the IP address (as resolved from AxoRouter) of the peer).
Warning
When validating a certificate, the entire certificate chain must be valid, including the CA certificate. If any certificate of the chain is invalid, Axoflow will reject the connection.
If you want to accept invalid certificates (or no certificate) from the destination servers, disable the Verify server certificate option.
(Optional) Set other options as needed for your environments.
Timeout: The number of seconds to wait for a log-forwarding request to complete, and attempt to reconnect the server if exceeded. If the timeout is exceeded, AxoRouter attempts to reconnect the destination. The default (0) is unlimited. For more details, see the AxoSyslog documentation.
Disk Buffer: Explicitly enable or disable disk buffer on AxoRouter. Default value: Enabled.
AxoRouter can store messages on the local disk if the destination or the network connection to the destination becomes unavailable. AxoRouter automatically sends the stored messages (in the order they were received) to the destination when the connection is reestablished. Note that the disk buffer is separate from AxoStore.
Disk buffer capacity (bytes per worker): Size of the disk buffer files in bytes. This value applies for each worker. Default value is 100MiB (104857600 bytes), which is also the recommended minimum.
The disk required for using disk buffering is **Disk buffer capacity (bytes per worker)***Number of Workers for each destination of AxoRouter.
Batch Bytes: Sets the maximum size of payload in a batch. If the size of the messages reaches this value, AxoRouter sends the batch to the destination even if the number of messages is less than the value of the batch lines option.
CAUTION:
When setting Batch Bytes:
Note that the actual HTTP request will be about 4KB larger because of the request headers.
Check the configuration of your destination, as SaaS solutions and ingress controllers often limit the maximal size of HTTP requests. If the sum of Batch Bytes and the request headers exceeds this limit, the data will be rejected. (In case of NGINX, with a client intended to send too large body error message.)
Batch Lines: Number of lines sent to the destination in one batch. AxoRouter waits for this number of lines to accumulate and sends them off in a single batch. Increasing this number increases throughput as more messages are sent in a single batch, but also increases message latency.
Note that Initial window size * Maximum Connections must be greater or equal than Batch lines * Number of workers for all the sources that feeds a given destination. Otherwise, the destination worker might be unable to send data until Batch timeout expires, even if there’s data available.
Batch Timeout: Maximal time in milliseconds to wait for a batch to be filled before sending it. The default value (-1) means that the batch should be full before sending, which may result in a long wait if the incoming traffic is low. For more details, see the AxoSyslog documentation.
Content compression: Specifies the compression to use when sending data to the destination. No compression explicitly disables compression. Other possible values: Gzip, Deflate. Select only compression that your destination supports and has enabled. Default value: No compression
Number of Workers: Used for scaling the destination in case of high message load. Specifies the number of worker threads AxoRouter uses for sending messages to the destination. The default is 1. If high message throughput is not a concern, leave it on 1. For maximum performance, increase it up to the number of CPU cores available on AxoRouter. For more details, see the AxoSyslog documentation.
Response actions: Specifies what AxoRouter does with the log message, based on the response code received from the destination.
If the status code begins with 2 (for example, 200), AxoRouter assumes the message was successfully sent.
If you’ve configured a custom action in AxoConsole for the status code, AxoRouter performs the specified action.
To create a fallback flow, select Add Flow > Fallback flow.
Enter a name for the flow, for example, my-test-flow.
In the Router Selector field, enter an expression that matches the router(s) you want to apply the flow. To select a specific router, use a name selector, for example, name = my-axorouter-hostname.
You can use any labels and metadata of the AxoRouter hosts in the Router selectors, for example, the hostname of the AxoRouter, or any custom labels.
If you leave the Router Selector field empty, the selector will match every AxoRouter instance.
To select only a specific AxoRouter instance, set the name field to the name of the instance as selector. For example, name = my-axorouter.
If you set multiple fields in the selector, the selector will match only AxoRouter instances that match all elements of the selector. (There in an AND relationship between the fields.)
Note
You can configure multiple fallback flows, but only one fallback flow can apply to an AxoRouter (so the Router Selector of the fallback flows can’t overlap).
Select the Destination where you want to send your data. If you don’t have any destination configured, you can select + Add in the destination section to create a new destination now. For details on the different destinations, see Destinations.
If you don’t have any destination configured, see Destinations.
If you’ve already created a store, it automatically available as a destination. Note that the Router Selector of the flow must match only AxoRouters that have the selected store available, otherwise you’ll get an error message.
If you want to send data to another AxoRouter, enable the Show all destinations option, and select the connector of the AxoRouter where you want to send the data.
(Optional) To process the data transferred in the flow, select Add New Processing Step. For details, see Processing steps. For example:
Add a Classify, a Parse, and a Reduce step, in that order, to automatically remove redundant and empty fields from your data.
To select which messages are processed by the flow, add a Select Messages step, and enter a filter into the AQL Expression field. For example, to select only the messages received from Fortinet FortiGate firewalls, use the meta.vendor = fortinet AND meta.product = fortigate query.
Record its access token. Note that XSIAM displays the token only once, if you don’t save the token you’ll have to create an new log collector.
Leave Compression on uncompressed. Compression will be supported in the next Axoflow release.
To configure Axoflow, you’ll need the URL of the Cortex XSIAM HTTP Log Collector and its access token.
Steps
Create a new destination.
Open the AxoConsole.
Select Destinations > + Add Destination.
Configure the destination.
Select Cortex XSIAM.
Enter a name for the destination.
Enter the URL of the XSIAM HTTP log collector into the Endpoint URL field, for example: https://api-{your-xsiam-tenant-URL}/logs/v1/event.
Enter the authentication token (api_key) you got when you created the Cortex XSIAM HTTP log collector into the Token field.
(Optional) Set other options as needed for your environments.
Timeout: The number of seconds to wait for a log-forwarding request to complete, and attempt to reconnect the server if exceeded. If the timeout is exceeded, AxoRouter attempts to reconnect the destination. The default (0) is unlimited. For more details, see the AxoSyslog documentation.
Disk Buffer: Explicitly enable or disable disk buffer on AxoRouter. Default value: Enabled.
AxoRouter can store messages on the local disk if the destination or the network connection to the destination becomes unavailable. AxoRouter automatically sends the stored messages (in the order they were received) to the destination when the connection is reestablished. Note that the disk buffer is separate from AxoStore.
Disk buffer capacity (bytes per worker): Size of the disk buffer files in bytes. This value applies for each worker. Default value is 100MiB (104857600 bytes), which is also the recommended minimum.
The disk required for using disk buffering is **Disk buffer capacity (bytes per worker)***Number of Workers for each destination of AxoRouter.
Batch Bytes: Sets the maximum size of payload in a batch. If the size of the messages reaches this value, AxoRouter sends the batch to the destination even if the number of messages is less than the value of the batch lines option.
CAUTION:
When setting Batch Bytes:
Note that the actual HTTP request will be about 4KB larger because of the request headers.
Check the configuration of your destination, as SaaS solutions and ingress controllers often limit the maximal size of HTTP requests. If the sum of Batch Bytes and the request headers exceeds this limit, the data will be rejected. (In case of NGINX, with a client intended to send too large body error message.)
Batch Lines: Number of lines sent to the destination in one batch. AxoRouter waits for this number of lines to accumulate and sends them off in a single batch. Increasing this number increases throughput as more messages are sent in a single batch, but also increases message latency.
Note that Initial window size * Maximum Connections must be greater or equal than Batch lines * Number of workers for all the sources that feeds a given destination. Otherwise, the destination worker might be unable to send data until Batch timeout expires, even if there’s data available.
Batch Timeout: Maximal time in milliseconds to wait for a batch to be filled before sending it. The default value (-1) means that the batch should be full before sending, which may result in a long wait if the incoming traffic is low. For more details, see the AxoSyslog documentation.
Number of Workers: Used for scaling the destination in case of high message load. Specifies the number of worker threads AxoRouter uses for sending messages to the destination. The default is 1. If high message throughput is not a concern, leave it on 1. For maximum performance, increase it up to the number of CPU cores available on AxoRouter. For more details, see the AxoSyslog documentation.
Message Format: Specifies the message format and normalization. Possible values:
Cortex Data Model (XDM): Send the normalized data to XSIAM. The Axoflow integration in XSIAM puts the data to its proper place, without having to use XSIAM parsers. Contact our support team for details.
Dataset: Send the processed data in a format that XSIAM parsers can process.
Text: Send the raw data in LEEF format.
Elastic Common Schema (ECS): Normalize the data using the ECS schema.
Open Cybersecurity Schema Framework (OCSF): Normalize the data using the OCSF schema.
Parsed: Send the parsed data without further normalization.
To create a fallback flow, select Add Flow > Fallback flow.
Enter a name for the flow, for example, my-test-flow.
In the Router Selector field, enter an expression that matches the router(s) you want to apply the flow. To select a specific router, use a name selector, for example, name = my-axorouter-hostname.
You can use any labels and metadata of the AxoRouter hosts in the Router selectors, for example, the hostname of the AxoRouter, or any custom labels.
If you leave the Router Selector field empty, the selector will match every AxoRouter instance.
To select only a specific AxoRouter instance, set the name field to the name of the instance as selector. For example, name = my-axorouter.
If you set multiple fields in the selector, the selector will match only AxoRouter instances that match all elements of the selector. (There in an AND relationship between the fields.)
Note
You can configure multiple fallback flows, but only one fallback flow can apply to an AxoRouter (so the Router Selector of the fallback flows can’t overlap).
Select the Destination where you want to send your data. If you don’t have any destination configured, you can select + Add in the destination section to create a new destination now. For details on the different destinations, see Destinations.
If you don’t have any destination configured, see Destinations.
If you’ve already created a store, it automatically available as a destination. Note that the Router Selector of the flow must match only AxoRouters that have the selected store available, otherwise you’ll get an error message.
If you want to send data to another AxoRouter, enable the Show all destinations option, and select the connector of the AxoRouter where you want to send the data.
(Optional) To process the data transferred in the flow, select Add New Processing Step. For details, see Processing steps. For example:
Add a Classify, a Parse, and a Reduce step, in that order, to automatically remove redundant and empty fields from your data.
To select which messages are processed by the flow, add a Select Messages step, and enter a filter into the AQL Expression field. For example, to select only the messages received from Fortinet FortiGate firewalls, use the meta.vendor = fortinet AND meta.product = fortigate query.
If you’re using AxoRouter, create the indexes where Axoflow sends the log data. Which index is needed depends on the sources you have, but create at least the following event indices: axoflow, infraops, netops, netfw, osnix (for unclassified messages). Check your sources in the Sources section for a detailed lists on which indices their data is sent.
If you’ve created any new indexes, make sure to add those indexes to the token’s Allowed Indexes.
Steps
Create a new destination.
Open the AxoConsole.
Select Destinations > + Add Destination.
Configure the destination.
Select Splunk.
Enter a name for the destination.
Select which type of configuration you want to use:
Simple: Send all data into a single index, with fixed source and source type settings.
Dynamic: Set index, source, and source type based on the content or metadata of the incoming messages.
Advanced: Allows you to specify a custom URL endpoint.
Configure the endpoint of the destination.
Advanced: Enter your Splunk URL into the URL field, for example, https://<your-splunk-tenant-id>.splunkcloud.com:8088 for Splunk Cloud Platform free trials, or https://<your-splunk-tenant-id>.splunkcloud.com for Splunk Cloud Platform instances.
Simple and Dynamic:
Select the HTTPS or HTTP protocol to use to access your destination.
Enter the Hostname and Port of the destination.
Specify the Splunk index to send the data to.
Simple: Enter the expression that specifies the Splunk index to use into the Index field, for example: netops. All data will be sent into this index.
Dynamic and Advanced:
Enter the name of the Default Index. The data will be sent into this index if no other index is set during the processing of the message (based on automatic classification, or by the processing steps of the Flow). Make sure that the index exists in Splunk.
Enter the Default Source Type. This will be assigned to the messages that have no sourcetype set during the processing of the message (based on automatic classification, or by the processing steps of the Flow).
Enter the token you’ve created into the Token field.
Disable the Verify server certificate option unless your deployment has a valid, non-self-signed certificate. Free Splunk Cloud accounts have self-signed certificates.
(Optional) Set other options as needed for your environments.
Timeout: The number of seconds to wait for a log-forwarding request to complete, and attempt to reconnect the server if exceeded. If the timeout is exceeded, AxoRouter attempts to reconnect the destination. The default (0) is unlimited. For more details, see the AxoSyslog documentation.
Disk Buffer: Explicitly enable or disable disk buffer on AxoRouter. Default value: Enabled.
AxoRouter can store messages on the local disk if the destination or the network connection to the destination becomes unavailable. AxoRouter automatically sends the stored messages (in the order they were received) to the destination when the connection is reestablished. Note that the disk buffer is separate from AxoStore.
Disk buffer capacity (bytes per worker): Size of the disk buffer files in bytes. This value applies for each worker. Default value is 100MiB (104857600 bytes), which is also the recommended minimum.
The disk required for using disk buffering is **Disk buffer capacity (bytes per worker)***Number of Workers for each destination of AxoRouter.
Batch Bytes: Sets the maximum size of payload in a batch. If the size of the messages reaches this value, AxoRouter sends the batch to the destination even if the number of messages is less than the value of the batch lines option.
CAUTION:
When setting Batch Bytes:
Note that the actual HTTP request will be about 4KB larger because of the request headers.
Check the configuration of your destination, as SaaS solutions and ingress controllers often limit the maximal size of HTTP requests. If the sum of Batch Bytes and the request headers exceeds this limit, the data will be rejected. (In case of NGINX, with a client intended to send too large body error message.)
Batch Lines: Number of lines sent to the destination in one batch. AxoRouter waits for this number of lines to accumulate and sends them off in a single batch. Increasing this number increases throughput as more messages are sent in a single batch, but also increases message latency.
Note that Initial window size * Maximum Connections must be greater or equal than Batch lines * Number of workers for all the sources that feeds a given destination. Otherwise, the destination worker might be unable to send data until Batch timeout expires, even if there’s data available.
Batch Timeout: Maximal time in milliseconds to wait for a batch to be filled before sending it. The default value (-1) means that the batch should be full before sending, which may result in a long wait if the incoming traffic is low. For more details, see the AxoSyslog documentation.
Content compression: Specifies the compression to use when sending data to the destination. No compression explicitly disables compression. Other possible values: Gzip, Deflate. Select only compression that your destination supports and has enabled. Default value: No compression
Number of Workers: Used for scaling the destination in case of high message load. Specifies the number of worker threads AxoRouter uses for sending messages to the destination. The default is 1. If high message throughput is not a concern, leave it on 1. For maximum performance, increase it up to the number of CPU cores available on AxoRouter. For more details, see the AxoSyslog documentation.
Response actions: Specifies what AxoRouter does with the log message, based on the response code received from the destination.
If the status code begins with 2 (for example, 200), AxoRouter assumes the message was successfully sent.
If you’ve configured a custom action in AxoConsole for the status code, AxoRouter performs the specified action.
To create a fallback flow, select Add Flow > Fallback flow.
Enter a name for the flow, for example, my-test-flow.
In the Router Selector field, enter an expression that matches the router(s) you want to apply the flow. To select a specific router, use a name selector, for example, name = my-axorouter-hostname.
You can use any labels and metadata of the AxoRouter hosts in the Router selectors, for example, the hostname of the AxoRouter, or any custom labels.
If you leave the Router Selector field empty, the selector will match every AxoRouter instance.
To select only a specific AxoRouter instance, set the name field to the name of the instance as selector. For example, name = my-axorouter.
If you set multiple fields in the selector, the selector will match only AxoRouter instances that match all elements of the selector. (There in an AND relationship between the fields.)
Note
You can configure multiple fallback flows, but only one fallback flow can apply to an AxoRouter (so the Router Selector of the fallback flows can’t overlap).
Select the Destination where you want to send your data. If you don’t have any destination configured, you can select + Add in the destination section to create a new destination now. For details on the different destinations, see Destinations.
If you don’t have any destination configured, see Destinations.
If you’ve already created a store, it automatically available as a destination. Note that the Router Selector of the flow must match only AxoRouters that have the selected store available, otherwise you’ll get an error message.
If you want to send data to another AxoRouter, enable the Show all destinations option, and select the connector of the AxoRouter where you want to send the data.
(Optional) To process the data transferred in the flow, select Add New Processing Step. For details, see Processing steps. For example:
Add a Classify, a Parse, and a Reduce step, in that order, to automatically remove redundant and empty fields from your data.
To select which messages are processed by the flow, add a Select Messages step, and enter a filter into the AQL Expression field. For example, to select only the messages received from Fortinet FortiGate firewalls, use the meta.vendor = fortinet AND meta.product = fortigate query.
Select which type of configuration you want to use:
Simple: Send all data using a single source host and source category.
Dynamic: Set source host, name, and category based on the content or metadata of the incoming messages.
Configure the endpoint of the destination.
Simple:
Enter the URL of the HTTPS endpoint of your Sumo Logic HTTP Source where data is sent. (AxoConsole UI doesn’t show the URL by default because it contains an access token.)
Enter the name of the Source Name. All data will be associated as coming from this source.
Enter the host identifier (for example, server or container name) that sent the data into the Source Host field. All data will be associated as coming from this source.
Enter the name of the Source Category. The data will be added to this category in Sumo Logic.
Enter the metadata tags that to be assigned to your data by default into the Fields field. Use key-value pairs. Other metadata can be added during the processing of the message (based on automatic classification, or by the processing steps of the Flow). Note the following limits of Sumo Logic fields:
An HTTP request is limited to 30 fields.
A field name (key) cannot be longer than 255 characters.
Enter the URL of the HTTPS endpoint of your Sumo Logic HTTP Source where data is sent. (AxoConsole UI doesn’t show the URL by default because it contains an access token.)
Enter the Default Source Name. The name of the data source. The data will be associated as coming from this source, unless a different one is set during the processing of the message (based on automatic classification, or by the processing steps of the Flow).
Enter the Default Source Host. The host identifier (for example, server or container name) that sent the data. All data will be associated as coming from this source, unless a different one is set during the processing of the message (based on automatic classification, or by the processing steps of the Flow).
Enter the name of the Default Source Category. This is a user-defined tag to logically group or filter data in Sumo Logic. The data will added to this category, unless a different one is set during the processing of the message (based on automatic classification, or by the processing steps of the Flow).
Enter the metadata tags that to be assigned to your data by default into the Fields field. Use key-value pairs. Other metadata can be added during the processing of the message (based on automatic classification, or by the processing steps of the Flow). Note the following limits of Sumo Logic fields:
An HTTP request is limited to 30 fields.
A field name (key) cannot be longer than 255 characters.
(Optional) Set other options as needed for your environments.
Timeout: The number of seconds to wait for a log-forwarding request to complete, and attempt to reconnect the server if exceeded. If the timeout is exceeded, AxoRouter attempts to reconnect the destination. The default (0) is unlimited. For more details, see the AxoSyslog documentation.
Disk Buffer: Explicitly enable or disable disk buffer on AxoRouter. Default value: Enabled.
AxoRouter can store messages on the local disk if the destination or the network connection to the destination becomes unavailable. AxoRouter automatically sends the stored messages (in the order they were received) to the destination when the connection is reestablished. Note that the disk buffer is separate from AxoStore.
Disk buffer capacity (bytes per worker): Size of the disk buffer files in bytes. This value applies for each worker. Default value is 100MiB (104857600 bytes), which is also the recommended minimum.
The disk required for using disk buffering is **Disk buffer capacity (bytes per worker)***Number of Workers for each destination of AxoRouter.
Batch Bytes: Sets the maximum size of payload in a batch. If the size of the messages reaches this value, AxoRouter sends the batch to the destination even if the number of messages is less than the value of the batch lines option.
CAUTION:
When setting Batch Bytes:
Note that the actual HTTP request will be about 4KB larger because of the request headers.
Check the configuration of your destination, as SaaS solutions and ingress controllers often limit the maximal size of HTTP requests. If the sum of Batch Bytes and the request headers exceeds this limit, the data will be rejected. (In case of NGINX, with a client intended to send too large body error message.)
Batch Lines: Number of lines sent to the destination in one batch. AxoRouter waits for this number of lines to accumulate and sends them off in a single batch. Increasing this number increases throughput as more messages are sent in a single batch, but also increases message latency.
Note that Initial window size * Maximum Connections must be greater or equal than Batch lines * Number of workers for all the sources that feeds a given destination. Otherwise, the destination worker might be unable to send data until Batch timeout expires, even if there’s data available.
Batch Timeout: Maximal time in milliseconds to wait for a batch to be filled before sending it. The default value (-1) means that the batch should be full before sending, which may result in a long wait if the incoming traffic is low. For more details, see the AxoSyslog documentation.
Content compression: Specifies the compression to use when sending data to the destination. No compression explicitly disables compression. Other possible values: Gzip, Deflate. Select only compression that your destination supports and has enabled. Default value: No compression
Number of Workers: Used for scaling the destination in case of high message load. Specifies the number of worker threads AxoRouter uses for sending messages to the destination. The default is 1. If high message throughput is not a concern, leave it on 1. For maximum performance, increase it up to the number of CPU cores available on AxoRouter. For more details, see the AxoSyslog documentation.
Response actions: Specifies what AxoRouter does with the log message, based on the response code received from the destination.
If the status code begins with 2 (for example, 200), AxoRouter assumes the message was successfully sent.
If you’ve configured a custom action in AxoConsole for the status code, AxoRouter performs the specified action.
To create a fallback flow, select Add Flow > Fallback flow.
Enter a name for the flow, for example, my-test-flow.
In the Router Selector field, enter an expression that matches the router(s) you want to apply the flow. To select a specific router, use a name selector, for example, name = my-axorouter-hostname.
You can use any labels and metadata of the AxoRouter hosts in the Router selectors, for example, the hostname of the AxoRouter, or any custom labels.
If you leave the Router Selector field empty, the selector will match every AxoRouter instance.
To select only a specific AxoRouter instance, set the name field to the name of the instance as selector. For example, name = my-axorouter.
If you set multiple fields in the selector, the selector will match only AxoRouter instances that match all elements of the selector. (There in an AND relationship between the fields.)
Note
You can configure multiple fallback flows, but only one fallback flow can apply to an AxoRouter (so the Router Selector of the fallback flows can’t overlap).
Select the Destination where you want to send your data. If you don’t have any destination configured, you can select + Add in the destination section to create a new destination now. For details on the different destinations, see Destinations.
If you don’t have any destination configured, see Destinations.
If you’ve already created a store, it automatically available as a destination. Note that the Router Selector of the flow must match only AxoRouters that have the selected store available, otherwise you’ll get an error message.
If you want to send data to another AxoRouter, enable the Show all destinations option, and select the connector of the AxoRouter where you want to send the data.
(Optional) To process the data transferred in the flow, select Add New Processing Step. For details, see Processing steps. For example:
Add a Classify, a Parse, and a Reduce step, in that order, to automatically remove redundant and empty fields from your data.
To select which messages are processed by the flow, add a Select Messages step, and enter a filter into the AQL Expression field. For example, to select only the messages received from Fortinet FortiGate firewalls, use the meta.vendor = fortinet AND meta.product = fortigate query.
This chapter shows how to access the different metrics and analytics that Axoflow collects about your security data pipeline.
12.1 - Analytics
Axoflow allows you to analyze your data at various points in your pipeline using Sankey, Sunburst, and Histogram diagrams.
The Analytics page of allows you to analyze the data throughput of your pipeline.
You can analyze the throughput of a flow on the Flows > <flow-to-analyze> > Analytics page.
You can analyze the throughput of a specific source on the Sources > <source-to-analyze> > Analytics page.
You can analyze the throughput of a specific AxoRouter on the Routers > <router-to-analyze> > Analytics page.
The analytics charts
You can select what’s displayed and how using the top bar and the Filter labels bar. Use the top bar to select the dataset you want to work with, and the Filter labels bar to select the labels to visualize for the selected dataset.
Time period: Select the calendar_month
icon to change the time period that’s displayed on the charts. You can use absolute (calendar) time, or relative time (for example, the last 2 days).
Axoflow stores all dates in Coordinated Universal Time (UTC), and automatically converts it to the timezone of set in your browser/operating system.
For Sankey and Sunburst diagrams, you can also change the Bucketing of the data, from Alphabetic (alphabetic ordering) to display the Most frequent (top talkers) and Least frequent (least significant contributors) first.
The settings of the filter bar change the URL parameters of the page, so you can bookmark it, or share a specific view by sharing the URL.
Click a segment of the diagram to drill-down into the data. That’s equivalent with selecting filter_alt
and adding the label to the Analytics filters. To clear the filters, select filter_alt_off
.
Hover over a segment displays more details about it.
You can also:
Export the data as CSV: Select download
to download the currently visible dataset as a CSV file to process it in an external tool.
Add and clear filters (filter_alt
/ filter_alt_off
).
Search the data
Free-text mode searches in the values of the labels that are selected for display in the Filter labels bar, and filters the dataset to the matching data. For example, if the Host and App labels are displayed, and you enter a search keyword in Free-text mode, only those data will be visualized where the search keyword appears in its hostname or the app name.
Basic Search is case insensitive. Adding multiple keywords searches for matches in any of the previous fields. This is equivalent to the @ANY =* keyword1 AND @ANY =* keyword2 AQL query.
AQL Expression mode allows you to filter data by any available labels.
It also makes more complex filtering possible, using the Equals, Contains (partial match), and Match (regular expression match) operators. Note that:
To execute the search, click Search, or hit ESC then ENTER.
AxoConsole autocompletes the built-in and custom labels and field names, as well as their most frequent values, but doesn’t autocomplete labels and variables created by data parsing and processing steps.
You can use the AND and OR operators to combine expressions, and also parenthesis if needed. For details on AQL, see AQL operator reference.
The precedence of the operators is the following: parentheses, AND, OR, comparison operators.
Use the usual keyboard shortcuts to undo (⌘/Ctrl + Z) or redo (⌘/Ctrl + Shift + Z) your edits.
Display labels
The Filter labels bar determines which labels are displayed. You can:
Reorder the labels to adjust the diagram. On Sunburst diagrams, the left-most label is on the inside of the diagram.
Add new labels to get more details about the data flow.
Note that some labels (like flow or destination_name) are available only when displaying metrics based on Output bytes or Output events.
Labels added to AxoRouter hosts get the axo_host_ prefix.
Labels added to data sources get the host_ prefix. For example, if you add a rack label to an edge host, it’ll be added to the data received from the host as host_rack.
Labels added on edge hosts get the edge_connector_label_ prefix.
On other pages, like the Host Overview page, the labels are displayed without the prefixes.
Remove unneeded labels from the diagram.
Sunburst diagrams
Sunburst diagrams (also known as ring charts or radial treemaps) visualize your data pipeline as a hierarchical dataset. It organizes the data according to the labels displayed in the Filter labels field into concentric rings, where each ring corresponds to a level in the hierarchy. The left-most label is on the inside of the diagram.
For example, sunburst diagrams are great for visualizing:
top talkers (the data sources that are sending the most data), or
if you’ve added custom labels that show the owner to your data sources, you can see which team is sending the most data to the destination.
The following example groups the data sources that send data into a Splunk destination based on their custom host_label_team labels.
Sankey diagrams
The Sankey diagram of your data pipeline shows the flow of data between the elements of the pipeline, for example, from the source (host) to the destination. Sankey diagrams are especially suited to visualize the flow of data, and show how that flow is subdivided at each stage. That way, they help highlight bottlenecks, and show where and how much data is flowing.
The diagram consists of nodes (also called segments) that represent the different attributes or labels of the data flowing through the host. Nodes are shown as labeled columns, for example, the sender application (app), or a host. The thickness of the links between the nodes of the diagram shows the amount of data.
Hover over a link to show the data throughput of this link between the edges of the diagram.
Click on a link to:
Show the details of the link: the labels that the link connects, and their data throughput.
Click on a node to drill-down into the diagram. (To undo, use the Back button of your browser, or the clear filters icon filter_alt_off
.)
The following example shows a custom label that shows the owner of the source host, thereby visualizing which team is sending the most data to the destination.
This example shows the issue label that marks messages that were invalid or malformed for some reason (for example, the header of a syslog message was missing).
Visualize flows: add the flow label to the Filter labels field.
Find unclassified messages that weren’t recognized by the Axoflow database: add the app label to the Filter labels field, and look for the axo_fallback link. You can tap into the log flow to check these messages. Feel free to send us sample so we can add them to the classification database.
Visualize custom labels and their relation to data flows.
Histogram
The Histogram chart shows time-series data about the metrics for the selected labels.
Note that:
Hovering over a part of the chart shows you the actual metrics for that time.
Exporting as CSV (download
) download the currently visible dataset as time-series data.
Adding too many labels to the Filter labels field can make the chart difficult to interpret.
You can also access histogram charts from the tapping dialog of the Sankey diagrams when you click on a link in the diagram: Histogram for full column will create a histogram for the entire Sankey column, while Histogram for this value will shot the histogram for the selected link.
Tapping into the log flow
On the Sankey diagram, click on a link to show the details of the link.
Tap into the data traffic:
Select Tap with this label to tap into the log flow at either end of the link.
Select Tap both to tap into the data flowing through the link.
Select the host where you want to tap into the logs.
Select Start.
When the logs you’re interested in show up, click Stop Log Tap, then click a log message to see its details.
If you don’t know what the message means, select AI Analytics to ask our AI to interpret it.
12.2 - Host metrics
The Metrics & health page of a source or an AxoRouter host shows the history of the various metrics Axoflow collects about the host.
Events of the hosts (for example, configuration reloads, or alerts affecting the host) are displayed over the metrics.
Interact with metrics
You can change which metrics are displayed and for which time period using the bar above the metrics.
Metrics categories: Temporarily hide/show the metrics of that category, for example, System. The category for each metric is displayed under the name of the chart. Note that this change is just temporary: if you want to change the layout of the metrics, use the settings
icon.
calendar_month
: Use the calendar icon to change the time period that’s displayed on the charts. You can use absolute (calendar) time, or relative time (for example, the last 2 days).
Axoflow stores all dates in Coordinated Universal Time (UTC), and automatically converts it to the timezone of set in your browser/operating system.
Note
By default, Axoflow stores metrics for 30 days, unless specified otherwise in your support contract. Contact us if you want to increase the data retention time.
To quickly zoom in on a period, click and drag to select the period to display on any of the charts. Every chart will be updated for the selected period. (To return to the previous state, click the Back button of your browser.)
/
: Hide/show the alerts and other events (like configuration reloads) of the host. These event are overlayed on the charts by default.
: Shows the number of active alerts on the host for that period.
The settings
allows you to change the order of the metrics, or to hide metrics. These changes are persistent and stored in your profile.
The settings of the filter bar change the URL parameters of the page, so you can bookmark it, or share a specific view by sharing the URL.
Interact with a chart
In addition to the possibilities of the top bar, you can interact with the charts the following way:
Hover on the info
icon on a colored metric card to display the definition, details, and statistics of the metric.
Click on a colored card to hide the related metric from the chart. For example, you can hide unneeded sources on the Log input charts.
Click on an event (for example, an alert or configuration reload) to show its details.
To quickly zoom in on a period, click and drag to select the period to display on any of the charts. Every chart will be updated for the selected period. (To return to the previous state, click the Back button of your browser.)
Metrics reference
For managed hosts, the following metrics are available:
Connections: Number of active connections and the maximum permitted number of connections for each connector.
CPU: Percentage of time a CPU core spent on average in a non-idle state within a window of 5 minutes.
Disk: Effective storage space used and available on each device (an overlap may exist between devices identified).
Dropped packets (total): This chart shows different metrics for packet loss:
Dropped UDP packets: Number of UDP packets dropped by the OS before processing per second averaged within a time window of 5 minutes.
Dropped log events: Number of events dropped from event queues within a time window of 5 minutes.
Log input (bytes): Incoming log messages processed by each connector, measured in bytes per second, averaged for a time window of 5 minutes.
Log input (events): Number of incoming log messages processed by each connector per second, averaged for a time window of 5 minutes.
Log output (bytes): Log messages sent to each log destination, measured in bytes per second, averaged for a time window of 5 minutes.
Log output (events): Number of log messages sent to each log destination per second, averaged for a time window of 5 minutes.
Log memory queue (bytes): Total bytes of data waiting in each memory queue.
Log memory queue (events): Number of messages waiting in each memory queue by destination.
Log disk queue (bytes): This chart shows the following metrics about disk queue usage:
Disk queue bytes: Total bytes of data waiting in each disk queue.
Disk queue memory cache bytes: Amount of memory used for caching disk-based queues.
Log disk queue (events): Number of messages waiting in each disk queue by destination.
Memory: Memory usage and capacity reported by the OS in bytes (including reclaimable caches and buffers).
Network input (bytes): Incoming network traffic in bytes/second reported by the OS for each network interface averaged within a time window of 5 minutes.
Network input (packets): Number of incoming network packets per second reported by the OS for each network interface averaged within a time window of 5 minutes.
Network output (bytes): Outgoing network traffic in bytes/second reported by the OS for each network interface averaged within a time window of 5 minutes.
Network output (packets): Number of outgoing network packets per second reported by the OS for each network interface averaged within a time window of 5 minutes.
Event delay (seconds): Latency of outgoing messages.
12.3 - Flow analytics
12.4 - Flow metrics
12.5 - Store metrics
13 - Activity log
Axoflow collects an activity log to help you track and audit the configuration changes and modifications done by your team. To access the activity log, open the Activity page from the main menu.
For each activity, the following information is shown:
Changer: The user who performed the change.
Operation: The type of the configuration change, one of: CREATE, UPDATE, or DELETE.
Kind: The type of the configuration object that was modified: Connector Rule, Destination, Flow, Host, Host Registration Request, Provisioning, Rehydration, Role, or Store.
Name: The name of the object that was modified.
Date: The date when the change occurred.
Axoflow stores all dates in Coordinated Universal Time (UTC), and automatically converts it to the timezone of set in your browser/operating system.
Open the details of the activity to see a diff of what was changed (sensitive data like tokens and passwords aren’t displayed).
Filter activities
You can use the Filter Bar to search and filter for specific events, and to filter the time range of the activities. You can also access the Activity page from the local ⋮ menus on the Sources, Routers, Destinations, Flows, Provisioning, and Routers > Stores pages. In these cases, the activities will be automatically filtered to show the specific object.
The settings of the filter bar change the URL parameters of the page, so you can bookmark it, or share a specific view by sharing the URL.
Free-text mode searches in the following fields of the activity logs: Changer, Operation, Kind, Name.
Basic Search is case insensitive. Adding multiple keywords searches for matches in any of the previous fields. This is equivalent to the @ANY =* keyword1 AND @ANY =* keyword2 AQL query.
AQL Expression mode allows you to search in specific fields of the activity logs.
It also makes more complex filtering possible, using the Equals, Contains (partial match), and Match (regular expression match) operators. Note that:
To execute the search, click Search, or hit ESC then ENTER.
AxoConsole autocompletes the built-in and custom labels and field names, as well as their most frequent values, but doesn’t autocomplete labels and variables created by data parsing and processing steps.
You can use the AND and OR operators to combine expressions, and also parenthesis if needed. For details on AQL, see AQL operator reference.
The precedence of the operators is the following: parentheses, AND, OR, comparison operators.
Use the usual keyboard shortcuts to undo (⌘/Ctrl + Z) or redo (⌘/Ctrl + Shift + Z) your edits.
14 - Storage
14.1 - Overview
Axoflow provides a range of storage solutions for your security data, with federated search capabilities.
AxoStore is a lightweight, queryable, temporary storage option that stores data locally on the AxoRouter host. AxoConsole provides federated search for every AxoRouter that has AxoStore deployed, so you can simultaneously run queries on every AxoStore.
AxoStore is automatically available for all Axoflow customers, for each AxoRouter node, with 7 days retention, and up to 1TB of storage. For longer retention time or bigger storage, you need an extended AxoStore subscription. Contact us for the details.
You can retrieve selected data from AxoStore and (rehydrate) it to other destinations for further analysis as needed.
AxoLake is a tiered SaaS security lake with a scalable hot tier for fast queries, and cost-efficient, S3-compatible cloud-based cold tier. You can use high-level, policy-based routing to decide which data goes to cold storage, hot storage, or your SIEM. If you need to work with data from cold storage, you can rehydrate it into hot storage, or even replay it to send it into your SIEM. Designed for long-term retention, open access, and integration with SIEMs and security analytics.
AxoLake provides cheap, long-term archive storage, while making hot data available for detection and analytics.
To separate the different data in the storage, you can create separate containers called stores. Each store appears as separate destination that you can select in your flows.
We refer to stores created in AxoStore as stores, while those in AxoLake are called external stores.
The available stores are listed on the Routers > Stores page. To show only one type of stores, select AQL Expression and enter type=axostore or type=external.
Rehydrate data
You can retrieve selected data from your stores and send (rehydrate) it to other destination for further analysis as needed. For details, see Rehydrate data.
14.2 - Search
The Search Logs page provides a federated search console to query all data stored in AxoStores (the storage component of AxoRouter) and external stores (AxoLake). Note that AxoStore is only available on an AxoRouter if it was enabled when the AxoRouter host was deployed or updated. For details, see Install AxoRouter on Linux.
To display data from the specified period without any specific search keywords, just select Search.
Basic Search mode searches in the values of the following fields of the messages: body, host_name
Basic Search is case insensitive. Adding multiple keywords searches for matches in any of the previous fields. This is equivalent to the @ANY =* keyword1 AND @ANY =* keyword2 AQL query.
AQL Query Search mode allows you to search in specific labels of the hosts using different operators.
It also makes more complex filtering possible, using the Equals, Contains (partial match), and Match (regular expression match) operators. Note that:
To execute the search, click Search, or hit ESC then ENTER.
AxoConsole autocompletes the built-in and custom labels and field names, as well as their most frequent values, but doesn’t autocomplete labels and variables created by data parsing and processing steps.
You can use the AND and OR operators to combine expressions, and also parenthesis if needed. For details on AQL, see AQL operator reference.
The precedence of the operators is the following: parentheses, AND, OR, comparison operators.
Use the usual keyboard shortcuts to undo (⌘/Ctrl + Z) or redo (⌘/Ctrl + Shift + Z) your edits.
For example, meta.vendor = palo-alto-networks, meta.host.labels.location != us-east-1, or meta.connection.src_ip =* 192.168.
When searching in stores, you can use the following fields (depending on the configuration of the store).
To limit the search, you can:
Adjust the Time range of the search (default is 1 day). Note that AxoStore retains data only for 7 days.
Search only the data stored on a specific Router (by default, AxoConsole searches in the data of every AxoRouter that has AxoStore deployed).
Search only the data in a specific Store. (By default, every AxoRouter that has AxoStore deployed has a default store. To create a new store, see Create Store or Create External Store.)
The time distribution of the search results allows you to quickly zoom in on a specific time period. You can select multiple bars to zoom in on them.
Events
The Events section of the page shows the search results.
Select Format to Wrap long events, and/or Prettify to format JSON messages into human-readable format.
You can open the elements of an event to see its metadata and other details. Depending on the configuration of the store, you can access the following fields.
To add a field to the selected fields and display it for every event, click the checkbox before the field. Selected fields are included as separate fields when you Export the search results into a CSV file.
To copy the name or the value of a field, select the name of the field, then select Copy Path or Copy Value.
To copy an AQL query that matches this field and its current value, select the name of the field, then select Copy as Query. You can paste this query into the AQL search field, and use it for filtering.
Fields
The sidebar shows the Frequent and Infrequent fields that appear in the events of the current page (and the number of their occurrence).
You can hover over any field and select add_circle_outline
to show the selected field and its value under each event that has this field.
To show other fields (and their occurrence) in the sidebar, select See all, then select the fields you want to display. Depending on the configuration of the store, you can access the following fields.
Export search results
To export the search results, select Export. Note that:
Only the search results shown on the current page will be exported (50 entries by default)
By default, the timestamp and the message fields are exported. To include other fields, add them to the selected fields before exporting the data.
To send the selected data to another destination for further analysis, see Rehydrate data.
Rehydrate search results
You can retrieve the selected data from your stores and send (rehydrate) it to other destination for further analysis as needed. For details, see Rehydrate data.
14.3 - Create Store
To create a new store in an AxoStore, complete the following steps.
AxoStore stores logs locally on the AxoRouter that processed the messages.
External stores use a separately deployed AxoLake or an existing compatible ClickHouse cluster.
Prerequisites
The AxoRouters you want to store data on must have been provisioned with the Enable AxoStore option enabled. (If there is a service called axostore in the Router > your-AxoRouter > Overview > Services list (even it’s grayed out), that AxoRouter has AxoStore enabled.)
To enable using AxoStore on an already deployed AxoRouter, re-deploy the AxoRouter with the Enable AxoStore option enabled.
Steps
To create a new store in an AxoStore, complete the following steps.
Navigate to Routers > Stores > Add Store.
Enter a Name for the store. This name will appear in the list of destinations (with the -store suffix) when setting the destination of a Flow. You cannot modify the name of the store later.
(Optional) Enter a description for the store.
Set Store type to AxoStore.
Set the Router Selector so it matches the AxoRouter instances where you want to create this store.
You can use any labels and metadata of the AxoRouter hosts in the Router selectors, for example, the hostname of the AxoRouter, or any custom labels.
If you leave the Router Selector field empty, the selector will match every AxoRouter instance.
To select only a specific AxoRouter instance, set the name field to the name of the instance as selector. For example, name = my-axorouter.
If you set multiple fields in the selector, the selector will match only AxoRouter instances that match all elements of the selector. (There in an AND relationship between the fields.)
(Optional) Select additional options about which message parts to store:
Include Metadata: If enabled, the metadata of the events is stored as a separate object. Otherwise, only the metadata that has dedicated fields in the Storage schema will be recorded.
Include Raw Body: Store also the original, unparsed (raw) message as a separate field.
CAUTION:
Enabling this option approximately doubles the storage size of the message.
Set the Retention Time (in days) so older data is automatically deleted from the store. You cannot modify this parameter later.
Select the Config Profile to use for the AxoStore. The profile determines resource limits (CPU, memory) and various optimization and performance settings. Every AxoRouter that creates this AxoStore will use the same profile. The following profiles are available:
CAUTION:
You cannot change the Config Profile of the AxoStore later.
Default: Recommended for small-scale deployments and evaluation use cases.
Large: For AxoRouters with powerful hardware (at least 16 vCPU and 32GiB RAM), used for storing large amount of data.
The new store will be created on the AxoRouters matching the Router Selector. You can check the stores available on an AxoRouter by selecting Routers > your-AxoRouter > Overview > Stores.
14.4 - Create External Store
To create a new store in an AxoLake or a self-managed Clickhouse instance, complete the following steps. (For details on deploying AxoLake or an appropriate self-managed Clickhouse instance, contact our support team.)
AxoStore stores logs locally on the AxoRouter that processed the messages.
External stores use a separately deployed AxoLake or an existing compatible ClickHouse cluster.
Prerequisites
You must have an AxoLake or a self-managed Clickhouse instance available.
You’ll need user credentials (username and password) to authenticate to the database. The account must have:
INSERT privileges for the database where you’re creating the store to send data, and
SELECT privileges to access the data from the Search Logs page.
Your AxoRouter instances must be able to access the database on the network level.
Steps
To create a new store in an AxoLake, complete the following steps.
Navigate to Routers > Stores > Add Store.
Enter a Name for the store. his name will appear in the list of destinations (with the -store suffix) when setting the destination of a Flow. You cannot modify the name of the store later.
(Optional) Enter a description for the store.
(Optional) Select additional options about which message parts to store:
Include Metadata: If enabled, the metadata of the events is stored as a separate object. Otherwise, only the metadata that has dedicated fields in the Storage schema will be recorded.
Include Raw Body: Store also the original, unparsed (raw) message as a separate field.
CAUTION:
Enabling this option approximately doubles the storage size of the message.
Set Store type to External.
Enter the name of the Database to create the store in. (This is the name of the database you’ve created in AxoLake/Clickhouse. It can only contain letters, numbers, and underscores.)
Set the gRPC Address and the HTTP Address of the database listener, for example, 10.0.0.123:9100 and 10.0.0.123:9000. Instead of IP address, you can also use FQDN.
Enter the credentials of the user account used to access the database into the User and Password fields.
Select Create.
14.5 - Store metrics
The Routers > Stores page lists the available stores. The list also shows the basic metrics of each store, including the number of events and the amount of disk used that the store uses.
For more details, select the name of a specific store.
Select insights
to see the analytics (for example, histogram) of the store metrics.
To search the stores, select search
. Selecting search
in the metrics of a particular AxoRouter automatically filters the search to that AxoRouter.
14.6 - Delete or Wipe Store
There are two ways to remove a store: delete and wipe.
Deleting a store immediately terminates the connection between your AxoRouters and the store. No further data will be added to the store. Data already in the store will be automatically deleted after the configured retention time of the store expires. To recover data from a deleted store before the retention time expires, contact our support team.
Wiping instantly deletes all data in the store.
CAUTION:
Wiping a store is irreversible and cannot be undone. All data in the store is lost forever.
To remove a store, complete the following steps.
Navigate to Routers > Stores. Alternatively, select ⌘/Ctrl + K and enter the name of the store.
Select the store you want to remove, then:
To delete the store, select ⋮ > Delete.
To wipe the store, select ⋮ > Wipe data.
Confirm that you want to remove the store.
14.7 - Deploy AxoLake
To create an AxoLake, or a self-managed Clickhouse instance, complete the following steps.
14.8 - Rehydrate data
You can retrieve selected data from your stores and send (rehydrate) it to other destination for further analysis as needed. For details, see Rehydrate data.
15 - Deploy AxoConsole
This chapter describes the installation and configuration of AxoConsole in different scenarios.
AxoConsole is available as:
an SaaS service,
on-premises deployment,
Kubernetes deployment.
15.1 - On-premise
15.1.1 - Deployment guide
This guide shows you how to install AxoConsole on a local, on-premises virtual machine using k3s and Helm. Installation of other components like the ingress controller and the cert-manager is also included. Since this is a single instance deployment, we don’t recommend using it in production environments. For additional steps and configurations needed in production environments, contact our support team.
To deploy AxoConsole in an air-gapped environment, see Air-gapped.
Note
AxoConsole is also available without installation as a SaaS service. You only have to install AxoConsole on premises if you want to run and manage it locally.
At a high level, the deployment consists of the following steps:
Any of these components can be skipped if already installed.
Basic authentication with admin user and password is configured by default. You can also configure other common authentication methods like LDAP, Github and Google.
Before deploying AxoRouter describes the steps you have to complete on a host before deploying AxoRouter on it. These steps are specific to on-premises AxoConsole deployments, and aren’t needed when using the SaaS AxoConsole.
Prerequisites
To install AxoConsole, you’ll need the following:
The URL for the AxoConsole installation script. You’ll receive this URL from our team. You can request it using the contact form.
CAUTION:
Don’t start the Install AxoConsole process until you’ve received the URL.
A license key for AxoConsole. You’ll receive this from our team. You can request it using the contact form.
Supported operating system: Ubuntu 24.04, Red Hat 9 and compatible (tested with AlmaLinux 9)
The virtual machine (VM) must have at least:
Resource
Minimum
Production
CPU
4 vCPU
16 vCPU
RAM
8 GB
16 GB
Disk (/)
100 GB
250 GB
A Minimum setup with 4 vCPU (x86_64-based), 8 GB RAM, and 100 GB disk space can handle about 100 AxoRouter instances and 1000 data source hosts.
A real-life production scenario that handles 100 AxoRouter and 3000 data source hosts with 30-day metric retention would need:
16 vCPU (x86_64-based)
16 GB RAM
250 GB disk space
Note
Note that AxoRouter and Axoflow agent collects detailed, real-time metrics about the data-flows – giving you observability over the health of the security data pipeline and its components. Your security data remains in your self-managed cloud or in your on-prem instance where your sources, destinations, Axoflow agents, and AxoRouters are running, only metrics are forwarded to AxoConsole.
You’ll need to have access to a user with sudo privileges.
Network access
The host must be able to access the following domains related to the AxoConsole:
When using AxoConsole SaaS:
<your-tenant-id>.cloud.axoflow.io: HTTPS traffic on TCP port 443, needed to download the binaries for Axoflow software (like Axolet and AxoRouter).
kcp.<your-tenant-id>.cloud.axoflow.io: HTTPS (mutual TLS) traffic on TCP port 443 for management traffic.
telemetry.<your-tenant-id>.cloud.axoflow.io: HTTPS (mutual TLS) traffic on TCP port 443, where Axolet sends the metrics of the host.
us-docker.pkg.dev: HTTPS traffic on TCP port 443, but only if you’re forcing the installation script to pull the container images from the public repository. The Axolet and AxoRouter for Linux installation scripts download the images directly from AxoConsole.
When using an on-premise AxoConsole:
The following domains should point to AxoConsole IP address to access Axoflow from your desktop and AxoRouter hosts:
your-host.your-domain: The main domain of your AxoConsole deployment.
idp.your-host.your-domain: A subdomain for the identity provider.
kcp.your-host.your-domain: A subdomain for management traffic.
telemetry.your-host.your-domain: A subdomain for agent telemetry.
The AxoConsole host must have the following Open Ports:
Port 80 (HTTP)
Port 443 (HTTPS)
When installing Axoflow agent for Windows or Linux:
github.com: HTTPS traffic on TCP port 443, for downloading installer packages.
Install AxoConsole
CAUTION:
This procedure covers how to deploy a new AxoConsole instance. The installation script can’t upgrade existing deployments, contact the Axoflow support team for detailed upgrade instructions.
Download the installation script from the URL you’ve received from the Axoflow Support Team.
Transfer the file to the host where you want to install AxoConsole.
Run the installation script with your license key and the domain name for your AxoConsole deployment.
Note
Re-running the installer will reuse any existing or modified manifests or user settings (for example, authentication settings added to /var/lib/rancher/k3s/server/manifests/axoflow-config.yaml) available on the host.
--disable-traefik: Disable the built-in Traefik ingress controller of k3s. Use this option when using a custom ingress controller.
Advanced flags:
--skip-images: Skip container image import entirely. Use when images are already loaded into k3s.
--image-mode bundle|component|skip: Control how container images are imported. bundle (default) imports pre-packaged image tarballs; component imports one image per component; skip skips import.
--prepare-env: Install k3s, cert-manager, and Traefik only — skip AxoConsole itself. Use for a two-phase install where you want to configure the environment before deploying AxoConsole.
If needed, follow the on-screen instructions. For a test installation, you can usually use the default values. For recommendations for a production environment, contact our support team.
The script prompts to display the password of the default admin user. Record it, you’ll need it to log in to AxoConsole.
...
[2026-06-02 20:44:28][INFO ] All pods in axoflow are ready/complete
[2026-06-02 20:44:28][INFO ] Axoflow is healthy
[2026-06-02 20:44:28][INFO ] Access the UI at: https://<axoconsole-domain-name>
Show admin credentials? [y/N]: y
Username: admin
Password: MzGIjuWKjXOtiRs4
If needed, later you can retrieve the password by running:
Note
When using AxoRouter with an on-premises AxoConsole deployment, you have to prepare the hosts before deploying AxoRouter. These steps are specific to on-premises AxoConsole deployments, and are not needed when using the SaaS AxoConsole.
Login to AxoConsole
If the domain name of AxoConsole cannot be resolved from your desktop, add it to the /etc/hosts file in the following format. Use and IP address of AxoConsole that can be accessed from your desktop.
Open the https://<your-host.your-domain> URL in your browser.
The on-premise deployment of AxoConsole shows a self-signed certificate. If your browser complains about the related risks, accept it.
Use the email address and password you got or set in the installation step to log in to AxoConsole.
Prepare AxoRouter hosts
Note
When using AxoRouter with an on-premises AxoConsole deployment, you have to prepare the hosts before deploying AxoRouter. These steps are specific to on-premises AxoConsole deployments, and are not needed when using the SaaS AxoConsole.
AxoConsole service reference
Service Name
Namespace
Purposes
Function
KCP
axoflow
Backend API
Kubernetes Like Service with built in database, that service manage all the settings that our system manage
Chalco
axoflow
Frontend API
Serve the UI API Calls, implement business logic for the UI
Controller-Manager
axoflow
Backend Service
Reacts to state changes in our business entities, manage business logic for the Backend
Telemetry Proxy
axoflow
Backend API
Receives agents telemetries
UI
axoflow
Dashboard
The frontend for AxoConsole
Prometheus
axoflow
Backend API /Service
Monitoring component to store time series information and an API for query, manage alert rules
Alertmanager
axoflow
Backend API /Service
Monitoring component to send alerts based on alerting rules (optional, disabled by default)
Axoflow IDP
axoflow
Identity Connector/Proxy
Identity Connector/Proxy to allow the customer to use own identity (Google, LDAP, etc.)
Axolet Dist
axoflow
Backend API
Static artifact store to contains agents binaries
Cert Manager (kcp)
axoflow
Automated Certificate management tool
Manage certificates for Agents
Cert Manager
cert-manager
Automated Certificate management tool
Manage certificates for Axoflow components (Backend API, HTTP Proxy)
Traefik Ingress Controller
kube-system
HTTP Proxy
Route the HTTP traffic between multiple Frontend/Backend APIs
Troubleshooting
If you get the [ERROR] Timed out waiting for k3s node to be Ready error message, increase the timeout limit by running K3S_TIMEOUT=180, then rerun the installation script.
In case of other errors, run the following command to create a debug package from the cluster, and contact our support team.
If you want to uninstall every component installed by the axoflow-install.sh, including any custom configuration changes you made, run the following commands.
CAUTION:
Hazard of data loss
The following commands remove the k3s Kubernetes distribution as well. If you’re using k3s to run other software apart from AxoConsole, don’t run these commands.
k3s-uninstall.sh; rm-rf /var/lib/rancher
15.1.1.1 - Manual deployment for AxoConsole 0.78.0
This guide shows you how to install AxoConsole on a local, on-premises virtual machine using k3s and Helm. Installation of other components like the ingress controller and the cert-manager is also included. Since this is a single instance deployment, we don’t recommend using it in production environments. For additional steps and configurations needed in production environments, contact our support team.
Note
AxoConsole is also available without installation as a SaaS service. You only have to install AxoConsole on premises if you want to run and manage it locally.
At a high level, the deployment consists of the following steps:
Basic authentication with admin user and password is configured by default. This guide also shows you how to configure other common authentication methods like LDAP, Github and Google.
Before deploying AxoRouter describes the steps you have to complete on a host before deploying AxoRouter on it. These steps are specific to on-premises AxoConsole deployments, and are not needed when using the SaaS AxoConsole.
Prerequisites
To install AxoConsole, you’ll need the following:
The URL for the AxoConsole Helm chart. You’ll receive this URL from our team. You can request it using the contact form.
CAUTION:
Don’t start the Install AxoConsole process until you’ve received the chart URL.
A license key for AxoConsole. You’ll receive this from our team. You can request it using the contact form.
Supported operating system: Ubuntu 24.04, Red Hat 9 and compatible (tested with AlmaLinux 9)
The virtual machine (VM) must have at least:
4 vCPUs (x86_64-based)
8 GB RAM
100 GB disk space
This setup can handle about 100 AxoRouter instances and 1000 data source hosts.
For reference, a real-life scenario that handles 100 AxoRouter and 3000 data source hosts with 30-day metric retention would need:
16 vCPU (x86_64-based)
16 GB RAM
250 GB disk space
Note
Note that AxoRouter and Axoflow agent collects detailed, real-time metrics about the data-flows – giving you observability over the health of the security data pipeline and its components. Your security data remains in your self-managed cloud or in your on-prem instance where your sources, destinations, Axoflow agents, and AxoRouters are running, only metrics are forwarded to AxoConsole.
You’ll need to have access to a user with sudo privileges.
Network access
The host must be able to access the following domains related to the AxoConsole:
When using AxoConsole SaaS:
<your-tenant-id>.cloud.axoflow.io: HTTPS traffic on TCP port 443, needed to download the binaries for Axoflow software (like Axolet and AxoRouter).
kcp.<your-tenant-id>.cloud.axoflow.io: HTTPS (mutual TLS) traffic on TCP port 443 for management traffic.
telemetry.<your-tenant-id>.cloud.axoflow.io: HTTPS (mutual TLS) traffic on TCP port 443, where Axolet sends the metrics of the host.
us-docker.pkg.dev: HTTPS traffic on TCP port 443, but only if you’re forcing the installation script to pull the container images from the public repository. The Axolet and AxoRouter for Linux installation scripts download the images directly from AxoConsole.
When using an on-premise AxoConsole:
The following domains should point to AxoConsole IP address to access Axoflow from your desktop and AxoRouter hosts:
your-host.your-domain: The main domain of your AxoConsole deployment.
idp.your-host.your-domain: A subdomain for the identity provider.
kcp.your-host.your-domain: A subdomain for management traffic.
telemetry.your-host.your-domain: A subdomain for agent telemetry.
The AxoConsole host must have the following Open Ports:
Port 80 (HTTP)
Port 443 (HTTPS)
When installing Axoflow agent for Windows or Linux:
github.com: HTTPS traffic on TCP port 443, for downloading installer packages.
Set up Kubernetes
Complete the following steps to install k3s and some dependencies on the virtual machine.
Run getenforce to check the status of SELinux.
Check the /etc/selinux/config file and make sure that the settings match the results of the getenforce output (for example, SELINUX=disabled). K3S supports SELinux, but the installation can fail if there is a mismatch between the configured and actual settings.
Install k3s.
Run the following command:
curl -sfL https://get.k3s.io |INSTALL_K3S_EXEC="--disable traefik --disable metrics-server"K3S_KUBECONFIG_MODE="644" sh -s -
while ! kubectl get job helm-install-cert-manager -n kube-system;do sleep 1donekubectl wait --for=condition=complete job/helm-install-cert-manager -n kube-system --timeout=300s
Install the AxoConsole
Complete the following steps to deploy the AxoConsole Helm chart.
Set the following environment variables as needed for your deployment.
The domain name for your AxoConsole deployment. This must point to the IP address of the VM you’re installing AxoConsole on.
BASE_HOSTNAME=your-host.your-domain
Note
To use Google authentication, AxoConsole must be deployed on a publicly accessible domain name (the $BASE_HOSTNAME must end with a valid top-level domain, for example, .com or .io.)
The license key of AxoConsole. You’ll receive this from our team. You can request it using the contact form.
LICENSE_KEY="your-license-key"
The version number of AxoConsole you want to deploy.
VERSION="0.78.0"
The internal IP address of the virtual machine. This is needed so the authentication service can communicate with the identity provider without relying on DNS.
VM_IP_ADDRESS=$(hostname -I | cut -d' ' -f1)
Check that the above command returned the correct IP, it might not be accurate if the host has multiple IP addresses.
The URL of the Axoflow Helm chart. You’ll receive this URL from our team. You can request it using the contact form.
Install AxoConsole. You can either let the chart create a password, or you can set an email and password manually.
Add password automatically: The following configuration file enables automatic password creation. If this basic setup is working, you can configure another authentication provider.
Record the email and password, you’ll need it to log in to AxoConsole.
Set password manually: If you’d like to set the email/password manually, create the secret storing the required information, then set a unique identifier for the administrator user using uuidgen. Note that:
On Ubuntu, you must first install the uuid-runtime package by running sudo apt install uuid-runtime.
To set the bcrypt hash of the administrator password, you can generate it with the htpasswd tool, which is part of the httpd-tools package on Red Hat (install it using sudo dnf install httpd-tools), and the apache2-utils package on Ubuntu (install it using sudo apt install apache2-utils).
(For details on what the different services do, see the service reference.)
Note
When using AxoRouter with an on-premises AxoConsole deployment, you have to prepare the hosts before deploying AxoRouter. These steps are specific to on-premises AxoConsole deployments, and are not needed when using the SaaS AxoConsole.
Login to AxoConsole
If the domain name of AxoConsole cannot be resolved from your desktop, add it to the /etc/hosts file in the following format. Use and IP address of AxoConsole that can be accessed from your desktop.
Open the https://<your-host.your-domain> URL in your browser.
The on-premise deployment of AxoConsole shows a self-signed certificate. If your browser complains about the related risks, accept it.
Use the email address and password you got or set in the installation step to log in to AxoConsole.
Prepare AxoRouter hosts
Note
When using AxoRouter with an on-premises AxoConsole deployment, you have to prepare the hosts before deploying AxoRouter. These steps are specific to on-premises AxoConsole deployments, and are not needed when using the SaaS AxoConsole.
AxoConsole service reference
Service Name
Namespace
Purposes
Function
KCP
axoflow
Backend API
Kubernetes Like Service with built in database, that service manage all the settings that our system manage
Chalco
axoflow
Frontend API
Serve the UI API Calls, implement business logic for the UI
Controller-Manager
axoflow
Backend Service
Reacts to state changes in our business entities, manage business logic for the Backend
Telemetry Proxy
axoflow
Backend API
Receives agents telemetries
UI
axoflow
Dashboard
The frontend for AxoConsole
Prometheus
axoflow
Backend API /Service
Monitoring component to store time series information and an API for query, manage alert rules
Alertmanager
axoflow
Backend API /Service
Monitoring component to Send alert based on alerting rules
Dex
axoflow
Identity Connector/Proxy
Identity Connector/Proxy to allow the customer to use own identity (Google, Ldap, etc.)
Pomerium
axoflow
HTTP Proxy
Allow policy based access to the Frontend API (Chalco)
Axolet Dist
axoflow
Backend API
Static artifact store to contains agents binaries
Cert Manager (kcp)
axoflow
Automated Certificate management tool
Manage certificates for Agents
Cert Manager
cert-manager
Automated Certificate management tool
Manage certificates for Axoflow components (Backend API, HTTP Proxy)
NGINX Ingress Controller
ingress-nginx
HTTP Proxy
Allow routing the HTTP traffic between multiple Frontend/Backend API
15.1.2 - syslog-ng
How to instrument syslog-ng hosts for use with an on-prem AxoConsole
Onboarding allows you to collect metrics about the host, display the host on the Topology page, and to tap into the log flow.
Onboarding requires you to modify the host and the configuration of the logging agent (syslog-ng) running on the host.
Level 1: Install Axolet on the host where syslog-ng is running. Axolet collects metrics from the host and sends them to the AxoConsole, so you can check host-level metrics on the Metrics & Health page of the host, and displays the host on the Topology page.
Level 2: Instrument the configuration of the logging agent to provide detailed metrics about the traffic flow. This allows you to display data about the host on the Analytics page.
For syslog-ng PE, version 7.0.33 or newer is required. Note that the 7.0.x product line needs a different configuration snippet than the 8.1.x product line.
For syslog-ng OSE, version 4.1.1 or newer is required, but we recommend using AxoSyslog instead (at least syslog-ng OSE version 4.5.0).
Provision syslog-ng
To onboard an existing syslog-ng instance into Axoflow, complete the following steps.
The syslog-ng host will now be visible on the Topology page of the AxoConsole as a source.
If you've already added the AxoRouter instance or other destination where this newly-registered host is sending data to the AxoConsole, add a path to connect the host to the AxoRouter or the destination.
Select Topology > Add Item > Path.
Select the target router or aggregator this source is sending its data to in the Target host field, for example, axorouter.
Select the Target connector. The connector determines how the destination receives the data (for example, using which protocol or port).
Select Add. The new path appears on the Topology page.
Access the syslog-ng host and edit the configuration of syslog-ng. Set the statistics-related global options like this (if the options block already exists, add these lines to the bottom of the block):
options { stats-level(2); stats-freq(0);# Inhibit statistics output to stdout};
(Optional) To get detailed metrics and analytics about the traffic that flows through the host, instrument your syslog-ng configuration as follows:
Note
You can use Axolet with an un-instrumented syslog-ng configuration file, but that limits available metrics to host statistics (for example, disk, memory, queue information). You won’t be able to access data about the actual traffic flowing through the host. To collect traffic-related metrics, instrument configuration with metrics-probe() stanzas. The example below shows how to instrument the configuration to highlight common macros such as $HOST and $PROTOCOL. If you want to customize the collected metrics or need help with the instrumentation, contact us.
Download the following configuration snippet to the syslog-ng host, for example, as /etc/syslog-ng/conf.d/axoflow-instrumentation.conf for syslog-ng.
For syslog-ng PE, use /opt/syslog-ng/etc/axoflow-instrumentation.conf.
For syslog-ng PE 8.x and newer:
# Metrics probe parser definition for a specified destination# This will yield a reasonable number of metrics for common# syslog-ng macrosblock parser metrics-output(destination(undefined)){# This will probe for the number of *events*.# key name is fixed; labels are user-specified metrics-probe( key("classified_output_events_total") labels("host"=> "${HOST}""service"=> "${PROGRAM}""source"=> "${SOURCE}""dest_port"=> "$DESTPORT""dest_ip"=> "$DESTIP""src_ip"=> "$SOURCEIP""protocol"=> "$(if($PROTO== 6) TCP $(if($PROTO== 17) UDP $PROTO))""ip_protocol"=> "$IP_PROTO""transport"=> "$TRANSPORT""destination_name"=> "`destination`""issue"=> "$(or $(tags-head message.parse_error syslog.unexpected_framing syslog.missing_pri syslog.rfc3164_missing_header syslog.invalid_hostname message.utf8_sanitized)'none')"));# This will probe for the number of *bytes*.# key name is fixed; labels are user-specified metrics-probe( key("classified_output_event_bytes_total") increment("${RAWMSG_SIZE}") labels("host"=> "${HOST}""service"=> "${PROGRAM}""source"=> "${SOURCE}""dest_port"=> "$DESTPORT""dest_ip"=> "$DESTIP""src_ip"=> "$SOURCEIP""protocol"=> "$(if($PROTO== 6) TCP $(if($PROTO== 17) UDP $PROTO))""ip_protocol"=> "$IP_PROTO""transport"=> "$TRANSPORT""destination_name"=> "`destination`""issue"=> "$(or $(tags-head message.parse_error syslog.unexpected_framing syslog.missing_pri syslog.rfc3164_missing_header syslog.invalid_hostname message.utf8_sanitized)'none')"));};# For syslog-ng OSE this should be /var/lib/syslog-ng/axotap.sock@define AXOTAP_SOCK "/opt/syslog-ng/var/axotap.sock"destination "d_axotap"{ channel { filter { rate-limit(key("$SOURCE:$PROGRAM:$HOST:$SOURCEIP:$DESTIP") rate(1));}; rewrite { set("$(substr ${MESSAGE}0 32768)" value(MESSAGE)); set("$(substr ${RAWMSG}0 32768)" value(RAWMSG)); set("$(format-json debug.msg=$(format-json --scope all-nv-pairs) log.body=${MESSAGE})" value(".tap.event")); set('{"note":"message object too long for tapping"}' value(".tap.event") condition("$(length ${.tap.event})" > 131072)); set("$(format-json tap=$(format-json tapId=''eventId=${UNIQID}labels=$(format-json)hostCandidate=$(format-json)facility=${FACILITY}format=${MSGFORMAT}hostFrom=${HOST_FROM}message=$(echo${MESSAGE})rawMessage=${RAWMSG}severity=${SEVERITY}source=${SOURCE}tags=${TAGS}timestamp=${ISODATE}transport=${TRANSPORT})event=json(${.tap.event}))" value(".tap.formatted"));}; destination { unix-dgram("`AXOTAP_SOCK`" template("${.tap.formatted}"));};};};
For syslog-ng PE 7.0.33 and newer 7.0.x, and syslog-ng OSE version 4.1.1-4.4.0:
# Metrics probe parser definition for a specified destination# This will yield a reasonable number of metrics for common# syslog-ng macrosblock parser metrics-output(destination(undefined)){# This will probe for the number of *events*.# key name is fixed; labels are user-specified metrics-probe( key("classified_output_events_total") labels("host"=> "${HOST}""service"=> "${PROGRAM}""source"=> "${SOURCE}""dest_port"=> "$DESTPORT""dest_ip"=> "$DESTIP""src_ip"=> "$SOURCEIP""protocol"=> "$(if($PROTO== 6) TCP $(if($PROTO== 17) UDP $PROTO))""ip_protocol"=> "$IP_PROTO""transport"=> "$TRANSPORT""destination_name"=> "`destination`""issue"=> "$(or $(tags-head message.parse_error syslog.unexpected_framing syslog.missing_pri syslog.rfc3164_missing_header syslog.invalid_hostname message.utf8_sanitized)'none')"));# This will probe for the number of *bytes*.# key name is fixed; labels are user-specified metrics-probe( key("classified_output_event_bytes_total") increment("${RAWMSG_SIZE}") labels("host"=> "${HOST}""service"=> "${PROGRAM}""source"=> "${SOURCE}""dest_port"=> "$DESTPORT""dest_ip"=> "$DESTIP""src_ip"=> "$SOURCEIP""protocol"=> "$(if($PROTO== 6) TCP $(if($PROTO== 17) UDP $PROTO))""ip_protocol"=> "$IP_PROTO""transport"=> "$TRANSPORT""destination_name"=> "`destination`""issue"=> "$(or $(tags-head message.parse_error syslog.unexpected_framing syslog.missing_pri syslog.rfc3164_missing_header syslog.invalid_hostname message.utf8_sanitized)'none')"));};# For syslog-ng OSE this should be /var/lib/syslog-ng/axotap.sock@define AXOTAP_SOCK "/opt/syslog-ng/var/axotap.sock"destination "d_axotap"{ channel { filter { rate-limit(template("$SOURCE:$PROGRAM:$HOST:$SOURCEIP:$DESTIP") rate(1));}; rewrite { set("$(substr ${MESSAGE}0 32768)" value(MESSAGE)); set("$(substr ${RAWMSG}0 32768)" value(RAWMSG)); set("$(format-json debug.msg=$(format-json --scope all-nv-pairs) log.body=${MESSAGE})" value(".tap.event")); set('{"note":"message object too long for tapping"}' value(".tap.event") condition("$(length ${.tap.event})" > 131072)); set("$(format-json tap=$(format-json tapId=''eventId=${UNIQID}labels=$(format-json)hostCandidate=$(format-json)facility=${FACILITY}format=${MSGFORMAT}hostFrom=${HOST_FROM}message=$(echo${MESSAGE})rawMessage=${RAWMSG}severity=${SEVERITY}source=${SOURCE}tags=${TAGS}timestamp=${ISODATE}transport=${TRANSPORT})event=json(${.tap.event}))" value(".tap.formatted"));}; destination { unix-dgram("`AXOTAP_SOCK`" template("${.tap.formatted}"));};};};
Include it in at the top of your configuration file:
@version: current
@include "axoflow-instrumentation.conf"
Edit every destination statement to include a parser { metrics-output(destination(my-destination)); }; line (making sure to include the channel construct if your destination block does not already contain it):
To enable log tapping for the traffic that flows through the host, add the d_axotap destination in your log paths. This allows the Axolet agent to collect rate-limited log samples from that specific point in the pipeline.
Note
There are multiple ways to add tapping to your configuration, which in some cases can introduce unwanted side effects. Contact us to help you create a safe tapping configuration for your use case!
Find a log path that you want to tap into and add the tap destination in a safe way, for example, by adding it in a separate inner log path:
Use when you want to authenticate users with an existing identity system such as LDAP, Google, or GitHub.
The built-in provider is enabled automatically during installation. To use a different provider, see the relevant section below.
15.1.3.1 - Dex
Dex is an open-source identity federation layer. When you configure AxoConsole to use Dex, Dex handles authentication with your existing identity system and passes user identity back to AxoConsole.
The following connectors are supported:
LDAP — connect to an LDAP or Active Directory server
After saving the file, k3s automatically applies the changes. Users will be redirected to the Dex login page on next login.
15.1.3.1.1 - GitHub
This section shows you how to use GitHub OAuth2 as an authentication backend for AxoConsole. It is assumed that you already have a GitHub organization. Complete the following steps.
Prerequisites
Register a new OAuth GitHub application for your organization. (For testing, you can create it under your personal account.) Make sure to:
Set the Homepage URL to the URL of your AxoConsole deployment: https://<your-console-host.your-domain>/callback, for example, https://axoflow-console.example.com.
Set the Authorization callback URL to: https://auth.<your-console-host.your-domain>/callback, for example, https://auth.axoflow-console.example.com/callback.
Save the Client id of the app, you’ll need it to configure AxoConsole.
Generate a Client secret and save it, you’ll need it to configure AxoConsole.
Configuration
Configure Dex as the OIDC provider in the /var/lib/rancher/k3s/server/manifests/axoflow-config.yaml file. For example:
Configure authentication by editing the spec.dex.config section of the /var/lib/rancher/k3s/server/manifests/axoflow-config.yaml file.
(Optional) If you’ve used our earlier example, delete the spec.dex.config.staticPasswords section.
Add the spec.dex.config.connectors section to the file, like this:
dex:enabled:truelocalIP:$VM_IP_ADDRESSconfig:create:trueconnectors:- type:github# Required field for connector id.id:github# Required field for connector name.name:GitHubconfig:# Credentials can be string literals or pulled from the environment.clientID:<ID-of-GitHub-application>clientSecret:<Secret-of-GitHub-application>redirectURI:<idp.your-host.your-domain/callback>orgs:- name:<your-GitHub-organization>
Note that if you have a valid domain name that points to the VM, you can omit the localIP: $VM_IP_ADDRESS line.
connectors.config.clientID: The ID of the GitHub OAuth application.
connectors.config.clientSecret: The client secret of the GitHub OAuth application.
connectors.config.redirectURI: The callback URL of the GitHub OAuth application: https://auth.<your-console-host.your-domain>/callback, for example, https://auth.axoflow-console.example.com/callback.
If you want to fetch every GitHub group, replace the entire orgs section with the loadAllGroups: true
connectors.config.orgs: List of the GitHub organizations whose members can access AxoConsole. Restrict access to your organization.
Configure authorization in the kcp.rbac.roles section of the /var/lib/rancher/k3s/server/manifests/axoflow-config.yaml file.
The following roles are available in AxoConsole by default:
IAMadmin: Can manage the roles and permissions to access AxoConsole. Only this role can make changes on the Settings > Roles page.
admin: Has full access to AxoConsole, but has only read access to the Settings > Roles page.
infrastructureManager: Can manage the infrastructure (without the permissions to view or tap log contents, or to rehydrate data). Has full access to the following pages: Activity Logs, Alerting, Routers, Sources, Flows, Provisioning, Search Logs. Can tap into service logs which may contain event payload.
infrastructureViewer: Similar to infrastructure-manager, but can only view the pages.
contentManager: Can view log content and manage content related details like flows (without the permissions to manage infrastructure, but including access to view infrastructure details).
Has full access to the Rehydration page.
Can view and modify Flows, but can’t create or delete them.
Can view Routers, Sources, Search Logs, Analytics.
Can tap into logs.
contentViewer: Can view content like analytics, log search, log tapping (without the permissions to manage or view infrastructure details).
You can use email addresses or GitHub groups to assign your users to AxoConsole user roles.
To use the groups fetched from GitHub, prefix the name of the GitHub group with groups:, and add them to the related roles under kcp.rbac.roles.<role>.groups. For example:
A specific email address, for example, email:username@example.com
Note
The user must be able to authenticate to AxoConsole using this email address, so authentication must be properly set up.
Multiple identity providers may allow authentication with the same email address, possibly with different level of ownership validation.
An entire email domain, for example, emaildomain:example.com. Any user who authenticates with an email address belonging to this email domain will have access to the role.
A user group. The format of the group depends on the OID provider.
If you’re using AxoConsole as a SaaS, specify the group in the following format: cognito:groups:<groupname-retrieved-from-cognito>, for example, cognito:groups:ExampleGoogleSaml:Operator.
If you’re using an on-prem AxoConsole deployment, specify the group in the following format: groups:<groupname-retrieved-from-dex> for example, groups:operator.
A specific session of an authenticated user, in the following format: user:<oidc-response-subject>, for example: user:42c4e962-f077-705f-138f-f01ba1220c44.
Every authenticated user: axoflow:user
For details on authorization settings, see Authorization.
Save the file.
Restart the dex deployment after changing the connector:
kubectl rollout restart deployment/dex -n axoflow
Expected output:
deployment.apps/dex restarted
Open the main page of your AxoConsole deployment in your browser. You’ll be redirected to the GitHub authentication page.
After completing the GitHub authentication you can access AxoConsole.
Getting help
You can troubleshoot common errors by running kubectl logs -n axoflow <dex-container-name>
If you run into problems setting up the authentication or authorization, contact our support team.
15.1.3.1.2 - Google
This section shows you how to use Google OpenID Connect as an authentication backend for AxoConsole. It is assumed that you already have a Google organization and Google Cloud Console access. Complete the following steps.
Prerequisites
To use Google authentication, AxoConsole must be deployed on a publicly accessible domain name (the $BASE_HOSTNAME must end with a valid top-level domain, for example, .com or .io.)
Configure OpenID Connect and create an OpenID credential for a Web application.
Make sure to set the Authorized redirect URIs to: https://auth.<your-console-host.your-domain>/callback, for example, https://auth.axoflow-console.example.com/callback.
Save the Client ID of the app and the Client secret of the application, you’ll need them to configure AxoConsole.
To use group memberships when assigning your users to AxoConsole user roles, you have to configure a service account to retrieve group memberships. Otherwise, you can use email domains. To set up a proper service account, complete the following steps.
You’ll also need the email address of a Google Workspace user with a minimum of the Groups Reader Role assigned. The service account will impersonate this user when making calls to the admin API.
Configuration
Configure Dex as the OIDC provider in the /var/lib/rancher/k3s/server/manifests/axoflow-config.yaml file. For example:
Configure authentication by editing the spec.dex.config section of the /var/lib/rancher/k3s/server/manifests/axoflow-config.yaml file.
(Optional) If you’ve used our earlier example, delete the spec.dex.config.staticPasswords section.
Add the spec.dex.config.connectors section to the file, like this:
connectors:- type:googleid:googlename:Googleconfig:# Connector config values starting with a "$" will read from the environment.clientID:<ID-of-Google-application>clientSecret:<Secret-of-GitHub-application># Dex's issuer URL + "/callback"redirectURI:<idp.your-host.your-domain/callback># Set the value of `prompt` query parameter in the authorization request# The default value is "consent" when not set.promptType:consent# Google supports whitelisting allowed domains when using G Suite# (Google Apps). The following field can be set to a list of domains# that can log in:#hostedDomains:- <your-domain># For group membership authorization:#serviceAccountFilePath: "/etc/dex/sa-file/service-account.json"#domainToAdminEmail:#"*": <impersonated-group-reader-email-address>
connectors.config.clientID: The ID of the Google application.
connectors.config.clientSecret: The client secret of the Google application.
connectors.config.redirectURI: The callback URL of the Google application: https://auth.<your-console-host.your-domain>/callback, for example, https://auth.axoflow-console.example.com/callback.
connectors.config.hostedDomains: The domain where AxoConsole is deployed, for example, example.com. Your users must have email addresses for this domain at Google.
If you’ll use Google group memberships for authorization, uncomment the serviceAccountFilePath and domainToAdminEmail sections. Replace <impersonated-group-reader-email-address> with the email address you created in Google group memberships prerequisites.
# For group membership authorization:serviceAccountFilePath:"/etc/dex/sa-file/service-account.json"domainToAdminEmail:"*": <impersonated-group-reader-email-address>
Configure authorization in the kcp.rbac.roles section of the /var/lib/rancher/k3s/server/manifests/axoflow-config.yaml file.
The following roles are available in AxoConsole by default:
IAMadmin: Can manage the roles and permissions to access AxoConsole. Only this role can make changes on the Settings > Roles page.
admin: Has full access to AxoConsole, but has only read access to the Settings > Roles page.
infrastructureManager: Can manage the infrastructure (without the permissions to view or tap log contents, or to rehydrate data). Has full access to the following pages: Activity Logs, Alerting, Routers, Sources, Flows, Provisioning, Search Logs. Can tap into service logs which may contain event payload.
infrastructureViewer: Similar to infrastructure-manager, but can only view the pages.
contentManager: Can view log content and manage content related details like flows (without the permissions to manage infrastructure, but including access to view infrastructure details).
Has full access to the Rehydration page.
Can view and modify Flows, but can’t create or delete them.
Can view Routers, Sources, Search Logs, Analytics.
Can tap into logs.
contentViewer: Can view content like analytics, log search, log tapping (without the permissions to manage or view infrastructure details).
A specific email address, for example, email:username@example.com
Note
The user must be able to authenticate to AxoConsole using this email address, so authentication must be properly set up.
Multiple identity providers may allow authentication with the same email address, possibly with different level of ownership validation.
An entire email domain, for example, emaildomain:example.com. Any user who authenticates with an email address belonging to this email domain will have access to the role.
A user group. The format of the group depends on the OID provider.
If you’re using AxoConsole as a SaaS, specify the group in the following format: cognito:groups:<groupname-retrieved-from-cognito>, for example, cognito:groups:ExampleGoogleSaml:Operator.
If you’re using an on-prem AxoConsole deployment, specify the group in the following format: groups:<groupname-retrieved-from-dex> for example, groups:operator.
A specific session of an authenticated user, in the following format: user:<oidc-response-subject>, for example: user:42c4e962-f077-705f-138f-f01ba1220c44.
Every authenticated user: axoflow:user
For details on authorization settings, see Authorization.
Save the file.
If you’re using Google groups to assign user roles, complete the following steps.
Run the following command to delete the dex-google-service-account secret. This is a placeholder secret that you’ll re-create with valid values in the next step.
Edit the /var/lib/rancher/k3s/server/manifests/axoflow-config.yaml file and set the dex.googleServiceAccount.create option to false.
Restart the dex deployment after changing the connector:
kubectl rollout restart deployment/dex -n axoflow
Expected output:
deployment.apps/dex restarted
Open the main page of your AxoConsole deployment in your browser. You’ll be redirected to the Google authentication page.
After completing the Google authentication you can access AxoConsole.
Getting help
You can troubleshoot common errors by running kubectl logs -n axoflow <dex-container-name>
If you run into problems setting up the authentication or authorization, contact our support team.
15.1.3.1.3 - LDAP
This section shows you how to use LDAP as an authentication backend for AxoConsole. In the examples we used the public demo service of FreeIPA as an LDAP server. It is assumed that you already have an LDAP server in place. Complete the following steps.
Configure Dex as the OIDC provider in the /var/lib/rancher/k3s/server/manifests/axoflow-config.yaml file. For example:
Configure authentication by editing the spec.dex.config section of the /var/lib/rancher/k3s/server/manifests/axoflow-config.yaml file.
(Optional) If you’ve used our earlier example, delete the spec.dex.config.staticPasswords section.
Add the spec.dex.config.connectors section to the file, like this:
CAUTION:
This example shows a simple configuration suitable for testing. In production environments, make sure to:
configure TLS encryption to access your LDAP server
retrieve the bind password from a vault or environment variable. Note that if the bind password contains the $ character, you must set it in an environment variable and pass it like bindPW: $LDAP_BINDPW.
dex:enabled:truelocalIP:$VM_IP_ADDRESSconfig:create:trueconnectors:- type:ldapname:OpenLDAPid:ldapconfig:host:ipa.demo1.freeipa.orginsecureNoSSL:true# This would normally be a read-only user.bindDN:uid=admin,cn=users,cn=accounts,dc=demo1,dc=freeipa,dc=orgbindPW:Secret123usernamePrompt:Email AddressuserSearch:baseDN:dc=demo1,dc=freeipa,dc=orgfilter:"(objectClass=person)"username:mail# "DN" (case sensitive) is a special attribute name. It indicates that# this value should be taken from the entity's DN not an attribute on# the entity.idAttr:uidemailAttr:mailnameAttr:cngroupSearch:baseDN:dc=demo1,dc=freeipa,dc=orgfilter:"(objectClass=groupOfNames)"userMatchers:# A user is a member of a group when their DN matches# the value of a "member" attribute on the group entity.- userAttr:DNgroupAttr:member# The group name should be the "cn" value.nameAttr:cn
connectors.config.host: The hostname and optionally the port of the LDAP server in “host:port” format.
connectors.config.bindDN and connectors.config.bindPW: The DN and password for an application service account that the connector uses to search for users and groups.
connectors.config.userSearch.bindDN and connectors.config.groupSearch.bindDN: The base DN for the user and group search.
Configure authorization in the kcp.rbac.roles section of the /var/lib/rancher/k3s/server/manifests/axoflow-config.yaml file.
The following roles are available in AxoConsole by default:
IAMadmin: Can manage the roles and permissions to access AxoConsole. Only this role can make changes on the Settings > Roles page.
admin: Has full access to AxoConsole, but has only read access to the Settings > Roles page.
infrastructureManager: Can manage the infrastructure (without the permissions to view or tap log contents, or to rehydrate data). Has full access to the following pages: Activity Logs, Alerting, Routers, Sources, Flows, Provisioning, Search Logs. Can tap into service logs which may contain event payload.
infrastructureViewer: Similar to infrastructure-manager, but can only view the pages.
contentManager: Can view log content and manage content related details like flows (without the permissions to manage infrastructure, but including access to view infrastructure details).
Has full access to the Rehydration page.
Can view and modify Flows, but can’t create or delete them.
Can view Routers, Sources, Search Logs, Analytics.
Can tap into logs.
contentViewer: Can view content like analytics, log search, log tapping (without the permissions to manage or view infrastructure details).
Add the names of the LDAP groups to the related roles under kcp.rbac.roles.<role>.groups. In the following example, the managers group gets administrator role, and the readonly group gets read-only access to AxoConsole.
A specific email address, for example, email:username@example.com
Note
The user must be able to authenticate to AxoConsole using this email address, so authentication must be properly set up.
Multiple identity providers may allow authentication with the same email address, possibly with different level of ownership validation.
An entire email domain, for example, emaildomain:example.com. Any user who authenticates with an email address belonging to this email domain will have access to the role.
A user group. The format of the group depends on the OID provider.
If you’re using AxoConsole as a SaaS, specify the group in the following format: cognito:groups:<groupname-retrieved-from-cognito>, for example, cognito:groups:ExampleGoogleSaml:Operator.
If you’re using an on-prem AxoConsole deployment, specify the group in the following format: groups:<groupname-retrieved-from-dex> for example, groups:operator.
A specific session of an authenticated user, in the following format: user:<oidc-response-subject>, for example: user:42c4e962-f077-705f-138f-f01ba1220c44.
Every authenticated user: axoflow:user
For details on authorization settings, see Authorization.
Save the file.
Restart the dex deployment after changing the connector:
kubectl rollout restart deployment/dex -n axoflow
Expected output:
deployment.apps/dex restarted
Getting help
You can troubleshoot common errors by running kubectl logs -n axoflow <dex-container-name>
If you run into problems setting up the authentication or authorization, contact our support team.
15.1.4 - Authorization
These sections show you how to configure the authorization of AxoConsole with different authentication backends.
You can configure authorization in the spec.pomerium.policy section of the AxoConsole manifest. In on-premise deployments, the manifest is in the /var/lib/rancher/k3s/server/manifests/axoflow-config.yaml file.
You can list individual email addresses and user groups to have read and write (using the keys under spec.pomerium.policy) and read-only (using the keys under spec.pomerium.policy.readOnly) access to AxoConsole. Which key to use depends on the authentication backend configured for AxoConsole:
emails: Email addresses used with static passwords and GitHub authentication.
With GitHub authentication, use the primary GitHub email addresses of your users, otherwise the authorization will fail.
claim/groups: LDAP groups used with LDAP authentication. For example:
When using AxoRouter with an on-premises AxoConsole deployment, you have to complete the following steps on the hosts you want to deploy AxoRouter on. These steps are specific to on-premises AxoConsole deployments, and are not needed when using the SaaS AxoConsole.
If the domain name of AxoConsole cannot be resolved from the AxoRouter host, add it to the /etc/hosts file of the AxoRouter host in the following format. Use and IP address of AxoConsole that can be accessed from the AxoRouter host.
Import AxoConsole certificates to AxoRouter hosts.
On the AxoConsole host: Run the following command to extract the AxoConsole CA certificate. The AxoRouter host will need this certificate to download the installation binaries.
On the AxoRouter hosts: Copy the certificate file extracted from the AxoConsole host.
On Red Hat: Copy the files into the /etc/pki/ca-trust/source/anchors/ folder, then run sudo update-ca-trust extract. (If needed, install the ca-certificates package.)
On Ubuntu: Copy the files into the /usr/local/share/ca-certificates/ folder, then run sudo update-ca-certificates
curl -I https://<your-host.your-domain> should give you a valid HTTP/2 200 response
If you want to download the AxoRouter images directly from AxoConsole (useful in air-gapped environments), enable the [External image pull](/provisioning/axorouter/linux/advanced-options/_index.md#external-images) option of the provisioning script.
15.1.6 - Upgrade
To upgrade an on-prem AxoConsole deployment, complete the following steps.
Log in to the host running AxoConsole.
Run the following command to update the version number in the /var/lib/rancher/k3s/server/manifests/axoflow-config.yaml file to 0.81.1.
sudo sed -i.old -E 's/^( *version: ).*/\10.81.1/' /var/lib/rancher/k3s/server/manifests/axoflow-config.yaml
Wait a few minutes until the pods are restarted. You can check their status by running:
kubectl get pods -A
If everything is working as expected, re-deploy your AxoRouter and Axoflow agent instances to upgrade them.
This guide shows you how to install AxoConsole in an air-gapped environment on a virtual machine. To deploy an on-premises AxoConsole that has internet access, see Deployment guide.
Since this is a single instance deployment, we don’t recommend using it in production environments. For additional steps and configurations needed in production environments, contact our support team.
At a high level, the deployment consists of the following steps:
Any of these components can be skipped if already installed.
Basic authentication with admin user and password is configured by default. You can also configure other common authentication methods like LDAP, Github and Google.
Before deploying AxoRouter describes the steps you have to complete on a host before deploying AxoRouter on it. These steps are specific to on-premises AxoConsole deployments, and aren’t needed when using the SaaS AxoConsole.
Prerequisites
To install AxoConsole, you’ll need the following:
The URL for downloading the AxoConsole bundle. You’ll receive this URL from our team. You can request it using the contact form.
CAUTION:
Don’t start the Install AxoConsole process until you’ve received the bundle URL.
A license key for AxoConsole. You’ll receive this from our team. You can request it using the contact form.
Supported operating system: Ubuntu 24.04, Red Hat 9 and compatible (tested with AlmaLinux 9)
The virtual machine (VM) must have at least:
Resource
Minimum
Production
CPU
4 vCPU
16 vCPU
RAM
8 GB
16 GB
Disk (/)
100 GB
250 GB
A Minimum setup with 4 vCPU (x86_64-based), 8 GB RAM, and 100 GB disk space can handle about 100 AxoRouter instances and 1000 data source hosts.
A real-life production scenario that handles 100 AxoRouter and 3000 data source hosts with 30-day metric retention would need:
16 vCPU (x86_64-based)
16 GB RAM
250 GB disk space
Note
Note that AxoRouter and Axoflow agent collects detailed, real-time metrics about the data-flows – giving you observability over the health of the security data pipeline and its components. Your security data remains in your self-managed cloud or in your on-prem instance where your sources, destinations, Axoflow agents, and AxoRouters are running, only metrics are forwarded to AxoConsole.
You’ll need to have access to a user with sudo privileges.
Install AxoConsole
CAUTION:
This procedure covers how to deploy a new AxoConsole instance. The installation script can’t upgrade existing deployments, contact the Axoflow support team for detailed upgrade instructions.
Download the installation bundle file from the URL you’ve received from the Axoflow Support Team.
Transfer the file to the host where you want to install AxoConsole.
Extract the file and navigate into the directory.
tar -xf axoflow-all-in-one-0.81.1-linux-amd64.tar
cd axoflow-all-in-one-0.81.1-linux-amd64
Run the installation script with your license key and the domain name for your AxoConsole deployment.
Note
Re-running the installer will reuse any existing or modified manifests or user settings (for example, authentication settings added to /var/lib/rancher/k3s/server/manifests/axoflow-config.yaml) available on the host.
--disable-traefik: Disable the built-in Traefik ingress controller of k3s. Use this option when using a custom ingress controller.
Advanced flags:
--skip-images: Skip container image import entirely. Use when images are already loaded into k3s.
--image-mode bundle|component|skip: Control how container images are imported. bundle (default) imports pre-packaged image tarballs; component imports one image per component; skip skips import.
--prepare-env: Install k3s, cert-manager, and Traefik only — skip AxoConsole itself. Use for a two-phase install where you want to configure the environment before deploying AxoConsole.
If needed, follow the on-screen instructions. For a test installation, you can usually use the default values. For recommendations for a production environment, contact our support team.
The script prompts to display the password of the default admin user. Record it, you’ll need it to log in to AxoConsole.
...
[2026-06-02 20:44:28][INFO ] All pods in axoflow are ready/complete
[2026-06-02 20:44:28][INFO ] Axoflow is healthy
[2026-06-02 20:44:28][INFO ] Access the UI at: https://<axoconsole-domain-name>
Show admin credentials? [y/N]: y
Username: admin
Password: MzGIjuWKjXOtiRs4
If needed, later you can retrieve the password by running:
Note
When using AxoRouter with an on-premises AxoConsole deployment, you have to prepare the hosts before deploying AxoRouter. These steps are specific to on-premises AxoConsole deployments, and are not needed when using the SaaS AxoConsole.
Login to AxoConsole
If the domain name of AxoConsole cannot be resolved from your desktop, add it to the /etc/hosts file in the following format. Use and IP address of AxoConsole that can be accessed from your desktop.
Open the https://<your-host.your-domain> URL in your browser.
The on-premise deployment of AxoConsole shows a self-signed certificate. If your browser complains about the related risks, accept it.
Use the email address and password you got or set in the installation step to log in to AxoConsole.
Prepare AxoRouter hosts
Note
When using AxoRouter with an on-premises AxoConsole deployment, you have to prepare the hosts before deploying AxoRouter. These steps are specific to on-premises AxoConsole deployments, and are not needed when using the SaaS AxoConsole.
AxoConsole service reference
Service Name
Namespace
Purposes
Function
KCP
axoflow
Backend API
Kubernetes Like Service with built in database, that service manage all the settings that our system manage
Chalco
axoflow
Frontend API
Serve the UI API Calls, implement business logic for the UI
Controller-Manager
axoflow
Backend Service
Reacts to state changes in our business entities, manage business logic for the Backend
Telemetry Proxy
axoflow
Backend API
Receives agents telemetries
UI
axoflow
Dashboard
The frontend for AxoConsole
Prometheus
axoflow
Backend API /Service
Monitoring component to store time series information and an API for query, manage alert rules
Alertmanager
axoflow
Backend API /Service
Monitoring component to send alerts based on alerting rules (optional, disabled by default)
Axoflow IDP
axoflow
Identity Connector/Proxy
Identity Connector/Proxy to allow the customer to use own identity (Google, LDAP, etc.)
Axolet Dist
axoflow
Backend API
Static artifact store to contains agents binaries
Cert Manager (kcp)
axoflow
Automated Certificate management tool
Manage certificates for Agents
Cert Manager
cert-manager
Automated Certificate management tool
Manage certificates for Axoflow components (Backend API, HTTP Proxy)
Traefik Ingress Controller
kube-system
HTTP Proxy
Route the HTTP traffic between multiple Frontend/Backend APIs
Troubleshooting
If you get the [ERROR] Timed out waiting for k3s node to be Ready error message, increase the timeout limit by running K3S_TIMEOUT=180, then rerun the installation script.
In case of other errors, run the following command to create a debug package from the cluster, and contact our support team.
If you want to uninstall every component installed by the axoflow-install.sh, including any custom configuration changes you made, run the following commands.
CAUTION:
Hazard of data loss
The following commands remove the k3s Kubernetes distribution as well. If you’re using k3s to run other software apart from AxoConsole, don’t run these commands.
k3s-uninstall.sh; rm-rf /var/lib/rancher
15.3 - Kubernetes
16 - Access management
Axoflow users can have different levels of access to AxoConsole based on their roles.
Authorization can be based on group memberships, email domains, and individual email addresses.
Roles
The following roles are available in AxoConsole by default:
IAM-admin: Can manage the roles and permissions to access AxoConsole. Only this role can make changes on the Settings > Roles page.
admin: Has full access to AxoConsole, but has only read access to the Settings > Roles page.
infrastructure-manager: Can manage the infrastructure (without the permissions to view or tap log contents, or to rehydrate data). Has full access to the following pages: Activity Logs, Alerting, Routers, Sources, Flows, Provisioning, Search Logs. Can tap into service logs which may contain event payload.
infrastructure-viewer: Similar to infrastructure-manager, but can only view the pages.
content-manager: Can view log content and manage content related details like flows (without the permissions to manage infrastructure, but including access to view infrastructure details).
Has full access to the Rehydration page.
Can view and modify Flows, but can’t create or delete them.
Can view Routers, Sources, Search Logs, Analytics.
Can tap into logs.
content-viewer: Can view content like analytics, log search, log tapping (without the permissions to manage or view infrastructure details).
To add new members to a role, complete the following steps. Note that you need IAM-admin privileges to manage the roles.
Navigate to Settings > Roles.
Add an item to the related role. You can add:
A specific email address, for example, email:username@example.com
Note
The user must be able to authenticate to AxoConsole using this email address, so authentication must be properly set up.
Multiple identity providers may allow authentication with the same email address, possibly with different level of ownership validation.
An entire email domain, for example, emaildomain:example.com. Any user who authenticates with an email address belonging to this email domain will have access to the role.
A user group. The format of the group depends on the OID provider.
If you’re using AxoConsole as a SaaS, specify the group in the following format: cognito:groups:<groupname-retrieved-from-cognito>, for example, cognito:groups:ExampleGoogleSaml:Operator.
If you’re using an on-prem AxoConsole deployment, specify the group in the following format: groups:<groupname-retrieved-from-dex> for example, groups:operator.
A specific session of an authenticated user, in the following format: user:<oidc-response-subject>, for example: user:42c4e962-f077-705f-138f-f01ba1220c44.
Every authenticated user: axoflow:user
Note that there can be fixed groups or items (labeled as Additional system members) that you cannot remove. These were added as part of the integration on the request of your organization or during initial configuration in case of on-premises deployments.
17 - Axoflow reference
This describes the command-line tools and API reference of the Axoflow Platform.
17.1 - AQL operator reference
AQL Query search supports the following comparison operators.
Case insensitive:
Equals (=): the whole value equals to the pattern
Not equals (!=): the value isn’t exactly equal to the whole pattern
Contains (=*): the value contains the given pattern
Doesn’t contain (!*): the value doesn’t contain the given pattern
Matches (=~): the pattern as a regular expression matches the value
Doesn’t match (!~): the case-insensitive regular expression doesn’t match
The comparison operators have their corresponding case sensitive (strict) versions:
Equals (==)
Not equals (!==)
Contains (==*)
Doesn’t contain (!=*)
Matches: (==~)
Doesn’t match (!=~)
The syntax of the regular expressions accepted is the same general syntax used by Perl, Python, and other languages. The regular expressions are evaluated in case-insensitive mode in case of the =~ and !~ operators. The patterns are not anchored to the whole string, but you can use ^ at the beginning of the pattern and $ at its end to match the whole value.
You can create complex queries using the AND and OR logic operators and parentheses, for example, ( host_name =* azure AND host_label_team = network ) OR ( host_name =* app AND host_label_app =* windows )
Escaping rules
Enclose the field names and values in single-quotes ('), double-quotes ("), or \` if it contains characters not on this list: @, a-z, 0-9, ._-
If all three quote types occur, enclose with single-quotes and escape single-quotes as \\'.
You can escape backslashes as \\\\.
17.2 - Manual pages
17.2.1 - axorouter-ctl
Name
axorouter-ctl — Utility to control and troubleshoot AxoRouter
Synopsis
axorouter-ctl [command] [options]
Description
The axorouter-ctl application is a utility that is needed mainly for troubleshooting. For example, it can be used to:
Usage: axorouter-ctl control syslog <command> <options>
This command allows you to access and control the syslog container of AxoRouter. Essentially, it’s a wrapper for the syslog-ng-ctl command of AxoSyslog. Usually, you don’t have to use this command unless our support team instructs you to.
For example:
Enable debug messages for troubleshooting: axorouter-ctl control syslog log-level verbose
Display the current configuration: axorouter-ctl control syslog config --preprocessed
Reload the configuration: axorouter-ctl control syslog reload
Displays the logs of the target container: syslog, store, resolver or wec. WEC logs are available only if the AxoRouter host has a ;Windows Event Collector (WEC) connector configured.
The axorouter-ctl logs command is a wrapper for the journalctl command, so you can add regular journalctl options to the command. For example, -n 50 to show the 50 most recent lines: axorouter-ctl logs syslog -n 50
Prune images
Usage: axorouter-ctl prune
Removes all unused images from the local store, similarly to podman-image-prune.
Pull images
Usage: axorouter-ctl pull
Download images needed for AxoRouter. This is usually not needed unless you have a custom environment, for example, proxy settings or pull credentials that aren’t available when the AxoRouter container is run.
Manage the axorouter-resolver service
Usage: axorouter-ctl resolver <command>
Manages the axorouter-resolver service. Use the clear-cache command to delete the cache of the service.
Shell access to AxoRouter
Usage: axorouter-ctl shell wec
Open a shell into the target container (syslog, store, resolver, or wec). Usually needed only for troubleshooting purposes, when requested by our support team.
Display the statistics and metrics of the syslog container in Prometheus or legacy format, from the underlying AxoSyslog process. For details, see the AxoSyslog documentation.
Access AxoStore database
Usage: axorouter-ctl store
CAUTION:
Access the database directly only when instructed by the support team, or if you know exactly what you’re doing.
Start an interactive SQL session using the command-line Clickhouse client to access data stored in AxoStore. Type exit to end the session.
Version
Usage: axorouter-ctl version
Show the version numbers of the underlying AxoSyslog build, for example:
Deletes every corrupted and abandoned disk buffer files. Usually, you don’t have to use this command unless our support team instructs you to.
For disk buffer files containing messages, a backup copy is created into the /root/diskqueue_backup directory. To use a different directory for backups, set the BACKUP_DIR environment variable. This behavior can be overridden by the -a option, which deletes such files without making a backup. Empty disk buffer files are always deleted.
17.3 - Message schema
17.3.1 - Overview
When processing incoming data, AxoRouter automatically converts everything to its internal message model, and maps the contents of the model to the specific destinations as needed. The internal message model of AxoRouter is based on the OpenTelemetry Log Data Model, so what is sent to the destination is determined by the log section of the model (the main payload is log.body).
The meta section contains all the information and metadata AxoRouter has about the message: what was its source, how it was received, where it will be forwarded, how was it classified, and so on. You can use these metadata for example:
When AxoRouter sends the message to its destination, parts of these metadata is automatically mapped into the relevant log field, but most of it (for example, labels) isn’t send to the destination by default.
For most destinations, there are specific fields that allow you to configure specific values that are sent to the destination, or to override the log.body field completely.
The message model has the following main elements:
log: The log data structure describes the log record.
meta: Metadata about a specific message record, for example, a log message.
resource: The resource data structure describes the resource that generated the log record.
scope: The scope data structure describes the Log Scope.
Time when the event was observed by the data pipeline, in UNIX Epoch time (nanoseconds elapsed since 00:00:00 UTC on 1 January 1970). A value of 0 indicates unknown or missing timestamp.
For events that originate in OpenTelemetry, this timestamp is typically set at the generation time and is equal to time_unix_nano.
For events originating externally and collected by an Axoflow agent or an AxoRouter, this is the time when the Axoflow pipeline observed the event. type: datetime
The severity as a string (log level). The original string representation as described at the source. For the numerical to string mapping, see log.severity_number.
The time when the event occurred in UNIX Epoch time (nanoseconds elapsed since 00:00:00 UTC on 1 January 1970). A value of 0 indicates unknown or missing timestamp.
The source field sent to Splunk, containing where the event originated. For example, the protocol and port for network-based sources, or the path and filename for log files.
The name of the connector that received the log. The name of the connector instance follows the <name-of-AxoRouter>-<name-of-connector-rule>-<suffix> schema. For details, see Connector rules.
The source field sent to Splunk, containing where the event originated. For example, the protocol and port for network-based sources, or the path and filename for log files.
The source field received from Splunk, containing where the event originated. For example, the protocol and port for network-based sources, or the path and filename for log files.
The labels set in the inventory for the host the message originates from. Note that if the host is sending data to an AxoRouter connector that doesn’t perform automatic classification, then changing the product and vendor labels can affect the final metadata in the destination, for example, the sourcetype assigned to the data in Splunk.
The name of the connector that received the log. The name of the connector instance follows the <name-of-AxoRouter>-<name-of-connector-rule>-<suffix> schema. For details, see Connector rules.
The source field sent to Splunk, containing where the event originated. For example, the protocol and port for network-based sources, or the path and filename for log files.
The labels set in the inventory for the host the message originates from. Note that if the host is sending data to an AxoRouter connector that doesn’t perform automatic classification, then changing the product and vendor labels can affect the final metadata in the destination, for example, the sourcetype assigned to the data in Splunk.
The body of the log record, which can contain strings and structured data composed of arrays and maps of other values.
observed_time
Time when the event was observed by the data pipeline, in UNIX Epoch time (nanoseconds elapsed since 00:00:00 UTC on 1 January 1970). A value of 0 indicates unknown or missing timestamp.
For events that originate in OpenTelemetry, this timestamp is typically set at the generation time and is equal to time_unix_nano.
For events originating externally and collected by an Axoflow agent or an AxoRouter, this is the time when the Axoflow pipeline observed the event. type: datetime
The severity as a string (log level). The original string representation as described at the source. For the numerical to string mapping, see log.severity_number.
The time when the event occurred in UNIX Epoch time (nanoseconds elapsed since 00:00:00 UTC on 1 January 1970). A value of 0 indicates unknown or missing timestamp.
The labels set in the inventory for the host the message originates from. Note that if the host is sending data to an AxoRouter connector that doesn’t perform automatic classification, then changing the product and vendor labels can affect the final metadata in the destination, for example, the sourcetype assigned to the data in Splunk.
Copyright of Axoflow Inc. All rights reserved.
The Axoflow, AxoRouter, AxoLake, Axoflow Locker, AxoStore, and AxoSyslog trademarks and logos are trademarks of Axoflow Inc.
syslog-ng™ is a trademark of One Identity LLC.
All other trademarks are property of their respective owners.
For a list of 3rd-party components and their associated copyright and license information, see the About page in AxoConsole.
19 - Integrations
1Password
Source
1Password
Manages and secures user credentials, secrets, and vaults for individuals and organizations.
A10 Networks
Source
A10 Networks vThunder
Delivers application load balancing, traffic management, and DDoS protection for enterprise networks.
Amazon
Source
Amazon AWS CloudTrail
Tracks AWS account activity and API usage for auditing, governance, and compliance monitoring.
Source
Amazon AWS CloudWatch
Monitors AWS resources and applications by collecting metrics, logs, and setting alarms.
Destination
Amazon AWS S3
Scalable cloud storage service for storing and retrieving any amount of data via object storage.
Destination
Amazon AWS Security Lake
Centralizes and normalizes security data from AWS and third-party sources for analytics and compliance.
Axoflow
Axoflow AxoRouter
Manages and routes event flow through pipelines, including filtering, parsing, and transformations.
Axoflow AxoStore
AxoStore is a lightweight, queryable, temporary storage option that stores data locally on the AxoRouter host. AxoConsole provides federated search for AxoStore.
Axoflow AxoSyslog
High-performance, configurable syslog service for collecting, processing, and forwarding log data.
Axoflow Telemetry Controller
Telemetry Controller collects, routes and forwards telemetry data (logs, metrics and traces) from Kubernetes clusters supporting multi-tenancy out of the box.
Box, Inc.
Source
Box, Inc. Box
Cloud-based content management and file sharing platform designed for secure collaboration and storage.
Broadcom
Source
Broadcom Edge Secure Web Gateway (Edge SWG)
Secures web traffic through policy enforcement, SSL inspection, and real-time threat protection.
Source
Broadcom Email Security
Broadcom Email Security is an enterprise-grade, high-accuracy email filtering solution designed to detect and block spam, phishing, and malware.
Source
Broadcom ESX
The primary function of ESX is to partition a physical server into multiple virtual machines (VMs), allowing different operating systems to run simultaneously and improving hardware utilization.
Source
Broadcom NSX
Provides network virtualization, micro-segmentation, and security for software-defined data centers.
Source
Broadcom SSL Visibility Appliance
Broadcom's SSL Visibility (SSLV) Appliance is a dedicated network security device that decrypts, inspects, and re-encrypts SSL/TLS traffic to expose threats hidden within encrypted communications.
Source
Broadcom vCenter
vCenter is a centralized management platform that provides a single console for managing an entire VMware vSphere virtual infrastructure, including multiple ESXi hosts and virtual machines.
Check Point Software
Source
Check Point Software Anti-Bot
Detects and blocks botnet communications and command-and-control traffic to prevent malware infections.
Source
Check Point Software Anti-Malware
Protects endpoints from viruses, ransomware, and other malware using signature and behavior analysis.
Source
Check Point Software Anti-Phishing
Prevents phishing attacks by analyzing email content and links to block credential theft attempts.
Source
Check Point Software Anti-Spam and Email Security
Blocks spam and malicious email content using reputation checks and email filtering techniques.
Cisco TelePresence Video Communication Server (VCS)
Enables video conferencing control and call routing for Cisco TelePresence systems and endpoints.
Source
Cisco Unified Communications Manager (UCM)
Delivers unified voice, video, messaging, and mobility services in enterprise IP telephony systems.
Source
Cisco HyperFlex (HX, UCSH)
Infrastructure solution combining compute, storage, and networking in a single system.
Source
Cisco Unified Computing System Manager (UCSM)
Centralized management platform for Cisco Unified Computing System (UCS) servers and resources.
Source
Cisco Viptela
Software-defined WAN solution providing secure connectivity, centralized control, and traffic optimization.
Source
Cisco IOS XR
High-performance, modular network operating system for carrier-grade routing and scalability.
Citrix
Source
Citrix NetScaler
Offers application delivery, load balancing, and security features for optimized app performance.
ClickHouse
Destination
ClickHouse
Columnar database optimized for real-time analytics on large datasets with high performance and scalability.
Coda
Source
Coda
All-in-one collaborative document platform combining text, spreadsheets, and integrations into a single workspace.
Confluent
Destination
Confluent
Corelight
Source
Corelight NDR Platform
Provides network detection and response by analyzing traffic for advanced threats and anomalous behavior.
CrowdStrike
Destination
CrowdStrike Falcon LogScale
Cloud-native platform for endpoint detection, threat hunting, and security analytics at scale.
Source
CrowdStrike Falcon Platform
CrowdStrike Falcon is a cloud-native, AI-powered cybersecurity platform designed to stop breaches by protecting endpoints, cloud workloads, identity, and data.
CyberArk
Source
CyberArk Privileged Threat Analytics (PTA)
Analyzes privileged account behavior to detect threats and suspicious activity in real time.
Source
CyberArk Vault
Stores and manages privileged credentials, session recordings, and access control policies securely.
Databricks
Destination
Databricks
Unified analytics platform for data engineering, machine learning, and collaborative data science workflows.
Datadog
Destination
Datadog
Observability platform that provides monitoring for infrastructure, applications, logs, and security events.
DELL
Source
DELL SonicWall
Delivers firewall, VPN, and deep packet inspection to protect networks from cyber threats and intrusions.
Dynatrace
Destination
Dynatrace
Unified Observability — Drive business transformation with contextual analytics, AI, and automation.
Elastic
Destination
Elasticsearch
Distributed search and analytics engine for real-time log analysis, observability, and data indexing.
F5 Networks
Source
F5 Networks BIG-IP
Provides load balancing, traffic management, and application security for optimized service delivery.
Forcepoint
Source
Forcepoint Email Security
Protects email systems from spam, phishing, malware, and data exfiltration using advanced threat defense.
Source
Forcepoint NGFW
Next-gen firewall with deep packet inspection, policy enforcement, and integrated intrusion prevention.
Source
Forcepoint Web Security
Provides web traffic filtering, malware protection, and data loss prevention for secure internet access.
Fortinet
Source
Fortinet FortiGate
Enterprise firewall platform offering threat protection, VPN, and traffic filtering for secure networking.
Source
Fortinet FortiMail
Secures inbound and outbound email with spam filtering, malware protection, and advanced threat detection.
Source
Fortinet FortiProxy
Protects from internet threats like malware, phishing, and data loss by inspecting web traffic, filtering content, controlling applications, and enforcing security policies
Source
Fortinet FortiWeb
Web application firewall protecting websites from attacks like XSS, SQL injection, and bot threats.
Fortra
Source
Fortra Powertech SIEM Agent for IBM i
Monitors IBM i system activity and forwards security events for centralized analysis in SIEM platforms.
Generic
Destination
Generic /dev/null
Blackhole destination for testing or discarding events without storing them.
Source, Destination
Generic Syslog
Standard protocol for system logs. Our source automatically detects, parses, and classifies incoming syslog events without pre-configuration.
Source
Generic Webhook
Receives data via HTTP POST requests for flexible event-driven integration.
Google
Source
Google Workspace Admin
Captures administrative events and configuration changes across the Google Workspace environment.
Source
Google Workspace Alert
Generates security and compliance alerts for suspicious user activity within Google Workspace services.
Destination
Google Pub/Sub
Asynchronous messaging service for ingesting and distributing event data between services and applications.
Destination
Google SecOps
A cloud service designed for enterprises to privately retain, analyze, and search the massive amounts of security and network telemetry they generate.
Grafana
Destination
Grafana Loki
Scalable log aggregation system optimized for storing and querying logs by labels using Grafana.
HAProxy
Source
HAProxy
High-performance TCP/HTTP load balancer and reverse proxy for increasing reliability and scalability.
Hewlett Packard Enterprise
Source
Hewlett Packard Enterprise Aruba Networks
Enterprise-grade networking gear for wireless, wired, and security management across distributed networks.
Imperva
Source
Imperva Incapsula
Cloud-based WAF, DDoS protection, and bot mitigation service for securing web applications and APIs.
Source
Imperva SecureSphere
Provides on-prem web application, database, and file security with granular activity monitoring.
Infoblox
Source
Infoblox NIOS
Delivers secure DNS, DHCP, and IPAM (DDI) services with centralized network control and automation.
Ivanti
Source
Ivanti Connect Secure
Provides dynamic IP address assignment and network configuration for DHCP-enabled devices.
Juniper Networks
Source
Juniper Networks Junos OS
Junos OS is the network operating system for Juniper physical and virtual networking and security products.
Kafka
Destination
Kafka Apache Kafka
Distributed event streaming platform used for building real-time data pipelines and stream processing.
Kaspersky
Source
Kaspersky Endpoint Security
Protects endpoints from malware, ransomware, and intrusions with antivirus, firewall, and threat detection.
Kubernetes
Source
Kubernetes Ingress NGINX Controller
Ingress NGINX Controller
Source
Kubernetes Telemetry Controller
Telemetry Controller
Microsoft
Destination
Microsoft Azure Blob Storage
Cloud-based object storage optimized for unstructured data like backups, logs, and media files.
Source
Microsoft Azure Event Hubs
Big data streaming platform to ingest and process events.
Destination
Microsoft Azure Monitor
Collects and analyzes telemetry from applications and infrastructure to monitor performance and usage.
Source
Microsoft Cloud App Security (MCAS)
Monitors cloud app usage, detects anomalies, and enforces security policies across SaaS services.
Source
Microsoft GitHub
Provides audit and event data for code repositories, development workflows, and security scans.
Source
Microsoft Office 365
Generates user activity and audit logs from Exchange, SharePoint, Teams, and other Office 365 services.
Destination
Microsoft Sentinel
Cloud-native SIEM and SOAR platform for collecting, analyzing, and responding to security threats.
Source
Microsoft Windows
Event logs from core services like security, system, DNS, and DHCP for operational and forensic analysis.
Source
Microsoft Windows Event Log
Collects Windows Event Log data via OpenTelemetry Collector for centralized log analysis and monitoring.
Source
Microsoft Windows Event Tracing
Collects Windows Event Tracing data via OpenTelemetry Collector for centralized log analysis and monitoring.
Source
Microsoft Windows Events
Collects Windows Event Log data via WEC for centralized log analysis and monitoring.
MikroTik
Source
MikroTik RouterOS
Router operating system providing firewall, bandwidth management, routing, and hotspot functionality.
NetFlow Logic
Source
NetFlow Logic Optimizer
Aggregates and transforms flow data (NetFlow, IPFIX) into actionable security and performance insights.
Netgate
Source
Netgate pfSense
Open-source firewall and router platform with VPN, traffic shaping, and intrusion detection capabilities.
Netmotion
Source
Netmotion
Provides secure, optimized remote access with performance monitoring for mobile and distributed workforces.
NETSCOUT
Source
NETSCOUT Arbor Edge Defense (AED)
Edge-based DDoS protection and threat mitigation system to block attacks before they enter the network.
Source
NETSCOUT Pravail (APS)
Monitors and mitigates advanced persistent threats and malware with inline packet inspection.
Generic UNIX/Linux host
Source
Generic UNIX/Linux host Generic Placeholder
A generic placeholder for program classifications
Okta
Source
Okta Auth0
Identity-as-a-Service platform offering authentication and authorization for apps and APIs.
Omnissa
Source
Omnissa Horizon
Horizon is a platform for managing and delivering virtual desktops and applications to end-users across a variety of devices and locations.
The measurement unit of the Maximum object size and Chunk size fields of the S3 destinations was incorrect and has been fixed. If you’re using the S3 destinations, check that your configuration is correct.
Store metrics
Store metrics are more detailed and include the total size of a store across AxoRouters.
AxoConsole updates
Sensitive values like passwords, secrets, and tokens of destinations aren’t visible on the UI, users can only replace them. Sensitive values aren’t displayed on the Activity Logs page.
Automatically detected sources can be registered in AxoConsole in bulk.
Code snippets in processing steps are automatically syntax-highlighted.
Performance improvements in UI autocomplete with very many available values.
Other changes
The Axolet and AxoRouter for Linux provisioning scripts can download the installation images directly from AxoConsole.
Axoflow agent disk queue metrics were referred to as memory queue metrics in their description. This has been fixed.
SaaS deployments are updated automatically. If you’re running an on-premises AxoConsole deployment, contact our support team for the detailed upgrade instructions.
Version 0.78 (2026-03-31)
Data rehydration
You can now resend selected data from AxoStores to other destinations. For details, see Rehydrate data.
RBAC configuration
You can now configure role-based access control for AxoConsole on the Settings > Roles page.
Source and destination improvements
In syslog connector rules, the Enable dynamic window option enables the dynamic sizing of memory queues by sharing the configured Log window size between active incoming connections dynamically, instead of allocating the same window size to each possible connection. Only available for TCP and TLS.
For HTTP-based destinations you can configure Response actions to specify what AxoRouter does with the log message, based on the response code received from the destination. For an example, see the Elastic destination.
Log tapping
The Tap agent logs option has been renamed to Tap service logs. If available, you can tap into the systemd logs of the related service. You can also filter the logs for specific services. For details, see Log tapping.
You can now tap into the service logs on Axoflow agent for Linux hosts. For details, see Tap service logs.
Store metrics
AxoConsole shows basic metrics of stores on the Routers > Stores page, with more details on the pages of the specific stores.
You can now configure how to store metadata and the raw message in AxoStore using the Include Metadata and Include Raw Body options. For details, see Create Store.
You can use the Filter bar on the Alerts page to search and filter for specific alerts.
A new global search field is introduced in the page header to navigate to pages of AxoConsole. It’s also available with the CTRL + K / ⌘ + K shortcuts.
The dynamic Splunk destinations no longer have the Default Source option. If classification or another processing step doesn’t set the source field, AxoRouter automatically sets it to the name of the AxoRouter connector that received the message.
Performance improvements
The amount of memory AxoRouter uses to store queued messages has been significantly reduced, by up to 50%.
When receiving UDP data with the syslog connector you can now enable eBPF loadbalancing to split the traffic from high-volume sources to multiple workers.
For OTLP source connectors, you can now configure the window parameters of flow-control (Initial window size and Log fetch limit).
The WEC Connector can work with multiple independent certificate authorities at the same time.
Microsoft Sentinel and Azure Monitor destinations
The Microsoft Sentinel and Azure Monitor destinations have a default batch size limit to respect the built-in request size limits of Microsoft Sentinel.
The Stream name is no longer a required parameter for Azure Monitor and Sentinel destinations.
Performance improvements
Performance improvements for the Google SecOps destination.
HTTP-based destinations now support content compressions to reduce bandwidth usage.
Performance improvements in disk queue management.
Performance improvements in source thread parallelization to leverage available CPU cores more effectively with a single source connection.
The defaults of batching related destination parameters have been reviewed.
New alerts are introduced to warn about sub-optimal performance parameters across the system.
Other changes
Agent logs now contain the output of the systemd units used to launch the containers.
The platform=linux or platform=windows label is added by default to AxoRouter and Axoflow agent instances to help setting up platform-specific rules.
The host page of Axoflow agent for Windows now contains improved analytics data.
Node metrics is now available for edge hosts as well.
Disk buffer configuration
You can set the size of disk buffers, or if needed, disable disk buffers on AxoRouter hosts in the configuration of each destination. For example, see the Google Pub/Sub destination.
Splunk source
When receiving data from Splunk Heavy Forwarders now we recommend using NUL-terminated messages.
The behavior of classification when receiving logs from Splunk HF using the Axoflow Forwarder Add-on has changed:
If classification is disabled, the original source, sourcetype, index, timestamp and host metadata are preserved.
If classification is enabled, then a successful classification overrides the sourcetype and the index, while the timestamp and host are overwritten if the original message contains these data.
Other
Almost 60% performance improvement in AxoRouter.
AxoSyslog has been updated to 4.21.0
Introducing autoscaling worker partitions to support special batching scenarios (e.g. Google SecOps).
Improved disk queue scalability to eliminate bottlenecks under high load.
Fixed an error that occurred when a destination (Dynatrace) applied normalization by default and the related flow also contained a Normalization processing step.
Version 0.69 (2025-12-03)
Storage solutions
You can now use Stores on AxoRouters to collect logs locally, with pre-configured retention time.
In addition to local Stores, you can also use External Stores. For details, see Storage.
Processing steps
The new Normalize processing step normalizes data according to the specified standard: Dynatrace, Elastic Common Schema (ECS), or Open Cybersecurity Schema Framework (OCSF).
If the primary IP address of AxoRouter is not accessible from your edge hosts, you can set a Network address override (IP address or an FQDN) that’s edge hosts can connect to.
Axolet builds for Windows Edge hosts are now signed.
When sending data to Dynatrace, you can now add extra fields to the message using the meta.destination.dynatrace.extra_fields field.
Version 0.66 (2025-10-30)
Edge Collection and Forwarding
Collection Rules and Forwarding Rules for Windows edge hosts now available on the Sources page.
Collection Rules create Connectors on a set of edge hosts based on a label selector.
Forwarding Rules create Flows from edge hosts to the OTLP connector of AxoRouter based on a label selector.
Windows edge hosts support data collection from Windows Event Logs, Event Tracing for Windows, and files. Event Tracing for Windows supports predefined profiles (DNS full trace and DNS query) for ease of use, and a custom profile with fine tuning options.
Menu structure and page headers
The headers and main controls have been aligned across pages. Also, the structure of the AxoConsole menu has been changed, and menu items have been reordered and grouped into sections:
The first section focuses on your data: Dashboard, Analytics, Flows
The Infrastructure section gives access to the following pages:
Topology page provides a graphical overview about the infrastructure
Sources page (new):
Where the Inventory tab lists Edges and Appliances by default
The new Collection and Forwarding rules configuration tabs allow setting up log forwarding from Edge hosts
Routers page (new):
With the Inventory of Routers, and
The Connector Rules tab allows setting up connectors.
Destinations (new) lists all destinations available which were previously only accessible from the Topology page
Provisioning page:
Provides platform specific commands to provision Edges and Routers
Lists hosts by registration state
The System section lists active Alerts in the system and the history of user Activities.
AxoConsole performance
Improved dashboard response time by using pre-recorded metrics
Improved analytics response times by parallelizing queries
Better error reporting about invalid requests on the UI
Miscellaneous
You can now create a new destination in place when creating flows