This is the multi-page printable view of this section. Click here to print.
Manage and monitor the pipeline
- 1: Dashboard
- 2: Topology
- 3: Hosts
- 3.1: Find a host
- 3.2: Host information
- 3.3: Custom labels and metadata
- 3.4: Bulk update hosts
- 3.5: Services
- 4: Log tapping
- 5: Alerts
- 5.1: Alerts reference
- 6: Private connections
1 - Dashboard
The Dashboard page gives you an overview of your pipeline, and links to relevant pages of pipeline elements. All data is automatically updated every 10 seconds.
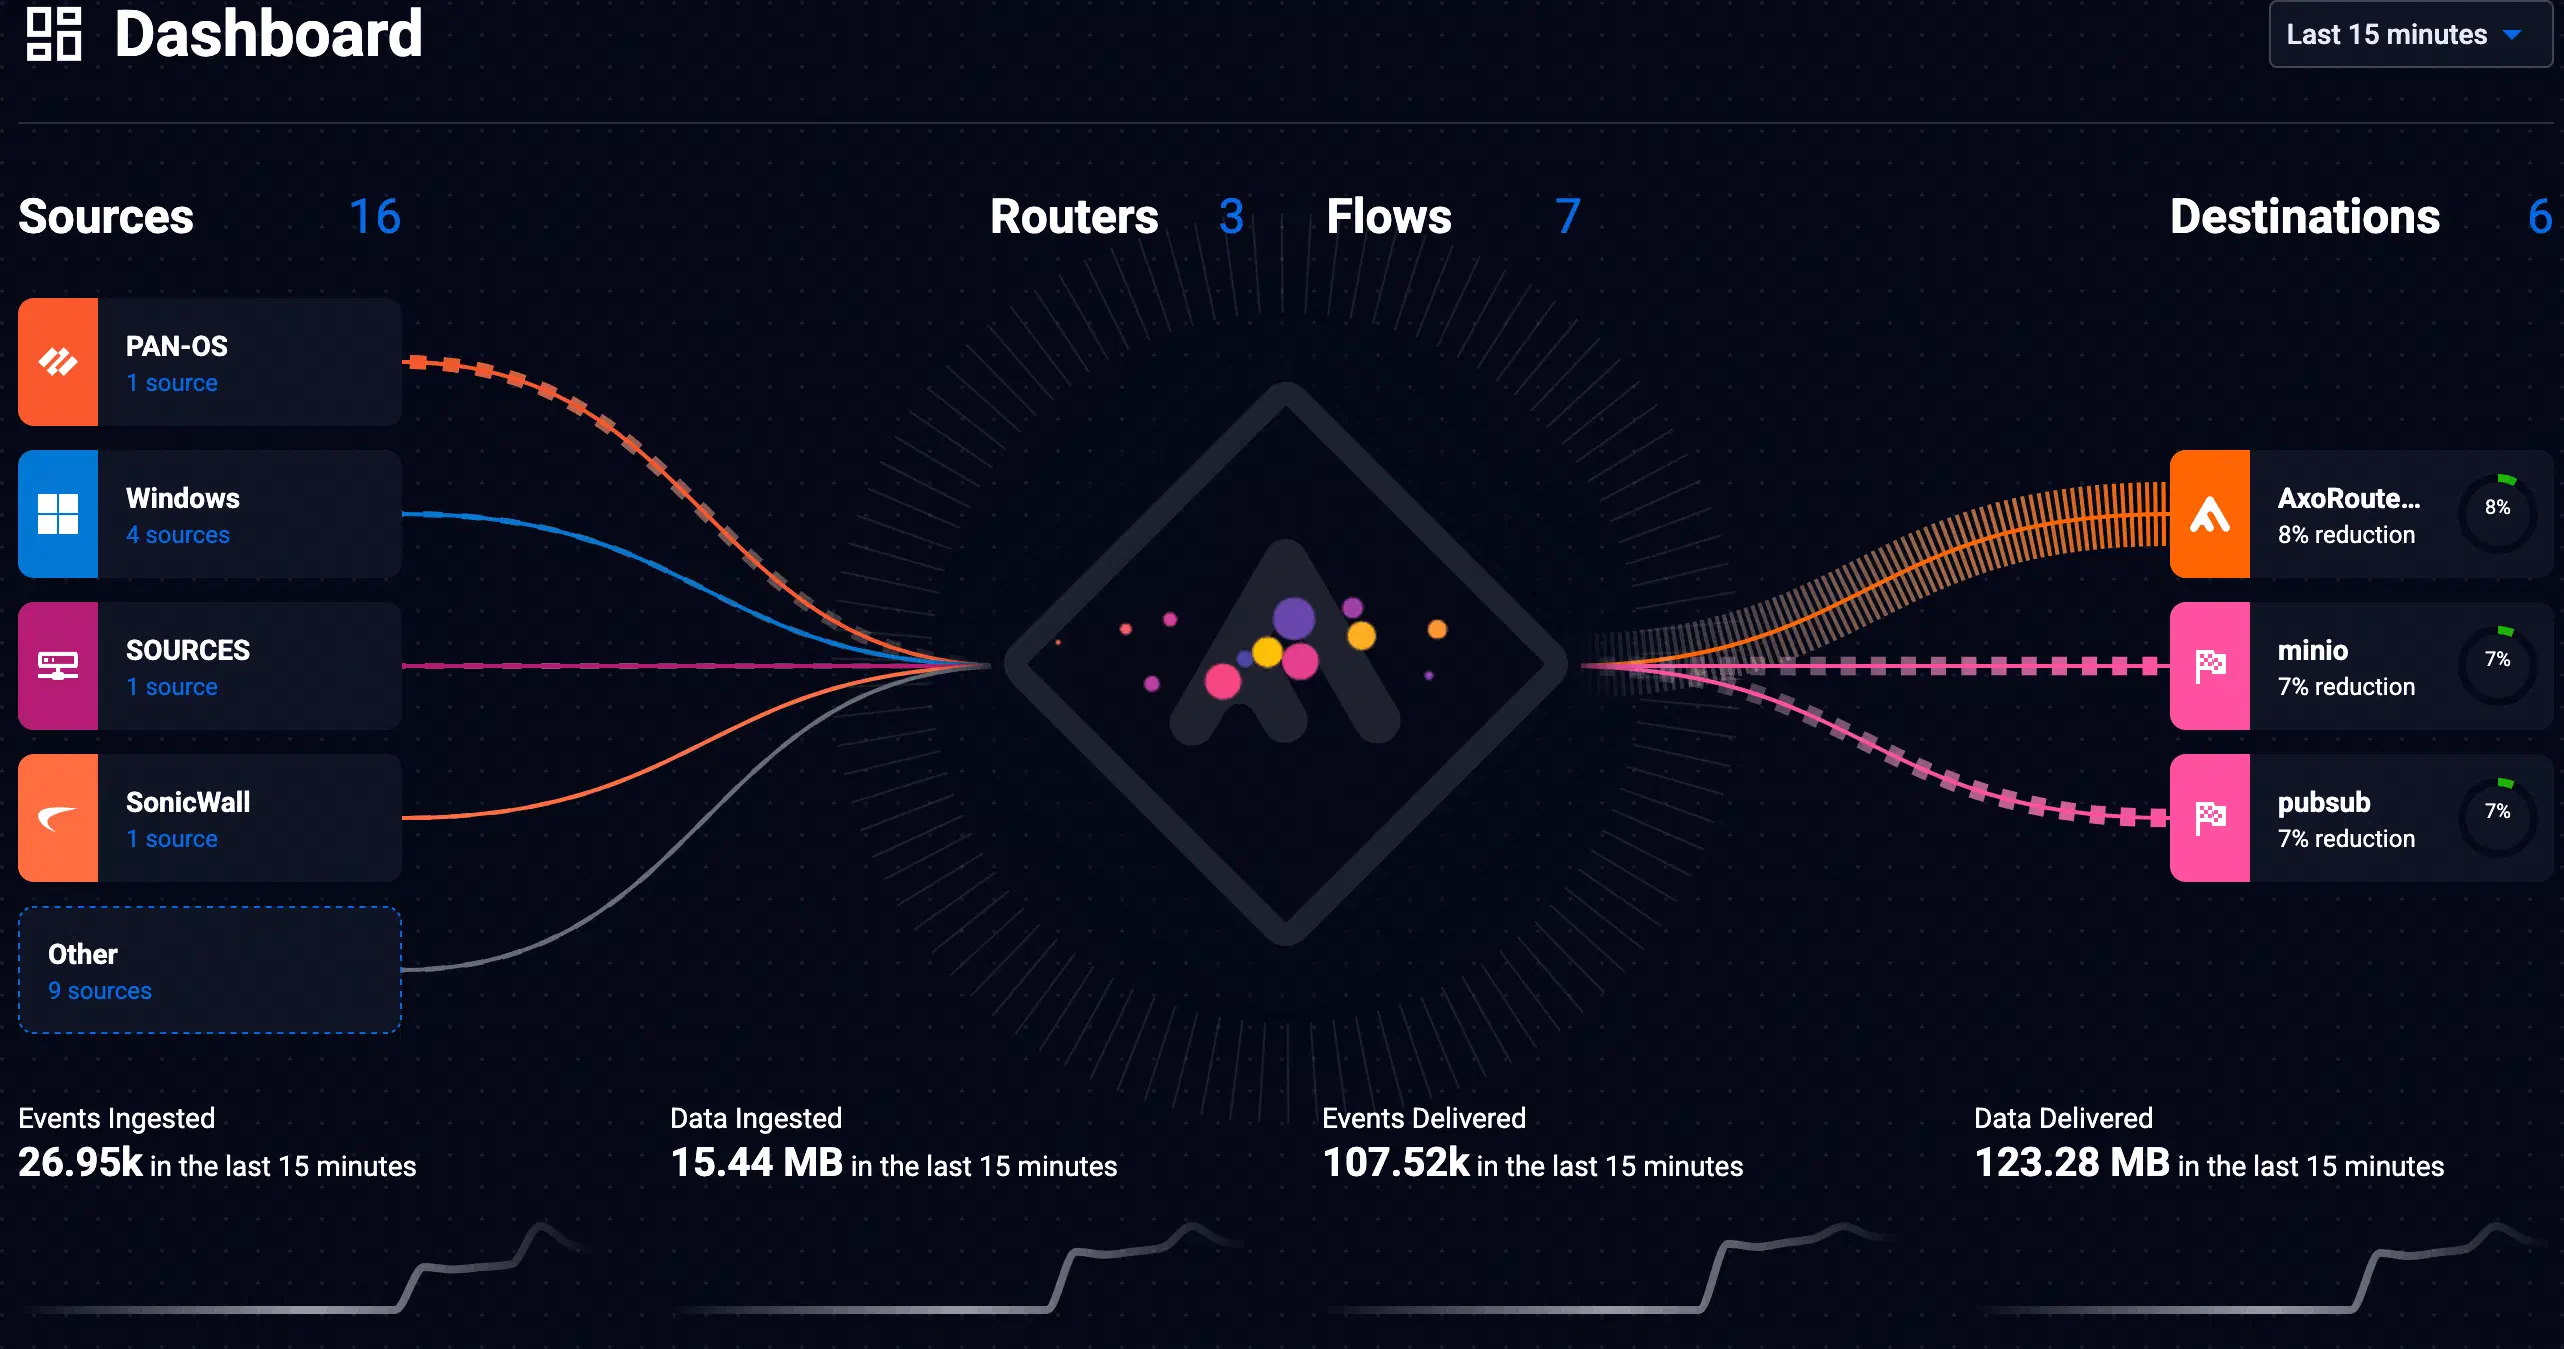
The top row shows the number of Sources, Routers, Flows, and Destinations.

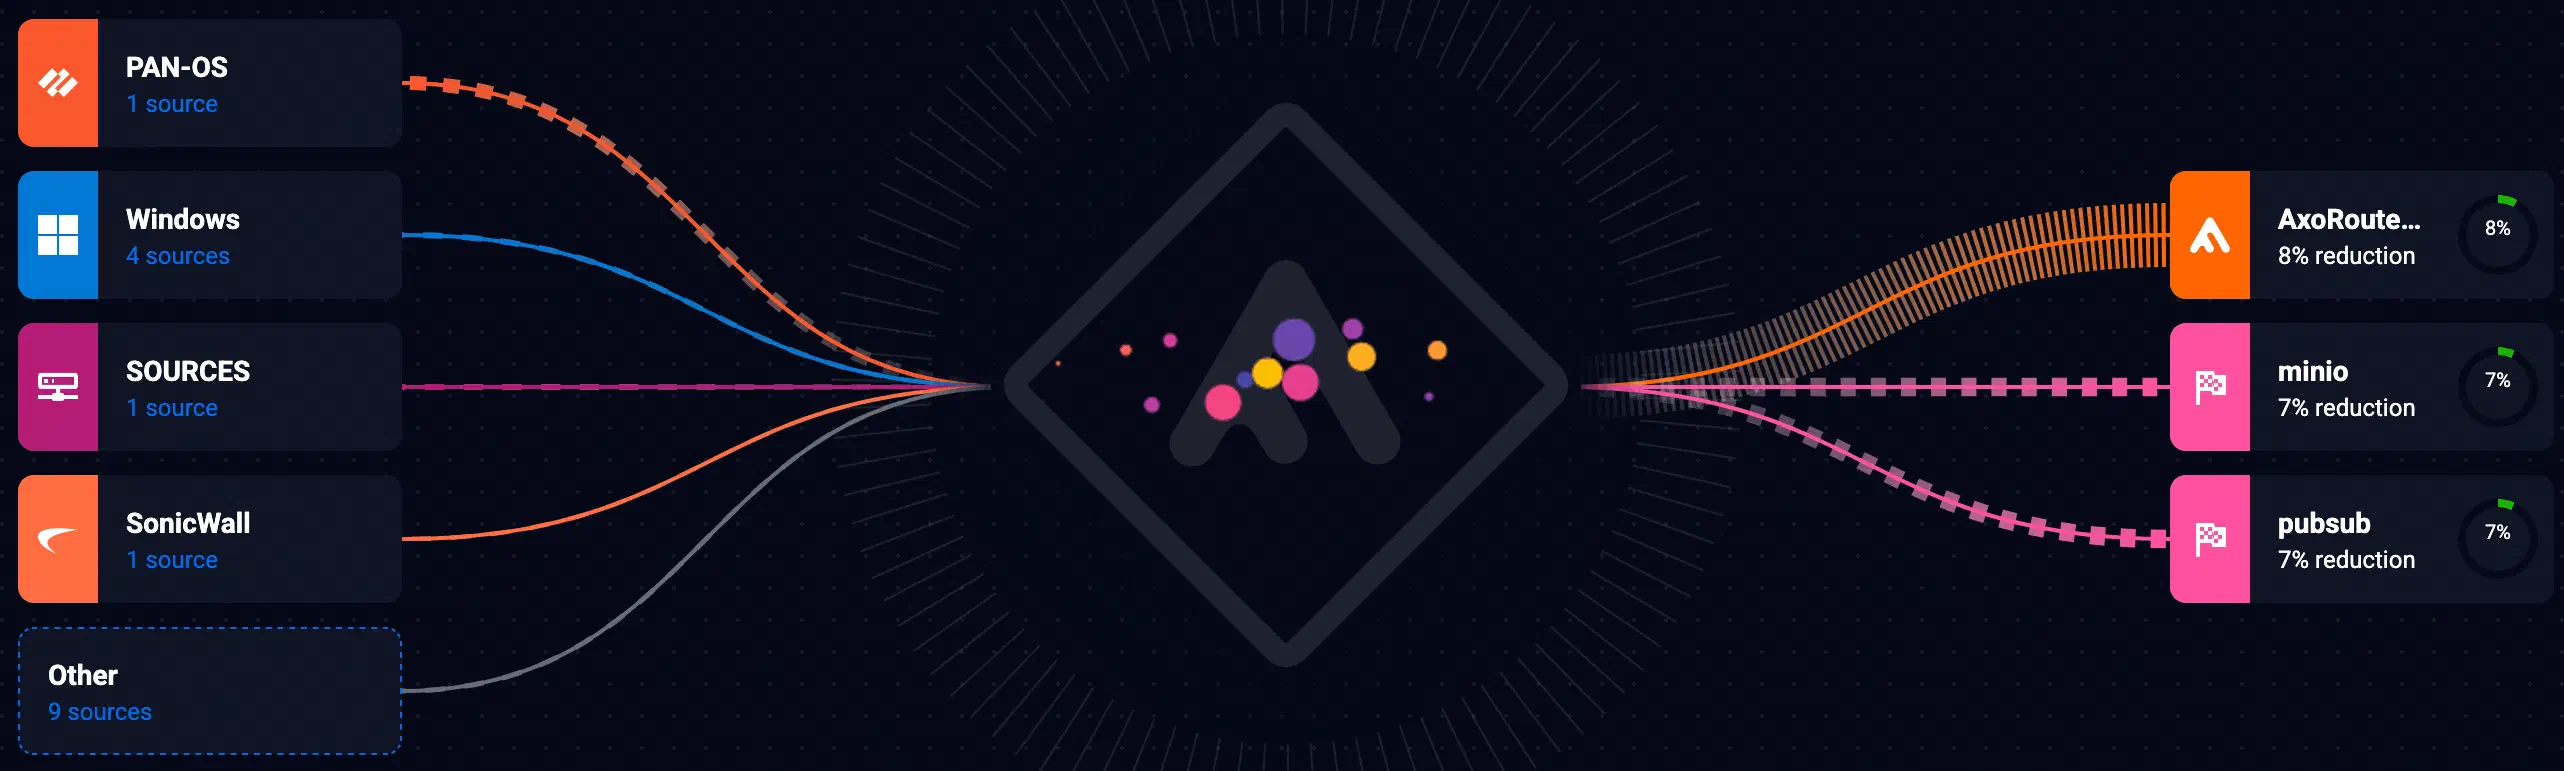
The animated section shows a simplified version of the Topology page.
-
The source side shows the most active source groups.
-
The destination side shows the three most active destinations and the data reduction achieved.
Data reduction is calculated as follows:
- The input is the total data of every flow that sends data to the destination, measured either: before classification and parsing, or at the Probe processing step called
filteredif it exists in the flow. - The reduced data is the total amount of data (in bytes) sent to the destination.
- The data reduction is the ratio of the reduced data and the input.
- The input is the total data of every flow that sends data to the destination, measured either: before classification and parsing, or at the Probe processing step called
The metrics bar shows the number of events and amount of data ingested from the sources and delivered to the destinations during the selected time frame. (You can change the time frame in the top-right of the page.) Note that the small charts under the metrics show the historic value of the related metric for a longer period, not the just within the selected time frame, so the current numbers correspond to the endpoint of the chart.

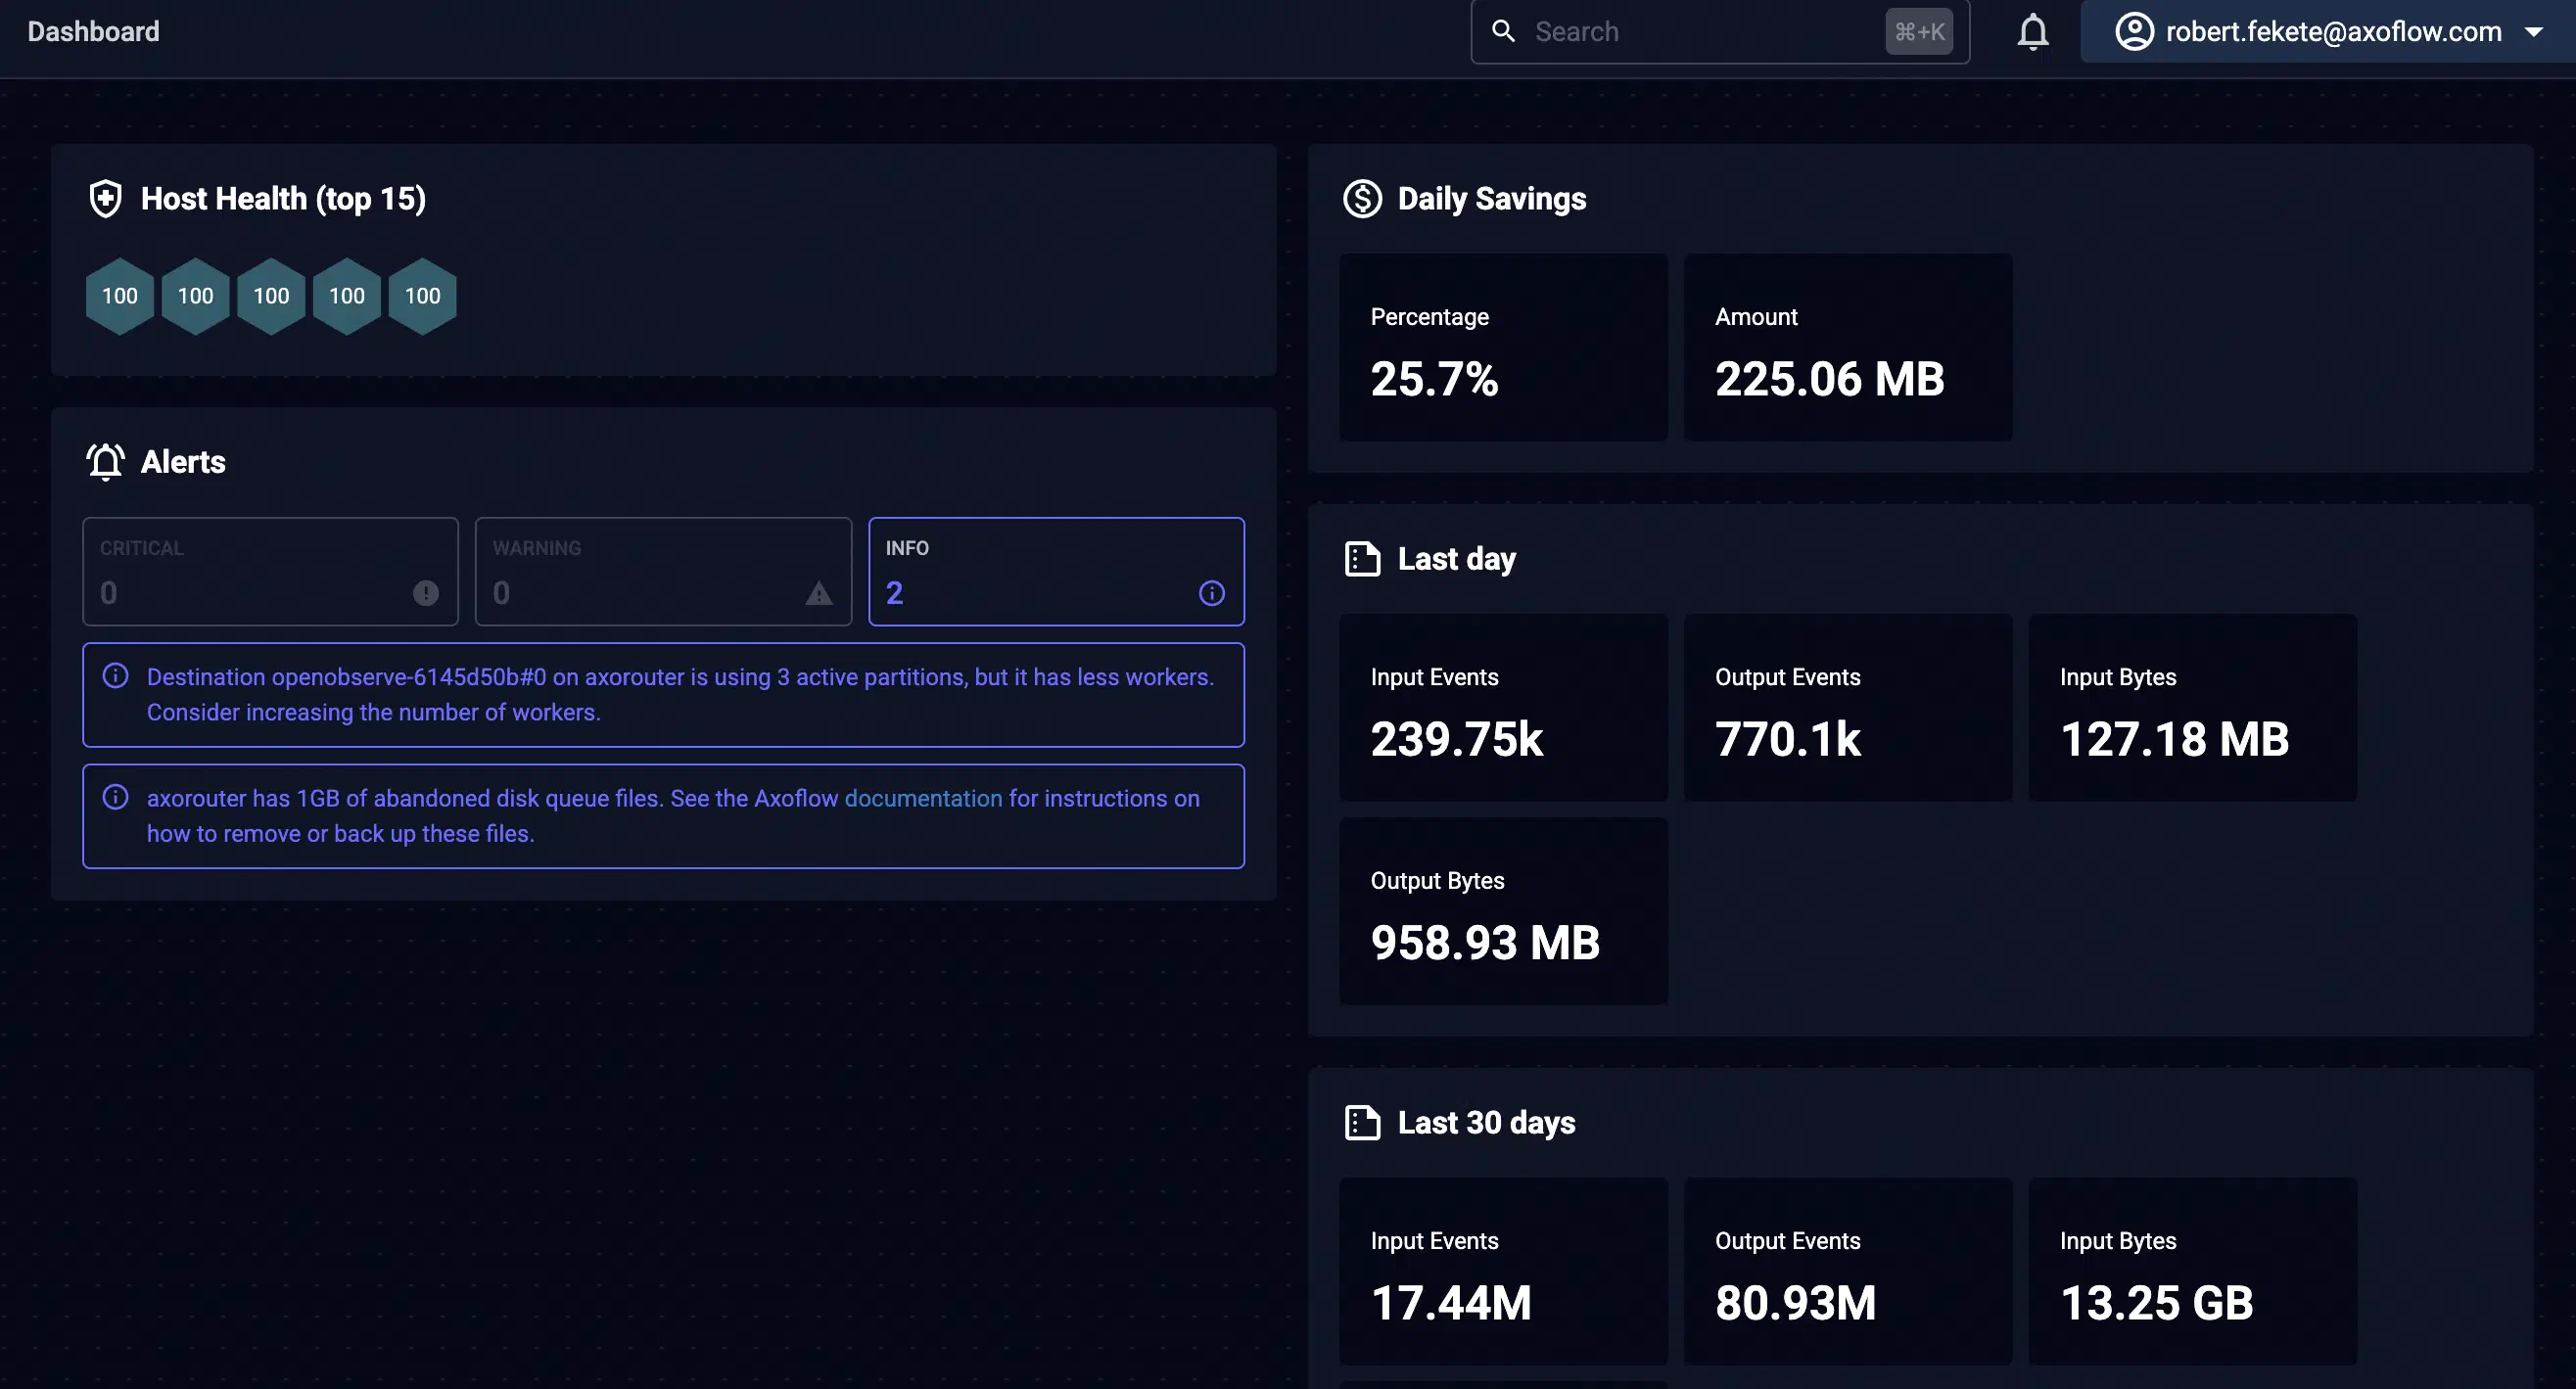
Further down, the dashboard shows the active alerts (if any), and metrics for the last day and the last 30 days.
2 - Topology
Based on the collected metrics, Axoflow visualizes the topology of your security data pipeline. The topology allows you to get a semi-real-time view of how your edge-to-edge data flows, and drill down to the details and metrics of your pipeline elements to quickly find data transport issues.
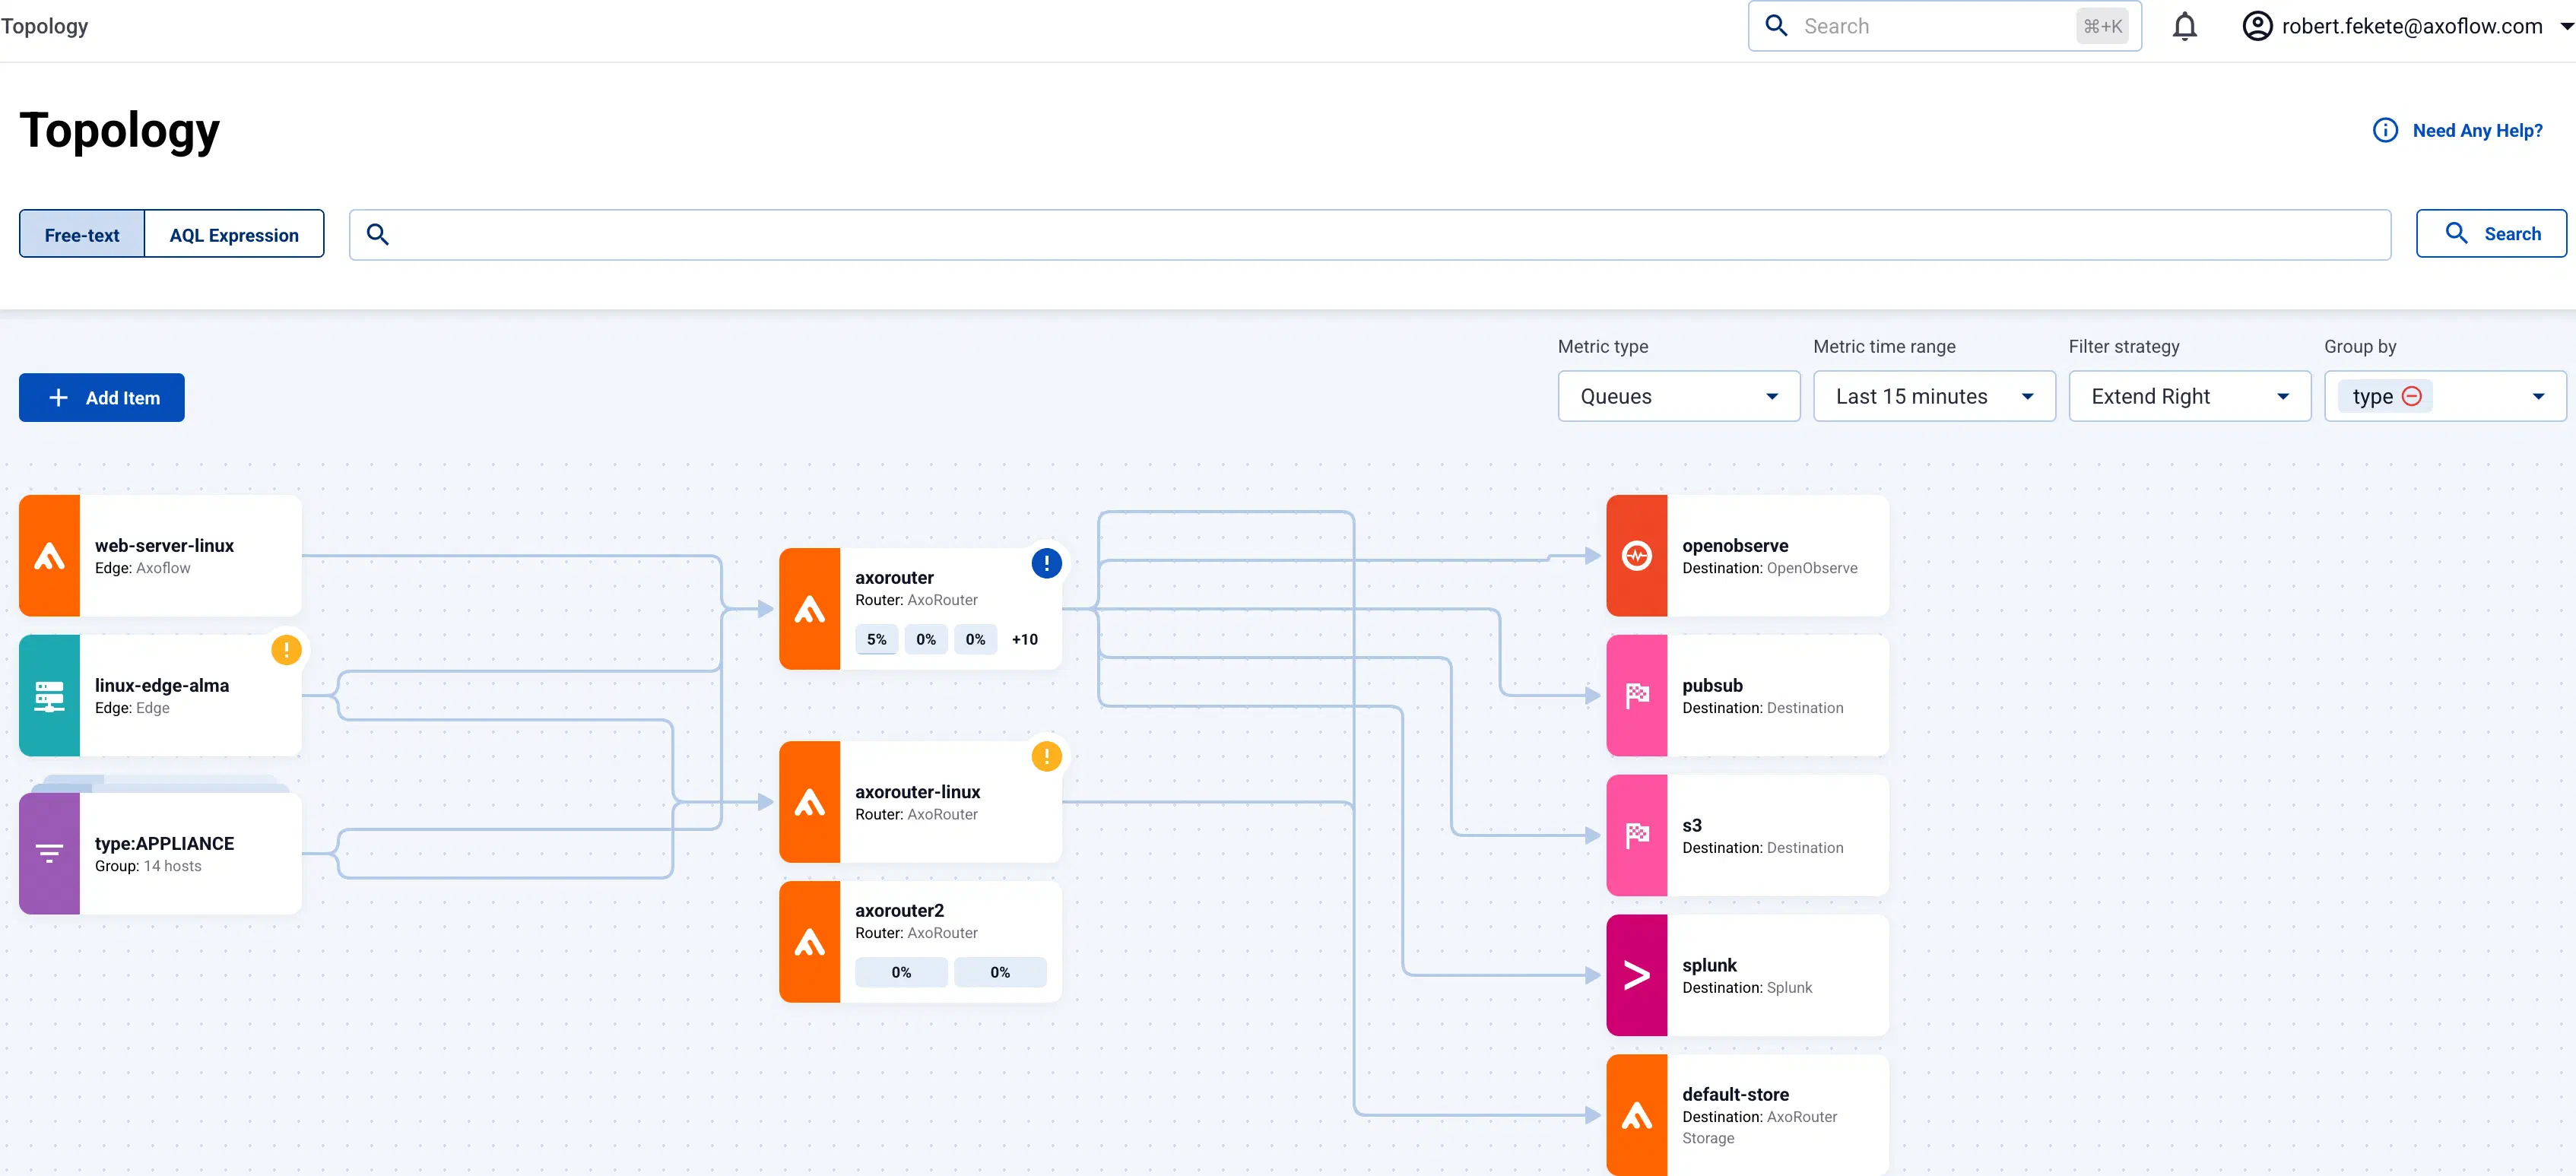
Select the name of a source host or a router to show the details and metrics of that pipeline elements.
If a host has active alerts, it’s indicated on the topology as well.
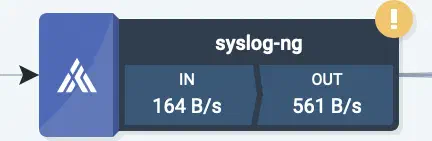
Traffic volume
Select Metric type > Log Bytes or Metric type > Log Events in the top bar to show the volume of the data flow on the topology paths in bytes per second or events per second. The metrics refer to the last 15 minutes by default, select Metric time range to change to a different period.
Filter hosts
To find or display only specific hosts, you can use the filter bar.
-
Free-text mode searches in the values of the following fields of the host: Name, IP Address, GUID, FQDN, and the labels of the host.
Basic Search is case insensitive. Adding multiple keywords searches for matches in any of the previous fields. This is equivalent to the
@ANY =* keyword1 AND @ANY =* keyword2AQL query. -
AQL Expression mode allows you to search in specific fields or the labels of the hosts.
It also makes more complex filtering possible, using the Equals, Contains (partial match), and Match (regular expression match) operators. Note that:
- To execute the search, click Search, or hit ESC then ENTER.
- AxoConsole autocompletes the built-in and custom labels and field names, as well as their most frequent values, but doesn’t autocomplete labels and variables created by data parsing and processing steps.
- You can use the AND and OR operators to combine expressions, and also parenthesis if needed. For details on AQL, see AQL operator reference.
- The precedence of the operators is the following: parentheses, AND, OR, comparison operators.
- Use the usual keyboard shortcuts to undo (⌘/Ctrl + Z) or redo (⌘/Ctrl + Shift + Z) your edits.
For details about the message schema and the available fields, see Message schema reference.

If a filter is active, by default the AxoConsole will display the matching hosts and the elements that are downstream from the matching hosts. For example, if an aggregator like AxoRouter matches the filter, only the aggregators and destinations where the matching host is sending data are displayed, the sources that are sending data to the matching aggregator aren’t shown. To display only the matching host without the downstream pipeline elements, select Filter strategy > Strict. (For example, the AQL expression type = ROUTER shows only the aggregator hosts.)
The settings of the filter bar change the URL parameters of the page, so you can bookmark it, or share a specific view by sharing the URL.
Grouping hosts
You can select labels to group hosts in the Group by field, so the visualization of large topologies with lots of devices remains useful. AxoConsole automatically adds names to the groups. The following example shows hosts grouped by their region based on their location labels.
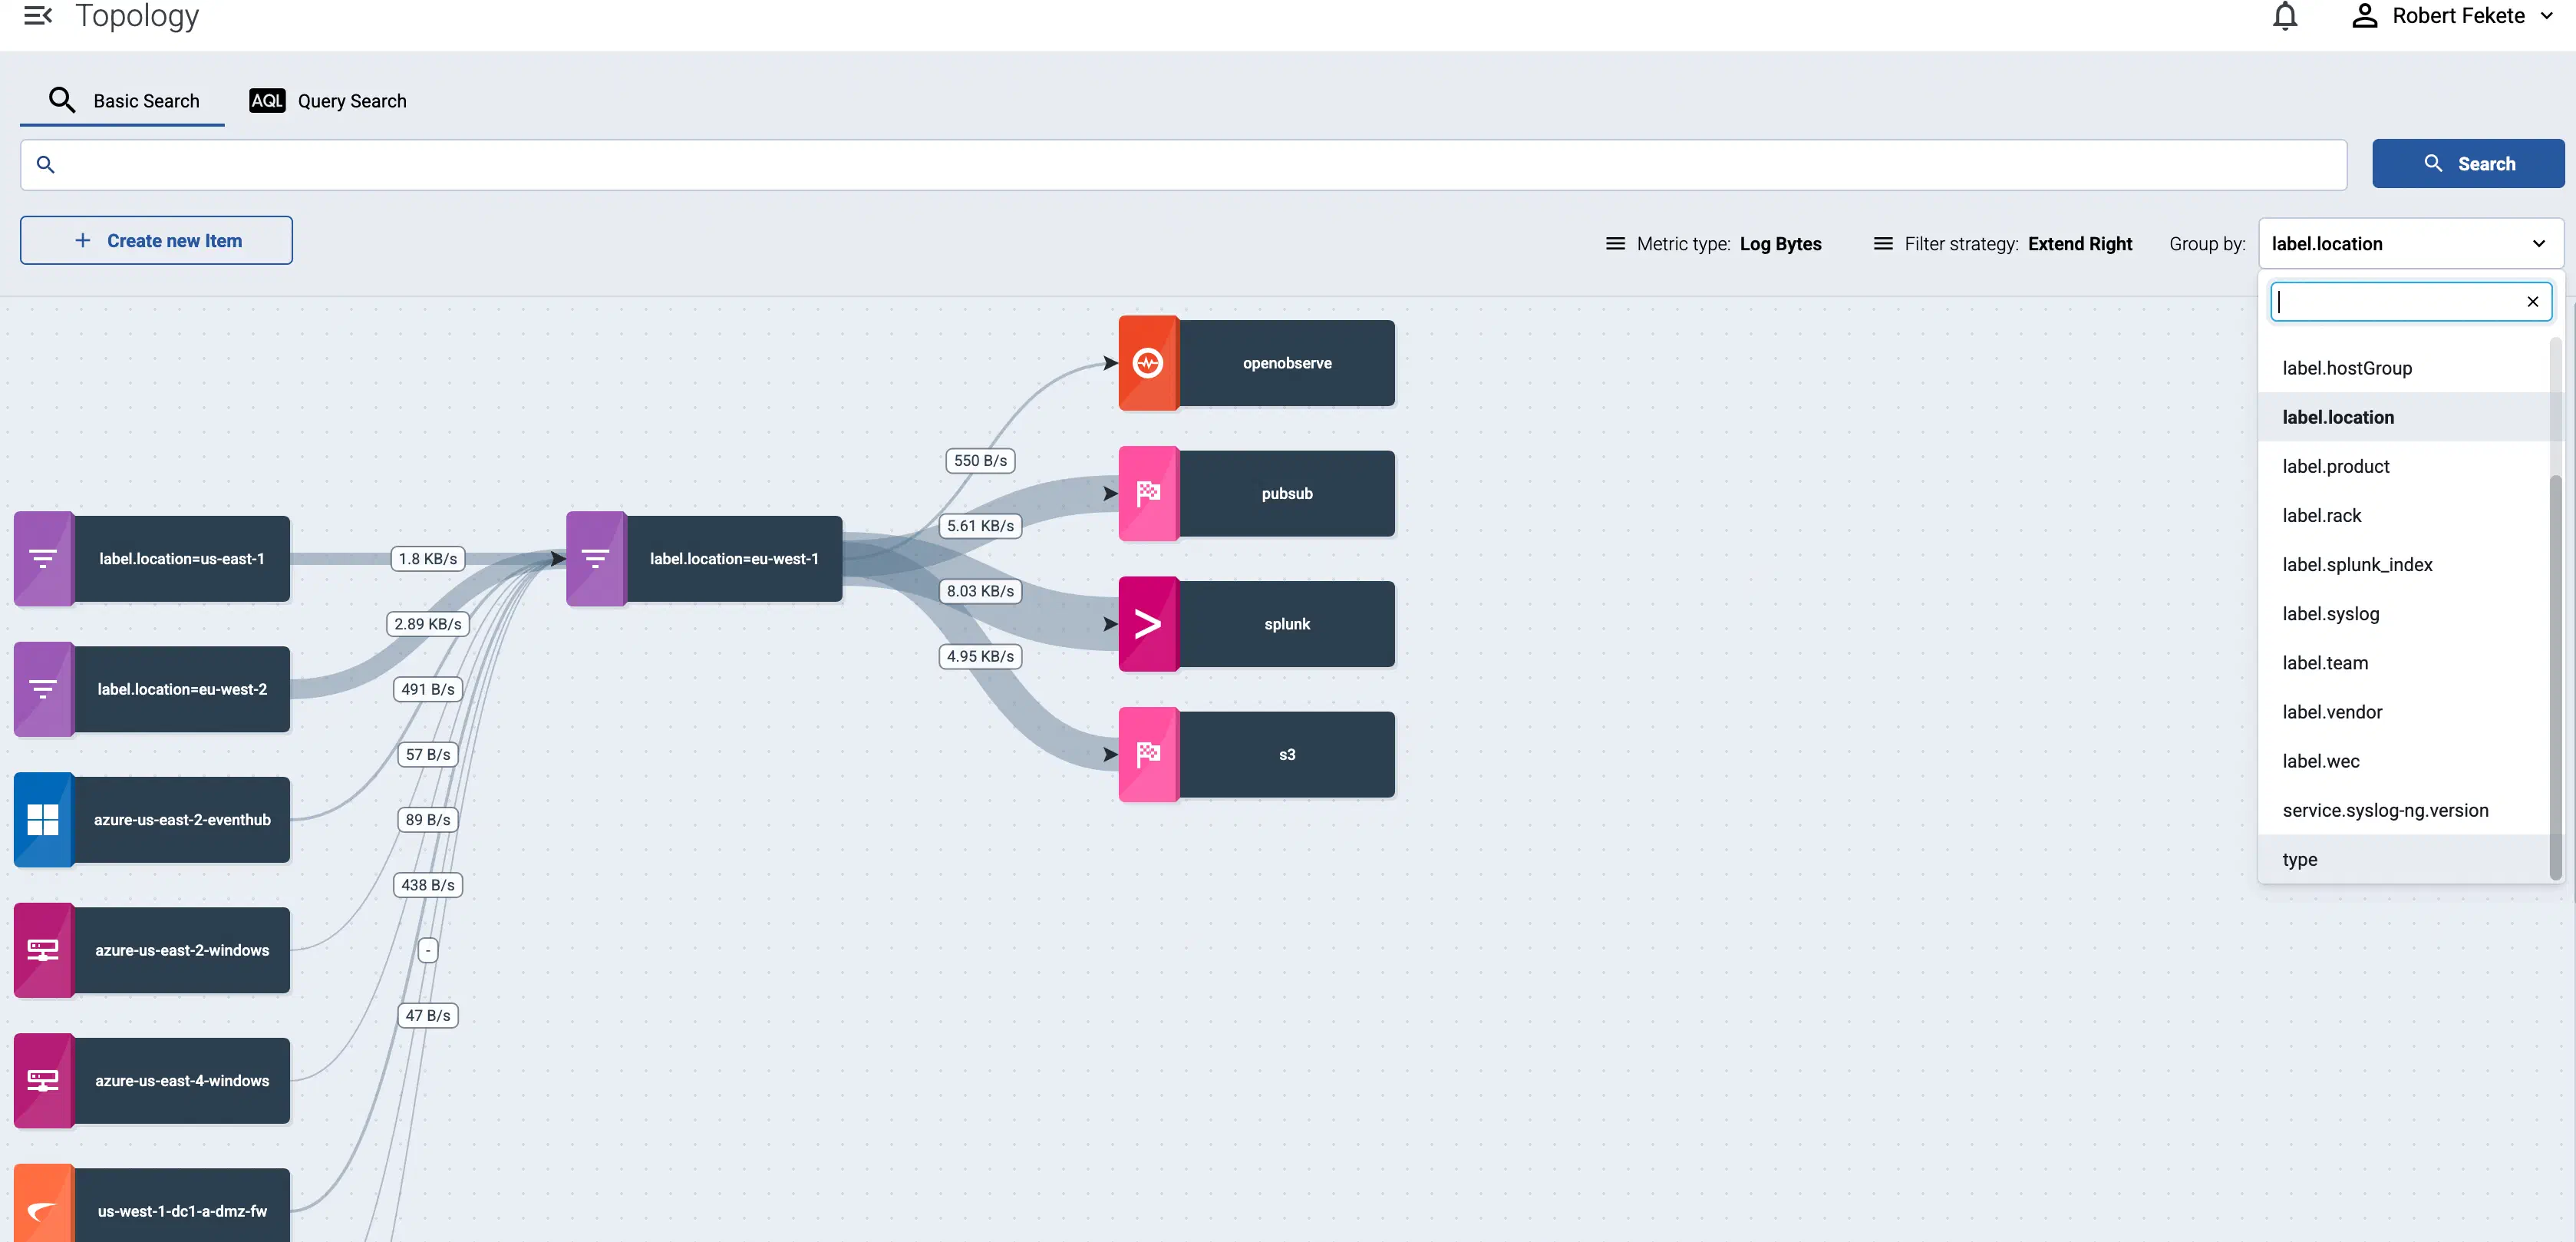
You can select one or more features to group hosts by. When multiple features are selected, groups will be formed by combining values of these features. This can be useful in cases where your information is split into multiple features, for example, if you have region (with values eu, us, etc.) and zone (with values central-1, east-1, east-2, west-1, etc.) labels on your hosts and select the label.region and label.zone features for grouping, you’ll groups will be the following:
- A cross-product of the selected feature values:
eu,central-1,eu,east-1,eu,east-2,eu,west-1,us,central-1,us,east-1, and so on. Obviously, in this example, several of these groups (likeeu,east-1,eu-east-2, andus,central-1) will be empty, unless your hosts are mislabeled. - Groups for the individual values, for hosts that have only one of the selected features:
eu,us,central-1,east-1,east-2,west-1, etc.
Queues
Select Metric type > Queues in the top bar to show the status of the memory and disk queues of the hosts. Select the status indicators of a host to display the details of the queues.
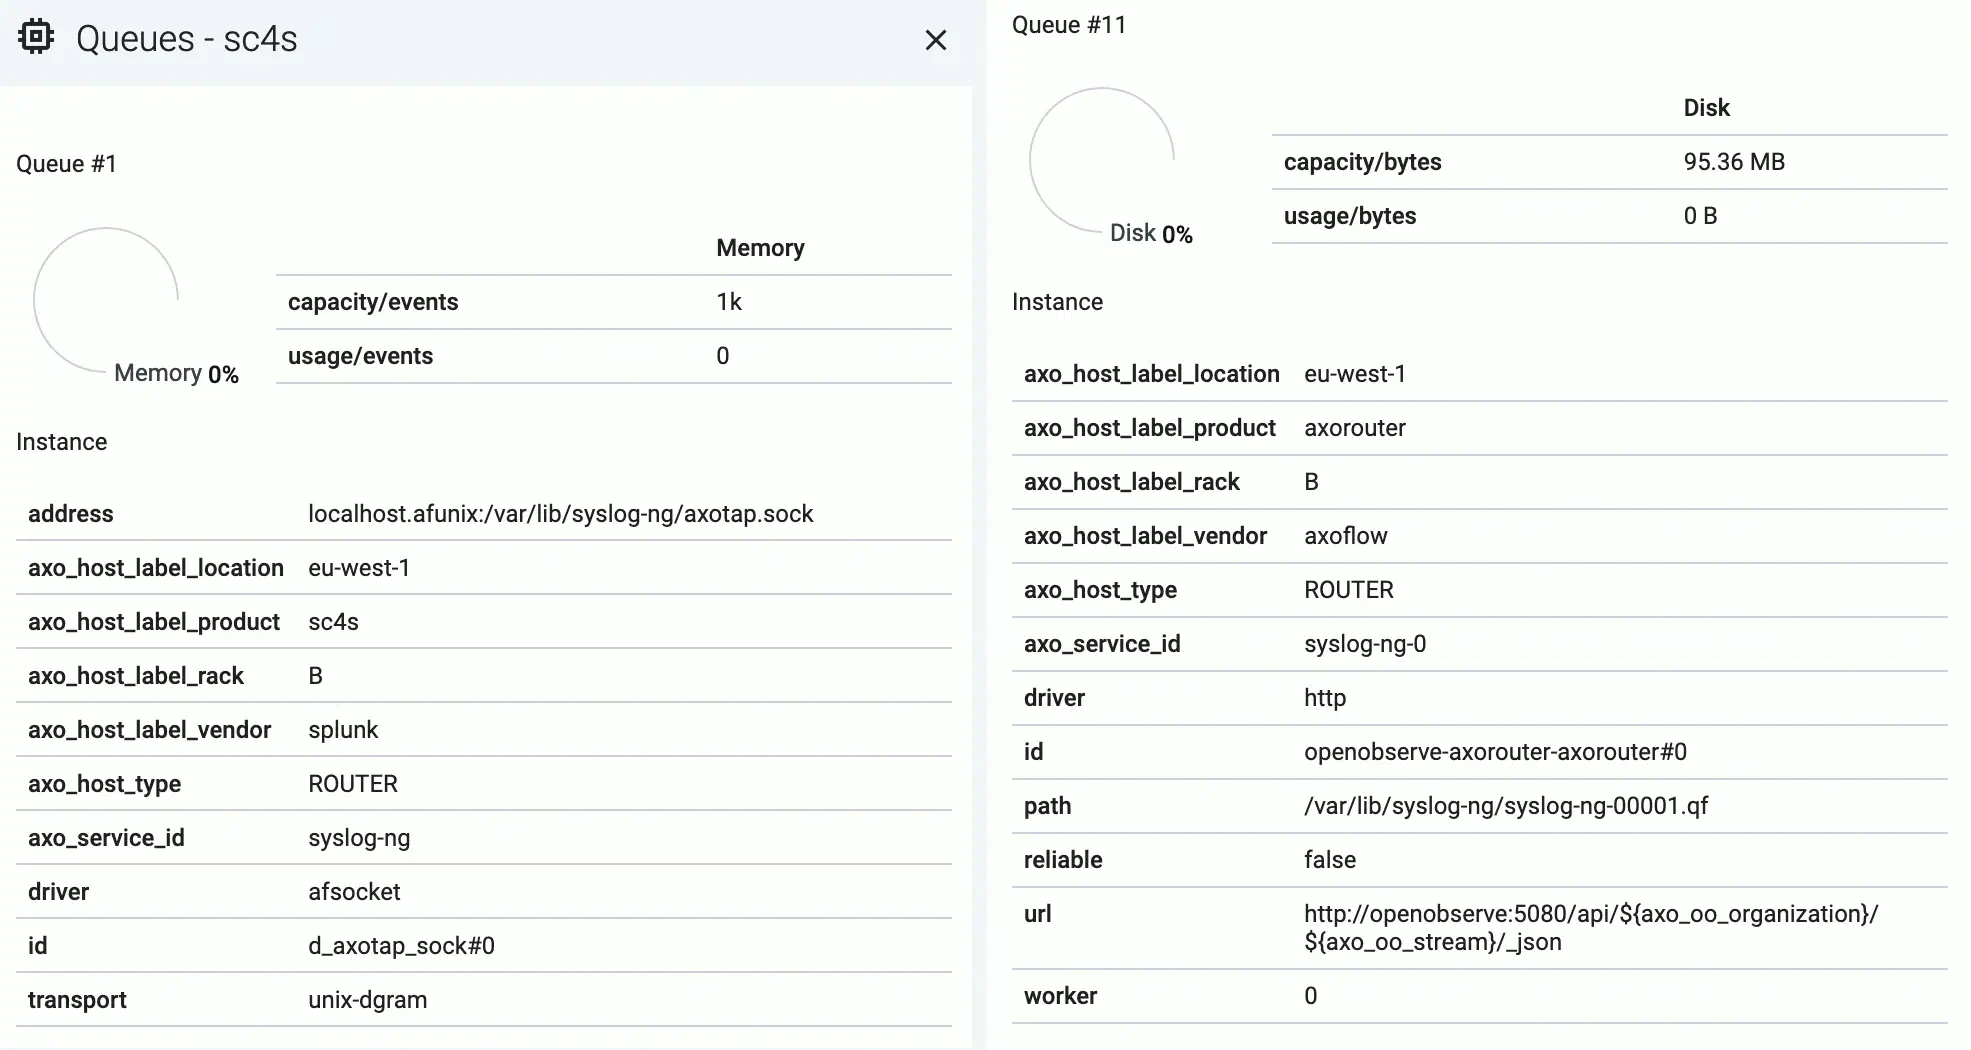
The following details about the queue help you diagnose which connections of the host are having throughput or connectivity issues:
- capacity: The total capacity of the buffer in bytes.
- usage: How much of the total capacity is currently in use.
- driver: The type of the AxoSyslog driver used for the connection the queue belongs to.
- id: The identifier of the connection.
Disk-based queues also have the following information:
- path: The location of the disk-buffer file on the host.
- reliable: Indicates wether the disk-buffer is set to be reliable or not.
- worker: The ID of the AxoSyslog worker thread the queue belongs to.
Both memory-based and disk-based queues have additional details that depend on the destination.
Add a path
Paths show where the data flows on the topology page, for example, between a source and an AxoRouter. Usually, AxoConsole creates and deletes paths automatically. Sometimes you’ve to add a path manually, for example, when AxoConsole can’t detect the path based on the IP address and the FQDN of the host. To add a path manually, complete the following steps.
-
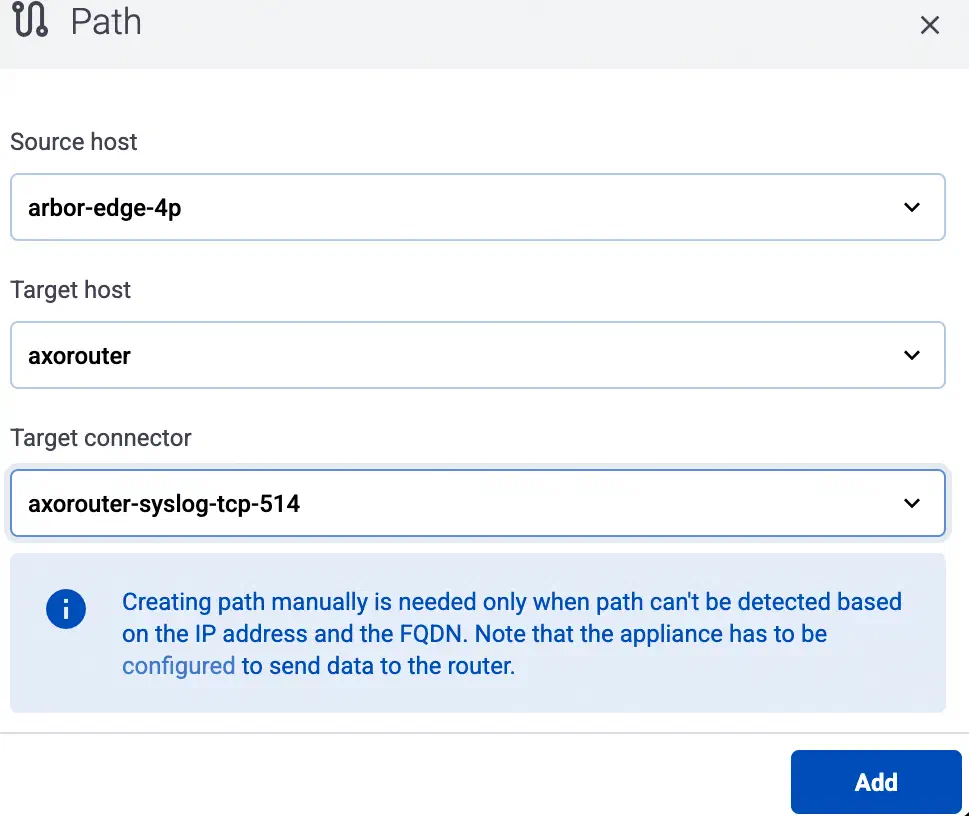
Select Topology > Add Item > Path.
-
If not set automatically, select the beginning of the path in the Source host field.
-
Select the target router or aggregator this source is sending its data to in the Target host field, for example,
axorouter. -
Select the Target connector. The connector determines how the destination receives the data (for example, using which protocol or port).
-
Select Add. The new path appears on the Topology page.

3 - Hosts
Axoflow collects and shows you a wealth of information about the hosts of your security data pipeline. Sources and edge hosts are listed on the Sources page, while AxoRouters are shown on the Routers page.
- Sources are hosts that are sending data to a data aggregator, like AxoRouter.
- Edges are source hosts that are running a collector agent managed by AxoConsole, or have an Axolet agent reporting metrics from the host.
To tap into the logs of the host, see Log tapping.
3.1 - Find a host
To find a specific host, you can use any of the following methods:
- the global search,
- the Topology page, or
- the Routers or Sources pages.
Use global search
Start typing the name of the host into the global search field, then select the host from the results. You can also access the global search using the ⌘/Ctrl + K keyboard shortcut.
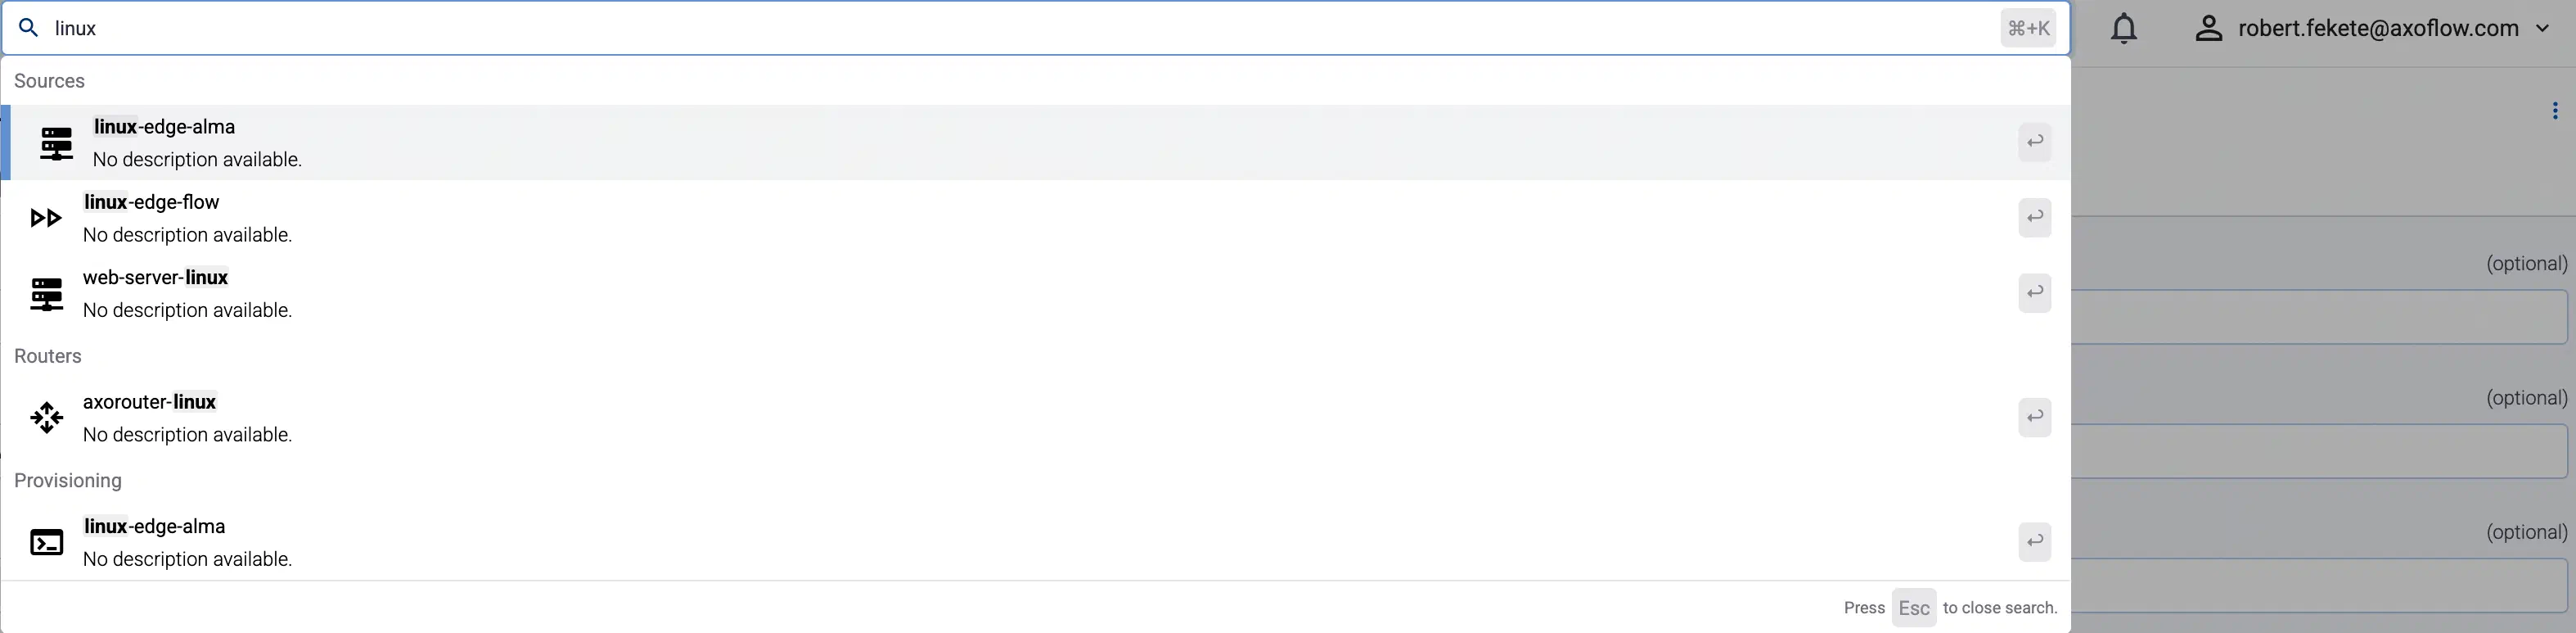
Find host on the Topology page
Open the Topology page, then click the name of the host you’re interested in.
If you have many host and it’s difficult to find the one you need, use filtering, or grouping.
Find a router or a source host
To find an AxoRouter, open the Routers page. To find a source or an edge host, open the Sources page.
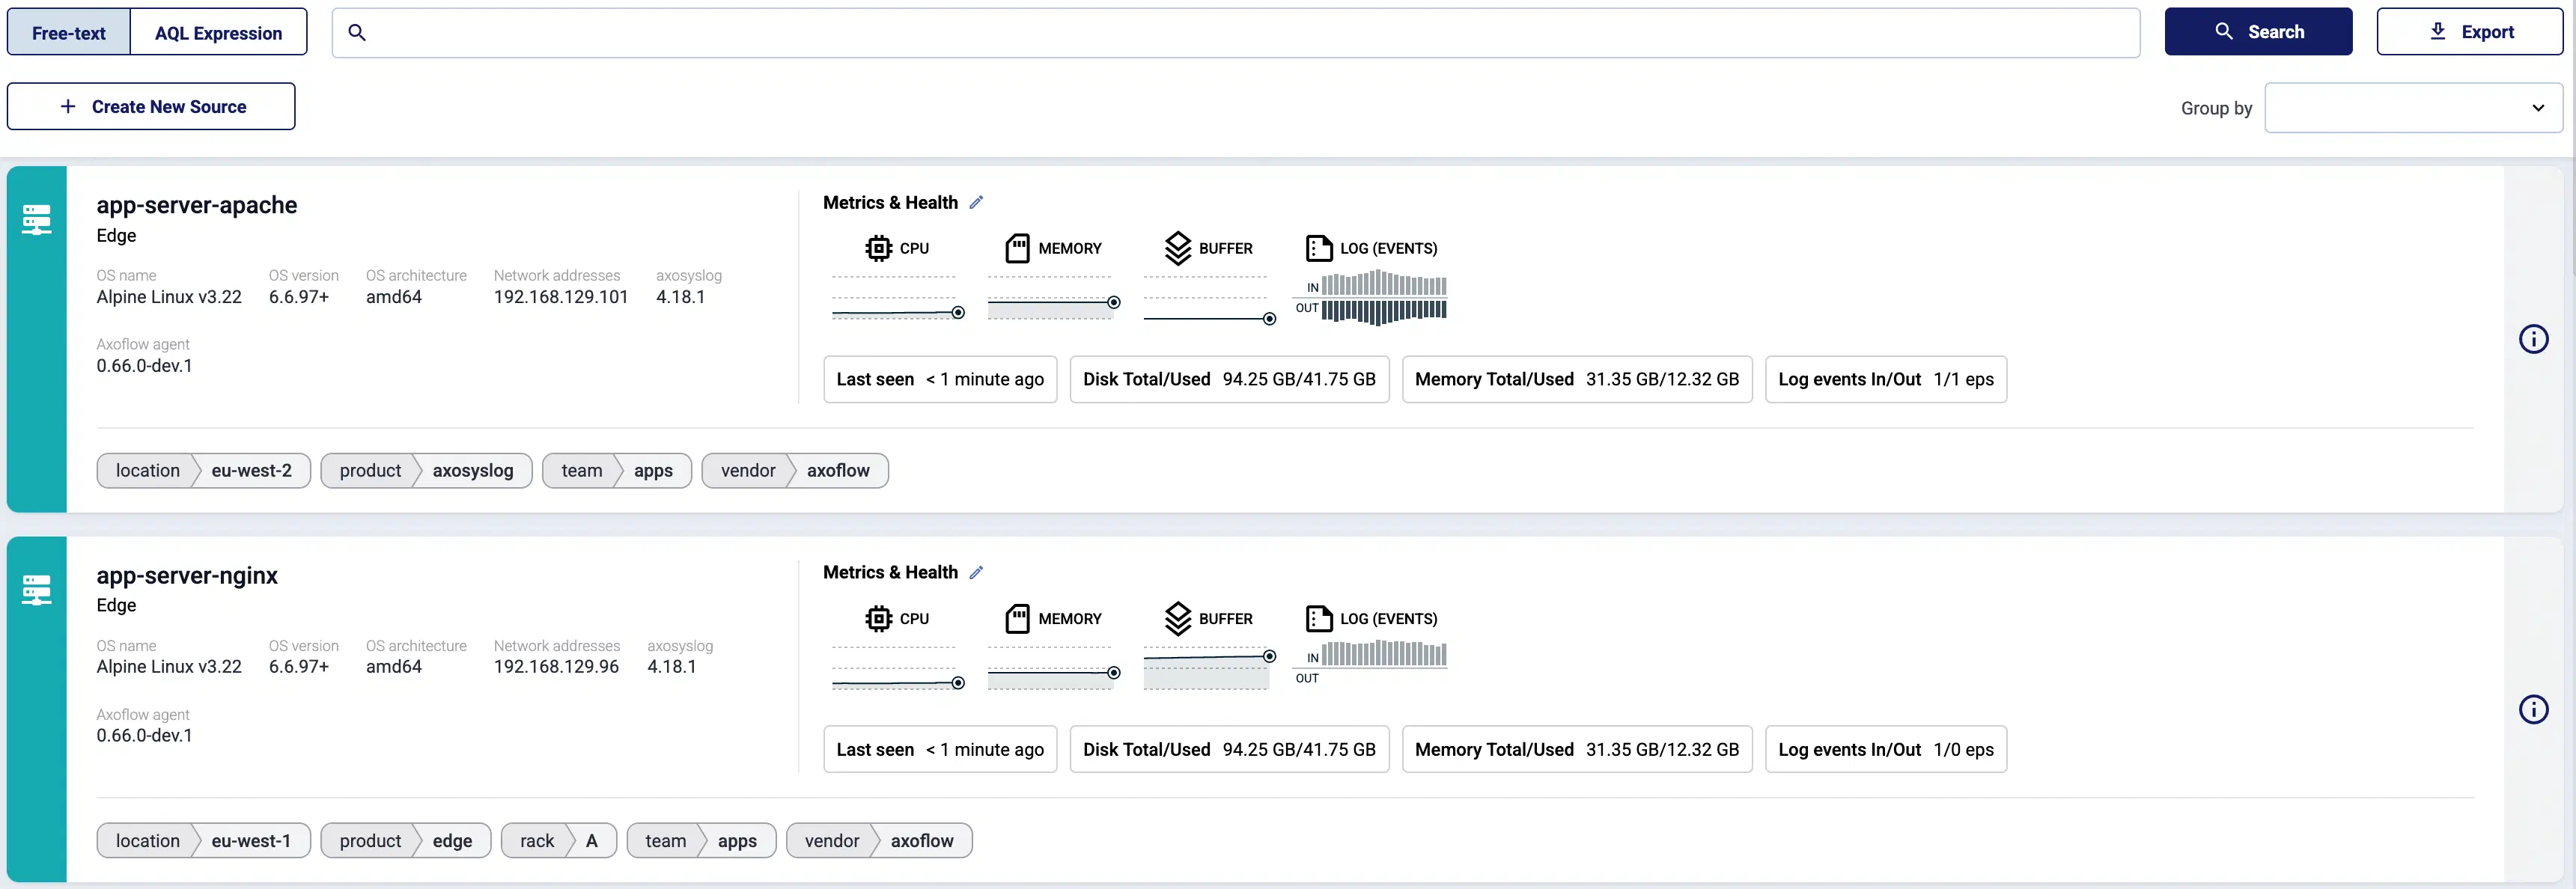
To find or display only specific hosts, you can use the filter bar.
-
Free-text mode searches in the values of the following fields of the host: Name, IP Address, GUID, FQDN, and the labels of the host.
Basic Search is case insensitive. Adding multiple keywords searches for matches in any of the previous fields. This is equivalent to the
@ANY =* keyword1 AND @ANY =* keyword2AQL query. -
AQL Expression mode allows you to search in specific fields or the labels of the hosts.
It also makes more complex filtering possible, using the Equals, Contains (partial match), and Match (regular expression match) operators. Note that:
- To execute the search, click Search, or hit ESC then ENTER.
- AxoConsole autocompletes the built-in and custom labels and field names, as well as their most frequent values, but doesn’t autocomplete labels and variables created by data parsing and processing steps.
- You can use the AND and OR operators to combine expressions, and also parenthesis if needed. For details on AQL, see AQL operator reference.
- The precedence of the operators is the following: parentheses, AND, OR, comparison operators.
- Use the usual keyboard shortcuts to undo (⌘/Ctrl + Z) or redo (⌘/Ctrl + Shift + Z) your edits.
For details about the message schema and the available fields, see Message schema reference.
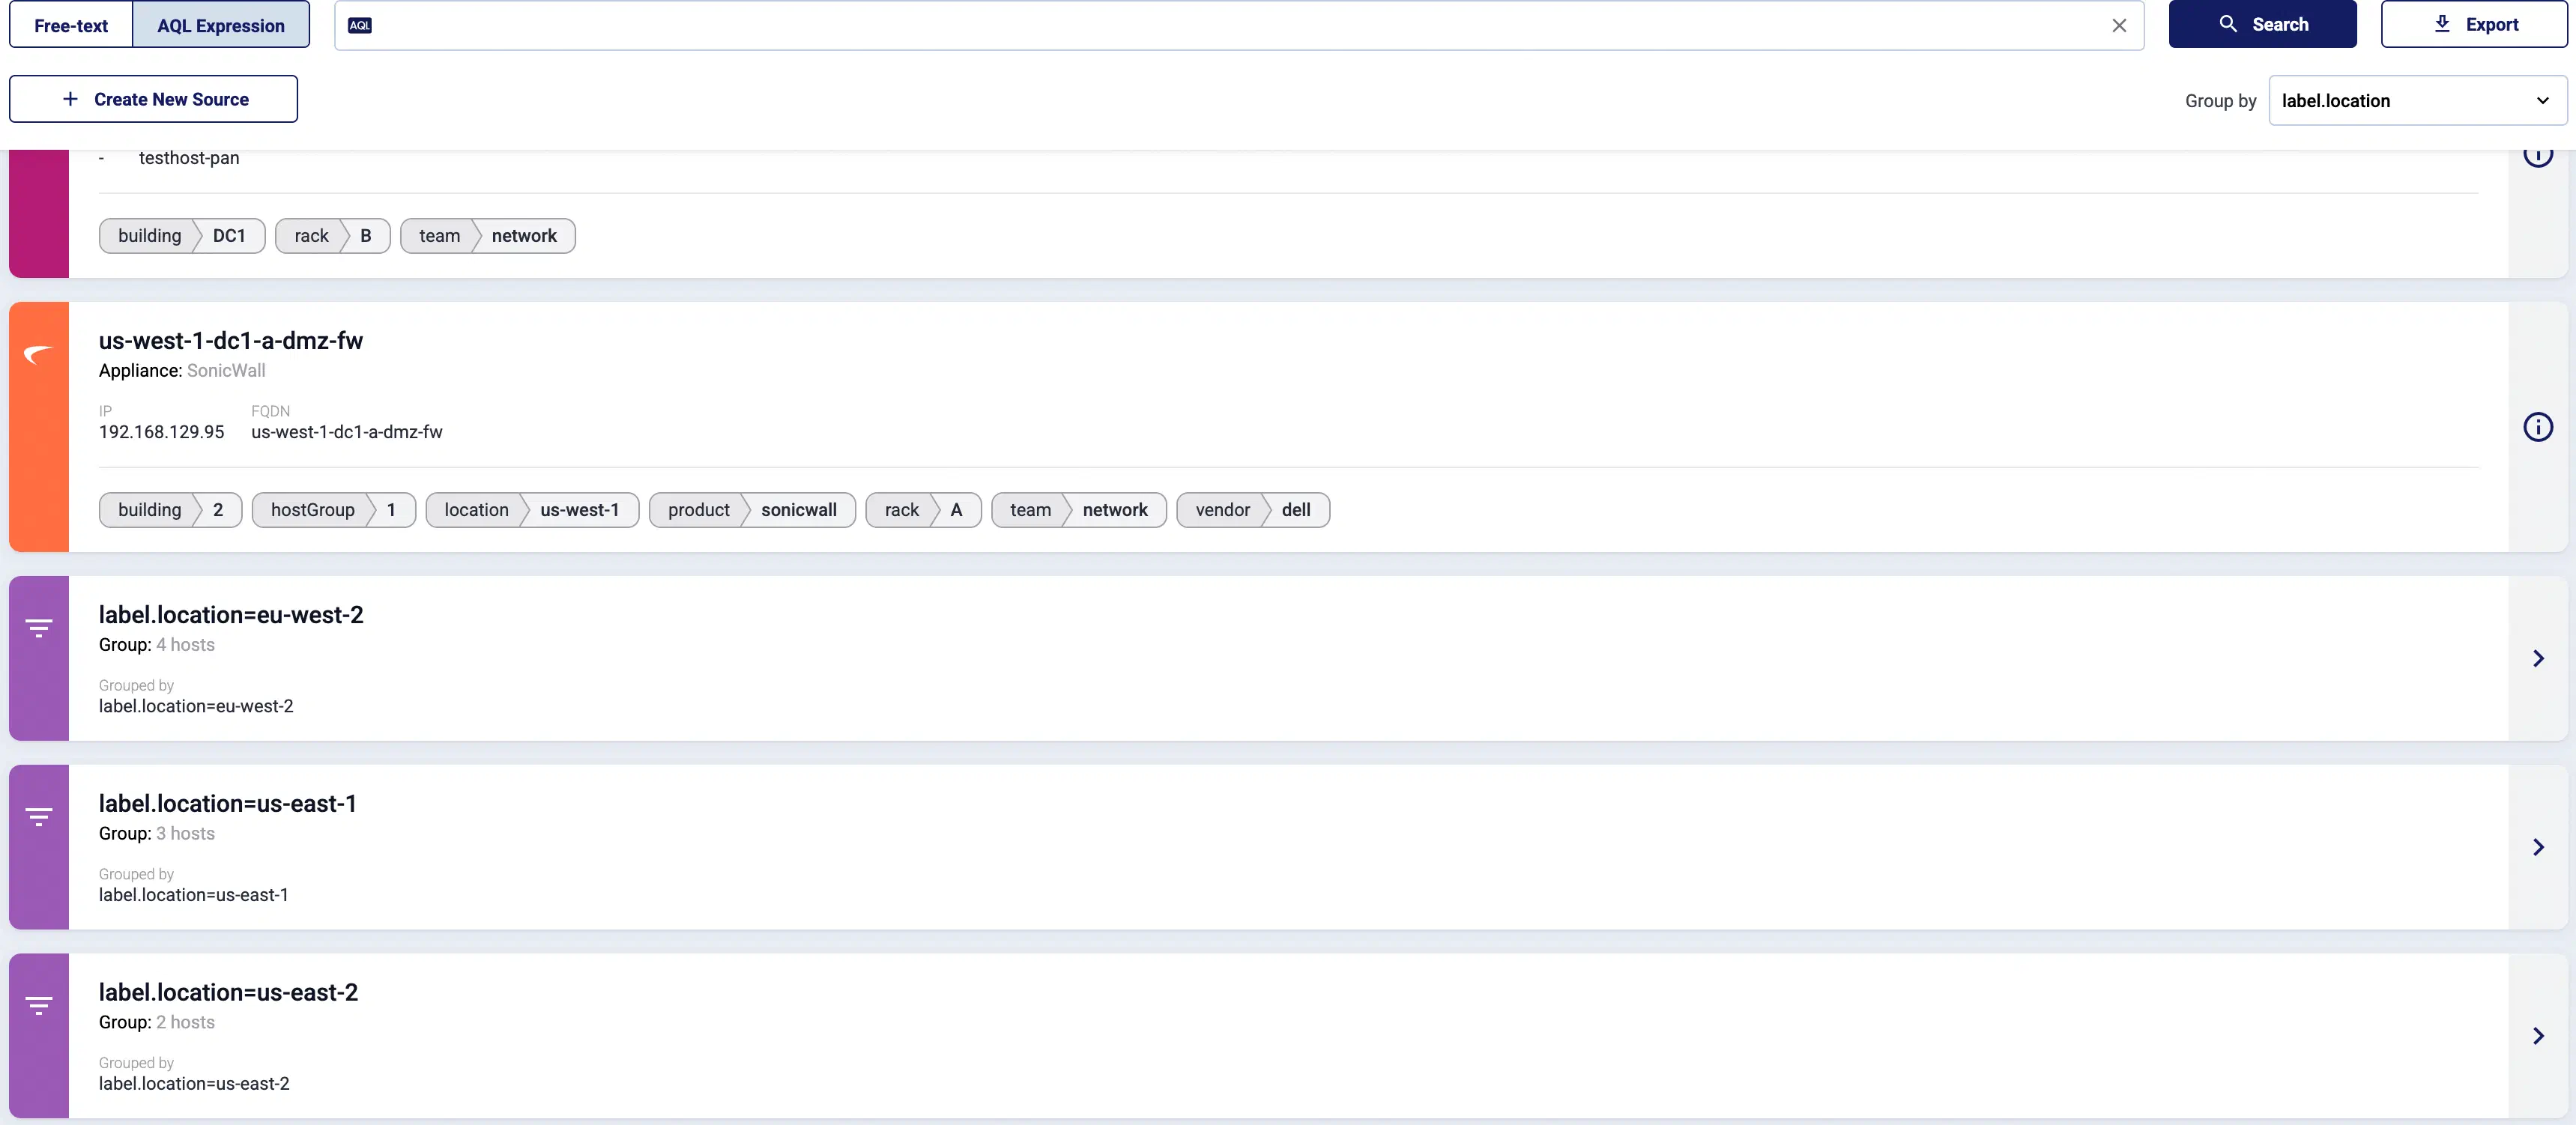
You can also select one or more features (for example, label.location) to group hosts by in the Group by field. For details on how grouping works, see Grouping hosts.
3.2 - Host information
AxoConsole provides a quick overview of every data source and edge host on the Sources page, and AxoRouter on the Routers page. The exact information depends on the type of the host: hosts managed by Axoflow provide more information than external hosts.

The following information is displayed:
- Hostname or IP address
- Metadata labels. These include labels added automatically during the Axoflow curation process (like product name and vendor labels), as well as any custom labels you’ve assigned to the host.
For edge hosts (hosts that have the Axoflow agent (Axolet) installed):
- The version on the agent
- The name and version of the log collector running on the host (for example, AxoSyslog or Splunk Connect for Syslog)
- Operating system, version, and architecture
- When AxoConsole has last received metrics from the host
- Resource information: CPU and memory usage, disk buffer usage. Click on a resource to open its resource history on the Metrics & health page of the host.
- Traffic information: volume of the incoming and outgoing data traffic on the host.
- Cloud-related labels: If the host is running in the cloud, the provider, region, zone labels are automatically available.
- An indicator if there are any active alerts on the host.
For more details about the host, select the hostname, or click ⋮ Host Options.
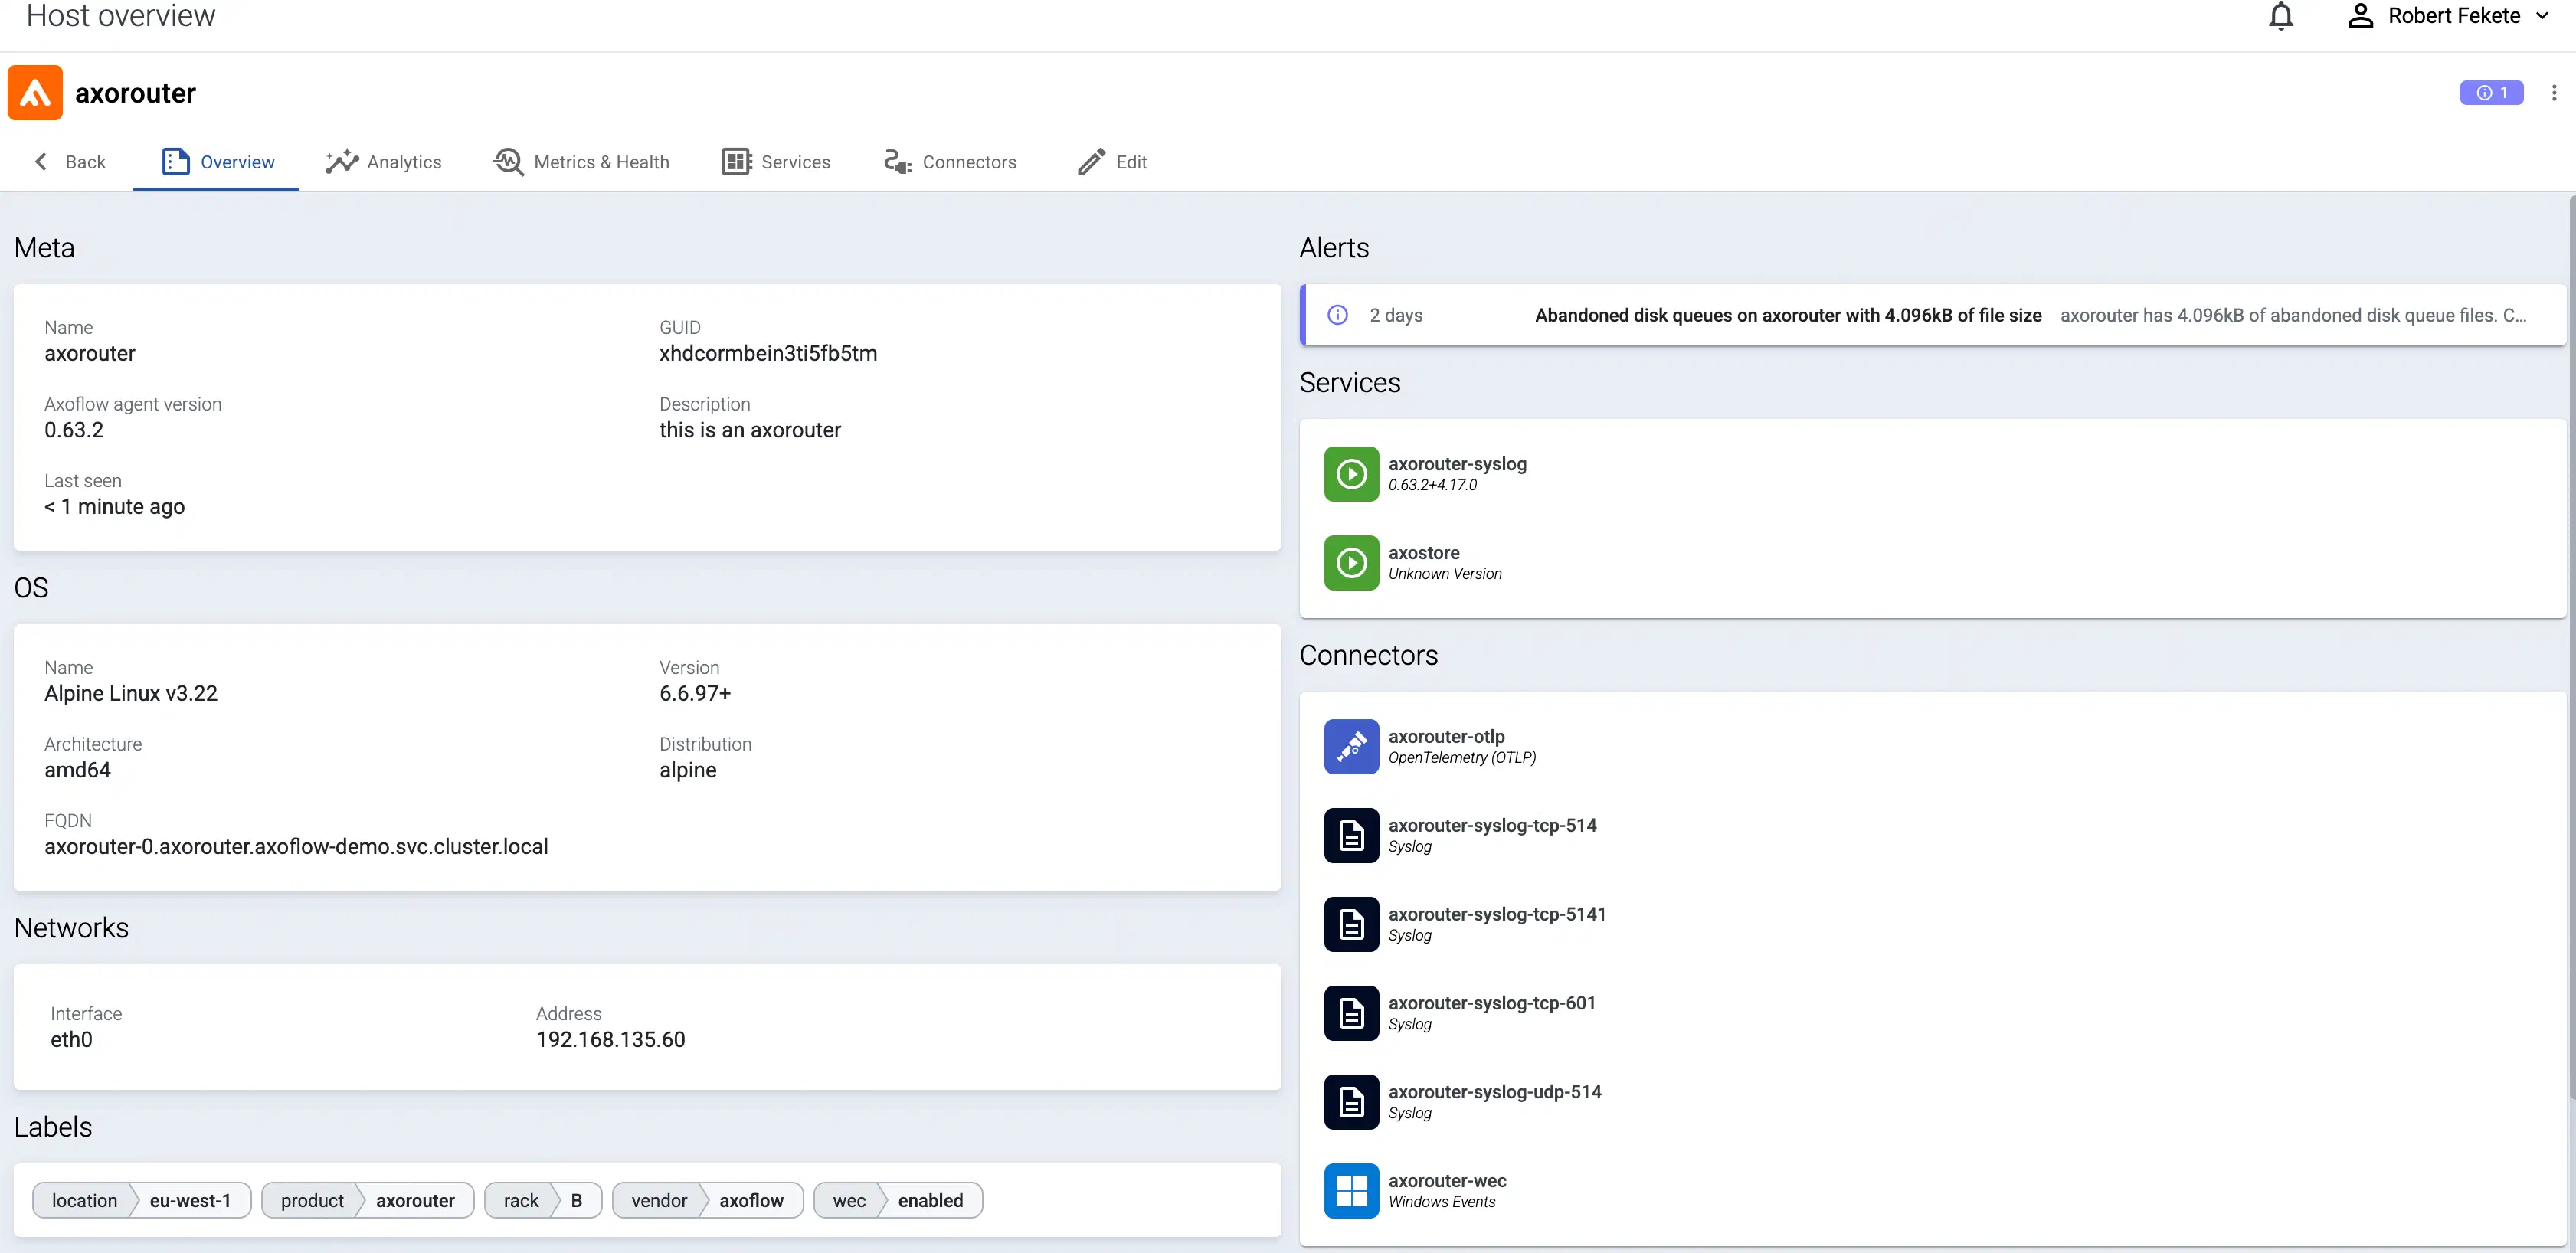
The host Overview page gives a quick overview of the host, including:
- The Services.
- Any active Alerts.
- the Connectors and Forwarding Rules available on Axoflow agent hosts.
- the Connectors, Flows, and Stores available on AxoRouter hosts.
You can also access host-specific Analytics and Metrics.
3.3 - Custom labels and metadata
To add custom labels to a host, complete the following steps.
Note that these are static labels.
- To add labels dynamically based on the contents of the processed data, use processing steps in data flows.
- To manage labels in bulk, see Bulk update hosts.
-
Find the host on the Topology page, and click on its hostname. The overview of the host is displayed. (Alternatively, you can find AxoRouters on the Routers page, and source and edge hosts on the Sources page.)
-
Select Edit.
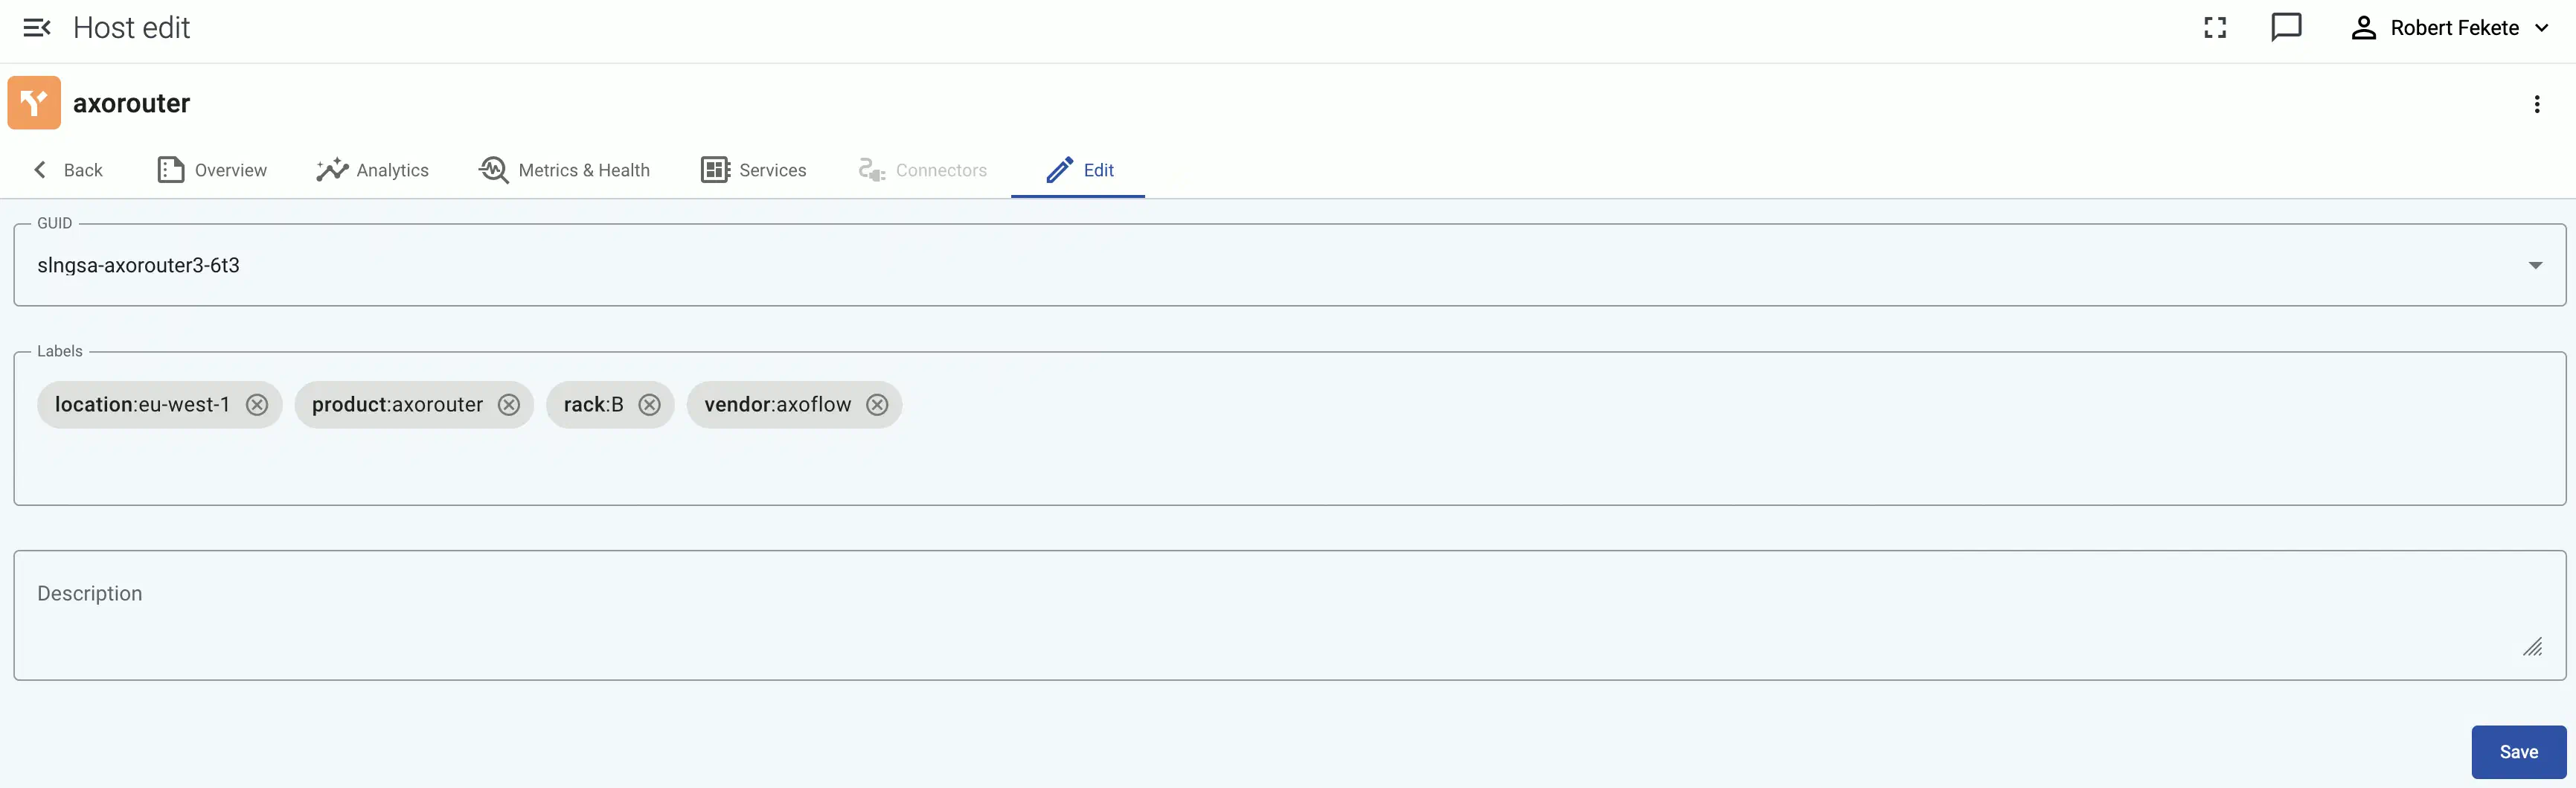
You can add custom labels in
<label-name>:<value>format (for example, the group or department a source device belongs to), or a generic description about the host. You can use the labels for quickly finding the host on the Hosts page, and also for filtering when configuring Flows.When using labels in filters, processing steps, or search bars, note that:
- Labels added to AxoRouter hosts get the
axo_host_prefix. - Labels added to data sources get the
host_prefix. For example, if you add a rack label to an edge host, it’ll be added to the data received from the host ashost_rack. - Labels added on edge hosts get the
edge_connector_label_prefix.
On other pages, like the Host Overview page, the labels are displayed without the prefixes.
- Labels added to AxoRouter hosts get the
-
Select Save.
3.4 - Bulk update hosts
Instead of editing hosts one by one, you can manage your inventory in bulk: export the host list to a CSV file, edit it offline in a spreadsheet or text editor, then import the updated file. Axoflow compares the file against your current inventory and applies the changes.
Using this workflow, you can:
- Update the description and labels of existing hosts.
- Add new hosts.
- Delete hosts.
The Export/Import CSV option is available on the Routers page (for AxoRouters) and on the Sources page (for source and edge hosts).
Export the inventory list
-
Open the Routers or the Sources page.
-
(Optional) Filter or search the list to narrow down the hosts you want to work with.
Note The exported file contains exactly the hosts shown in the list, so any active filter or search also applies to the export. -
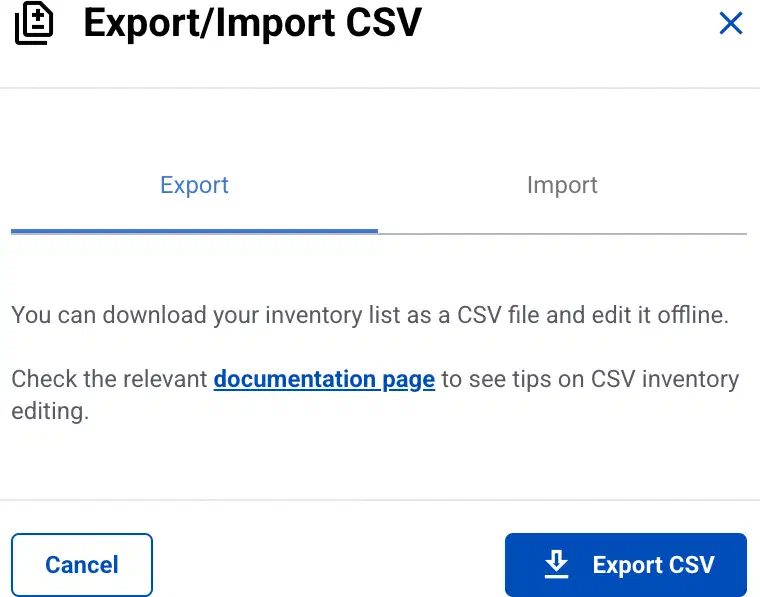
Select Export/Import CSV, then on the Export tab select Export CSV.
The current list is downloaded as a CSV file.
Edit the CSV file
The exported file has one row per host and the following columns, for example:
name,type,description,label.app,label.building,label.discovered,label.hostGroup,label.location,label.os,label.platform,label.product,label.rack,label.targetSample,label.team,label.vendor,fqdn,ip
arbor-edge-ppa,APPLIANCE,,,,,,,,,arbor-edge,,,,netscout,arbor-edge-ppa,192.168.9.99
azure-us-east-2-eventhub,APPLIANCE,,,2,,8,us-east-2,,,azure-event-hub,A,,windows,microsoft,azure-us-east-2-eventhub,10.192.23.63
name: The unique name of the host. This is what identifies the host, so keep it unchanged for hosts you want to update. The name must be a valid hostname and must be unique within the file. Required.type: The type of the host:APPLIANCE,EDGE, orROUTER. You can’t change the type of an existing host. To delete a host, set this column toDELETED.description: A free-text description of the host.label.<key>: Each label is a separate column named after its key, for examplelabel.location. The cell holds the label value. To add a new label to every host, add a newlabel.<key>column. To add a label to a single host, fill in its cell and leave the others empty. Label keys follow the same rules as labels added in the UI.fqdn,ip: The fully qualified domain name and IP address of the host. You can only set these forAPPLIANCEhosts. For other host types, these values are reported by the agent and can’t be changed, so leave them as exported.
When editing the file, keep the following in mind:
- The file is the desired state. For the fields you can edit (description, labels, and the
fqdnandipof appliances), clearing a cell clears that value on the host. For example, emptying alabel.<key>cell removes that label from the host. - Adding a host: Add a new row. You can only add type
APPLIANCEhosts, and each new host needs at least anfqdnor anip. To add a ROUTER or an EDGE host, provision an AxoRouter or an Axoflow agent. - Deleting a host: Set the
typecolumn of the row toDELETED. - Hosts you leave out are untouched. Only the rows in the file are processed. Removing a row from the file does not delete the host — use
DELETEDfor that.
Import the edited CSV file
-
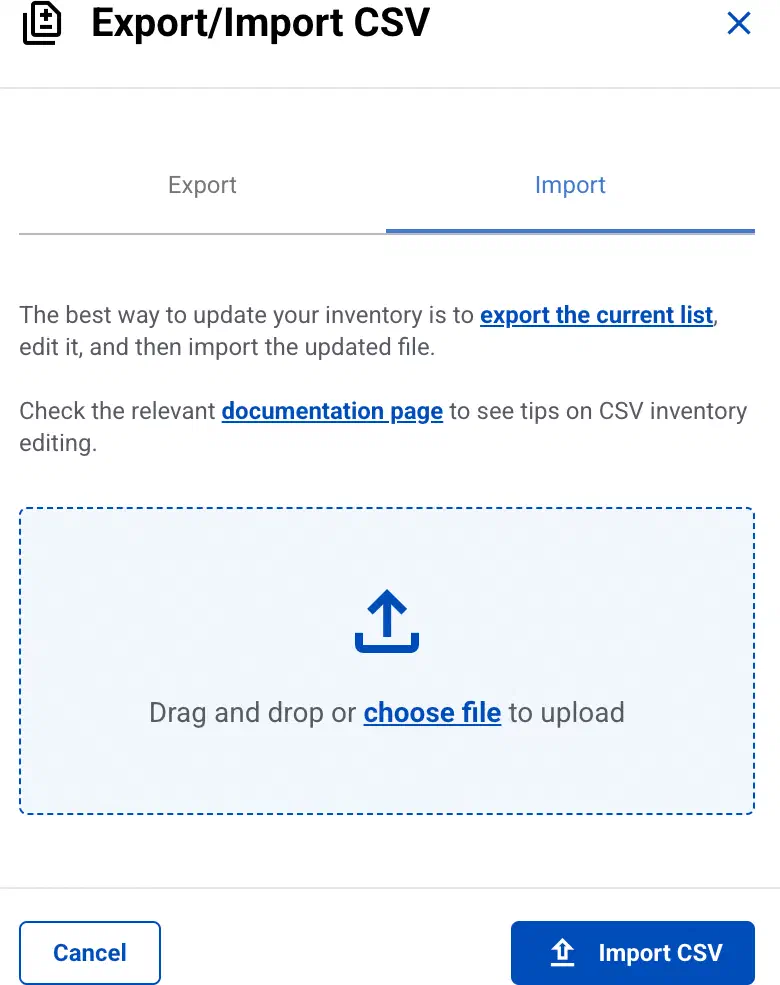
On the Routers or the Sources page, select Export/Import CSV, then open the Import tab.
-
Upload the edited CSV file.
AxoConsole compares the file against the current inventory and shows a summary of the changes to be made: how many hosts will be added, updated, and removed.
If the file contains errors, they’re listed per row and column so you can correct them and upload the file again.
-
Review the summary.
Note Changes are applied one by one, and are listed one-by-one in the Activity Logs. To stop an import that’s in progress, close the dialog. Changes that have already been applied stay in place.CAUTION:
Deleting hosts (
DELETED) and clearing values can’t be undone. Review the change summary carefully before importing.Select Import CSV to apply the changes.
3.5 - Services
The Services page of an AxoRouter or edge host shows information about the data collector or router services running on the host. This page is only available for managed pipeline elements.
The following information is displayed:
- Name: Name of the service
- Version: Version number of the service
- Type: Type of the service (which data collector or processor it’s running), for example,
axorouter-syslog,axorouter-wec, oraxostore - Supervisor: The type of the supervisor process. For example, Splunk Connect for Syslog (
sc4s) runs a syslog-ng process under the hood.
Icons and colors indicate the status of the service: running, stopped, or not registered.

Depending on the configuration of the host, the following services can be available:
- axoflow-otel-collector: The collector agent on edge hosts.
- axolet: The monitoring and management agent for Axoflow pipeline elements.
- axorouter-resolver: A service for retrieving host data from external CMDB systems.
- axorouter-syslog: The main processing element of AxoRouter deployments.
- axorouter-wec: The service that handles the Windows Events connector (WEC).
- axostore: The service that handles AxoStore on the host. Only available if there are stores configured on the host.
Service configuration
To check the configuration of the service, select Configuration. This shows the list of related environment variables and configuration files. Select a file or environment variable to display its value. For example:
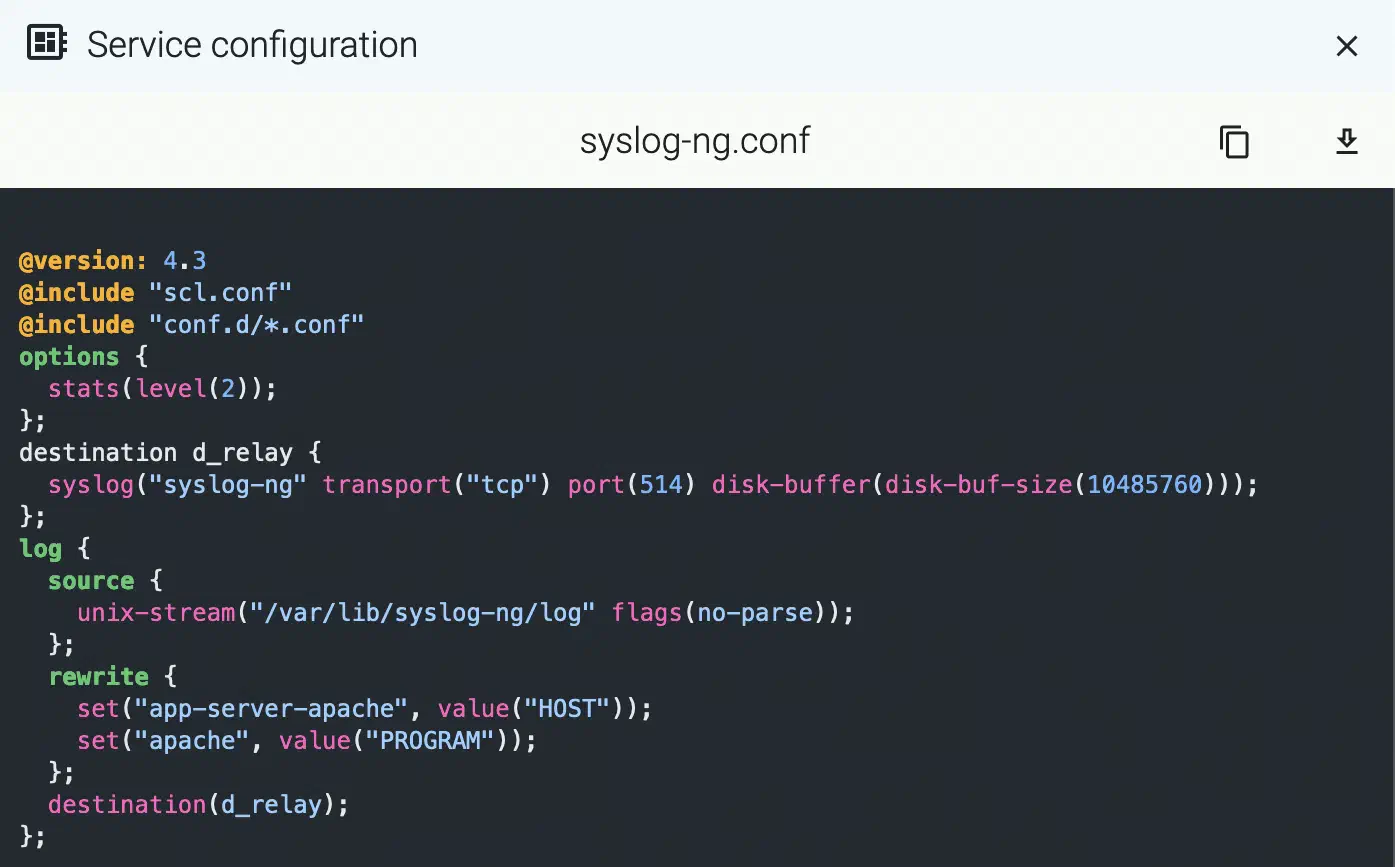
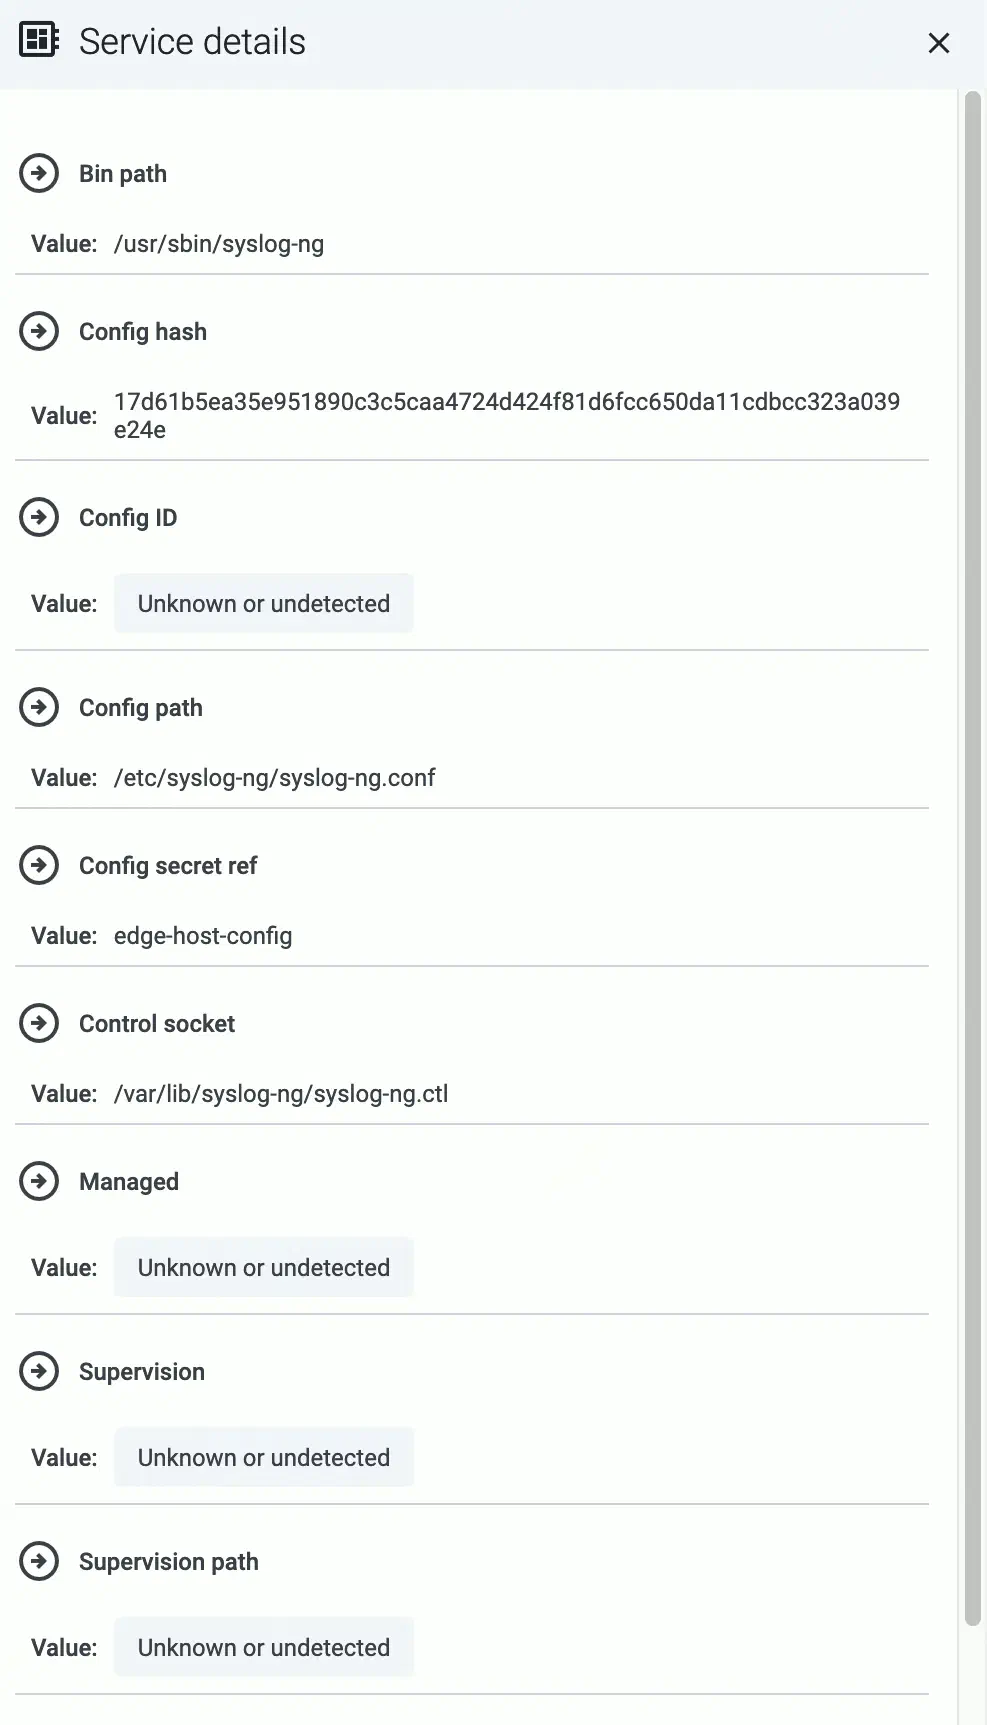
To display other details of the service (for example, the location of the configuration file or the binary), select Details.
Manage service
- To reload a registered service, select Reload. Reloading applies the service’s configuration without restarting it, so the service keeps running.
- To restart a registered service, select Restart. Restarting stops and starts the service completely, so it will be unavailable for a short time.
Register service manually
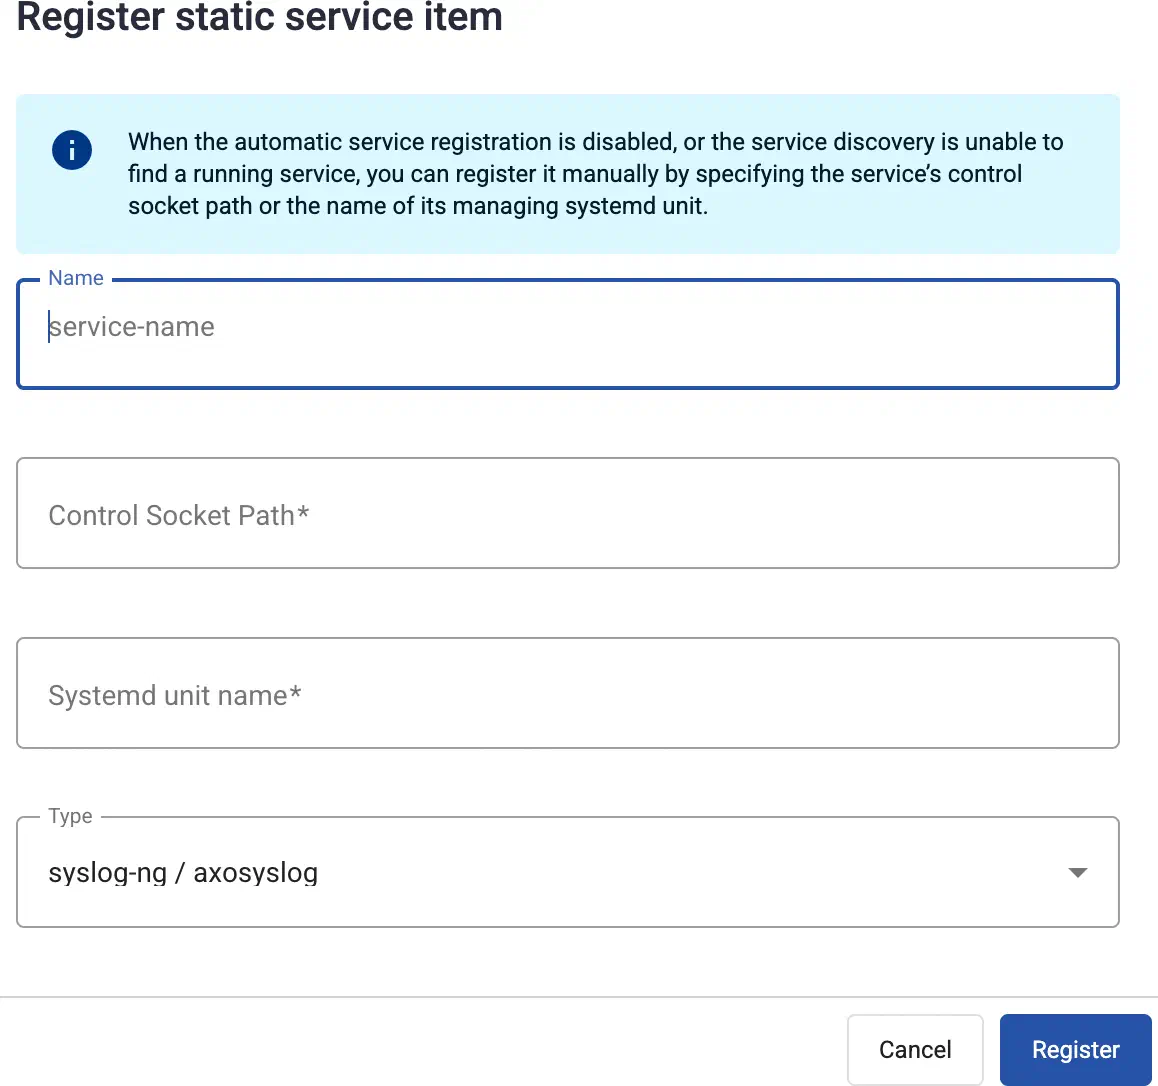
If Automatic service registration is disabled, or the service discovery is unable to find a running service, you can register it manually by specifying:
- the service’s control socket path, or
- the name of its managing systemd unit.
To register a service manually, complete the following steps.
-
Find the host and open its Services page.
-
Select Register static service.
-
Enter a name for the service. This name will be displayed in the services list.
-
Provide at least one of the following:
- Control Socket Path: The path to the Unix domain socket used to communicate with the service, for example,
/var/lib/syslog-ng/syslog-ng.ctl. - Systemd unit name: The name of the systemd service of the service you’re registering, for example,
syslog-ng.service.
- Control Socket Path: The path to the Unix domain socket used to communicate with the service, for example,
-
Select Register.
4 - Log tapping
Log tapping in Axoflow samples the log flow. You can use labels to filter for specific messages (like ones with parse errors) and tap only those messages. To not get overwhelmed with events, Axoflow automatically samples the output: if many messages match the selected filter, only a subset is shown (about 1 message per second). Using log tapping, you can quickly troubleshoot both parsing/curation errors and destination ingest (API) errors, and check:
- What was in the original message?
- What is sent in the final payload to the destination?
To see log tapping in action, check this blog post.
- Tap into your log flow.
- Display the logs of the log collector service. Service logs also contain the output of the systemd units used to launch the containers (where applicable).
Tap into the log flow
To tap into your log flow, complete the following steps.
-
Select the AxoRouter where you want to tap the logs on the Topology or Routers page. Alternatively, select
⌘/Ctrl + Kand enter the name of the AxoRouter. -
Select ⋮ Host Options > Tap log flow.

-
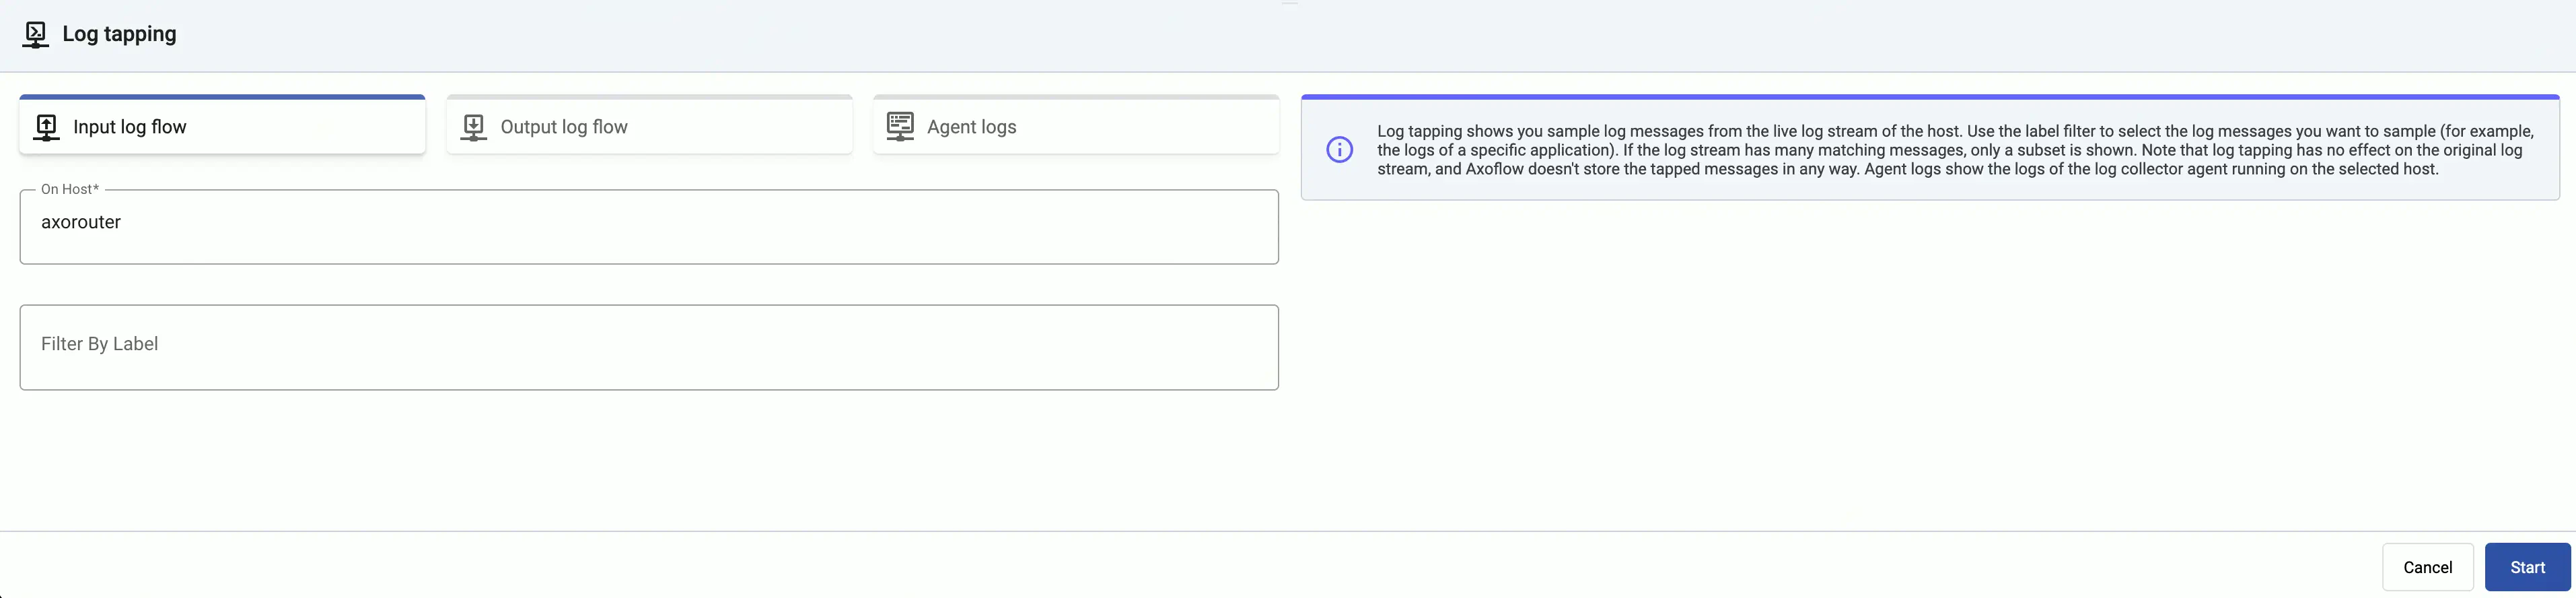
Tap into the log flow.
- To see the input data, select Input log flow > Start.
- To see the output data, select Output log flow > Start.
You can use labels to filter the messages and sample only the matching ones.
-
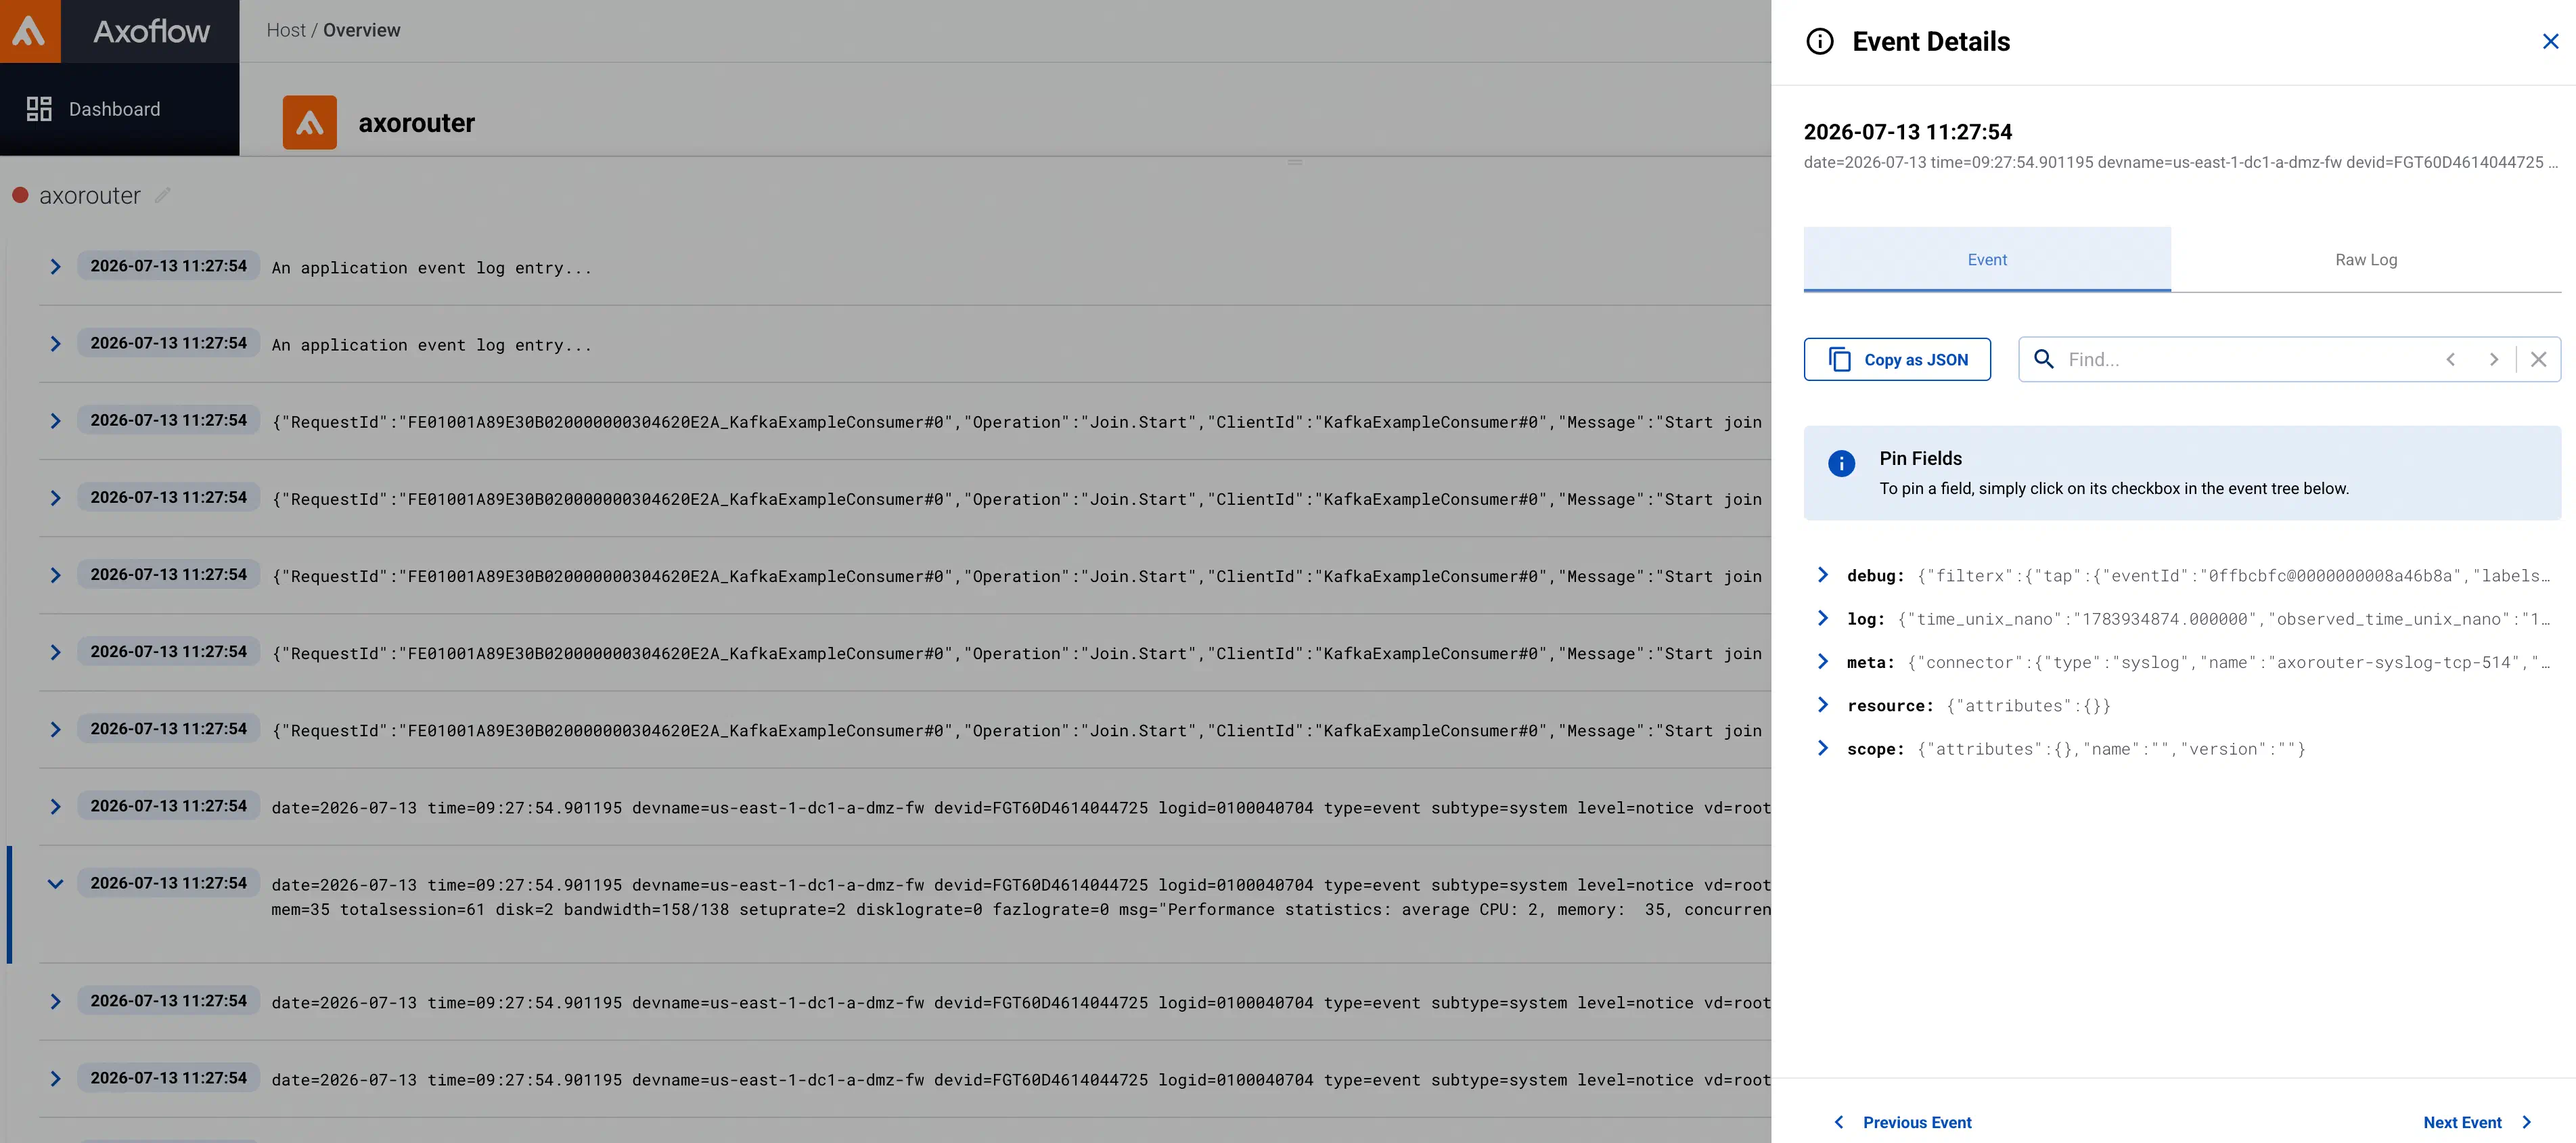
When the logs you’re interested in show up, click Stop Log Tap, then click the icon next to a log message to see its details. For details about the message schema and the displayed fields, see Message schema reference. To also display AxoRouter’s internal representation of the message, see Show debug data.
 Note
NoteFor sources that are not yet registered in the AxoConsole host database, the Register source button is shown at the end of the message. Click it to add the source to AxoConsole: this will allow attributing the logs coming from the given source as such, enriching the messages, the analytics data, as well as the Topology page.
 Note When using Log tapping, ETW events look a bit weird: the body of these events is empty. That’s normal, the reason for that is that everything is sent as metadata.
Tap service logs
Display the logs of the log collector service, complete the following steps. AxoConsole supports service log tapping on AxoRouter and Axoflow agent for Linux hosts.
-
Find the host you want to tap.
- Select the AxoRouter on the Topology or Routers page.
- Select the Axoflow agent on the Topology or Sources page.
Alternatively, select
⌘/Ctrl + Kand enter the name of the host. -
To start log tapping instantly, select Services > ✓ Service log in the row of the
axorouter-syslogoraxoflow-otel-collector.serviceservice.To filter the logs or to tap the logs of a specific service, select ⋮ Host Options > Tap service logs and complete the following steps.
-
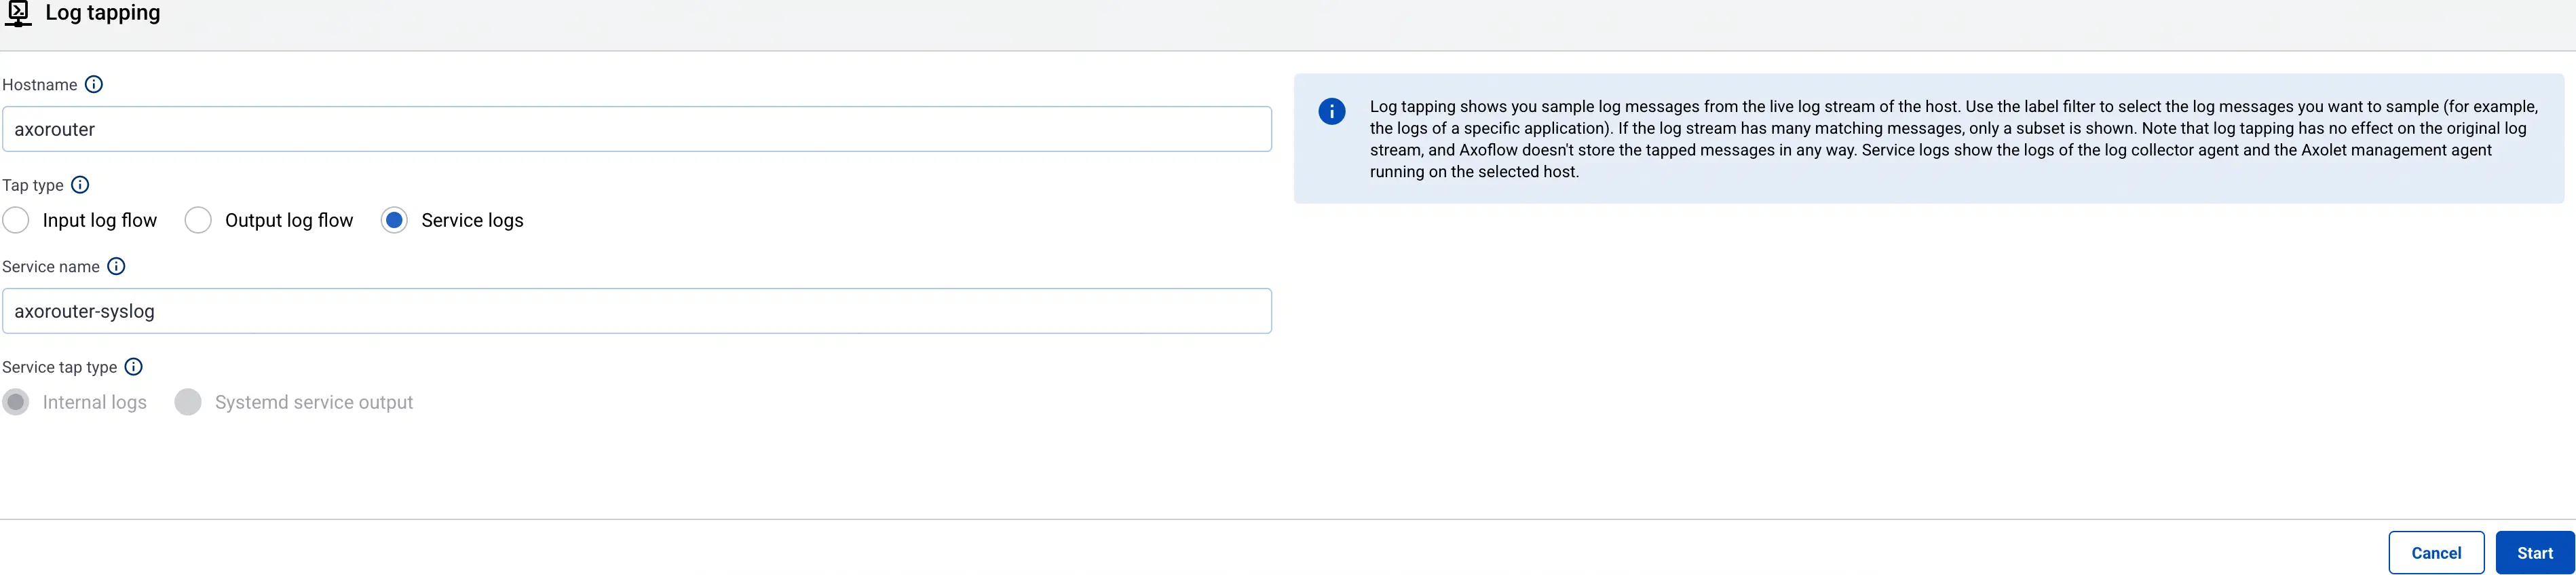
Select Service logs.
-
Set the Service name field to see the logs of a specific service.
Depending on the configuration of the host, the following services can be available:
- axoflow-otel-collector: The collector agent on edge hosts.
- axolet: The monitoring and management agent for Axoflow pipeline elements.
- axorouter-resolver: A service for retrieving host data from external CMDB systems.
- axorouter-syslog: The main processing element of AxoRouter deployments.
- axorouter-wec: The service that handles the Windows Events connector (WEC).
- axostore: The service that handles AxoStore on the host. Only available if there are stores configured on the host.
If systemd is available on the host, select Systemd service output to show the logs of the service from the systemd journal. Otherwise, the Internal logs of the service are available.
-
-
When the logs you’re interested in show up, click Stop Log Tap, then click the icon next to a log message to see its details.
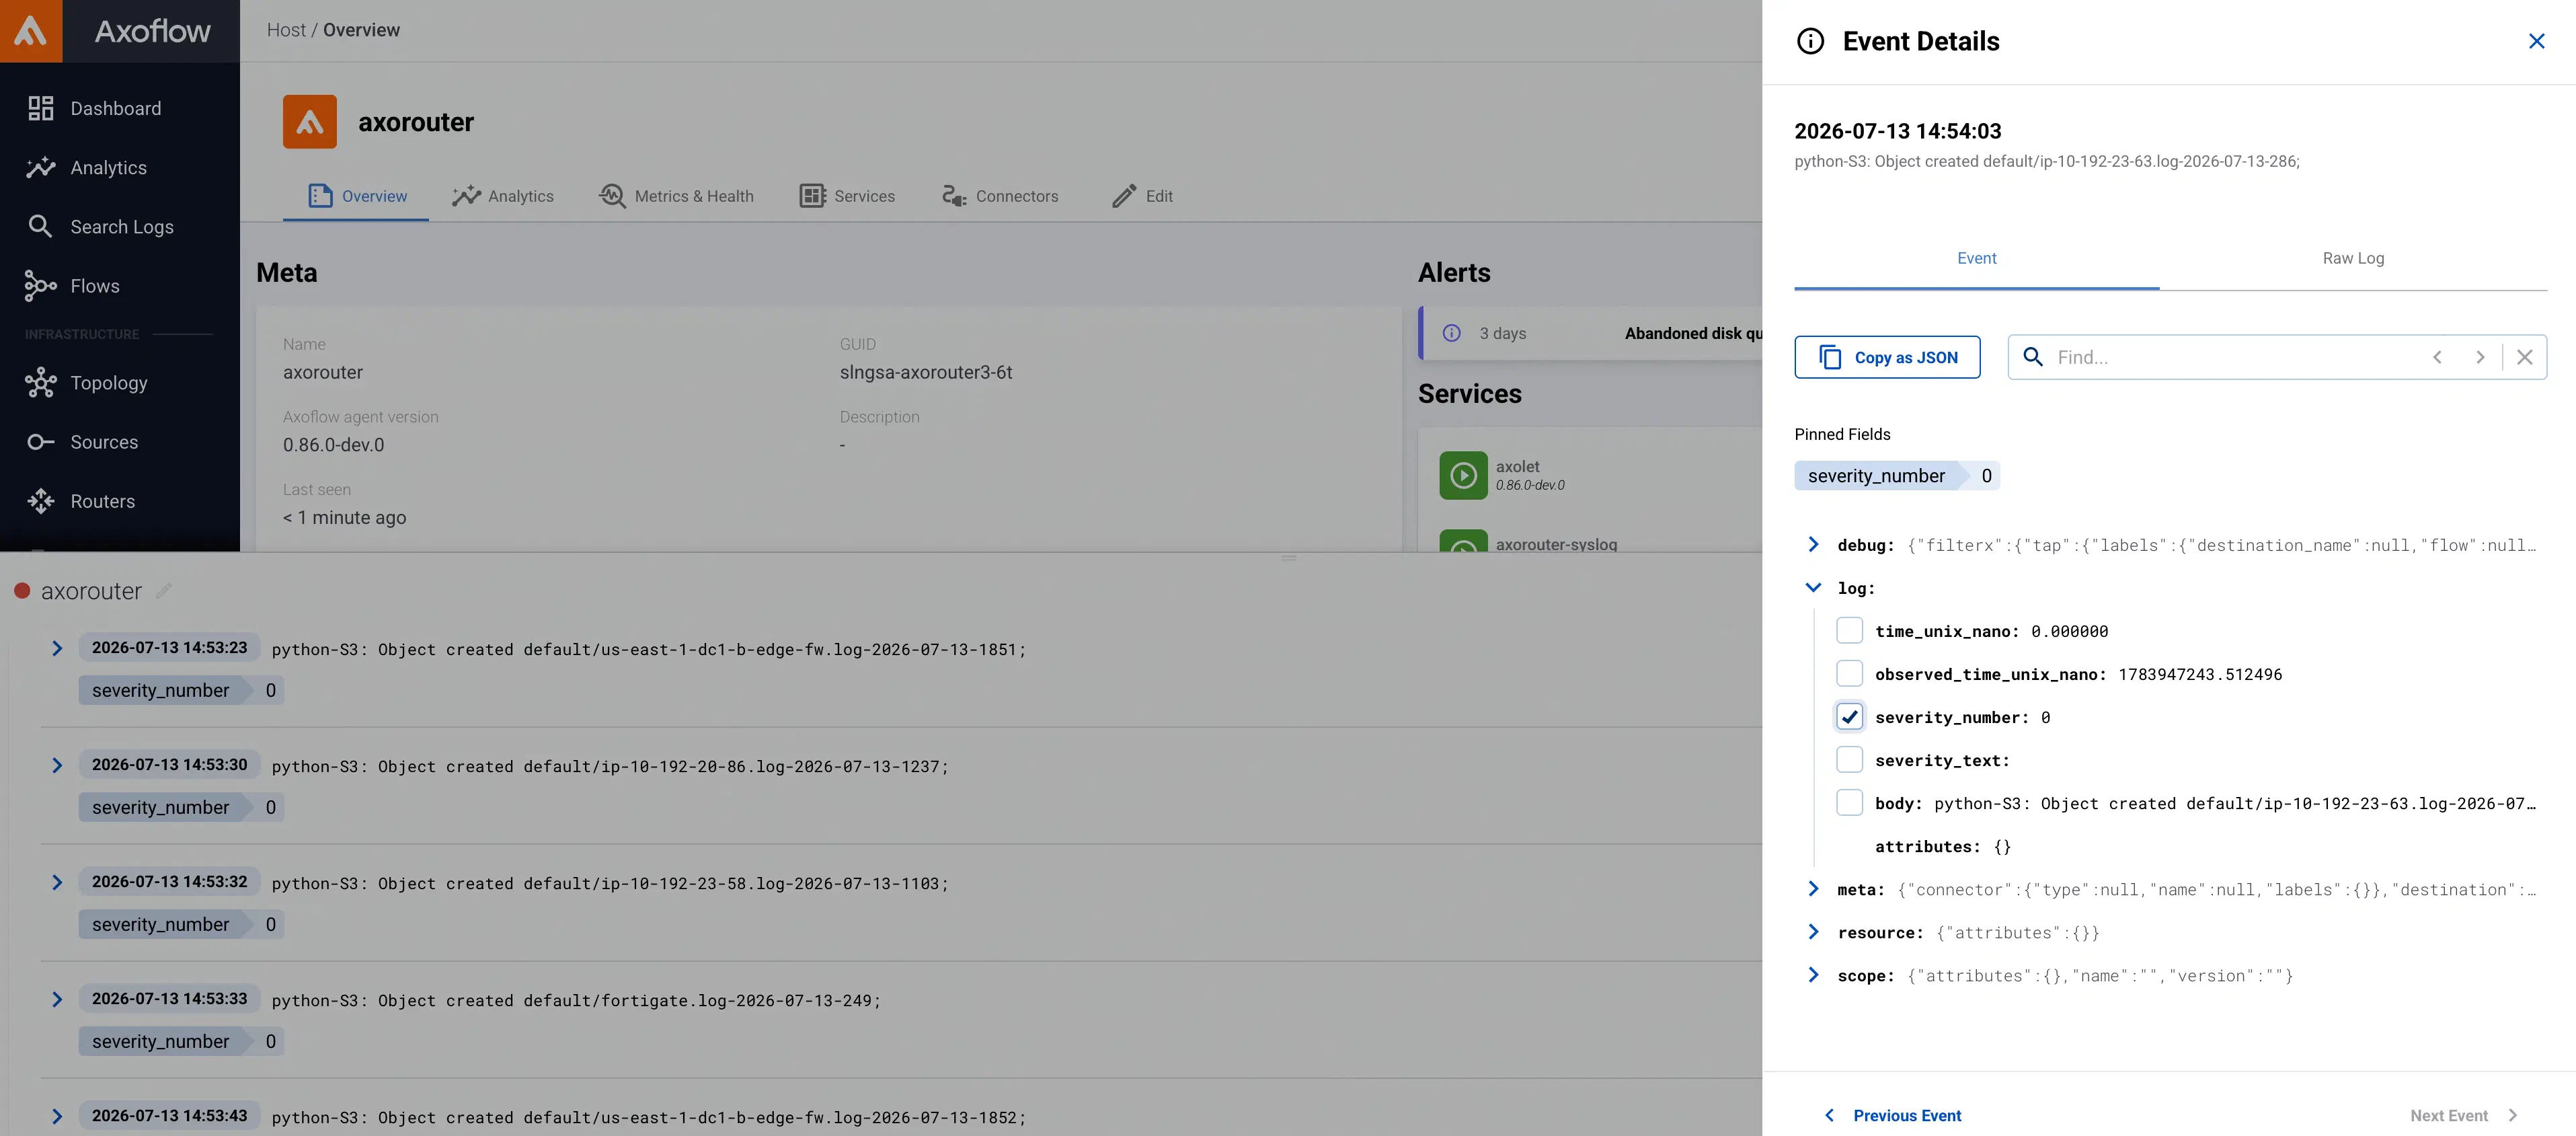
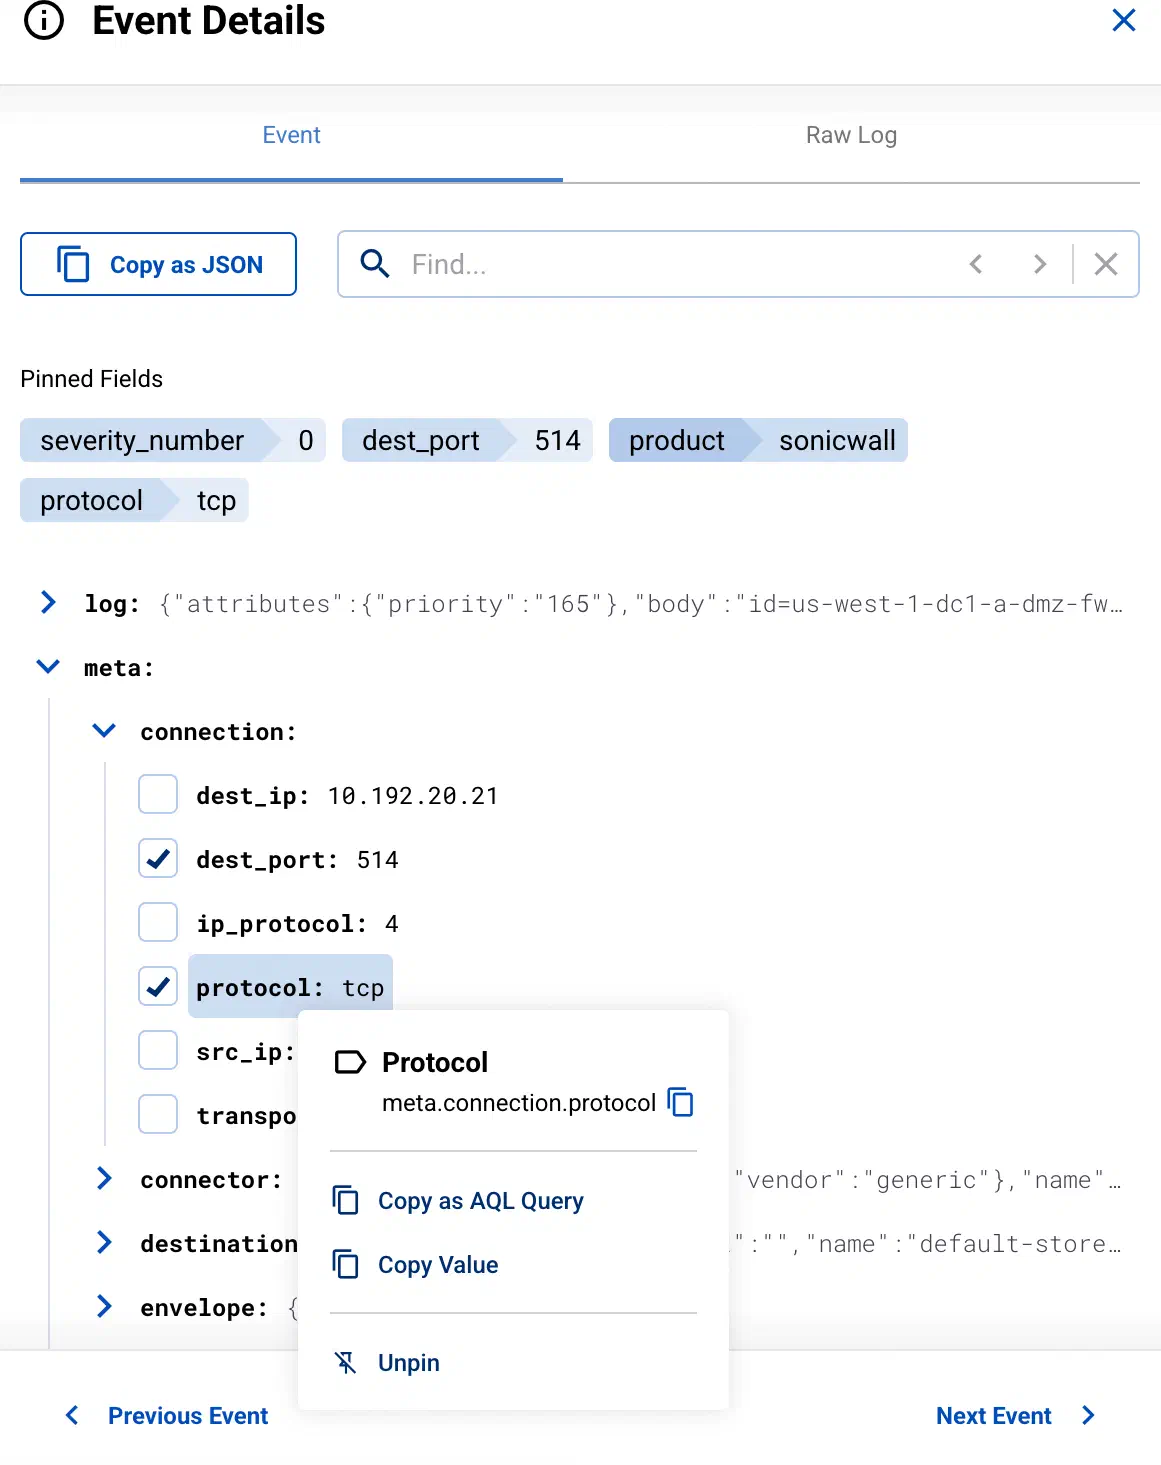
The Event Details panel allows you to inspect a specific event. For details on the available fields and their structure, see Message schema reference.
-
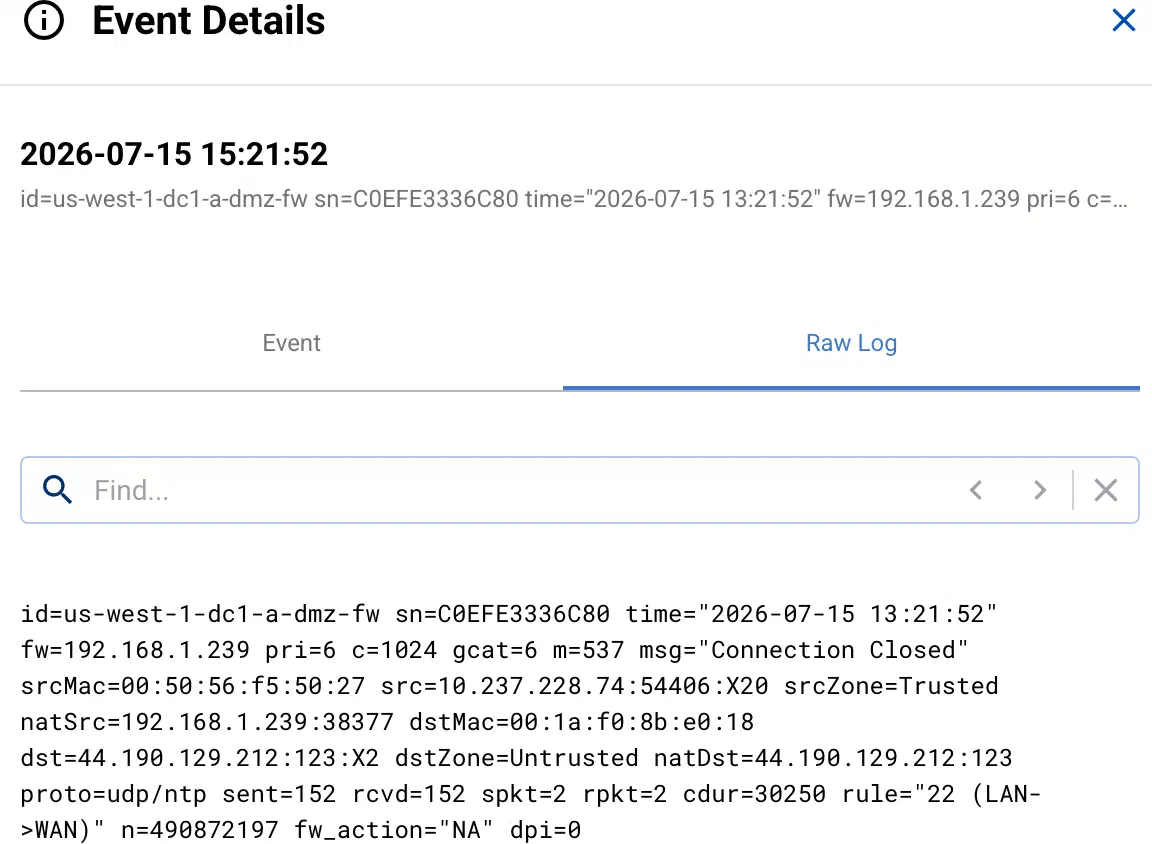
To display the original log message, select Raw Log.
-
To copy the entire event as JSON to the clipboard, select Copy as JSON.
-
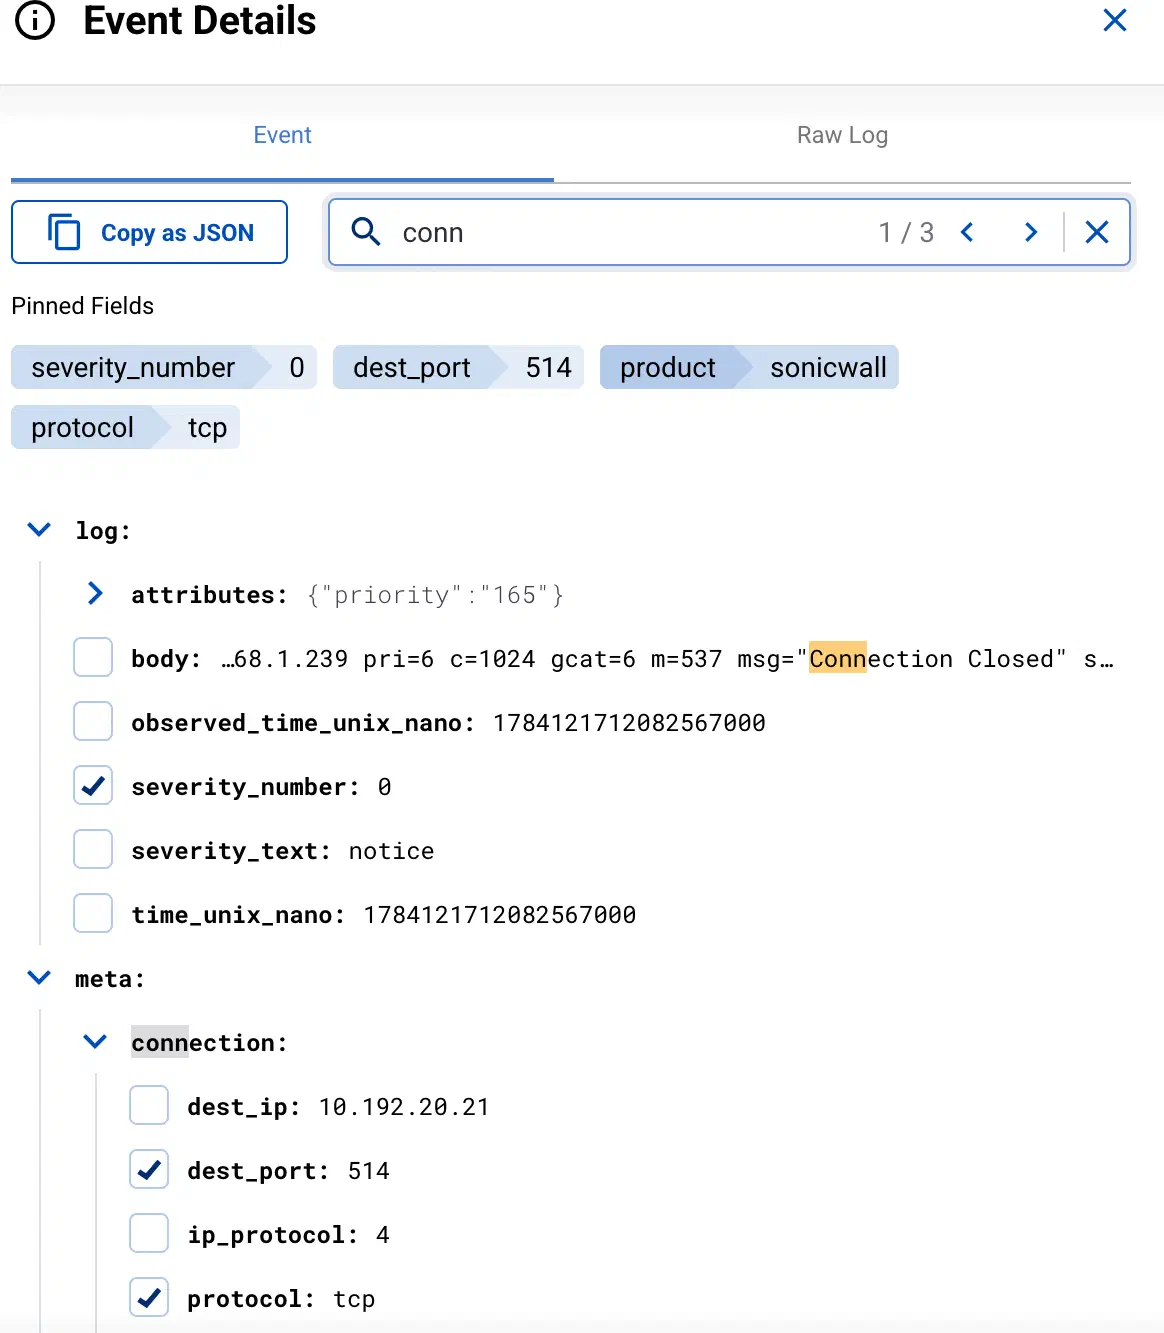
To search the event body and metadata, enter a search keyword into the Find field. This searches for the string on the Event Details panel, including the log, metadata, or label names and values.
-
To add a field to the Pinned Fields and display it for every event, click the checkbox before the field. Pinned fields show up in the event details, and also in the list of the events, making it easy to get a quick glance on the distribution of the field values. They’re included as separate fields when you Export the search results into a CSV file.
To unpin a field, select the field in any of the events, then select Unpin from the local menu.
-
To copy the name or the value of a field, select the name of the field, then select or Copy Value.
-
To copy an AQL query that matches this field and its current value, select the name of the field, then select Copy as AQL Query. You can paste this query into the AQL search field, and use it for filtering.
-
If the field refers to a pipeline element in Axoflow (for example, a flow in the
meta.flowfield, a store, or an AxoRouter), you can jump to the page of the related element.
-
Service status messages
While a tapping session is active, AxoConsole shows status messages about the tapped service inline in the log stream, color-coded by severity. These messages don’t come from your data sources. Axoflow inserts them to tell you when the service is restarted or its configuration is reloaded, for example, after you save a change to a flow or a connector rule. That way you can tell whether a change in the messages you see is the result of your configuration change, and notice when applying the new configuration failed.
The following status messages can appear:
| Message | Severity | Meaning |
|---|---|---|
Restarting service |
notice | AxoConsole has started restarting the service. |
Service restart initiated successfully |
notice | The service has accepted the restart request. |
Restart failed: <details> |
error | The service couldn’t be restarted. |
Reload complete |
notice | The service is running with the new configuration. |
Reload failed: <details> |
error | The service couldn’t apply the new configuration, and keeps running with the previous one. Usually this means that the new configuration is invalid, for example, a FilterX processing step contains a syntax error. |
Reload blocked due to missing config files: <details> |
error | The service couldn’t apply the new configuration because a file it references (such as a certificate) isn’t available on the host. |
Show debug data
The details of a tapped message can include a debug field that shows how AxoRouter represents the message internally:
debug.filterxcontains the FilterX variables that are set when the message reaches the tapping point.debug.msgcontains the name-value pairs of the message.
These fields are hidden by default. To display them, open the details of a message, then select Show Debug Data. The switch is available only for messages that have debug data.
Debug data is useful when you’re troubleshooting a processing step that doesn’t behave as you expect, or when Axoflow support asks you for it. For the fields of the message itself, see Message schema reference.
Filter the messages
You can add labels to the Filter By Label field to sample only messages matching the filter. If you specify multiple labels, only messages that match all filters will be sampled. For example, the following filter selects messages from a specific source IP, sent to a specific destination IP.
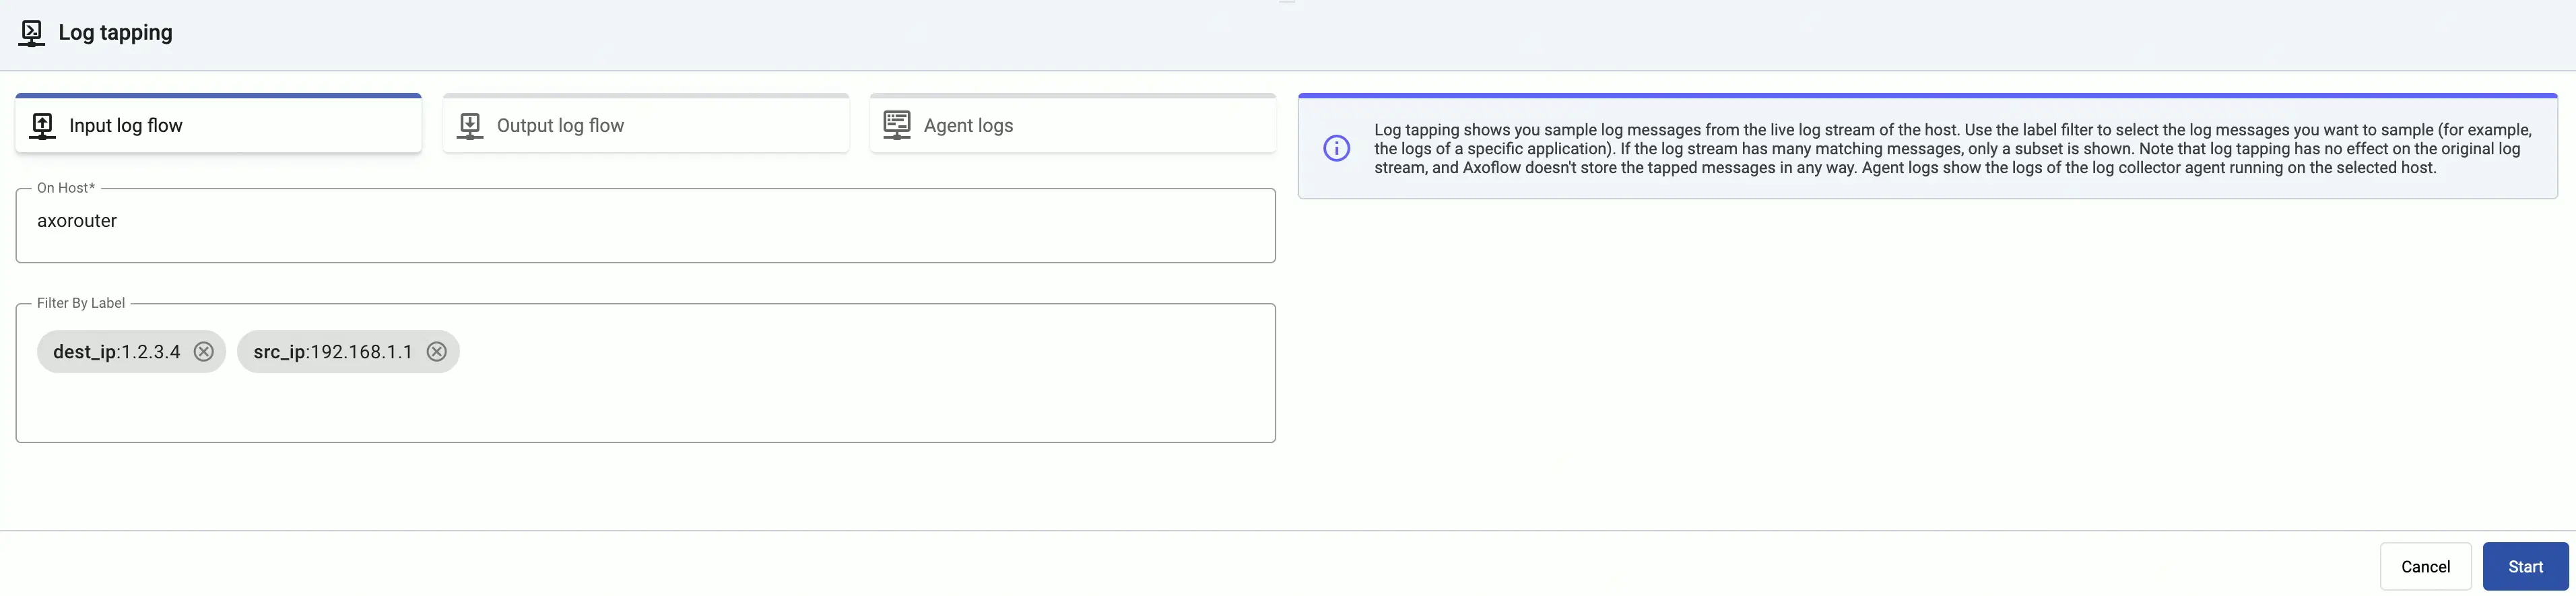
For details about the labels available for filtering, see Metrics schema.
To tap the messages received from edge hosts, you can use the related metrics labels of the edge collector, for example, edge_connector_type:windowsEventLog samples only the event log messages received from edge hosts. For details about the message schema and the available fields, see Message schema reference.
5 - Alerts
Axoflow raises alerts for a number of events in your security data pipeline, for example:
- a destination becomes unavailable or isn’t accepting messages,
- a host is dropping packets or messages,
- a host becomes unavailable,
- the disk queues of a host are filling up,
- abandoned (orphaned) disk buffer files are on the host,
- the configuration of a managed host failed to synchronize or reload,
- traffic of a flow has unexpectedly dropped,
- a new AxoRouter or Axolet version is available.
For the details of specific alerts, see Alerts reference.
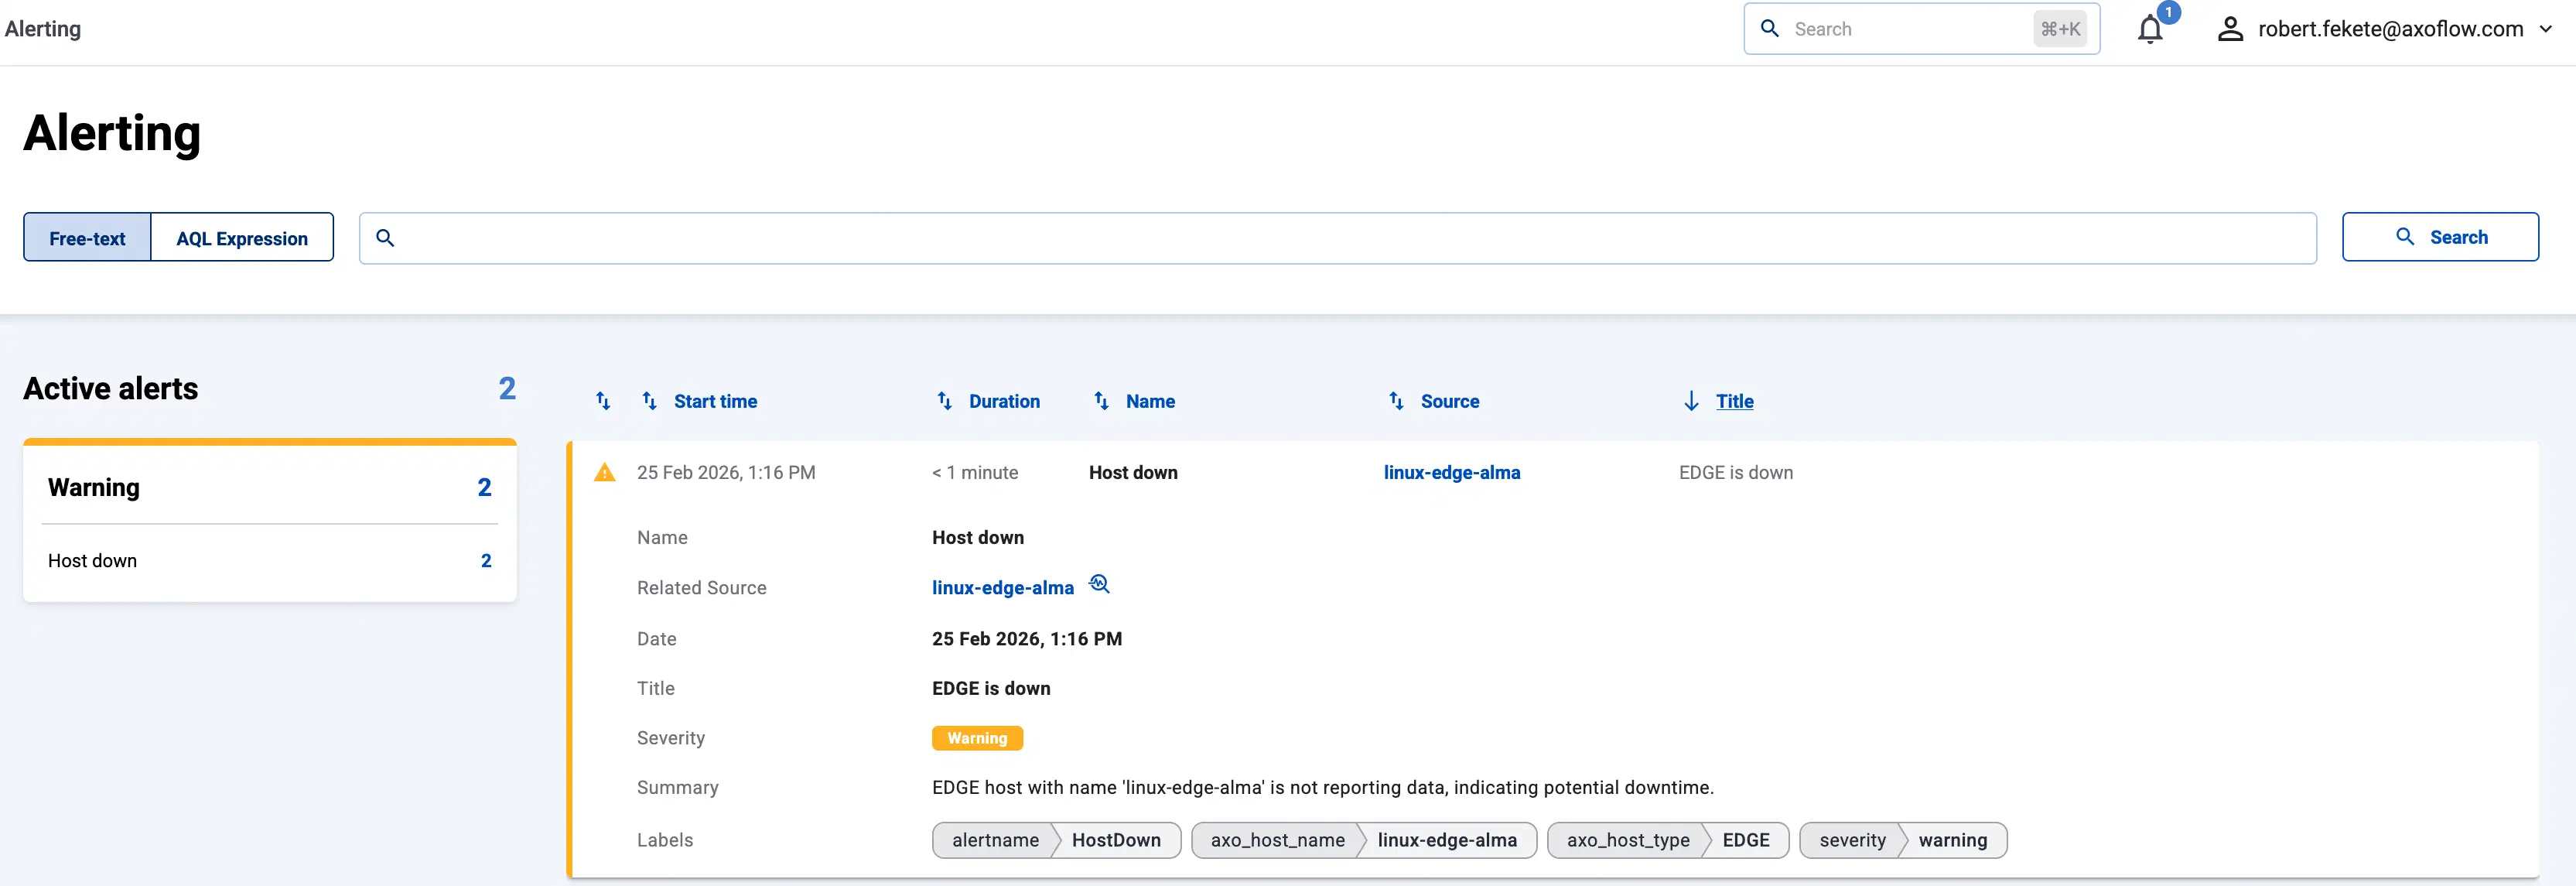
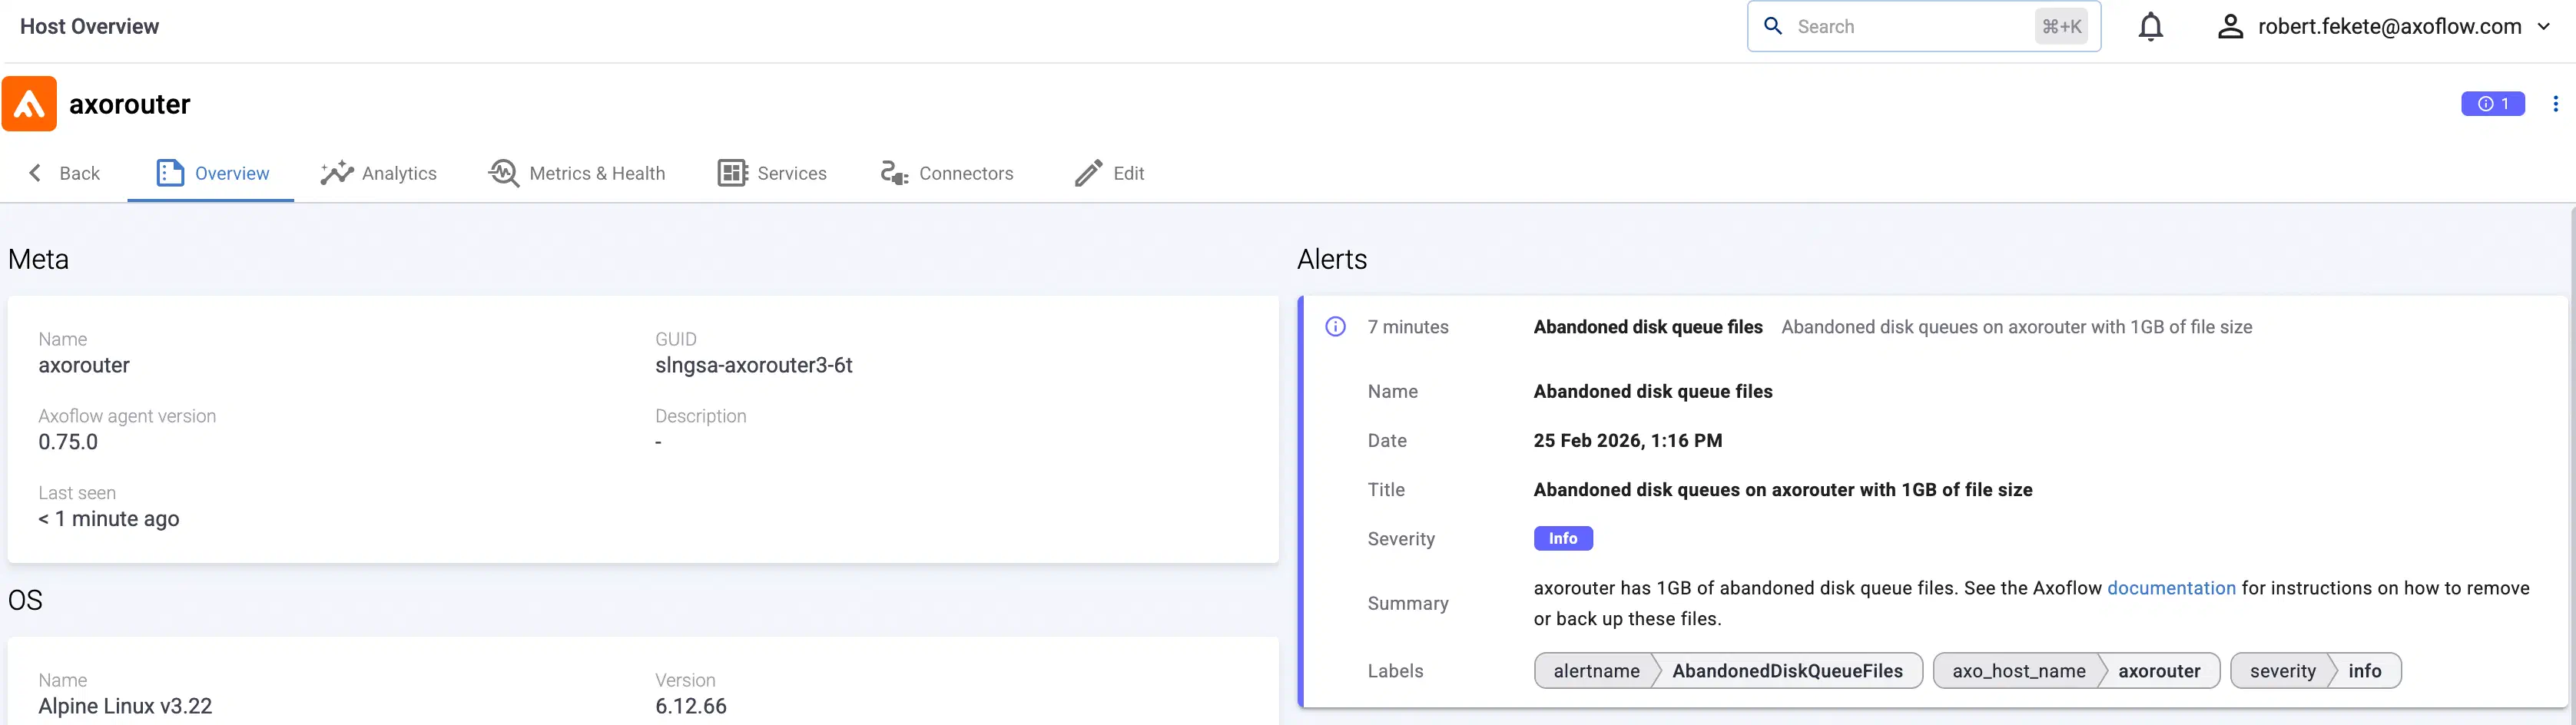
Alerts are indicated at a number of places:
-
On the Alerting page. Select an alert to display its details.
-
On the Topology page:
-
On the Overview page of the host:
-
On the Metrics & Health page of the host the alerts are shown as an overlay to the metrics:
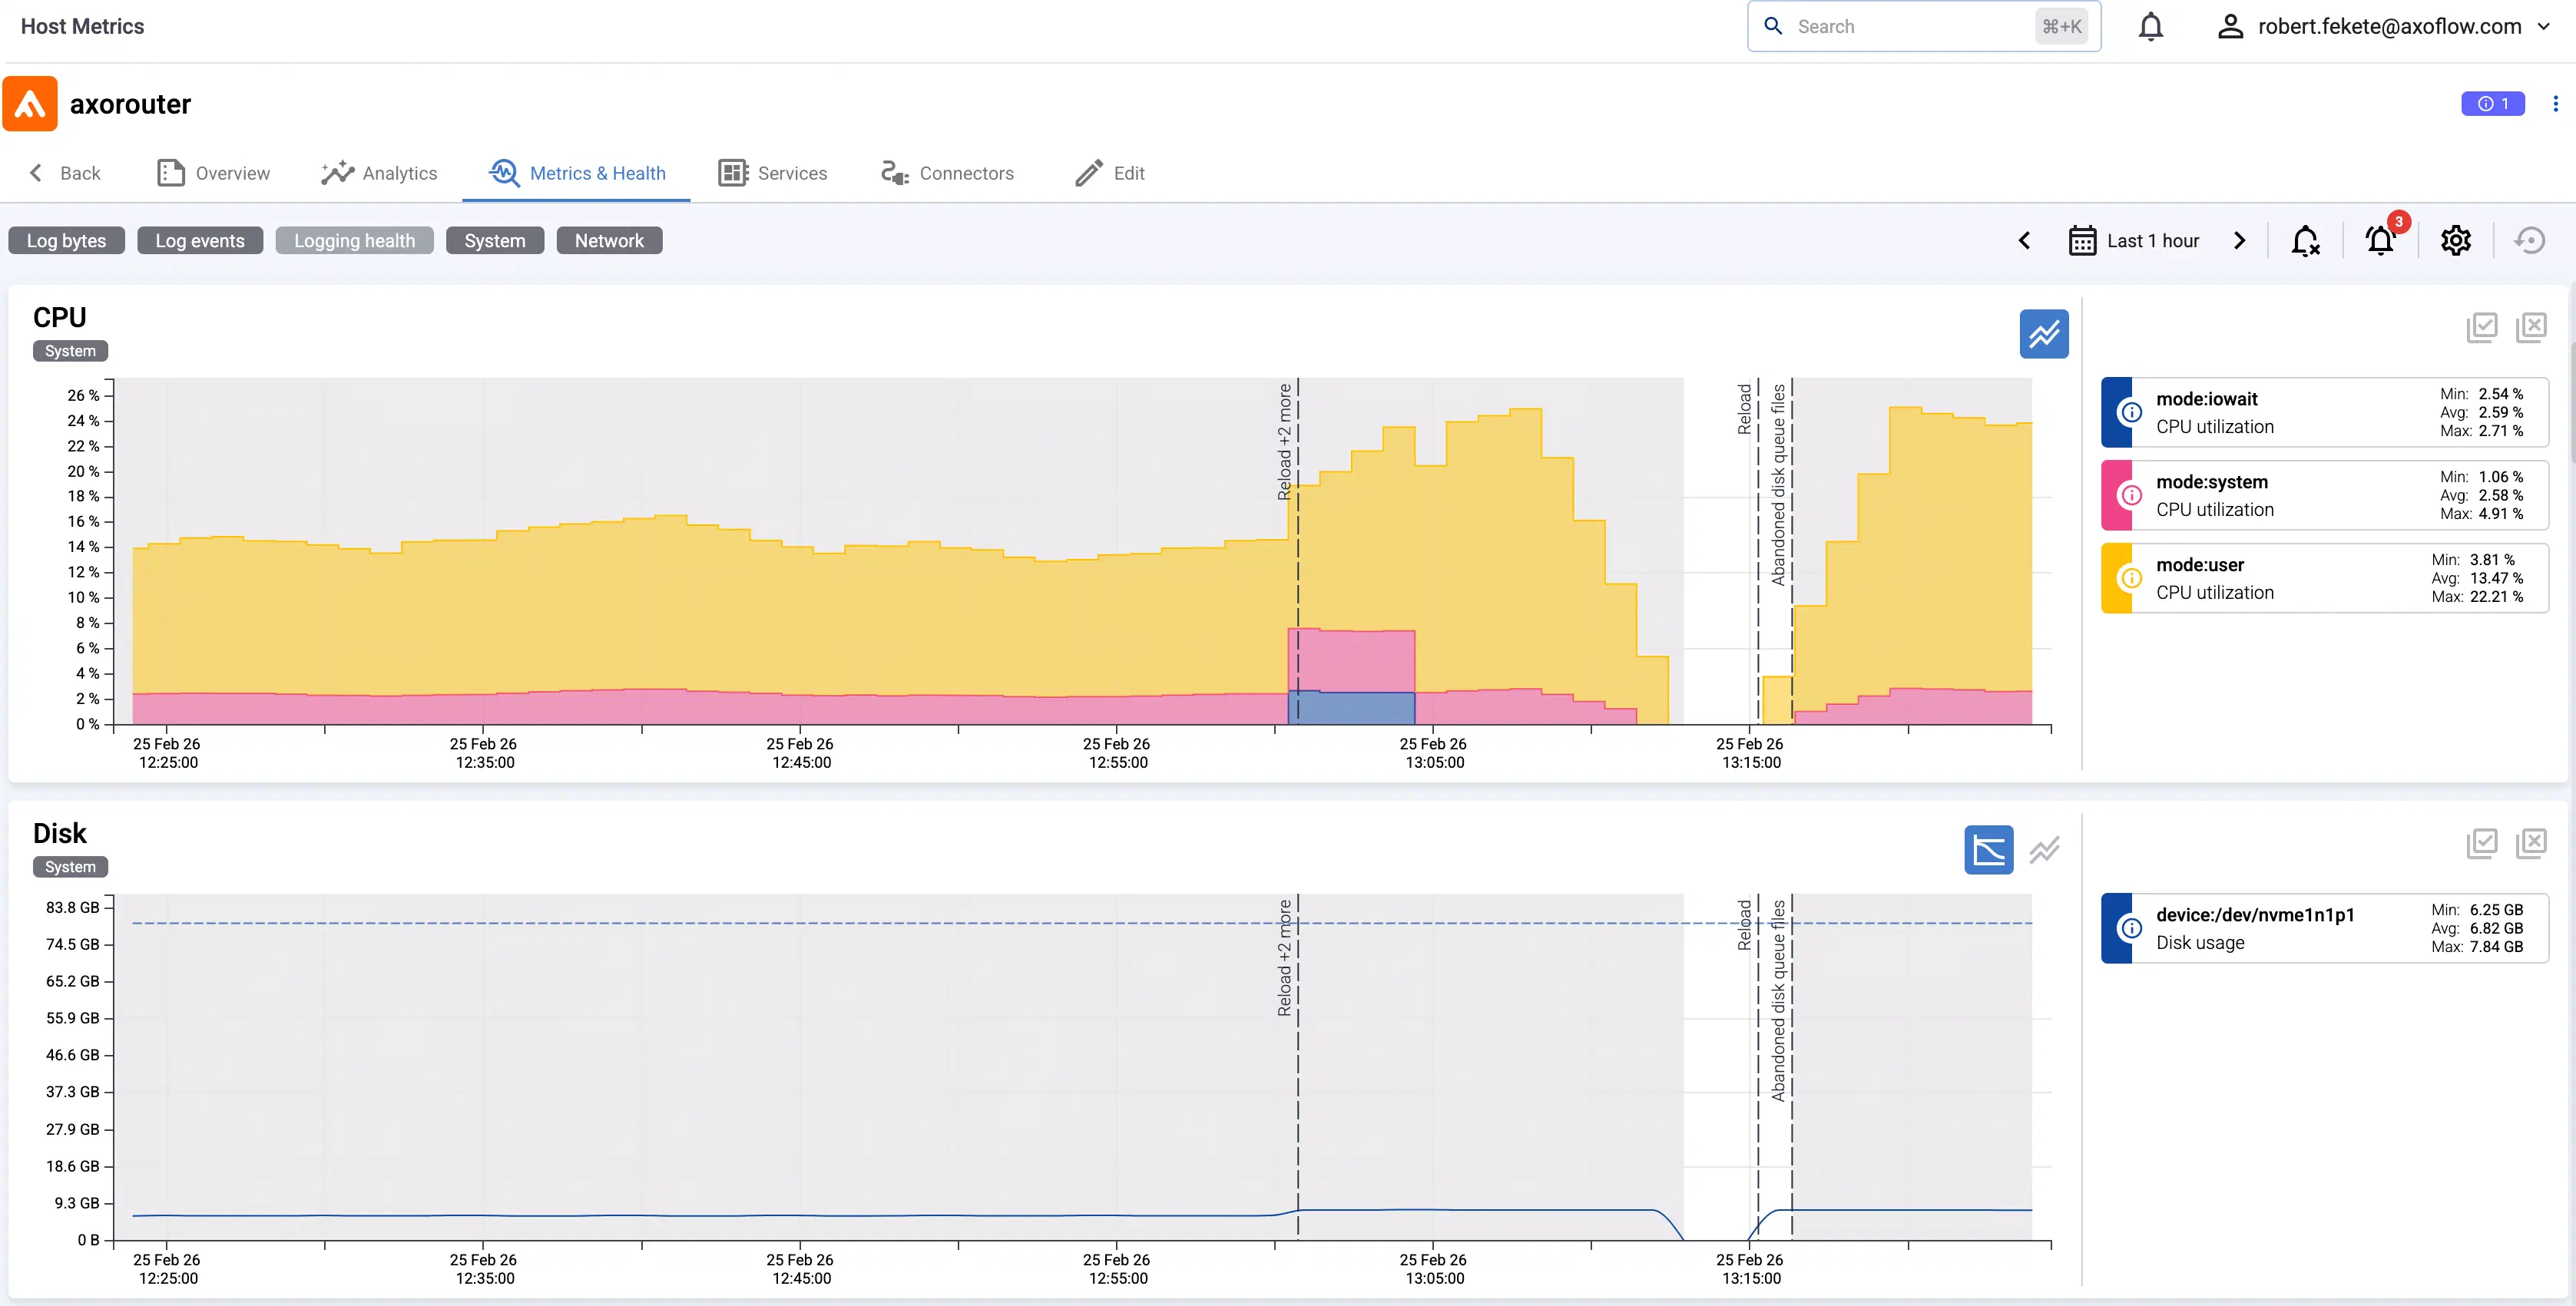
Filter alerts
You can use the Filter Bar on the Alerts page to search and filter for specific alerts.
The settings of the filter bar change the URL parameters of the page, so you can bookmark it, or share a specific view by sharing the URL.
-
Free-text mode searches in the following fields of the alerts: Id, Name, Title, Summary, Labels.
Basic Search is case insensitive. Adding multiple keywords searches for matches in any of the previous fields. This is equivalent to the
@ANY =* keyword1 AND @ANY =* keyword2AQL query. -
AQL Expression mode allows you to search in specific fields of the activity logs.
It also makes more complex filtering possible, using the Equals, Contains (partial match), and Match (regular expression match) operators. Note that:
- To execute the search, click Search, or hit ESC then ENTER.
- AxoConsole autocompletes the built-in and custom labels and field names, as well as their most frequent values, but doesn’t autocomplete labels and variables created by data parsing and processing steps.
- You can use the AND and OR operators to combine expressions, and also parenthesis if needed. For details on AQL, see AQL operator reference.
- The precedence of the operators is the following: parentheses, AND, OR, comparison operators.
- Use the usual keyboard shortcuts to undo (⌘/Ctrl + Z) or redo (⌘/Ctrl + Shift + Z) your edits.
Alerts have the following fields:
- Name: The name of the alert, for example,
Target down. - Related Source: The host where the alert event occurred.
- Date: The time when the alert triggered.
- Title: The title of the alert, for example,
<host> is down. - Severity: The severity level of the alert:
Info,Warning, orCritical. - Summary: A detailed description of the alert.
- Duration: How long the alert lasted.
- Labels: Labels related to the alert.
5.1 - Alerts reference
Host down (warning)
host-type host with name 'hostname' isn't reporting data, indicating potential downtime.
An edge or router host has stopped reporting data to the AxoConsole. Because the system tolerates short reporting gaps, the alert takes around seven minutes to fire after the host actually goes silent. The usual causes are loss of network connectivity from the host, Axolet being stopped on the host, or a hardware or operating-system failure on the host itself.
Related metrics: cpu, memory
Cert Expires (info)
host-type host with name 'hostname' uses a certificate that expires in less than 45 days. It should have been renewed automatically.
The client certificate that an edge or router host uses to authenticate to the AxoConsole will expire in less than 45 days.
Certificates should be renewed automatically; if this alert appears, automatic renewal has failed.
Restarting the axolet service on the affected host often triggers another renewal attempt. If the alert doesn't clear within five minutes, contact Axoflow support.
Stats level (info)
'hostname' is configured with a stats level of 0.
An axorouter-syslog (or another AxoSyslog-based) service on a host is configured with a stats level of 0,
so most metrics shown on the AxoConsole will be incomplete or missing for it.
The recommended stats level is 2. Add options { stats(level(2)); }; to the top of the main configuration file and reload the service.
See the AxoSyslog stats option reference.
High CPU (warning)
CPU usage at hostname has been above 90% for the last 15 minutes.
The average CPU usage across all cores on a host has been above 90% for at least 15 minutes. Sustained high CPU usage can prevent the host from keeping up with its workload, and may lead to message drops, packet drops, or processing delays.
Related metrics: cpu, droppedPacketsTotal, logInputEvents
Message drop (warning)
Messages have been dropped on hostname in the last 10 minutes.
An axorouter-syslog service on a host has dropped messages in the last 10 minutes.
This happens when a destination can't accept messages fast enough and flow control isn't configured to back-pressure the source.
Once the destination's output buffer overflows, further incoming messages are discarded and can't be recovered.
Related metrics: droppedPacketsTotal, logInputEvents, logOutputEvents
UDP packet drop (warning)
UDP packets have been dropped on hostname in the last 10 minutes.
A host has dropped UDP packets in the last 10 minutes.
The most common cause is that the kernel's UDP receive buffer is full: packets that arrive while the buffer is saturated
are silently discarded by the kernel before the service can read them.
An undersized socket buffer on the receiving connector is a frequent contributor (see also the AxorouterLowRmemMax alert).
Related metrics: droppedPacketsTotal, logInputEvents, logOutputEvents
Abandoned disk queue files (info)
There are abandoned disk queues on hostname. See the Axoflow documentation for instructions on how to remove or back up these files.
A disk queue file on a host is no longer attached to any running axorouter-syslog instance.
Such files occupy disk space and, if they contain messages, those messages remain stranded until they're manually recovered or wiped.
Use dqtool cat <filename> to inspect a file before removing it; see the
axorouter-ctl wipe-disk-buffer documentation
for the supported procedure.
Related metrics: logDiskQueue, logDiskQueueBytes
Abandoned messages (warning)
There are messages abandoned in disk queues. See the Axoflow documentation for instructions on how to remove or back up these files.
A disk queue file on a host is no longer attached to any running axorouter-syslog instance, and that file still contains messages.
Those messages remain stranded until they're manually recovered or the file is wiped.
Use dqtool cat <filename> to inspect a file before removing it; see the
axorouter-ctl wipe-disk-buffer documentation
for the supported procedure.
Related metrics: logDiskQueue, logDiskQueueBytes
Destination unreachable (warning)
Unreachable driver destinations. Check network connectivity and agent logs.
The axorouter-syslog service on a host has been unable to reach a configured destination for at least five minutes.
The alert fires per destination driver and address, so a single host with multiple broken destinations produces multiple concurrent alerts.
The service buffers messages for the unreachable destination in memory or on disk. AxoRouter may drop further messages once buffers fill up.
Check the destination's network reachability and the service's logs on the host.
Related metrics: droppedPacketsTotal, logMemoryQueue, logDiskQueue, logMemoryQueueBytes, logDiskQueueBytes, eventDelaySeconds
HTTP 5xx (warning)
High rate of HTTP response-code on hostname to url
HTTP requests sent to a destination URL have been returning 5xx responses in the last minute, and no 2xx responses have been observed for the same URL in that window. The alert fires once per destination URL and response code, so a destination returning several distinct 5xx codes can produce several alerts. A 5xx response typically points to a server-side problem (at the destination, or in a proxy in front of it) rather than to a sender-side configuration mistake.
Related metrics: droppedPacketsTotal, logOutputEvents, logDiskQueueBytes
HTTP 4xx (warning)
Increased rate of HTTP response-code on hostname to url
HTTP requests sent to a destination URL have been returning 4xx responses in the last minute, and no 2xx responses have been observed for the same URL in that window. The alert fires once per destination URL and response code, so a destination returning several distinct 4xx codes can produce several alerts. A 4xx response usually indicates a problem at the sender side rather than a fault at the destination: invalid credentials, missing permissions, a target resource (bucket, stream, topic) that doesn't exist at the destination, or a malformed request.
Related metrics: droppedPacketsTotal, logOutputEvents, logDiskQueueBytes
gRPC error (warning)
Increased rate of gRPC response-code responses on hostname to driver
gRPC requests sent to a destination have been returning non-ok status codes in the last minute.
The alert fires once per destination URL, driver, topic, and response code.
Common causes include misconfigured credentials, missing permissions, or a target resource (bucket, stream, topic)
that doesn't exist at the destination.
Related metrics: droppedPacketsTotal, logOutputEvents, logDiskQueueBytes
Buffer filling up (warning)
Disk buffer path is predicted to fill up within 10 minutes on hostname
The remaining capacity of a disk buffer on a host is trending down fast enough that, at the current rate, it's predicted to fill up within the next 10 minutes. The alert fires per disk buffer path, so a host with multiple buffers can produce multiple alerts. Once a disk buffer fills up entirely, the service stops being able to enqueue further messages for the affected destination and may start dropping them.
Related metrics: logDiskQueueBytes, networkInputBytes
Buffer is full (critical)
Disk buffer path is filled up on hostname
A disk buffer on a host has filled up: the service can't enqueue further messages for the affected destination. Messages may be dropped until the buffer drains enough to accept new writes, which requires either the destination to start accepting traffic again or the buffer to be enlarged.
Related metrics: logDiskQueueBytes, networkInputBytes
Config Sync Error (warning)
An error occurred on host hostname during configuration synchronization for service service-id. Check the axolet logs for details.
Axolet on a host has been unable to write a new configuration to disk for at least five minutes. The previously synchronized configuration remains in place, so the managed services on the host keep processing traffic, but changes made in the AxoConsole won't take effect on this host until synchronization succeeds again. Common causes include a filesystem permissions issue or a missing target directory on the host.
Config Load Error (warning)
Agent configuration load failed on hostname for service service-id. Check the axolet logs for details.
An axorouter-syslog service on a host failed to load a new configuration. The previously loaded configuration remains active,
so traffic processing continues, but changes made in the AxoConsole won't take effect on this host
until the load succeeds. Common causes include a syntactically invalid generated configuration, or a
missing file on the host (see also the ServiceMissingFile alert).
WEC Config Generation Error (warning)
WEC configuration generation failed on 'hostname' for service 'service-id'. Contact Axoflow support.
Configuration generation for the Windows Event Collector service on a host has been failing for at least five minutes. The host continues to use the last successfully generated WEC configuration, but changes made in the AxoConsole don't reach this host until generation succeeds again. This typically indicates an internal issue and should be reported to Axoflow support.
AxoStore Config Generation Error (warning)
AxoStore configuration generation failed on 'hostname' for service 'service-id'. Contact Axoflow support.
Configuration generation for the AxoStore service on a host has been failing for at least five minutes. The host continues to use the last successfully generated AxoStore configuration, but changes made in the AxoConsole don't reach this host until generation succeeds again. This typically indicates an internal issue and should be reported to Axoflow support.
Flow stuck in error state (warning)
Unable to provision paths for Flow flow due to error state. Check AxoConsole for details.
A Flow is in an error state, so the system can't provision its data paths. The Flow's status on the AxoConsole contains the underlying reason. Until the error is resolved, traffic that would have flowed through this Flow isn't processed.
Flow has no traffic (warning)
Flow flow has no traffic. Check AxoConsole for details.
A Flow used to have inbound or outbound traffic but currently has none. The alert fires per Flow and traffic direction. A Flow that has never received traffic doesn't trigger this alert; it only fires when previously flowing traffic has stopped. Common causes are an upstream source becoming silent, a configuration change that disabled or rerouted the source, or a Flow selector that no longer matches the intended sources.
Related metrics: logDiskQueueBytes, networkInputBytes
AxoRouter service version mismatch (warning)
AxoRouter hostname has a service service-id (version service-version) that doesn't match its axolet's version version. It may be due to a misconfigured deployment.
An AxoRouter host has a managed service whose binary version doesn't match the host's Axolet version. Service and Axolet versions normally move together; a mismatch usually points to a misconfigured deployment or to an in-progress upgrade that didn't complete. Contact Axoflow support if the mismatch doesn't clear on its own.
Suboptimal worker count (info)
Destination id on hostname is using more active partitions than workers. Consider increasing the number of workers.
An output destination on a host is using more active worker partitions than it has configured workers, which means it could be processing data with more parallelism than it has been allowed. The alert fires per destination. Increasing the worker count on the destination so it matches or exceeds the number of active partitions usually improves throughput.
Related metrics: logOutputEvents, eventDelaySeconds
Update available (info)
Axoflow software running on hostname has an update available, as it's running Axolet version while version is available.
A host is running a different Axolet version than the one the AxoConsole offers.
An update is available and can be applied through the standard Axolet upgrade procedure.
The AxoRouter service version normally moves together with the Axolet version, so this alert usually also implies
that a new AxoRouter version is available (see also the AxoRouterServiceVersionMismatch alert).
Host service has a missing file (warning)
Host hostname has a missing file which is required to write/reload config.
A managed service on a host can't have its configuration written or reloaded because a file it depends on is missing on the host. The alert fires per missing file, so a host with several missing files produces several alerts. The specific file name is available in the alert details. Place it in the expected location to resolve the issue.
Traffic without flows (warning)
There are no flows that have a router selector matching hostname, but it's receiving traffic. AxoRouter is dropping these events. Create a flow that matches it.
An AxoRouter is receiving input events, but no enabled Flow has a Router selector that matches it, so all received events are dropped. Either enable or create a Flow whose selector matches this AxoRouter, adjust the AxoRouter's labels so an existing Flow matches it, or create a Flow that explicitly drops these events if the traffic is unwanted.
Related metrics: droppedPacketsTotal, logInputBytes, logInputEvents, logOutputBytes, logOutputEvents, logMemoryQueue, logDiskQueue, logMemoryQueueBytes, logDiskQueueBytes, networkInputBytes, networkInputPackets, networkOutputBytes, networkOutputPackets
no `axorouter-syslog` service running (warning)
AxoRouter 'hostname' has no axorouter-syslog running
An AxoRouter host has no running axorouter-syslog service registered with the AxoConsole.
The AxoConsole can only configure an AxoRouter that has at least one such managed service present and running.
This usually happens when the service fails to start on the host or when its registration is incomplete.
It can also indicate that automatic service registration has been turned off.
AxoRouter Config Generation Error (warning)
AxoRouter configuration generation failed on 'hostname' for service 'service-id'. Check the axorouter_confgen controller logs in controller-manager for details.
Configuration generation for the AxoRouter service on a host has been failing for at least five minutes. The host continues to use the last successfully generated configuration, but changes made in the AxoConsole don't reach this host until generation succeeds again. This typically indicates an internal issue; the AxoConsole logs contain the underlying error, otherwise contact Axoflow support.
AxoStore Config Load Error (warning)
AxoStore configuration load failed on 'hostname' for service 'service-id'. Check the AxoStore logs for details.
The AxoStore service on a host failed to load its configuration. The previously loaded configuration remains in effect, so storage continues to operate, but configuration changes won't take effect on this host until the load succeeds. The AxoStore logs on the host contain the underlying reason.
WEC Unreachable Clients (info)
AxoRouter 'hostname' has value unreachable clients on WEC subscription 'subscription'. Reach out to Axoflow support on how to list unreachable clients.
An AxoRouter has one or more Windows Event Collector clients that have stopped sending heartbeats and are now considered unreachable. The alert fires per WEC subscription. Common causes are the WEC client service being stopped on the endpoint, a network problem between the endpoint and the AxoRouter, or a credential or policy change that broke authentication. Contact Axoflow support to obtain the list of unreachable clients.
Axolet frequently restarts (warning)
Axolet 'hostname' has restarted >3 times in the last 15 minutes. Check the startup logs.
The Axolet process on a host has restarted more than three times in the last 15 minutes, which suggests a crash loop or repeated process termination. The host's startup logs typically contain the underlying reason; contact Axoflow support if the cause isn't obvious.
Host service frequently restarts (warning)
'service-id' on 'hostname' has restarted >3 times in the last 15 minutes. Check the startup logs.
A managed service on a host has restarted more than three times in the last 15 minutes, which suggests a crash loop or repeated process termination. The alert fires per service. The host's startup logs and the service's own logs typically contain the underlying reason; contact Axoflow support if the cause isn't obvious.
Rejected syslog connections (warning)
AxoRouter 'hostname' has rejected connections in the last 5 minutes.
Check the maximum connections in the connector rule settings for 'id'.
An AxoRouter has rejected incoming syslog source connections in the last five minutes because the configured maximum number of concurrent connections has been reached. The alert fires per syslog connector. If the increased connection count is legitimate, raise the Maximum connections setting on the syslog connector in the AxoConsole.
Related metrics: connections, logInputEvents
Small UDP socket buffer (warning)
'hostname' has an UDP connector with a low socket buffer size configured.
An AxoRouter has at least one UDP connector with a socket receive buffer smaller than 8 MiB, and is actually receiving traffic on it.
An undersized receive buffer is a common cause of UDP packet loss under load.
Raise the net.core.rmem_max sysctl on the host operating system or increase the socket buffer size in the connector settings;
the recommended size is 32 MiB.
Related metrics: droppedPacketsTotal, logInputEvents
Conflicting flow control parameters on a host (info)
Conflicting flow control parameters on hostname. The combination causes unintended backpressure and reduces throughput. This alert triggers when a router forwards traffic between a source and a destination with Batch Timeout > 0, disk buffering turned off, and Log window size / Maximum connections less than Batch Lines * Number of Workers. See the alert description for remediation steps.
An AxoRouter forwards traffic between a source and a destination whose flow-control parameters conflict: the destination has Batch Timeout > 0, disk buffering is disabled, and Log window size / Maximum connections is less than Batch Lines × Number of Workers. This combination can cause unintended backpressure and reduce throughput. To resolve, do one of the following:
- increase Log window size on the source, or
- reduce Maximum connections on the source, or
- reduce Batch Lines on the destination, or
- reduce Number of Workers on the destination.
Conflicting flow control parameters on a destination. (info)
Conflicting flow control parameters on a destination: destination-name. The combination causes unintended backpressure and reduces throughput. This alert triggers when a router forwards traffic between a source and a destination with Batch Timeout > 0, disk buffering turned off, and Log window size / Maximum connections less than Batch Lines * Number of Workers. Batch Lines or Number of Workers is too high to be continuously fed by messages from source connectors.
A destination receives traffic from a source whose flow-control parameters conflict with the destination's: the destination has Batch Timeout > 0, disk buffering is disabled, and Log window size / Maximum connections is less than Batch Lines × Number of Workers. Batch Lines or Number of Workers is too high to be continuously fed from the source connectors, which can cause unintended backpressure and reduce throughput. To resolve, do one of the following:
- increase Log window size on the source, or
- reduce Maximum connections on the source, or
- reduce Batch Lines on the destination, or
- reduce Number of Workers on the destination.
Low disk free space (warning)
There is low disk free space on hostname.
A disk used by the AxoStore on a host has less than 10% free space. The alert fires per disk, so a host with multiple low disks produces multiple alerts. If a disk fills up entirely, the AxoStore on this host will be unable to persist new messages.
Store's disk is filling up (warning)
Store's disk is filling up on hostname
A disk used by the AxoStore on a host is filling up fast enough that, at the current rate, it's predicted to be full within the next six hours. The alert fires per disk. Once a disk fills up entirely, the AxoStore on this host will be unable to persist new messages.
Store's error rate increased (warning)
Store's error rate increased on hostname
The rate at which the AxoStore on a host emits errors of a given type has risen above the expected baseline. The alert fires per error type, so a single underlying problem may surface as several concurrent alerts. A persistent high error rate often degrades storage reliability and should be investigated promptly.
AxoStore doesn't persist messages (critical)
AxoStore doesn't persist messages from axorouter-syslog.
An AxoRouter is receiving traffic that's configured to be persisted in the AxoStore, but the AxoStore was unable to persist it. The unpersisted messages aren't available in the AxoConsole for tapping or search. Check the AxoConsole for the underlying reason and remediation steps.
6 - Private connections
6.1 - Google Private Service Connect
If you want your hosts in Google Cloud to access the AxoConsole without leaving the Google network, we recommend that you use Google Cloud Private Service Connect (PSC) to secure the connection from your VPC to Axoflow.
Prerequisites
Contact Axoflow and provide the list of projects so we can set up an endpoint for your PSC. You will receive information from us that you’ll need to properly configure your connection.
You will also need to allocate a dedicated IP address for the connection in a subnet that’s accessible for the hosts.
Steps
After you have received the details of your target endpoint from Axoflow, complete the following steps to configure Google Cloud Private Service Connect from your VPC to AxoConsole.
-
Open Google Cloud Console and navigate to Private Service Connect > Connected endpoints.
-
Select the project you want to connect to Axoflow.
-
Navigate to Connect endpoint and complete the following steps.
- Select Target > Published service.
- Set Target service to the service name you’ve received from Axoflow. The service name should be similar to:
projects/axoflow-shared/regions/<region-code>/serviceAttachments/<your-tenant-ID> - Set Endpoint name to the name you prefer, or the one recommended by Axoflow. The recommended service name is similar to:
psc-axoflow-<your-tenant-ID> - Select your VPC in the Network field.
- Set Subnet where the endpoint should appear. Since subnets are regional resources, select a subnet in the region you received from Axoflow.
- Select Create IP address and allocate an address for the endpoint. Save the address, you’ll need it later to verify that the connection is working.
- Select Enable global access.
- There is no need to enable the directory API even if it’s offered by Google.
- Select Add endpoint.
-
Test the connection.
-
Log in to a machine where you want to use the PSC using SSH.
-
Test the connection. Run the following command using the IP address you’ve allocated for the endpoint.
curl -vk https://<IP-address-allocated-for-the-endpoint>If the connection is established, you’ll receive an HTTP 404 response.
-
-
If the connection is established, configure DNS resolution on the hosts either for selected machines or the whole VPC.
Setting up selected machines to use the PSC
-
Add the following entry to the
/etc/hostsfile of the machine.<IP-address-allocated-for-the-endpoint> <your-tenant-id>.cloud.axoflow.io kcp.<your-tenant-id>.cloud.axoflow.io telemetry.<your-tenant-id>.cloud.axoflow.io -
Run the following command to test DNS resolution:
curl -v https://<your-tenant-id>.cloud.axoflow.ioIt should load an HTML page from the IP address of the endpoint.
-
If the host is running axolet, restart it by running:
sudo systemctl restart axolet.serviceCheck the axolet logs to verify that there’re no errors:
sudo journalctl -fu axolet -
Deploy the changes of the
/etc/hostsfile to all your VMs.
Setting up whole VPC networks to use the PSC
-
Open Google Cloud Console and in the Cloud DNS service navigate to the Create a DNS zone page.
-
Create a new private zone with the zone name
<your-tenant-id>.cloud.axoflow.io, and select the networks you want to use the PSC in. -
Add the following three A records, all of which targeted to the
<IP-address-allocated-for-the-endpoint>:<your-tenant-id>.cloud.axoflow.iokcp.<your-tenant-id>.cloud.axoflow.iotelemetry.<your-tenant-id>.cloud.axoflow.io