This is the multi-page printable view of this section. Click here to print.
Manage and monitor the pipeline
- 1: Topology
- 2: Hosts
- 2.1: Find a host
- 2.2: Host information
- 2.3: Custom labels and metadata
- 2.4: Services
- 3: Log tapping
- 4: Alerts
- 5: Private connections
1 - Topology
Based on the collected metrics, Axoflow visualizes the topology of your security data pipeline. The topology allows you to get a semi-real-time view of how your edge-to-edge data flows, and drill down to the details and metrics of your pipeline elements to quickly find data transport issues.
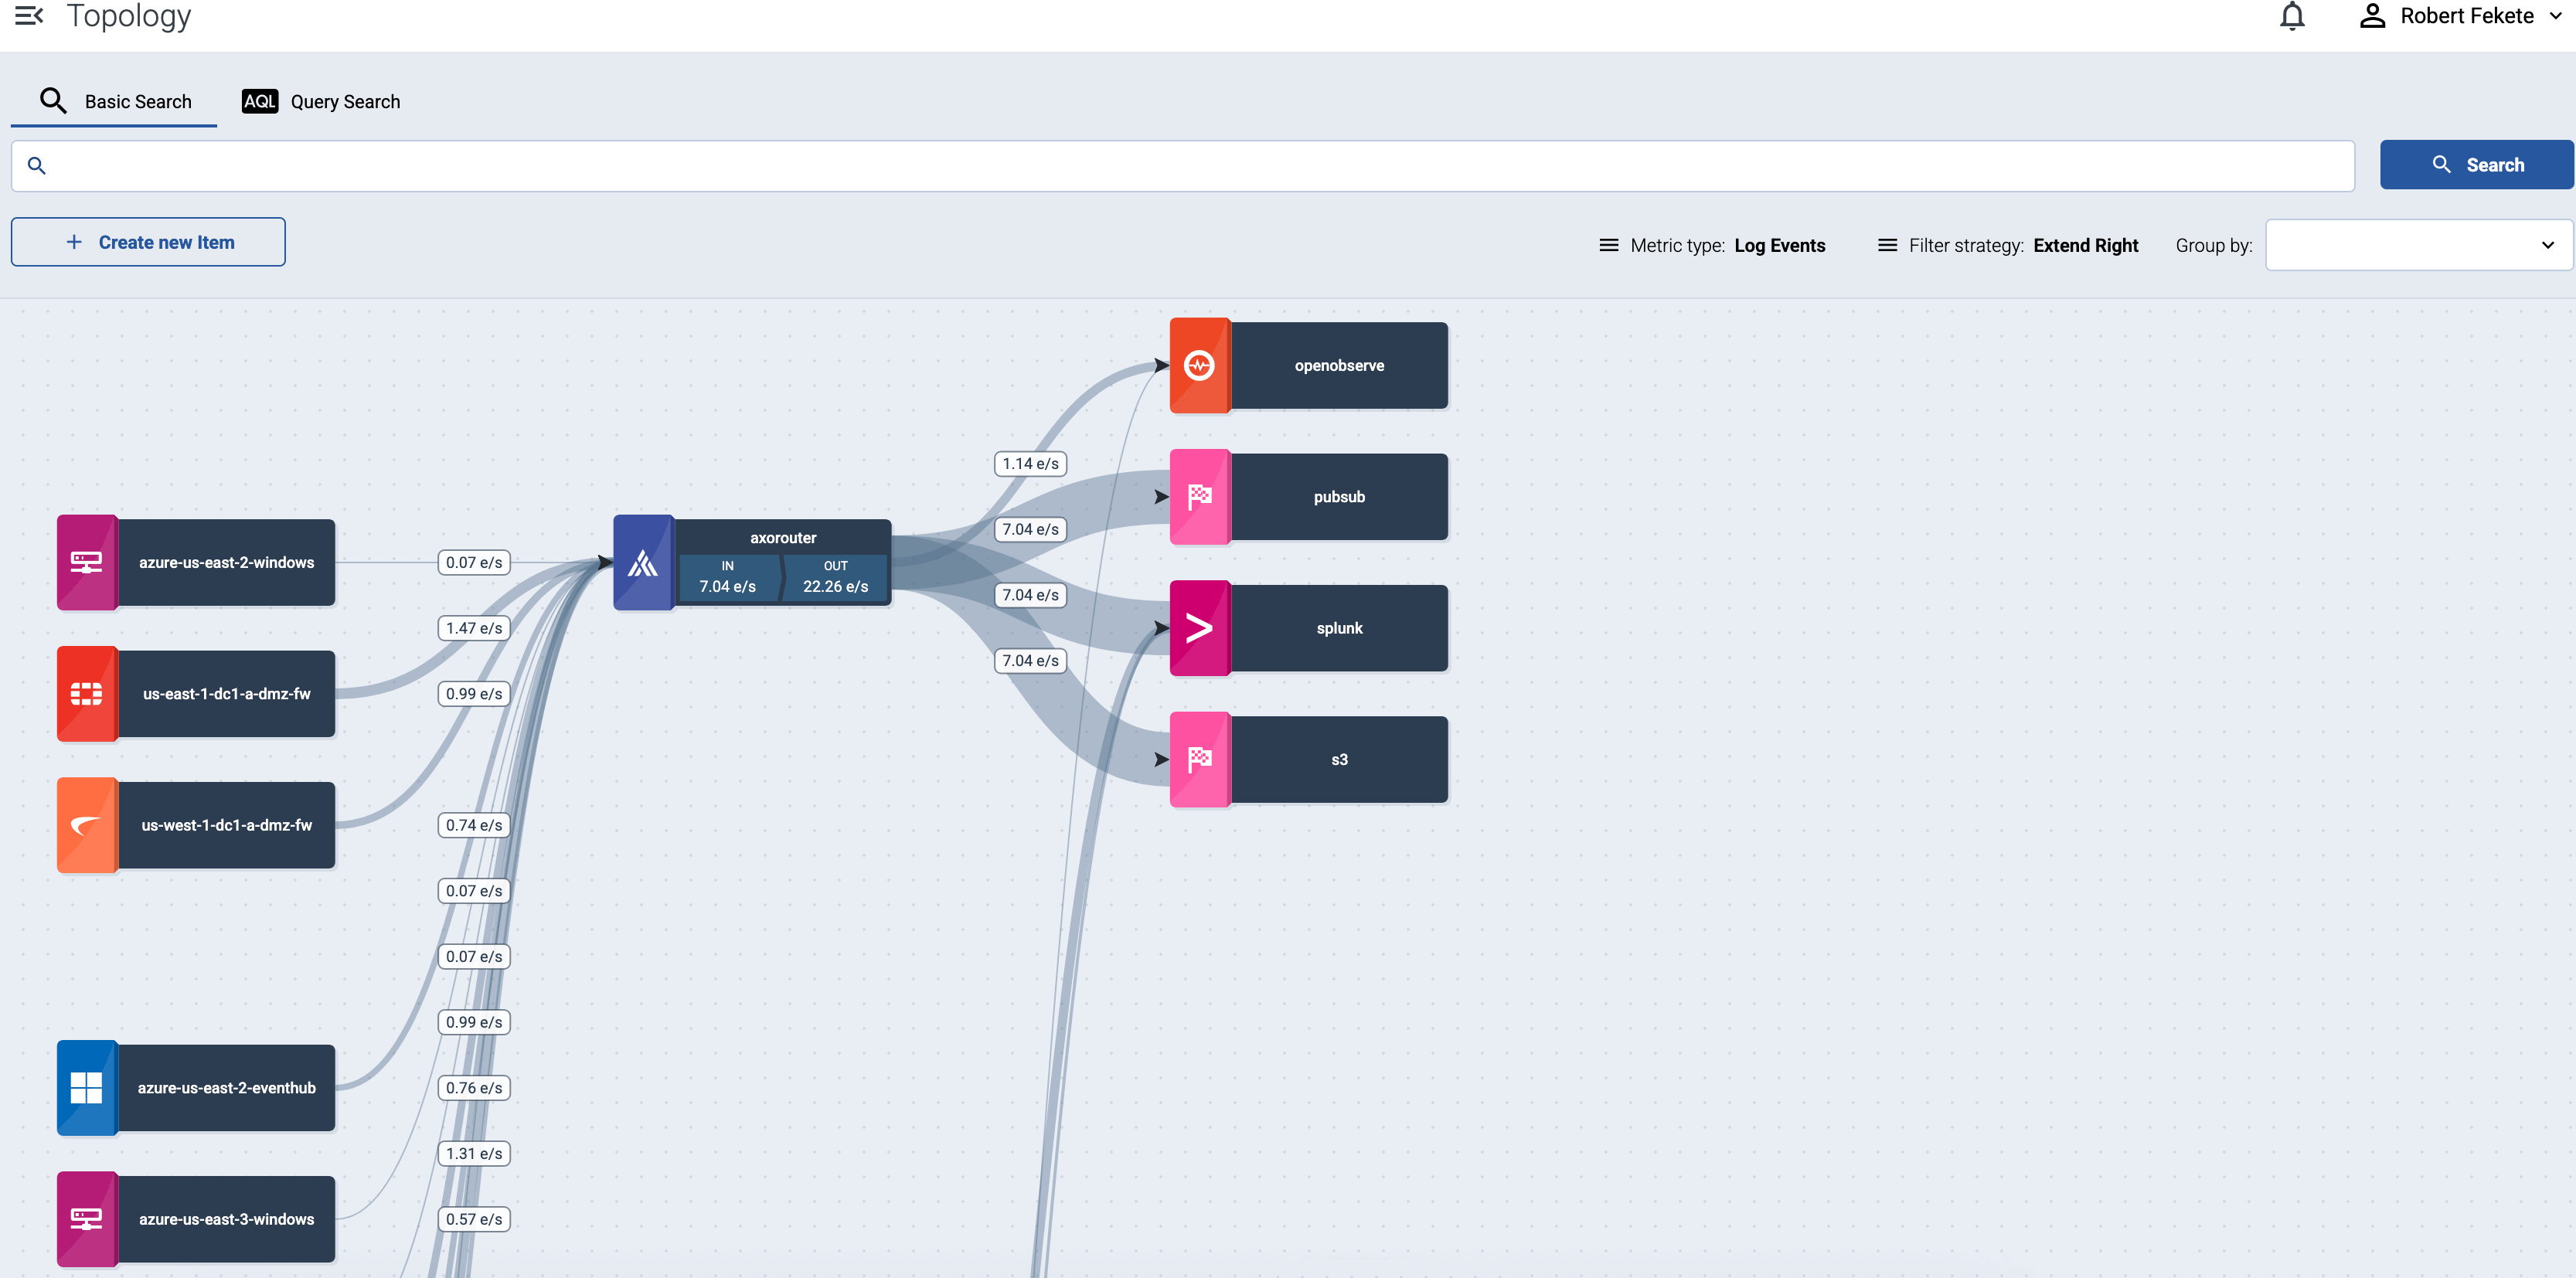
Select the name of a source host or a router to show the details and metrics of that pipeline elements.
If a host has active alerts, it’s indicated on the topology as well.
Traffic volume
Select bps or eps in the top bar to show the volume of the data flow on the topology paths in bytes per second or events per second.
Filter hosts
To find or display only specific hosts, you can use the filter bar.
-
Free-text mode searches in the values of the following fields of the host: Name, IP Address, GUID, FQDN, and the labels of the host.
Basic Search is case insensitive. Adding multiple keywords searches for matches in any of the previous fields. This is equivalent to the
@ANY =* keyword1 AND @ANY =* keyword2AQL query. -
AQL Expression mode allows you to search in specific fields or the labels of the hosts.
It also makes more complex filtering possible, using the Equals, Contains (partial match), and Match (regular expression match) operators. Note that:
- To execute the search, click Search, or hit ESC then ENTER.
- AxoConsole autocompletes the built-in and custom labels and field names, as well as their most frequent values, but doesn’t autocomplete labels and variables created by data parsing and processing steps.
- You can use the AND and OR operators to combine expressions, and also parenthesis if needed. For details on AQL, see AQL operator reference.
- The precedence of the operators is the following: parentheses, AND, OR, comparison operators.
- Use the usual keyboard shortcuts to undo (⌘/Ctrl + Z) or redo (⌘/Ctrl + Shift + Z) your edits.
For details about the message schema and the available fields, see Message schema reference.

If a filter is active, by default the AxoConsole will display the matching hosts and the elements that are downstream from the matching hosts. For example, if an aggregator like AxoRouter matches the filter, only the aggregators and destinations where the matching host is sending data are displayed, the sources that are sending data to the matching aggregator aren’t shown. To display only the matching host without the downstream pipeline elements, select Filter strategy > Strict. (For example, the AQL expression type = ROUTER shows only the aggregator hosts.)
The settings of the filter bar change the URL parameters of the page, so you can bookmark it, or share a specific view by sharing the URL.
Grouping hosts
You can select labels to group hosts in the Group by field, so the visualization of large topologies with lots of devices remains useful. AxoConsole automatically adds names to the groups. The following example shows hosts grouped by their region based on their location labels.
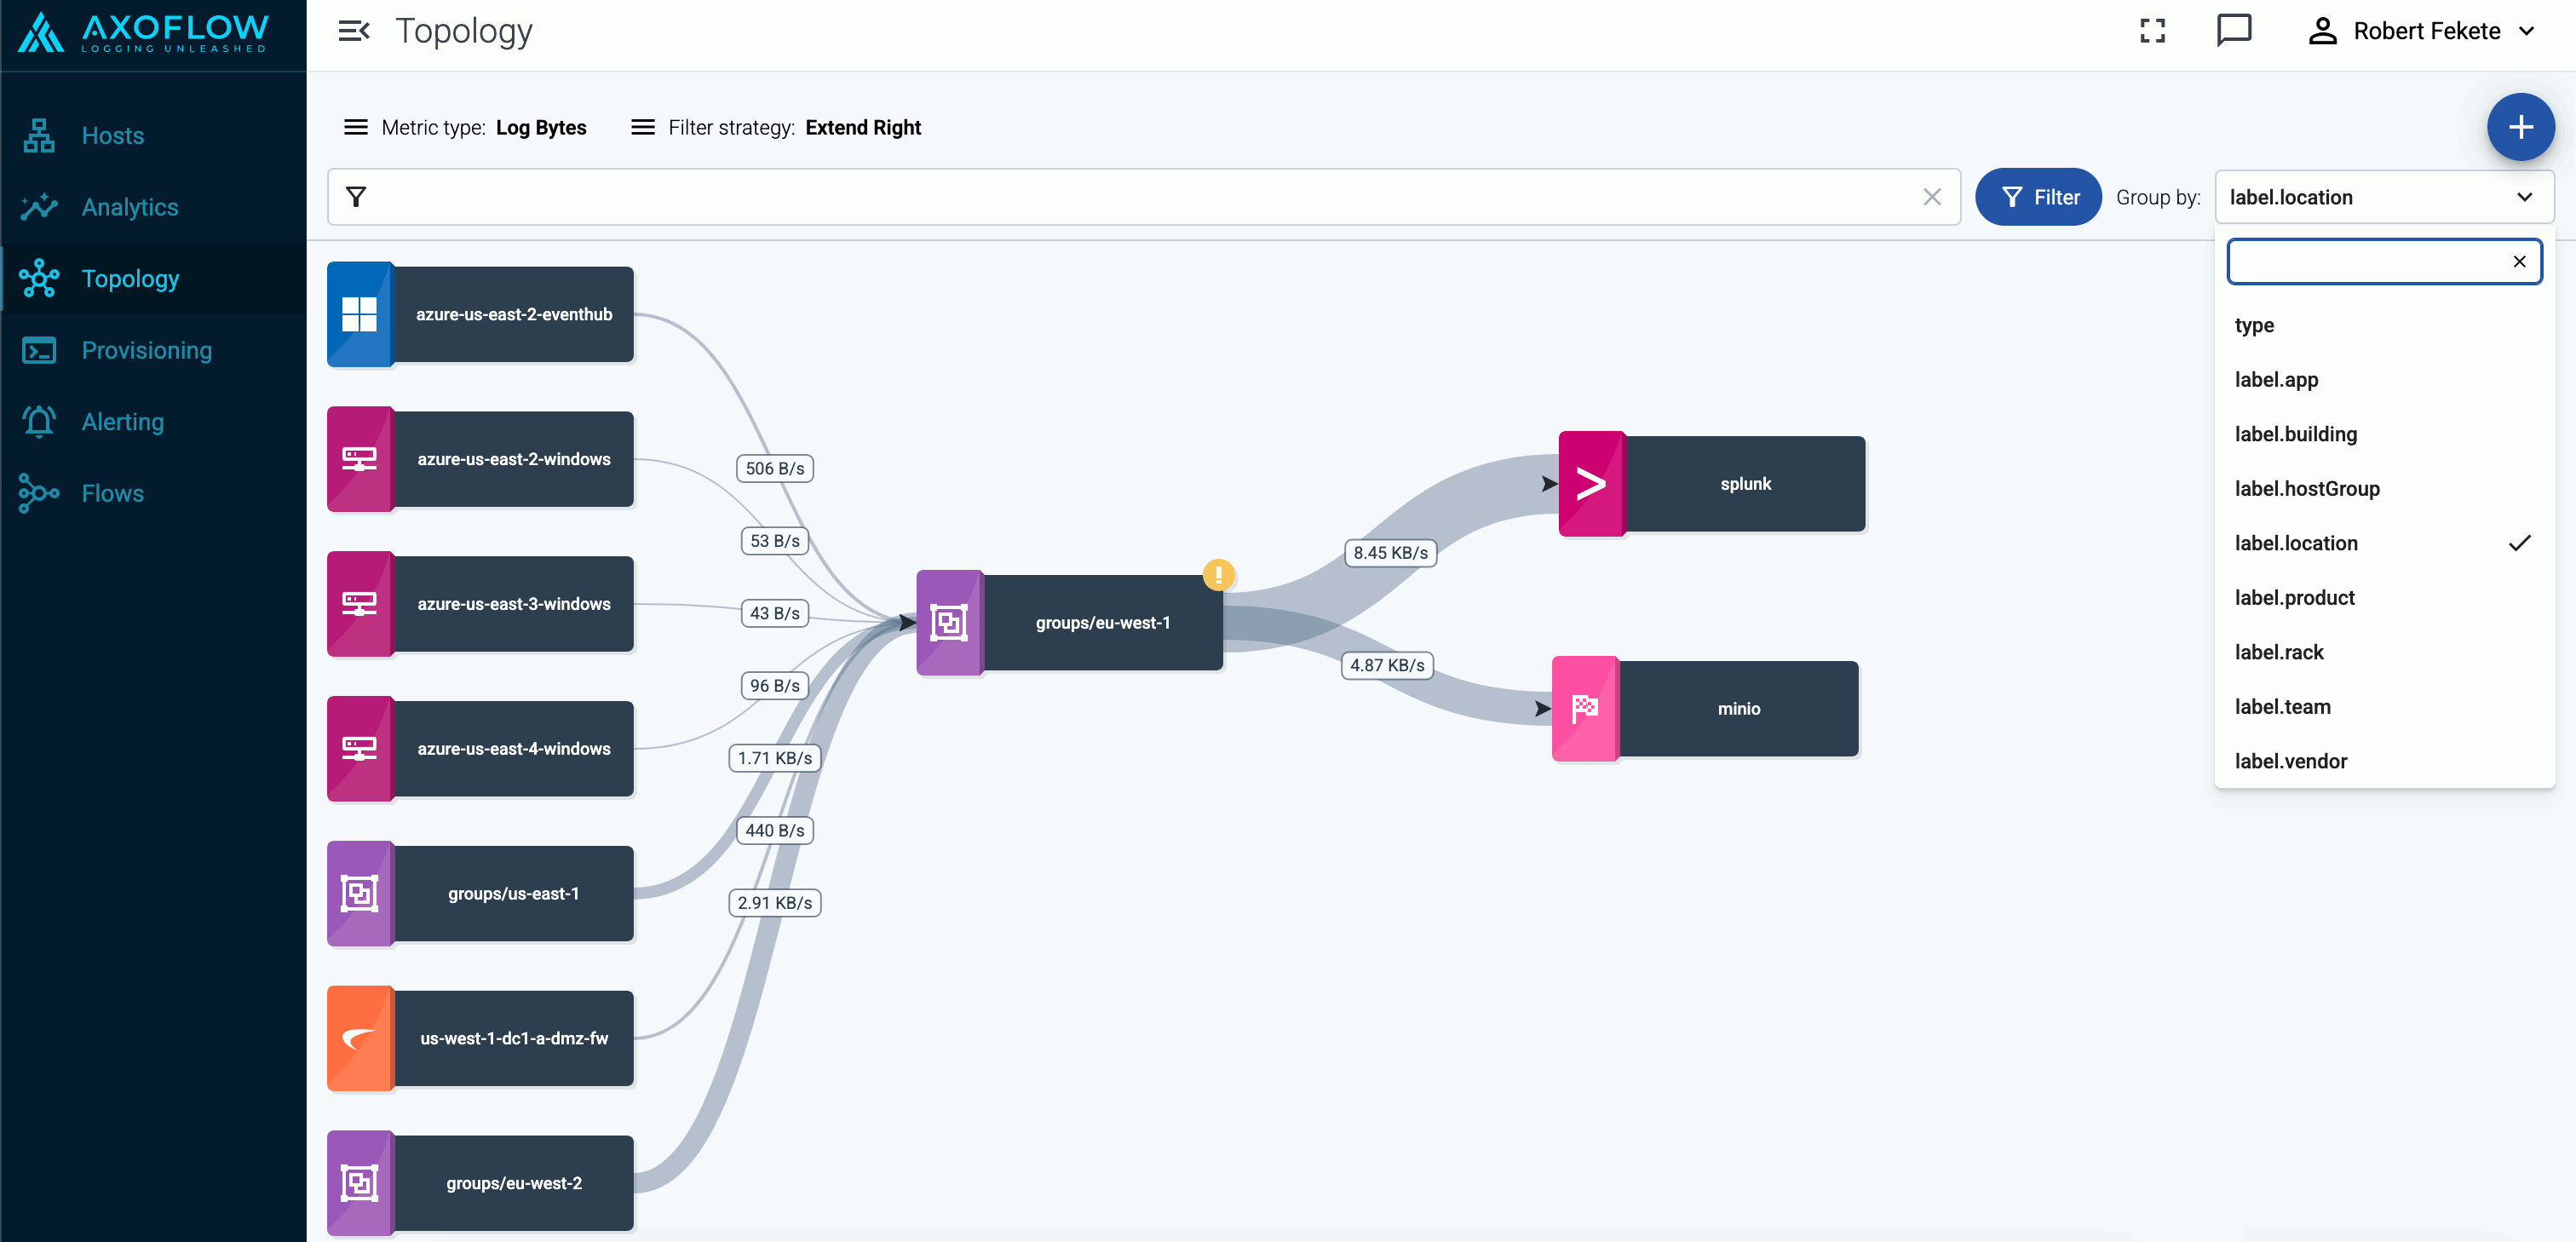
You can select one or more features to group hosts by. When multiple features are selected, groups will be formed by combining values of these features. This can be useful in cases where your information is split into multiple features, for example, if you have region (with values eu, us, etc.) and zone (with values central-1, east-1, east-2, west-1, etc.) labels on your hosts and select the label.region and label.zone features for grouping, you’ll groups will be the following:
- A cross-product of the selected feature values:
eu,central-1,eu,east-1,eu,east-2,eu,west-1,us,central-1,us,east-1, and so on. Obviously, in this example, several of these groups (likeeu,east-1,eu-east-2, andus,central-1) will be empty, unless your hosts are mislabeled. - Groups for the individual values, for hosts that have only one of the selected features:
eu,us,central-1,east-1,east-2,west-1, etc.
Queues
Select queue in the top bar to show the status of the memory and disk queues of the hosts. Select the status indicators of a host to display the details of the queues.
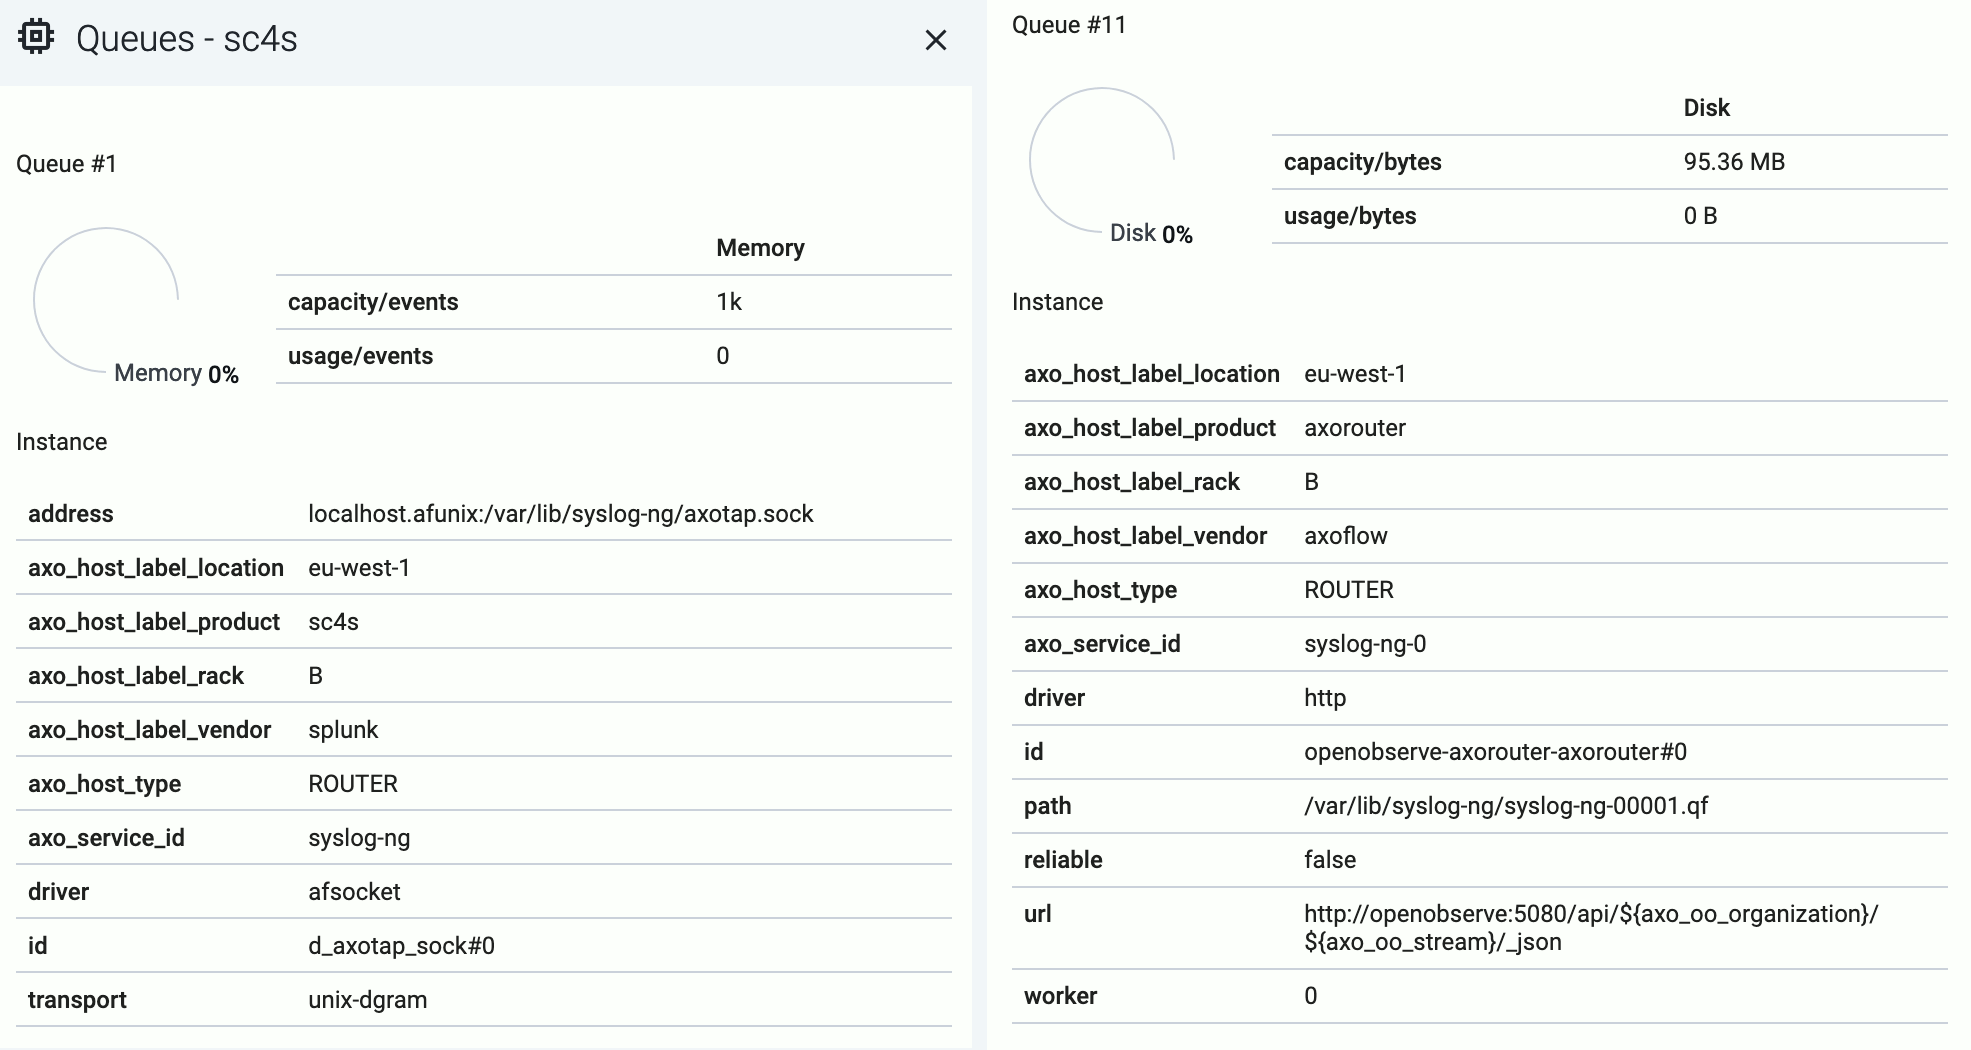
The following details about the queue help you diagnose which connections of the host are having throughput or connectivity issues:
- capacity: The total capacity of the buffer in bytes.
- usage: How much of the total capacity is currently in use.
- driver: The type of the AxoSyslog driver used for the connection the queue belongs to.
- id: The identifier of the connection.
Disk-based queues also have the following information:
- path: The location of the disk-buffer file on the host.
- reliable: Indicates wether the disk-buffer is set to be reliable or not.
- worker: The ID of the AxoSyslog worker thread the queue belongs to.
Both memory-based and disk-based queues have additional details that depend on the destination.
2 - Hosts
Axoflow collects and shows you a wealth of information about the hosts of your security data pipeline. Sources and edge hosts are listed on the Sources page, while AxoRouters are shown on the Routers page.
- Sources are hosts that are sending data to a data aggregator, like AxoRouter.
- Edges are source hosts that are running a collector agent managed by AxoConsole, or have an Axolet agent reporting metrics from the host.
2.1 - Find a host
To find a specific host, you have the following options:
-
Open the Topology page, then click the name of the host you’re interested in. If you have many host and it’s difficult to find the one you need, use filtering, or grouping.
-
To find an AxoRouter, open the Routers page. To find a source or an edge host, open the Sources page.
To find or display only specific hosts, you can use the filter bar.
-
Free-text mode searches in the values of the following fields of the host: Name, IP Address, GUID, FQDN, and the labels of the host.
Basic Search is case insensitive. Adding multiple keywords searches for matches in any of the previous fields. This is equivalent to the
@ANY =* keyword1 AND @ANY =* keyword2AQL query. -
AQL Expression mode allows you to search in specific fields or the labels of the hosts.
It also makes more complex filtering possible, using the Equals, Contains (partial match), and Match (regular expression match) operators. Note that:
- To execute the search, click Search, or hit ESC then ENTER.
- AxoConsole autocompletes the built-in and custom labels and field names, as well as their most frequent values, but doesn’t autocomplete labels and variables created by data parsing and processing steps.
- You can use the AND and OR operators to combine expressions, and also parenthesis if needed. For details on AQL, see AQL operator reference.
- The precedence of the operators is the following: parentheses, AND, OR, comparison operators.
- Use the usual keyboard shortcuts to undo (⌘/Ctrl + Z) or redo (⌘/Ctrl + Shift + Z) your edits.
For details about the message schema and the available fields, see Message schema reference.
You can also select one or more features (for example,
label.location) to group hosts by in the Group by field. For details on how grouping works, see Grouping hosts.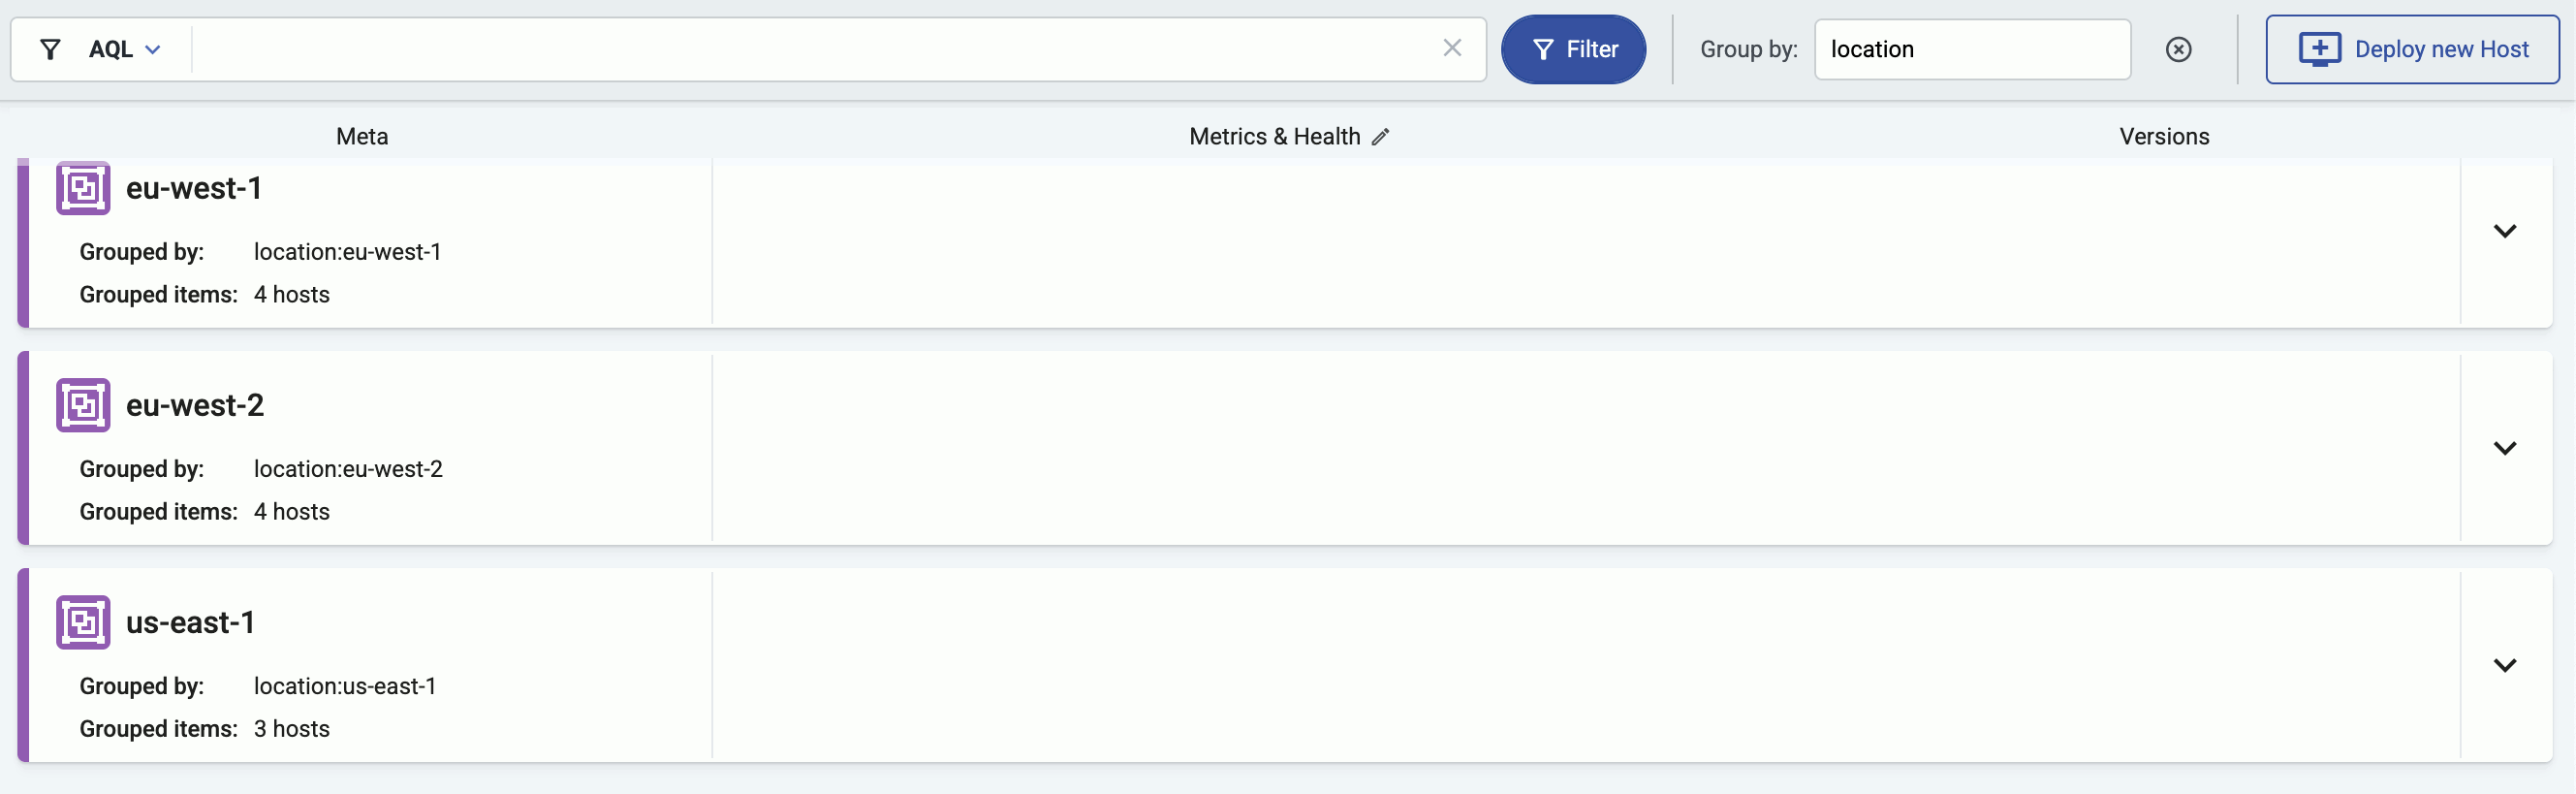
-
2.2 - Host information
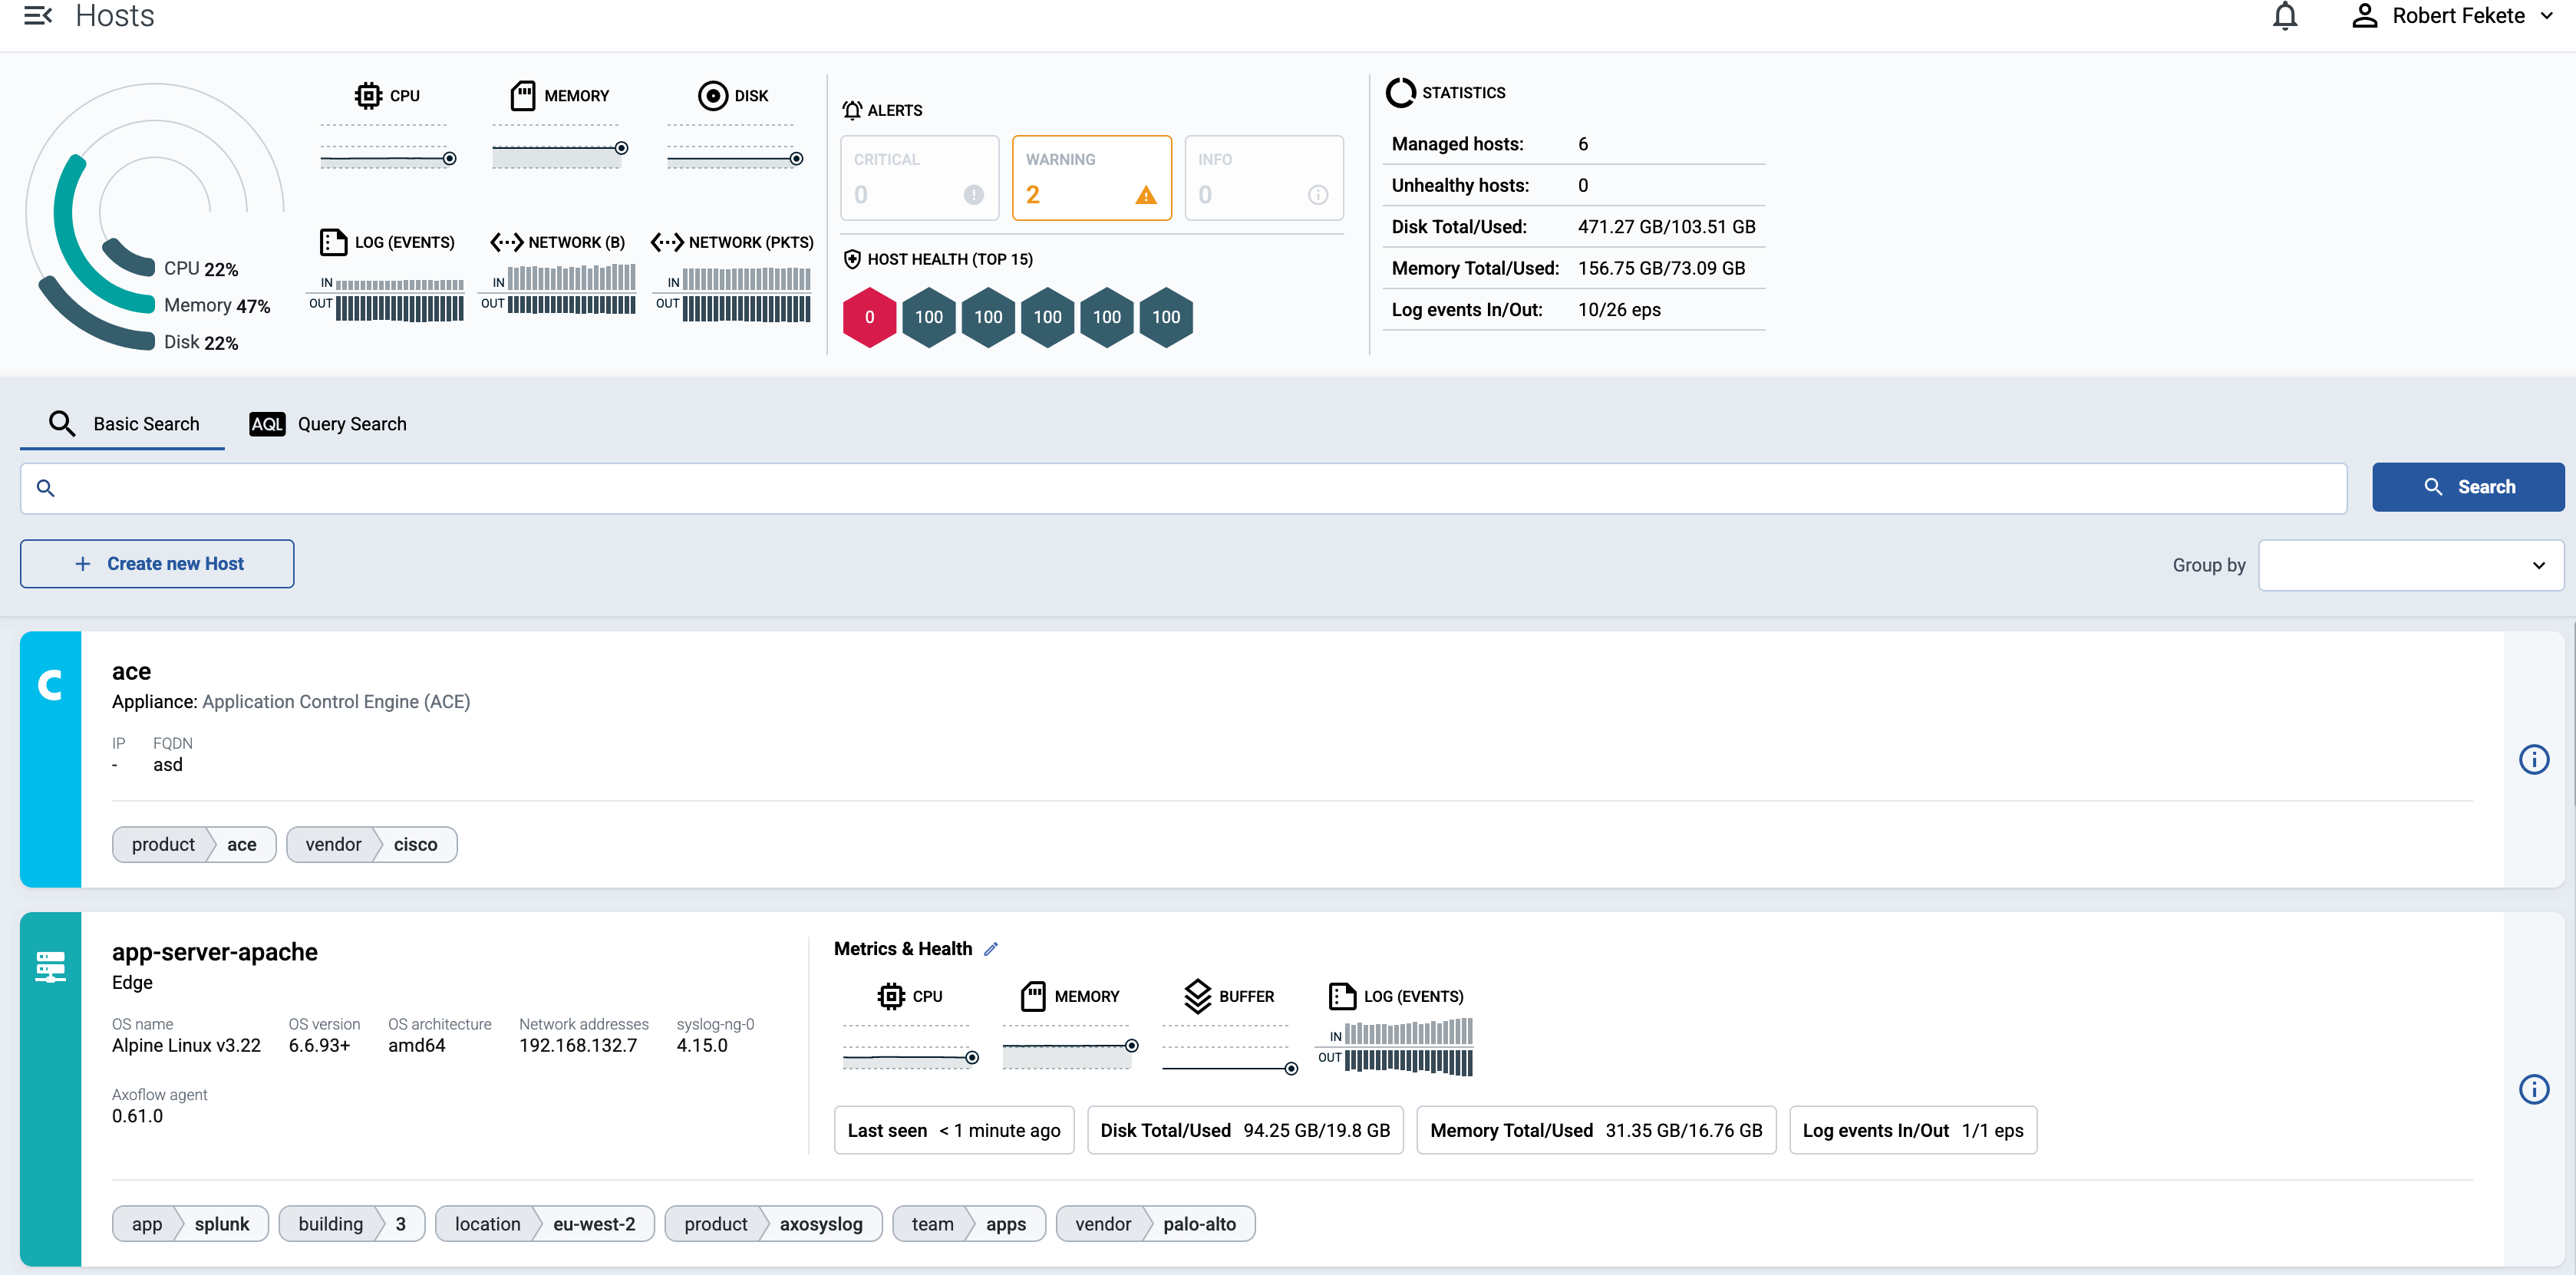
AxoConsole provides a quick overview of every data source and edge host on the Sources page, and AxoRouter on the Routers page. The exact information depends on the type of the host: hosts managed by Axoflow provide more information than external hosts.
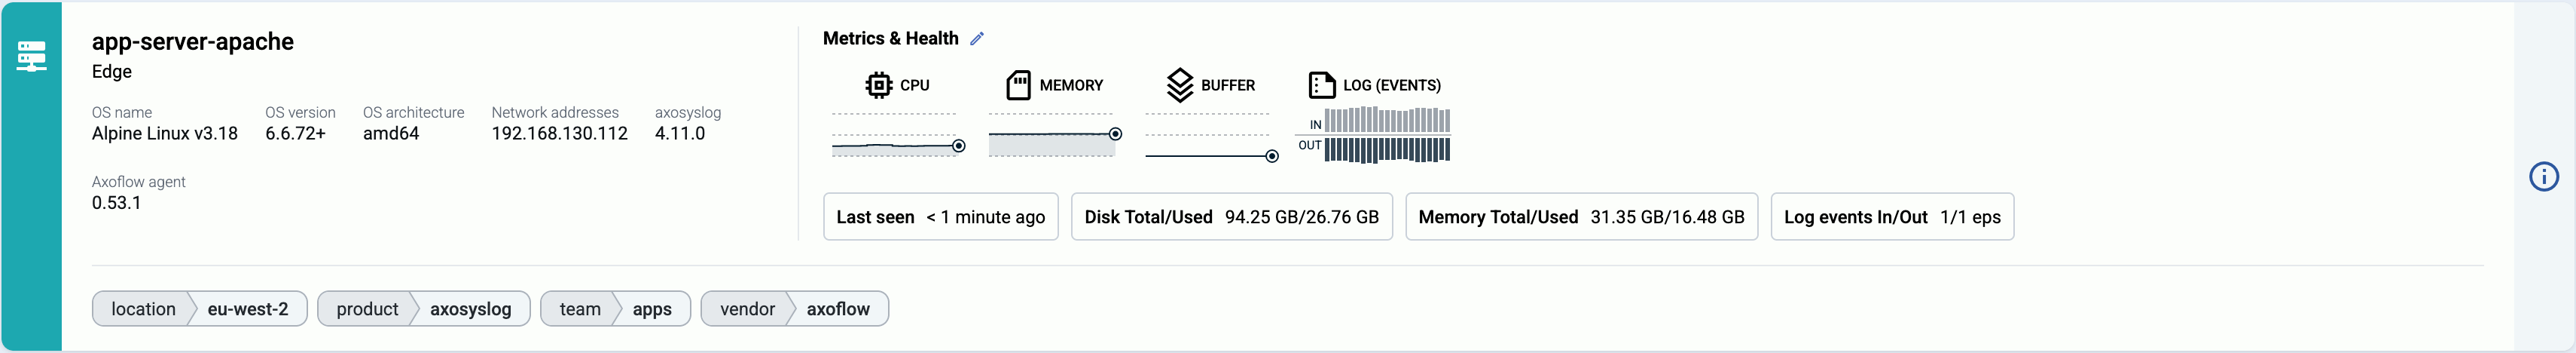
The following information is displayed:
- Hostname or IP address
- Metadata labels. These include labels added automatically during the Axoflow curation process (like product name and vendor labels), as well as any custom labels you’ve assigned to the host.
For edge hosts (hosts that have the Axoflow agent (Axolet) installed):
- The version on the agent
- The name and version of the log collector running on the host (for example, AxoSyslog or Splunk Connect for Syslog)
- Operating system, version, and architecture
- When AxoConsole has last received metrics from the host
- Resource information: CPU and memory usage, disk buffer usage. Click on a resource to open its resource history on the Metrics & health page of the host.
- Traffic information: volume of the incoming and outgoing data traffic on the host.
- Cloud-related labels: If the host is running in the cloud, the provider, region, zone labels are automatically available.
- An indicator if there are any active alerts on the host.
For more details about the host, select the hostname, or click ⋮.
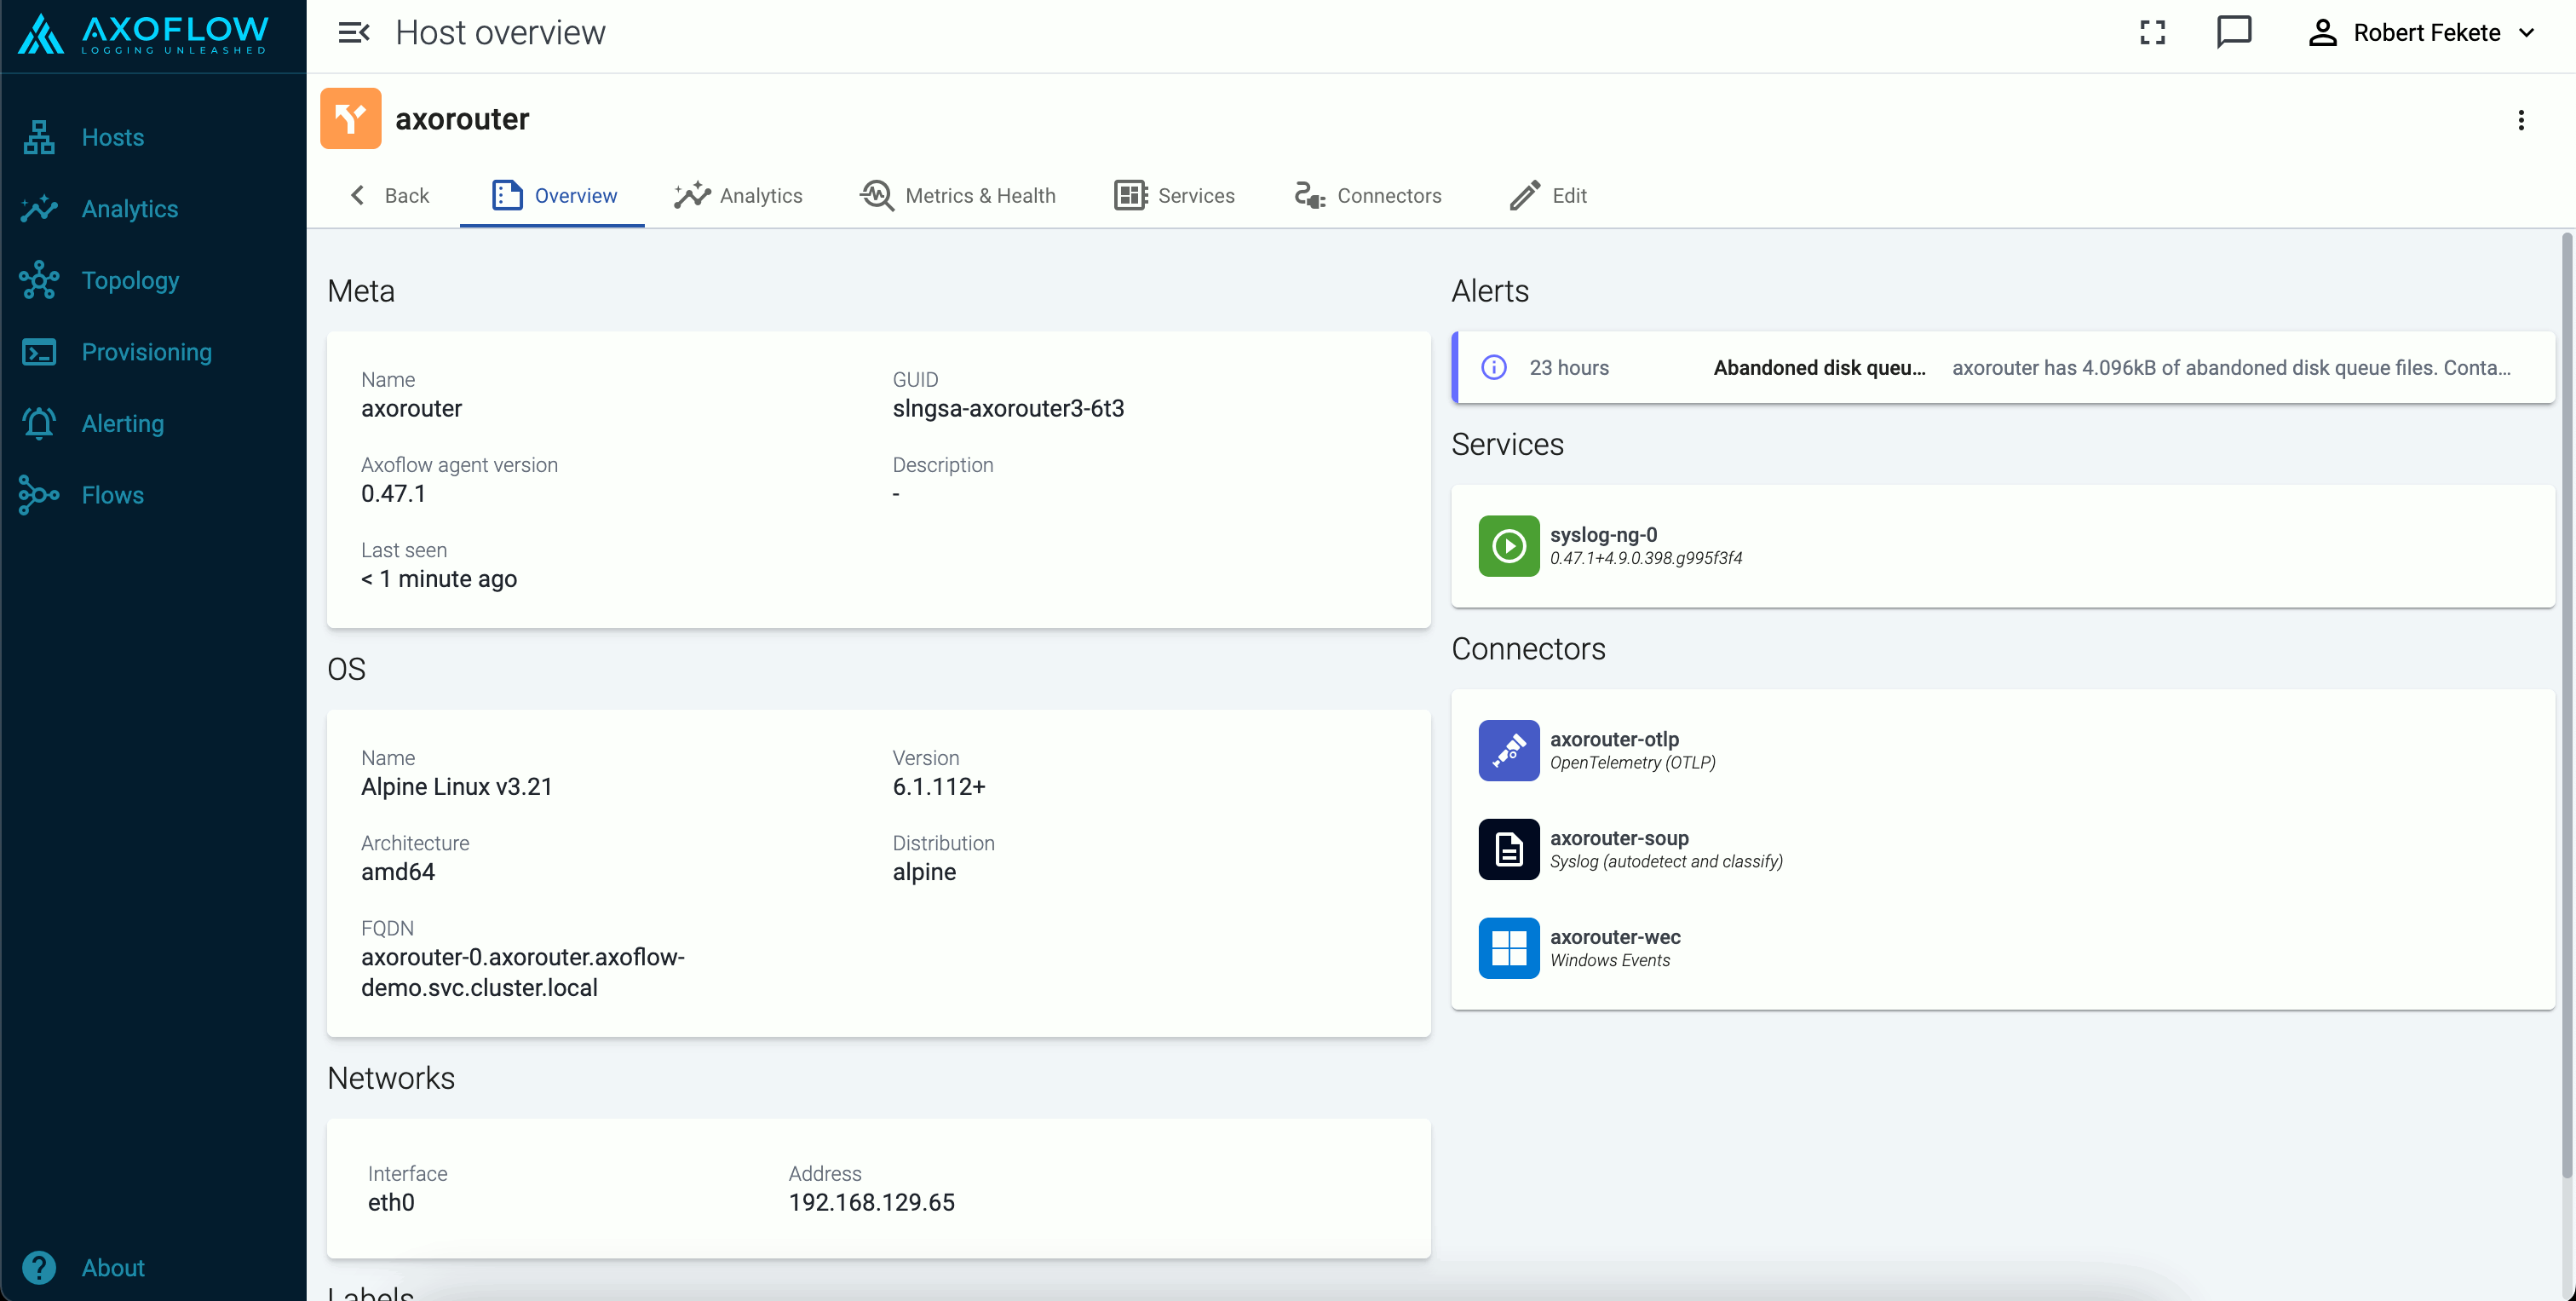
The host Overview page gives a quick overview of the host, including the Services, any active Alerts, and the Connectors and Stores available on AxoRouter hosts.
You can also access host-specific Analytics and Metrics.
2.3 - Custom labels and metadata
To add custom labels to a host, complete the following steps. Note that these are static labels. To add labels dynamically based on the contents of the processed data, use processing steps in data flows.
-
Find the host on the Topology page, and click on its hostname. The overview of the host is displayed. (Alternatively, you can find AxoRouters on the Routers page, and source and edge hosts on the Sources page.)
-
Select Edit.
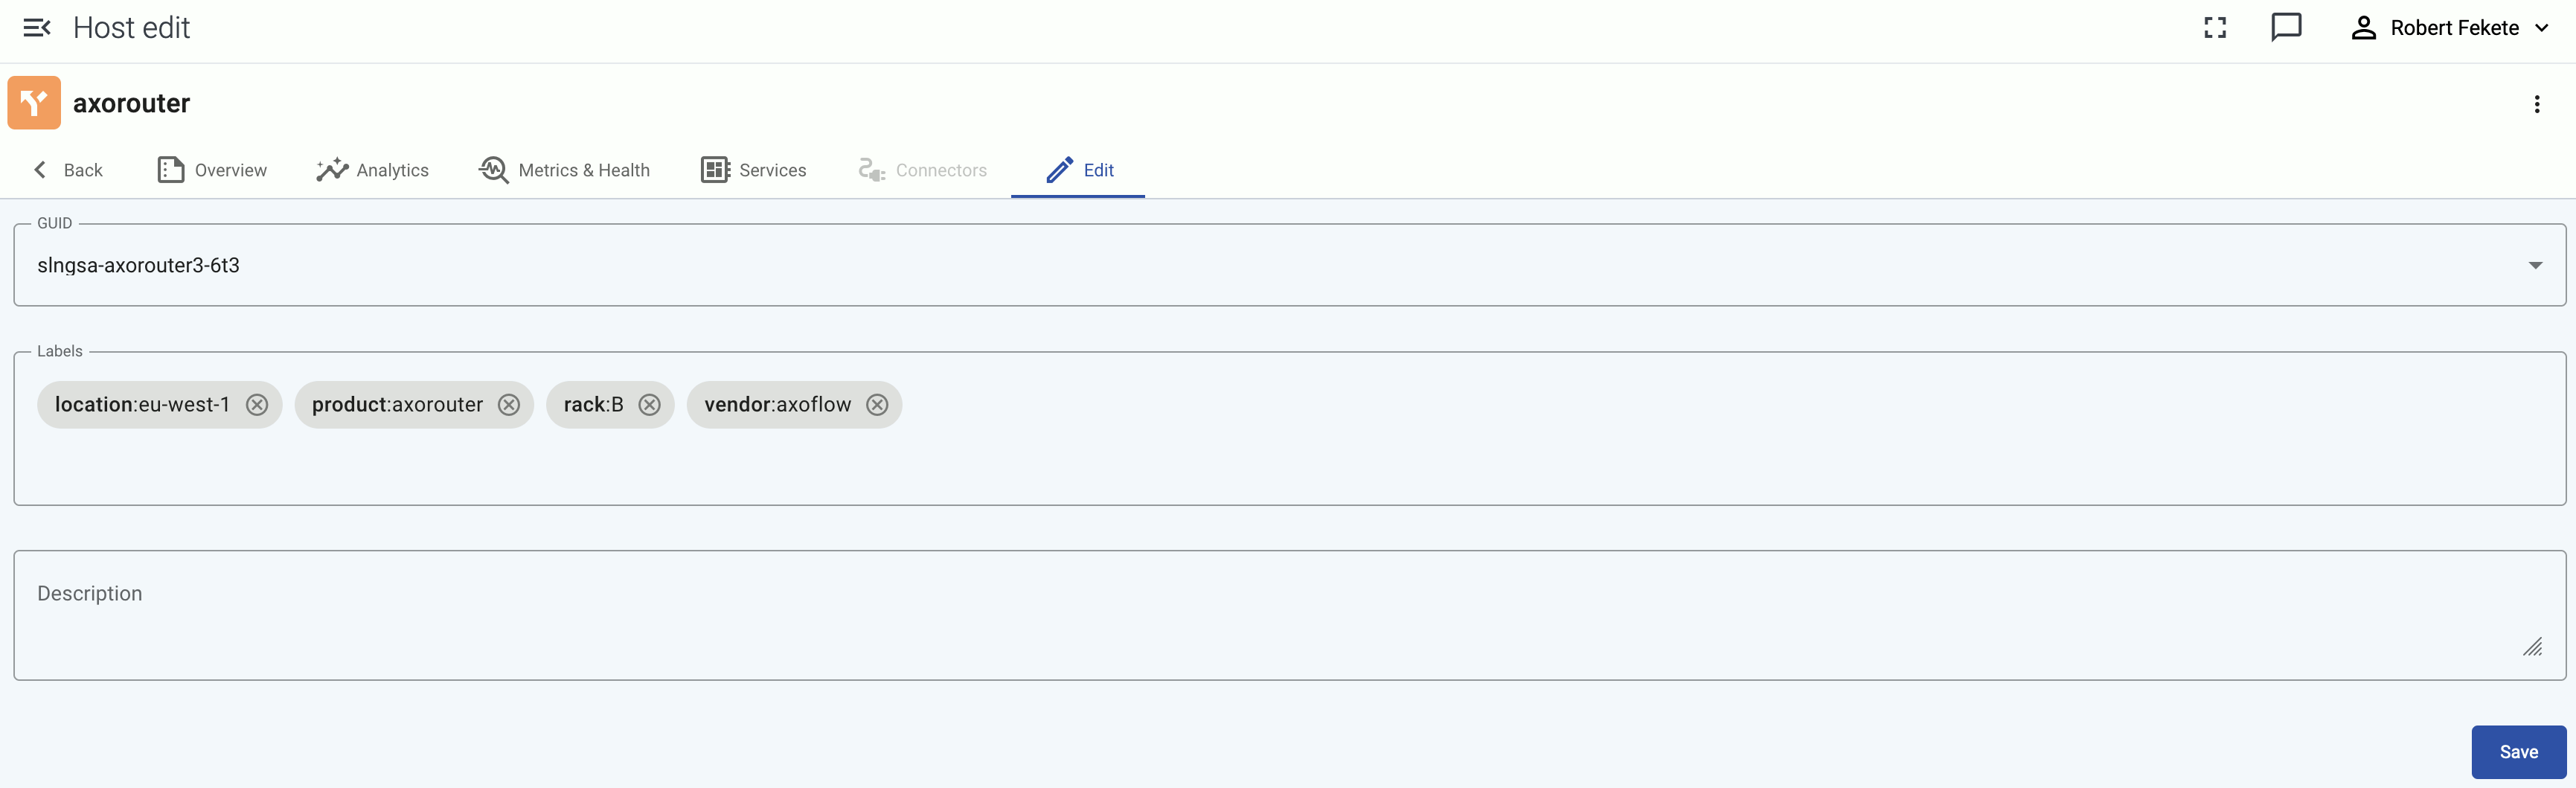
You can add custom labels in
<label-name>:<value>format (for example, the group or department a source device belongs to), or a generic description about the host. You can use the labels for quickly finding the host on the Hosts page, and also for filtering when configuring Flows.When using labels in filters, processing steps, or search bars, note that:
- Labels added to AxoRouter hosts get the
axo_host_prefix. - Labels added to data sources get the
host_prefix. For example, if you add a rack label to an edge host, it’ll be added to the data received from the host ashost_rack. - Labels added on edge hosts get the
edge_connector_label_prefix.
On other pages, like the Host Overview page, the labels are displayed without the prefixes.
- Labels added to AxoRouter hosts get the
-
Select Save.
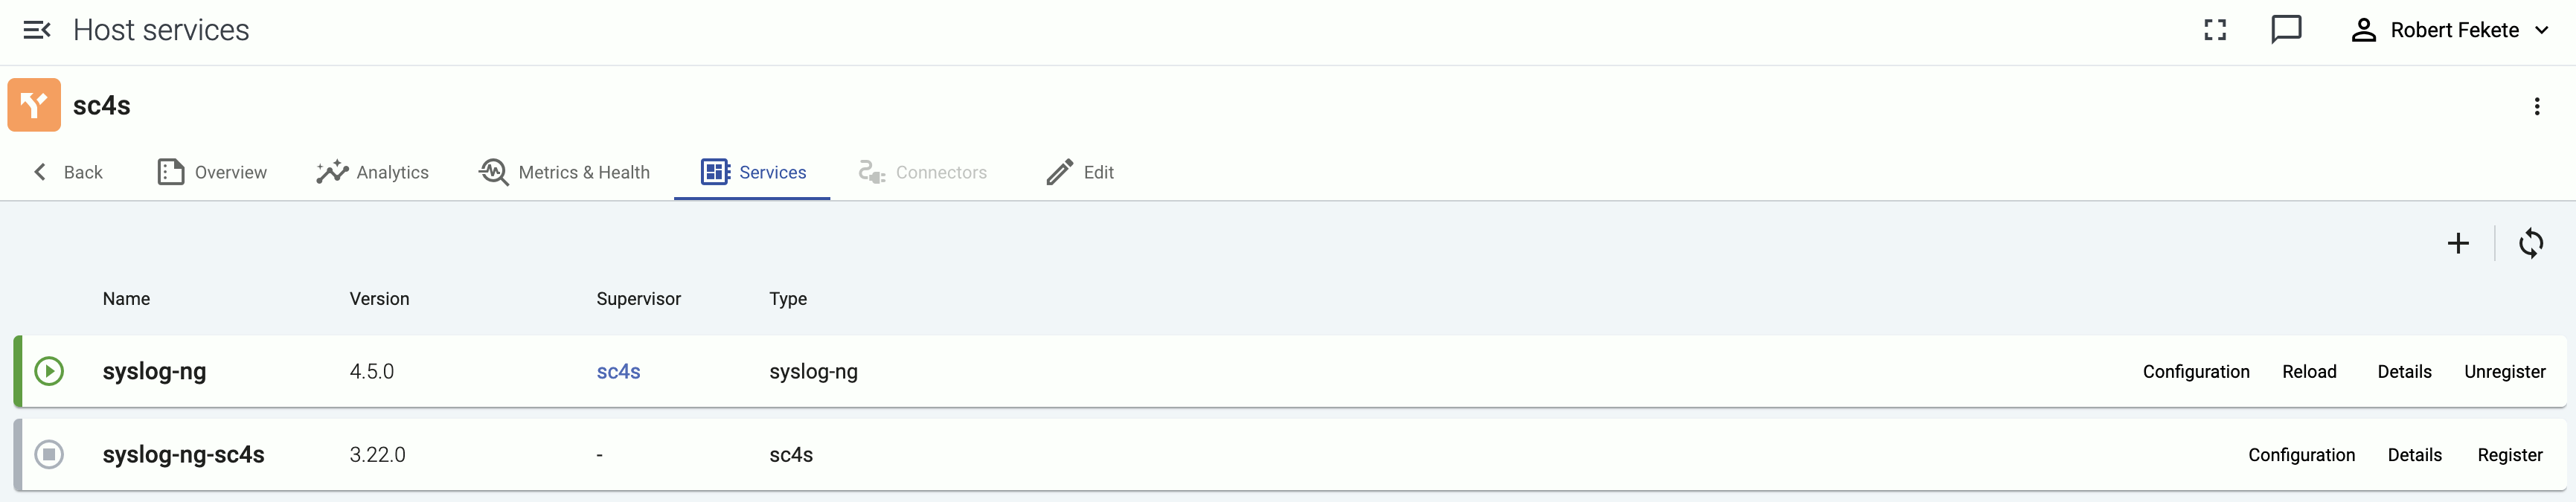
2.4 - Services
The Services page of an AxoRouter or edge host shows information about the data collector or router services running on the host. This page is only available for managed pipeline elements.
The following information is displayed:
- Name: Name of the service
- Version: Version number of the service
- Type: Type of the service (which data collector or processor it’s running), for example,
axorouter-syslog,axorouter-wec, oraxostore - Supervisor: The type of the supervisor process. For example, Splunk Connect for Syslog (
sc4s) runs a syslog-ng process under the hood.
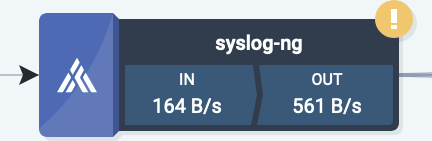
Icons and colors indicate the status of the service: running, stopped, or not registered.
Service configuration
To check the configuration of the service, select Configuration. This shows the list of related environment variables and configuration files. Select a file or environment variable to display its value. For example:
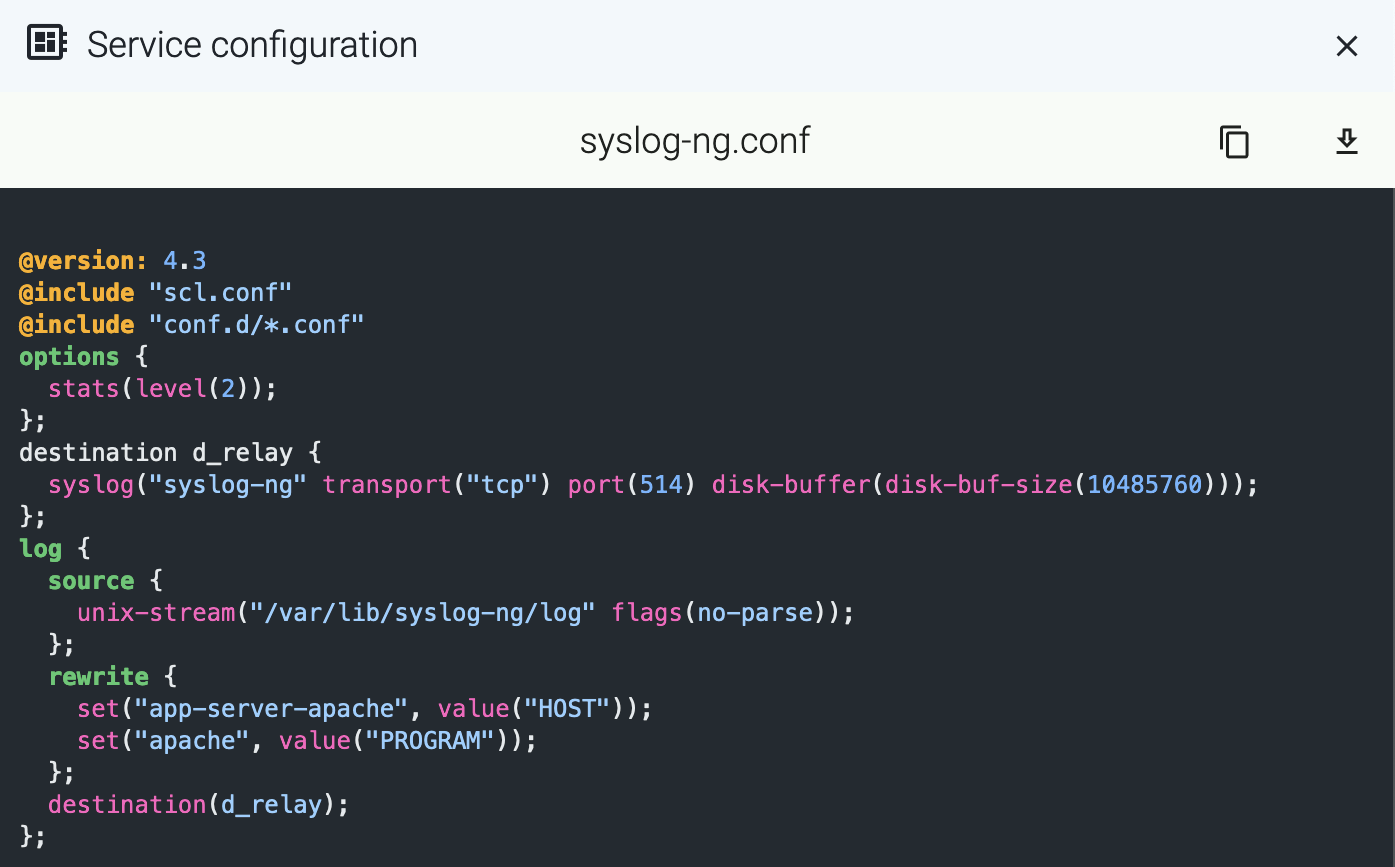
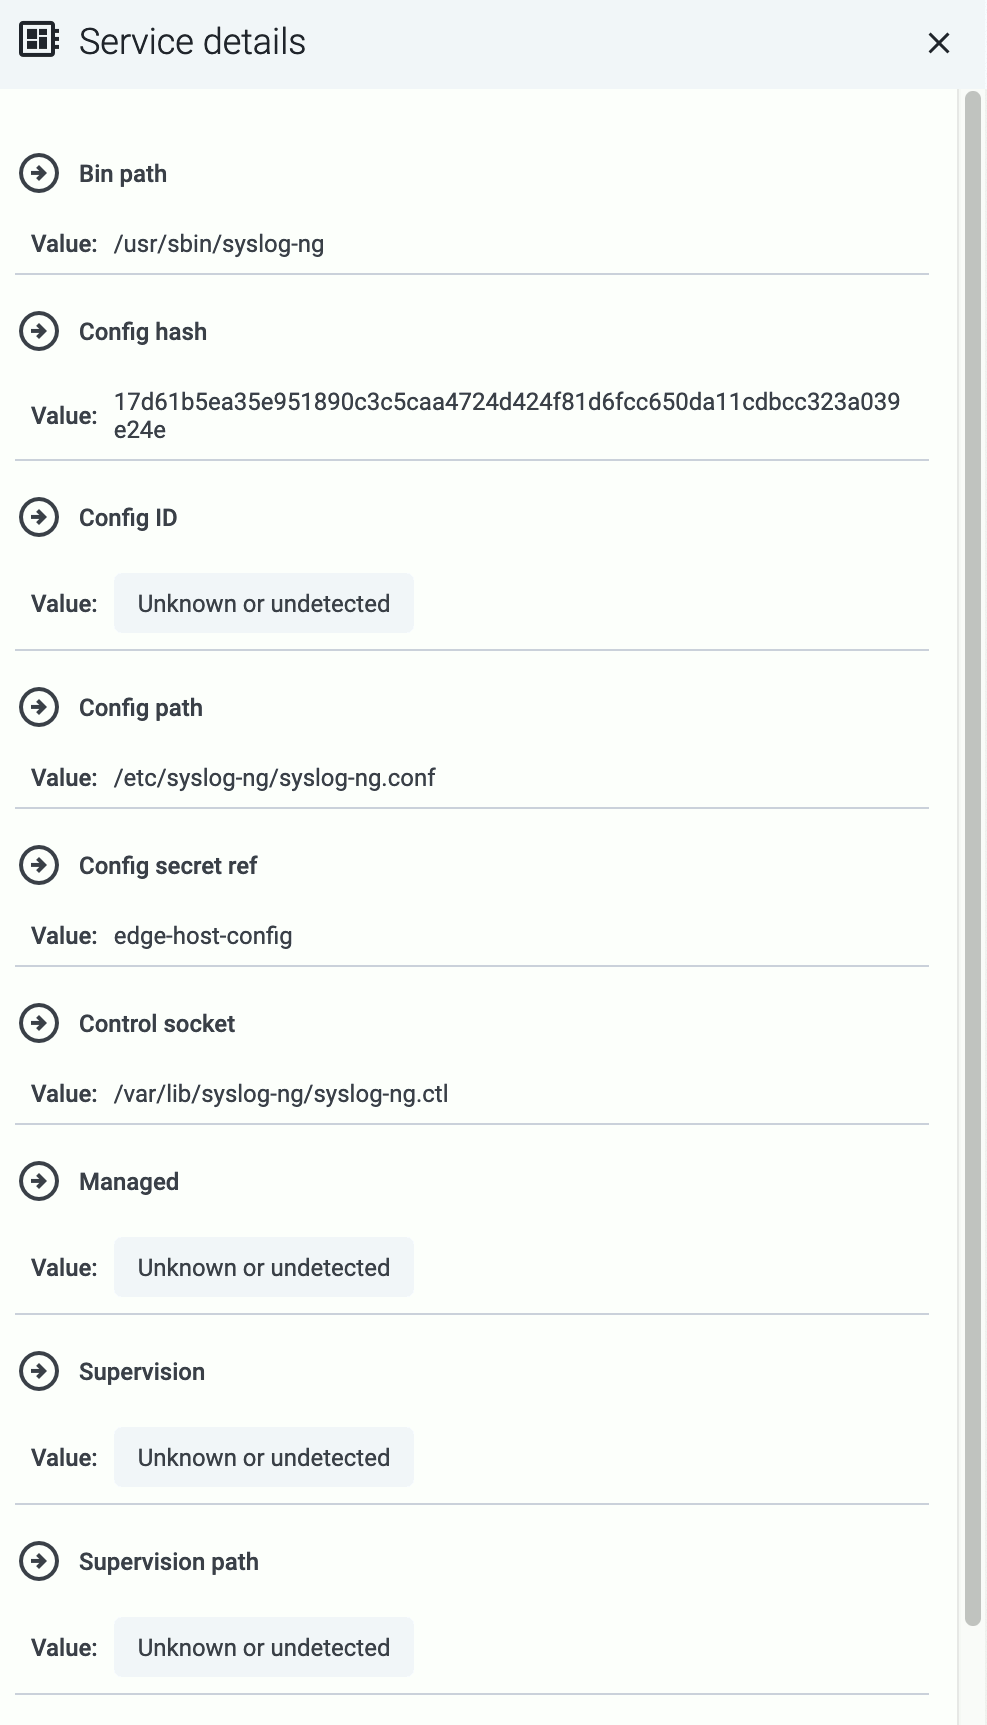
To display other details of the service (for example, the location of the configuration file or the binary), select Details.
Manage service
- To reload a registered service, select Reload.
- To restart a registered service, select Restart.
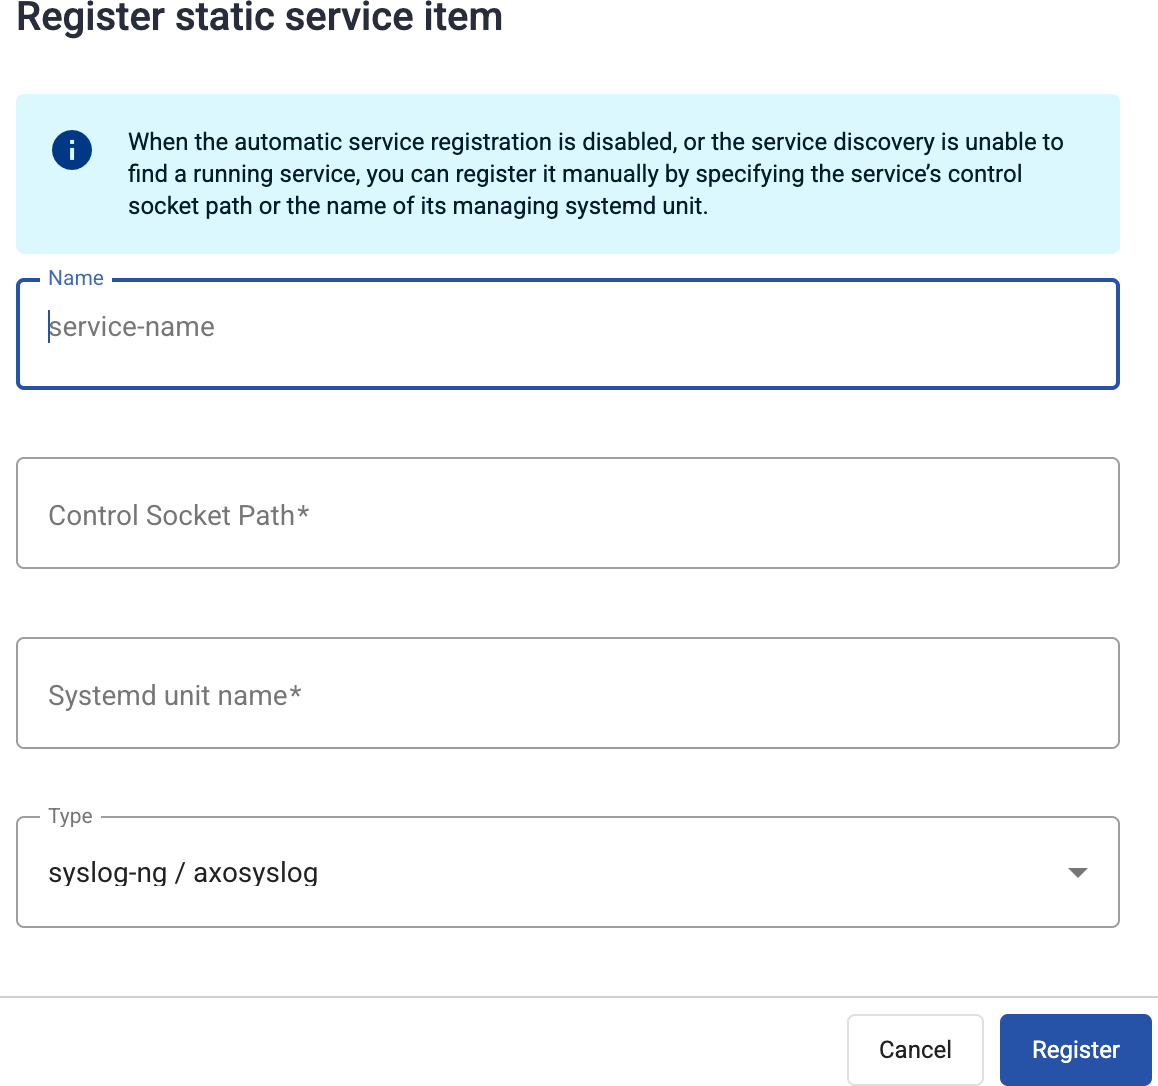
Register service manually
If Automatic service registration is disabled, or the service discovery is unable to find a running service, you can register it manually by specifying:
- the service’s control socket path, or
- the name of its managing systemd unit.
To register a service manually, complete the following steps.
-
Find the host and open its Services page.
-
Select Register static service.
-
Enter a name for the service. This name will be displayed in the services list.
-
Provide at least one of the following:
- Control Socket Path: The path to the Unix domain socket used to communicate with the service, for example,
/var/lib/syslog-ng/syslog-ng.ctl. - Systemd unit name: The name of the systemd service of the service you’re registering, for example,
syslog-ng.service.
- Control Socket Path: The path to the Unix domain socket used to communicate with the service, for example,
-
Select Register.
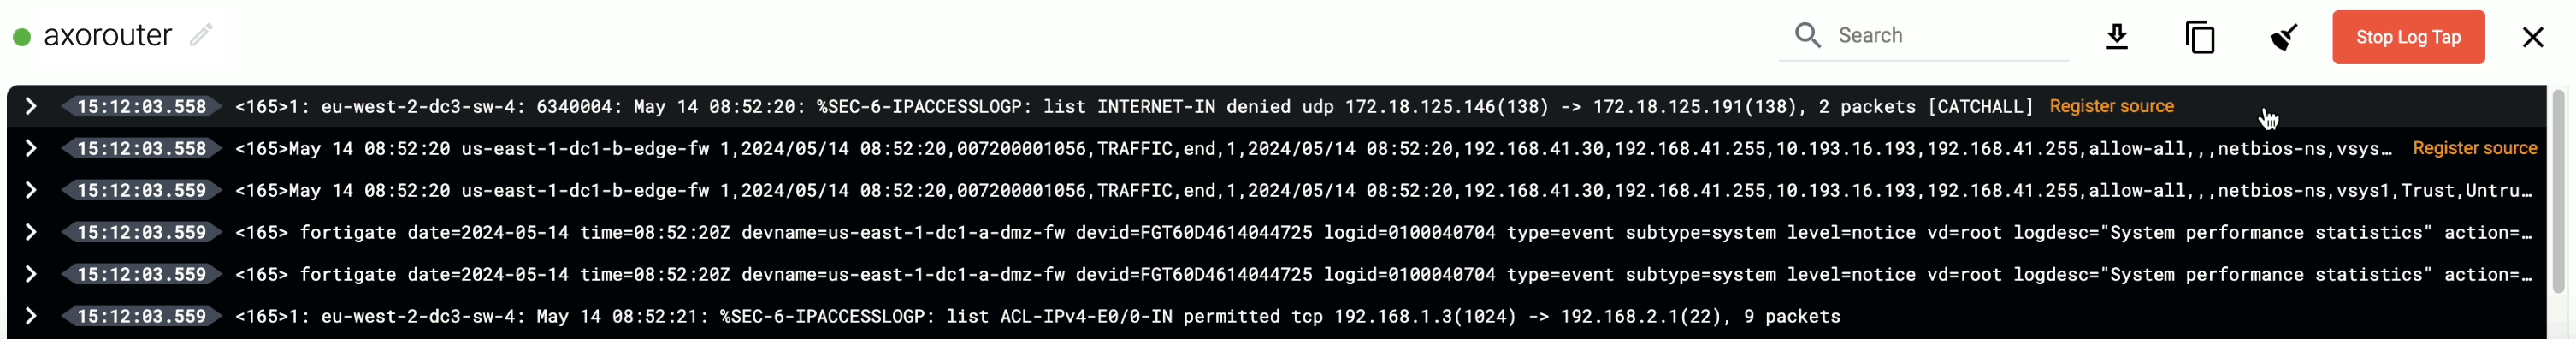
3 - Log tapping
Log tapping in Axoflow samples the log flow. You can use labels to filter for specific messages (like ones with parse errors) and tap only those messages. To not get overwhelmed with events, Axoflow automatically samples the output: if many messages match the selected filter, only a subset is shown (about 1 message per second). Using log tapping, you can quickly troubleshoot both parsing/curation errors and destination ingest (API) errors, and check:
- What was in the original message?
- What is sent in the final payload to the destination?
To see log tapping in action, check this blog post. To tap into your log flow, or to display the logs of the log collector agent, complete the following steps.
-
Open the Topology page, then select the AxoRouter where you want to tap the logs.
-
Select ⋮ > Tap log flow.
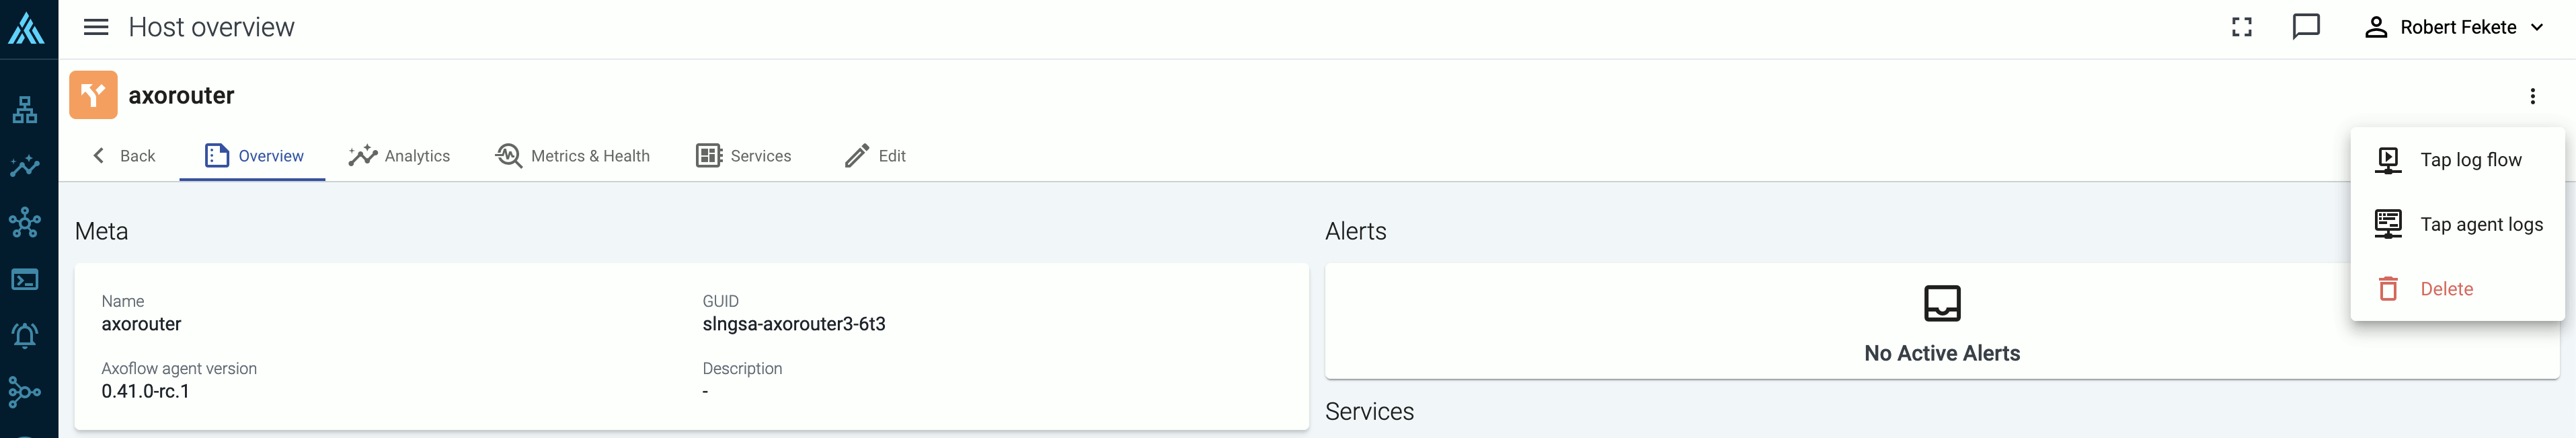
-
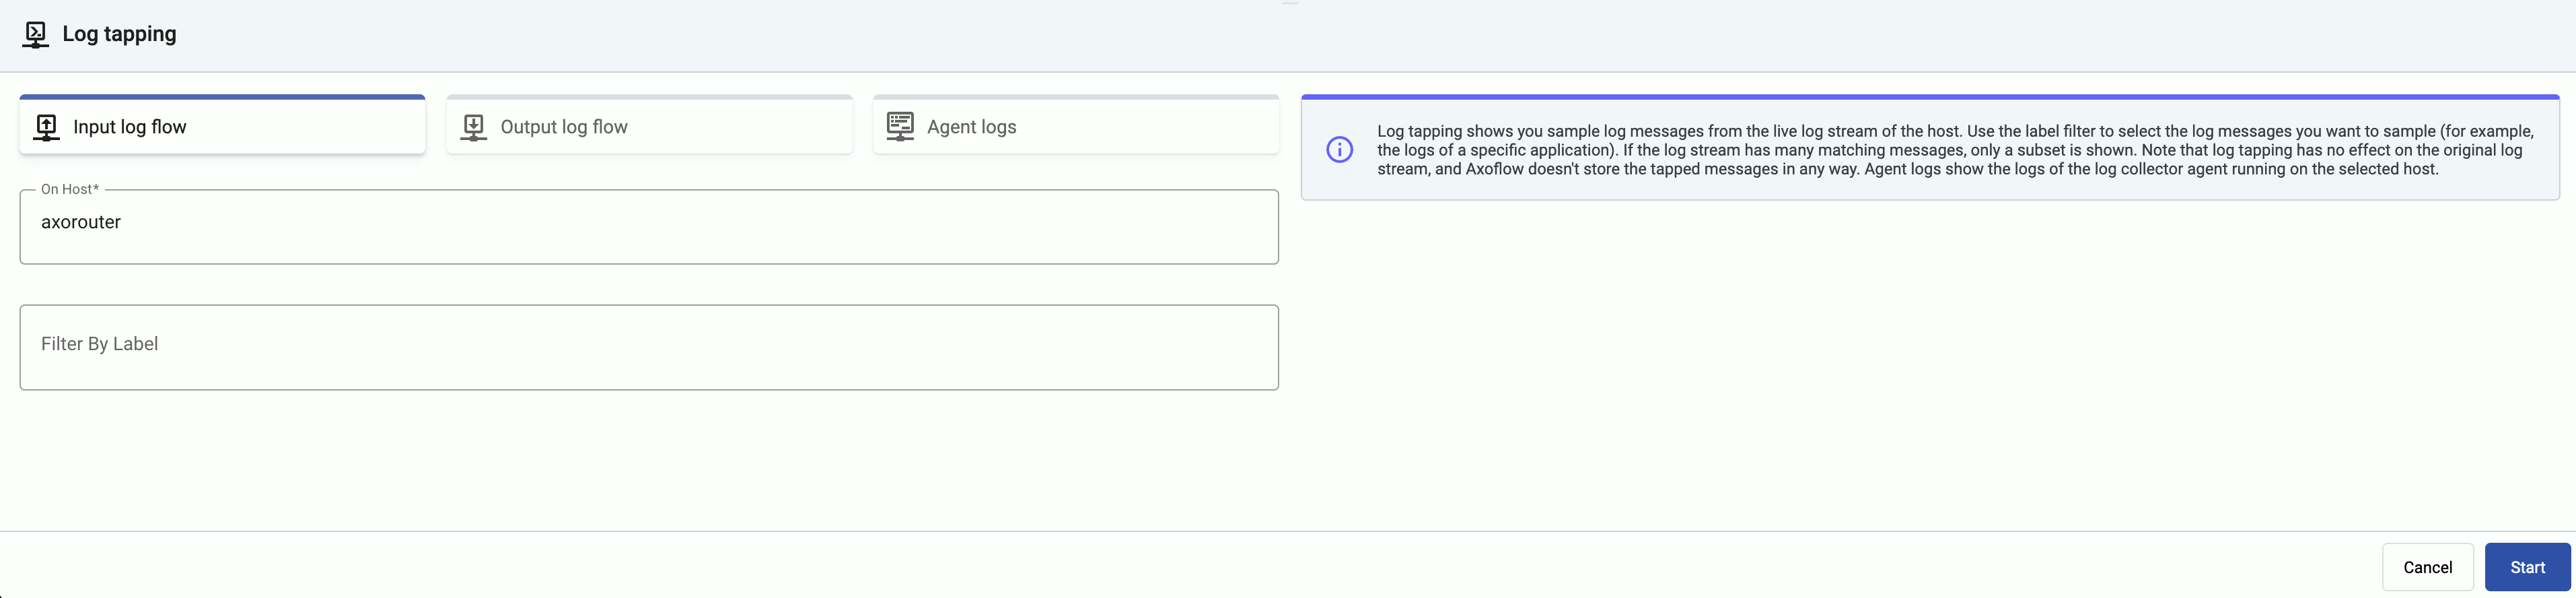
Tap into the log flow.
- To see the input data, select Input log flow > Start.
- To see the output data, select Output log flow > Start.
- To see the logs of the log collector agent and Axolet running on the host, select Agent logs. Agent logs also contain the output of the systemd units used to launch the containers (where applicable).
You can use labels to filter the messages and sample only the matching ones.
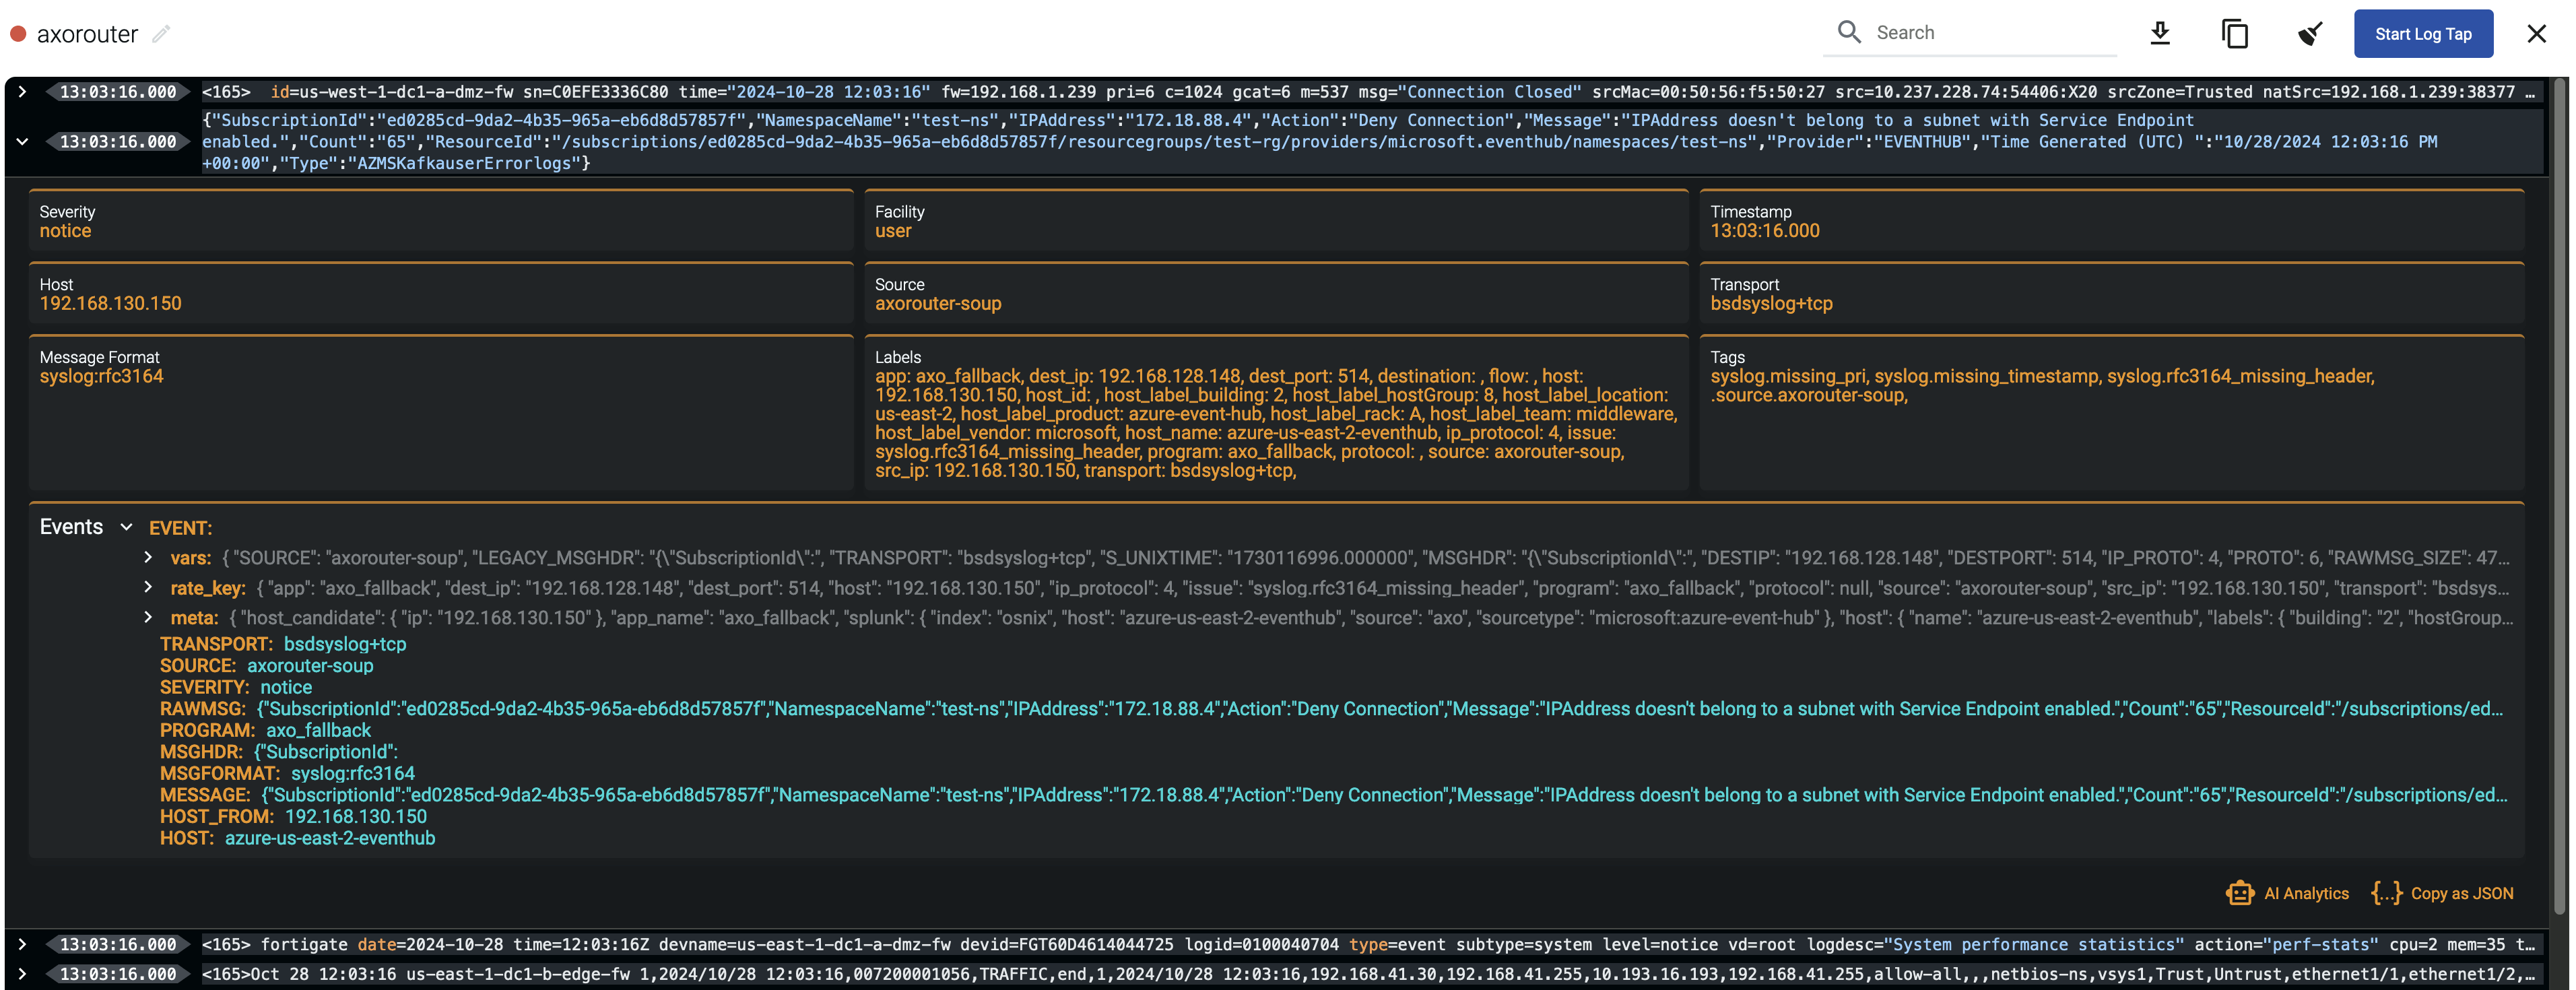
-
When the logs you’re interested in show up, click Stop Log Tap, then click a log message to see its details. For details about the message schema and the displayed fields, see Message schema reference.
 Note
NoteFor sources that are not yet registered in the AxoConsole host database, the Register source button is shown at the end of the message. Click it to add the source to AxoConsole: this will allow attributing the logs coming from the given source as such, enriching the messages, the analytics data, as well as the Topology page.
 Note When using Log tapping, ETW events look a bit weird: the body of these events is empty. That’s normal, the reason for that is that everything is sent as metadata.
 -
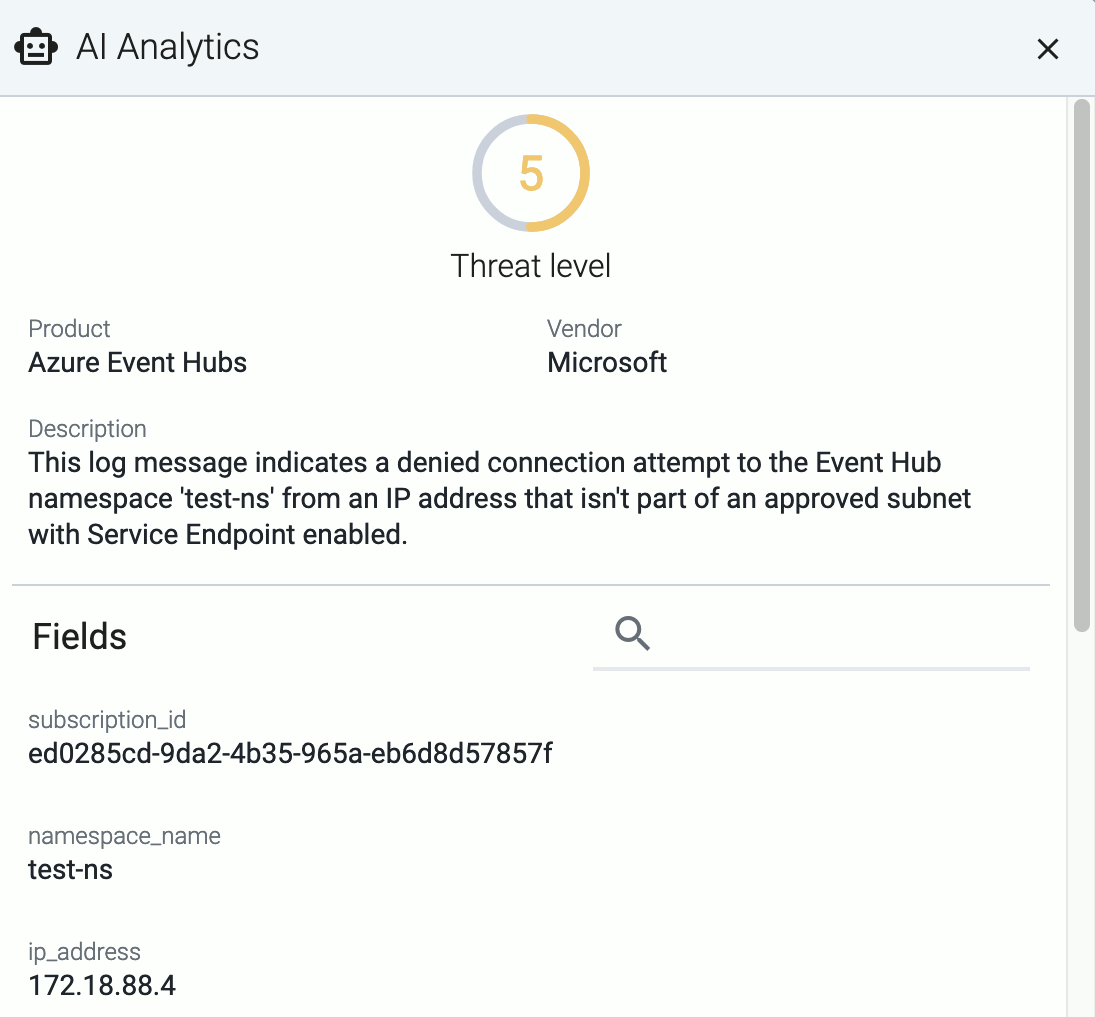
If you don’t know what the message means, select AI Analytics to ask our AI to interpret it.
Filter the messages
You can add labels to the Filter By Label field to sample only messages matching the filter. If you specify multiple labels, only messages that match all filters will be sampled. For example, the following filter selects messages from a specific source IP, sent to a specific destination IP.
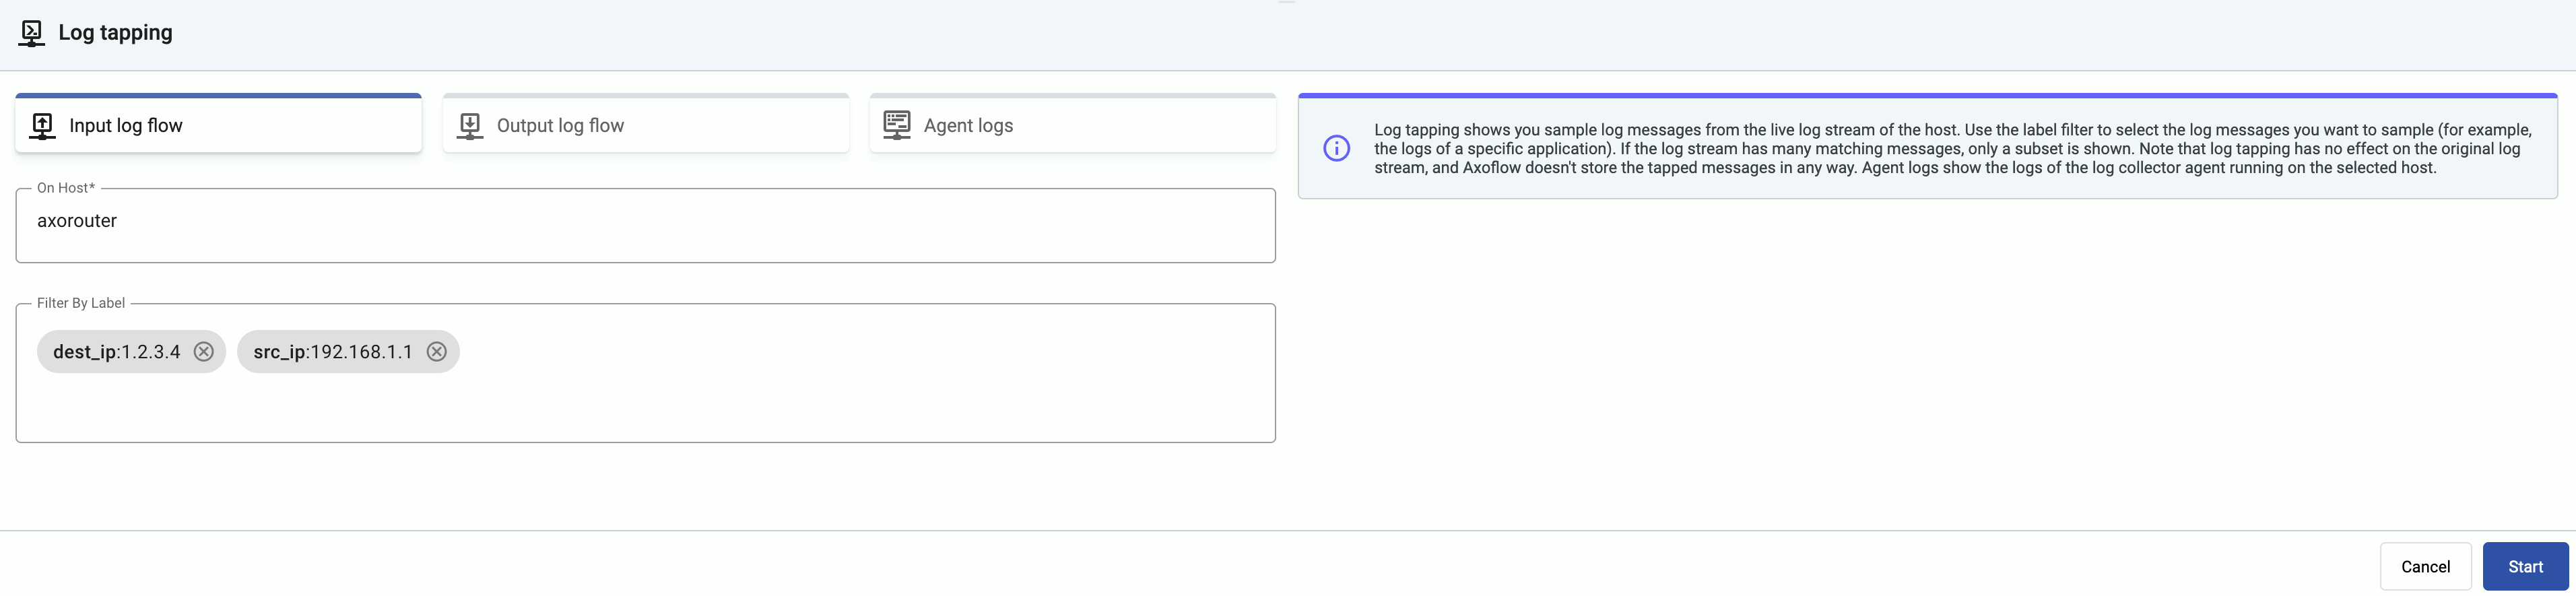
For details about the labels available for filtering, see Metrics schema.
To tap the messages received from edge hosts, you can use the related metrics labels of the edge collector, for example, edge_connector_type:windowsEventLog samples only the event log messages received from edge hosts. For details about the message schema and the available fields, see Message schema reference.
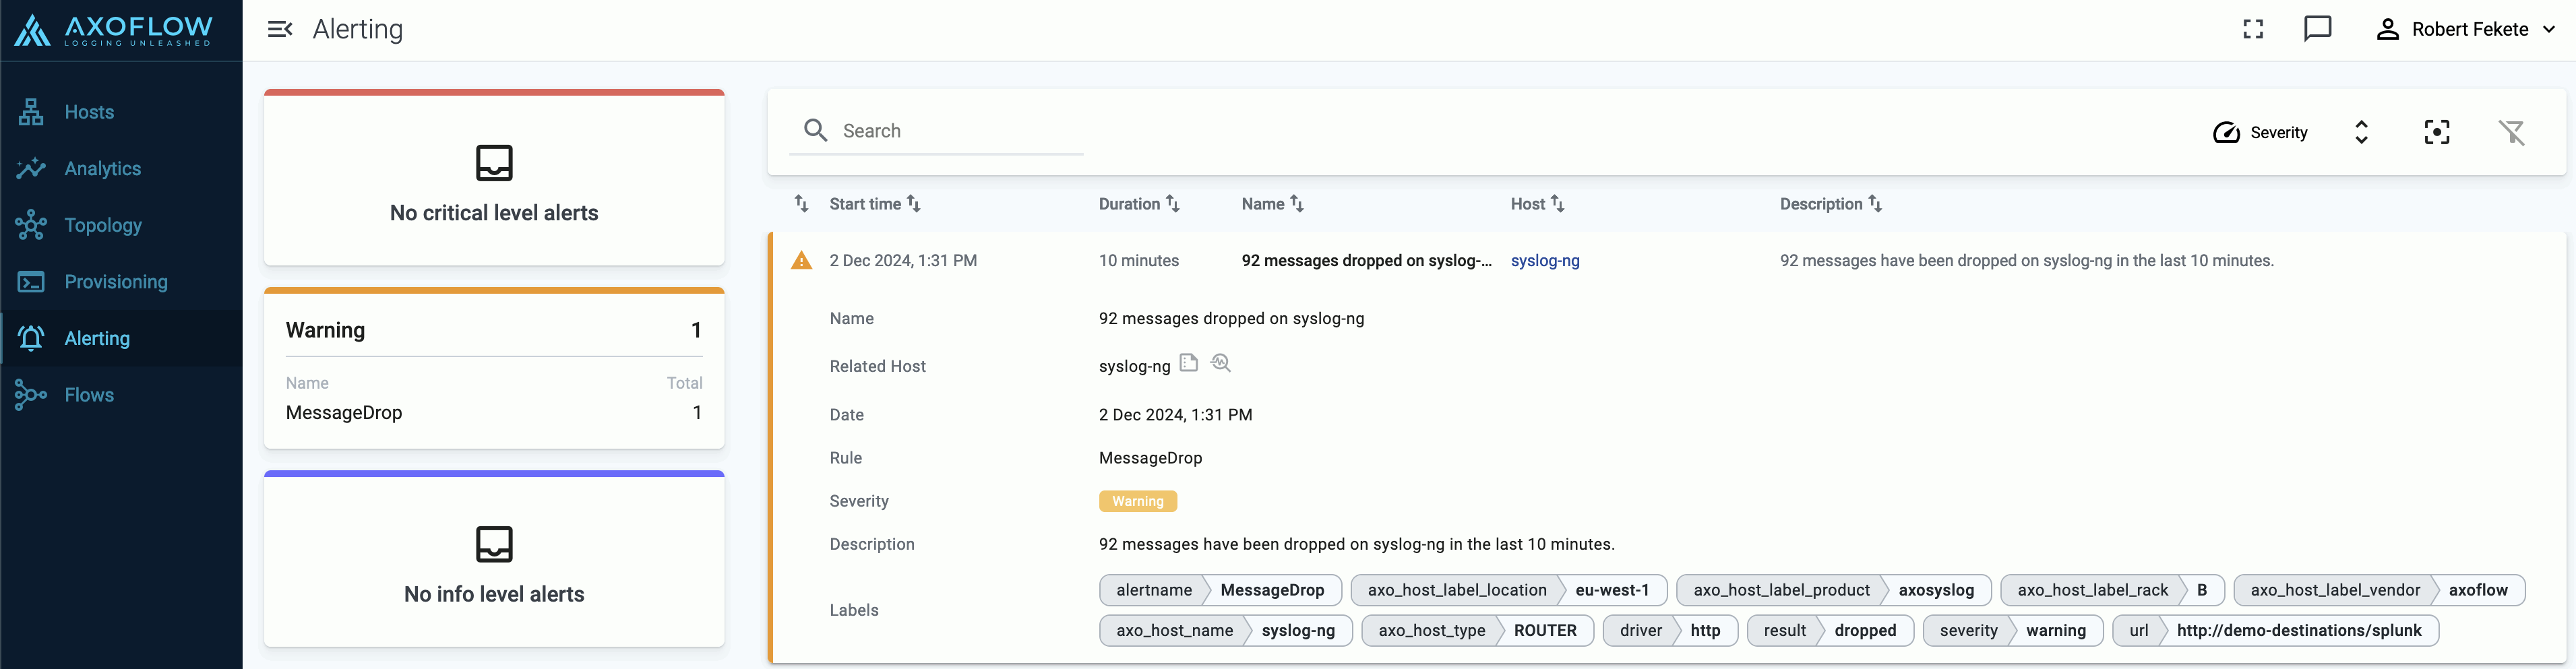
4 - Alerts
Axoflow raises alerts for a number of events in your security data pipeline, for example:
- a destination becomes unavailable or isn’t accepting messages,
- a host is dropping packets or messages,
- a host becomes unavailable,
- the disk queues of a host are filling up,
- abandoned (orphaned) disk buffer files are on the host,
- the configuration of a managed host failed to synchronize or reload,
- traffic of a flow has unexpectedly dropped,
- a new AxoRouter or Axolet version is available.
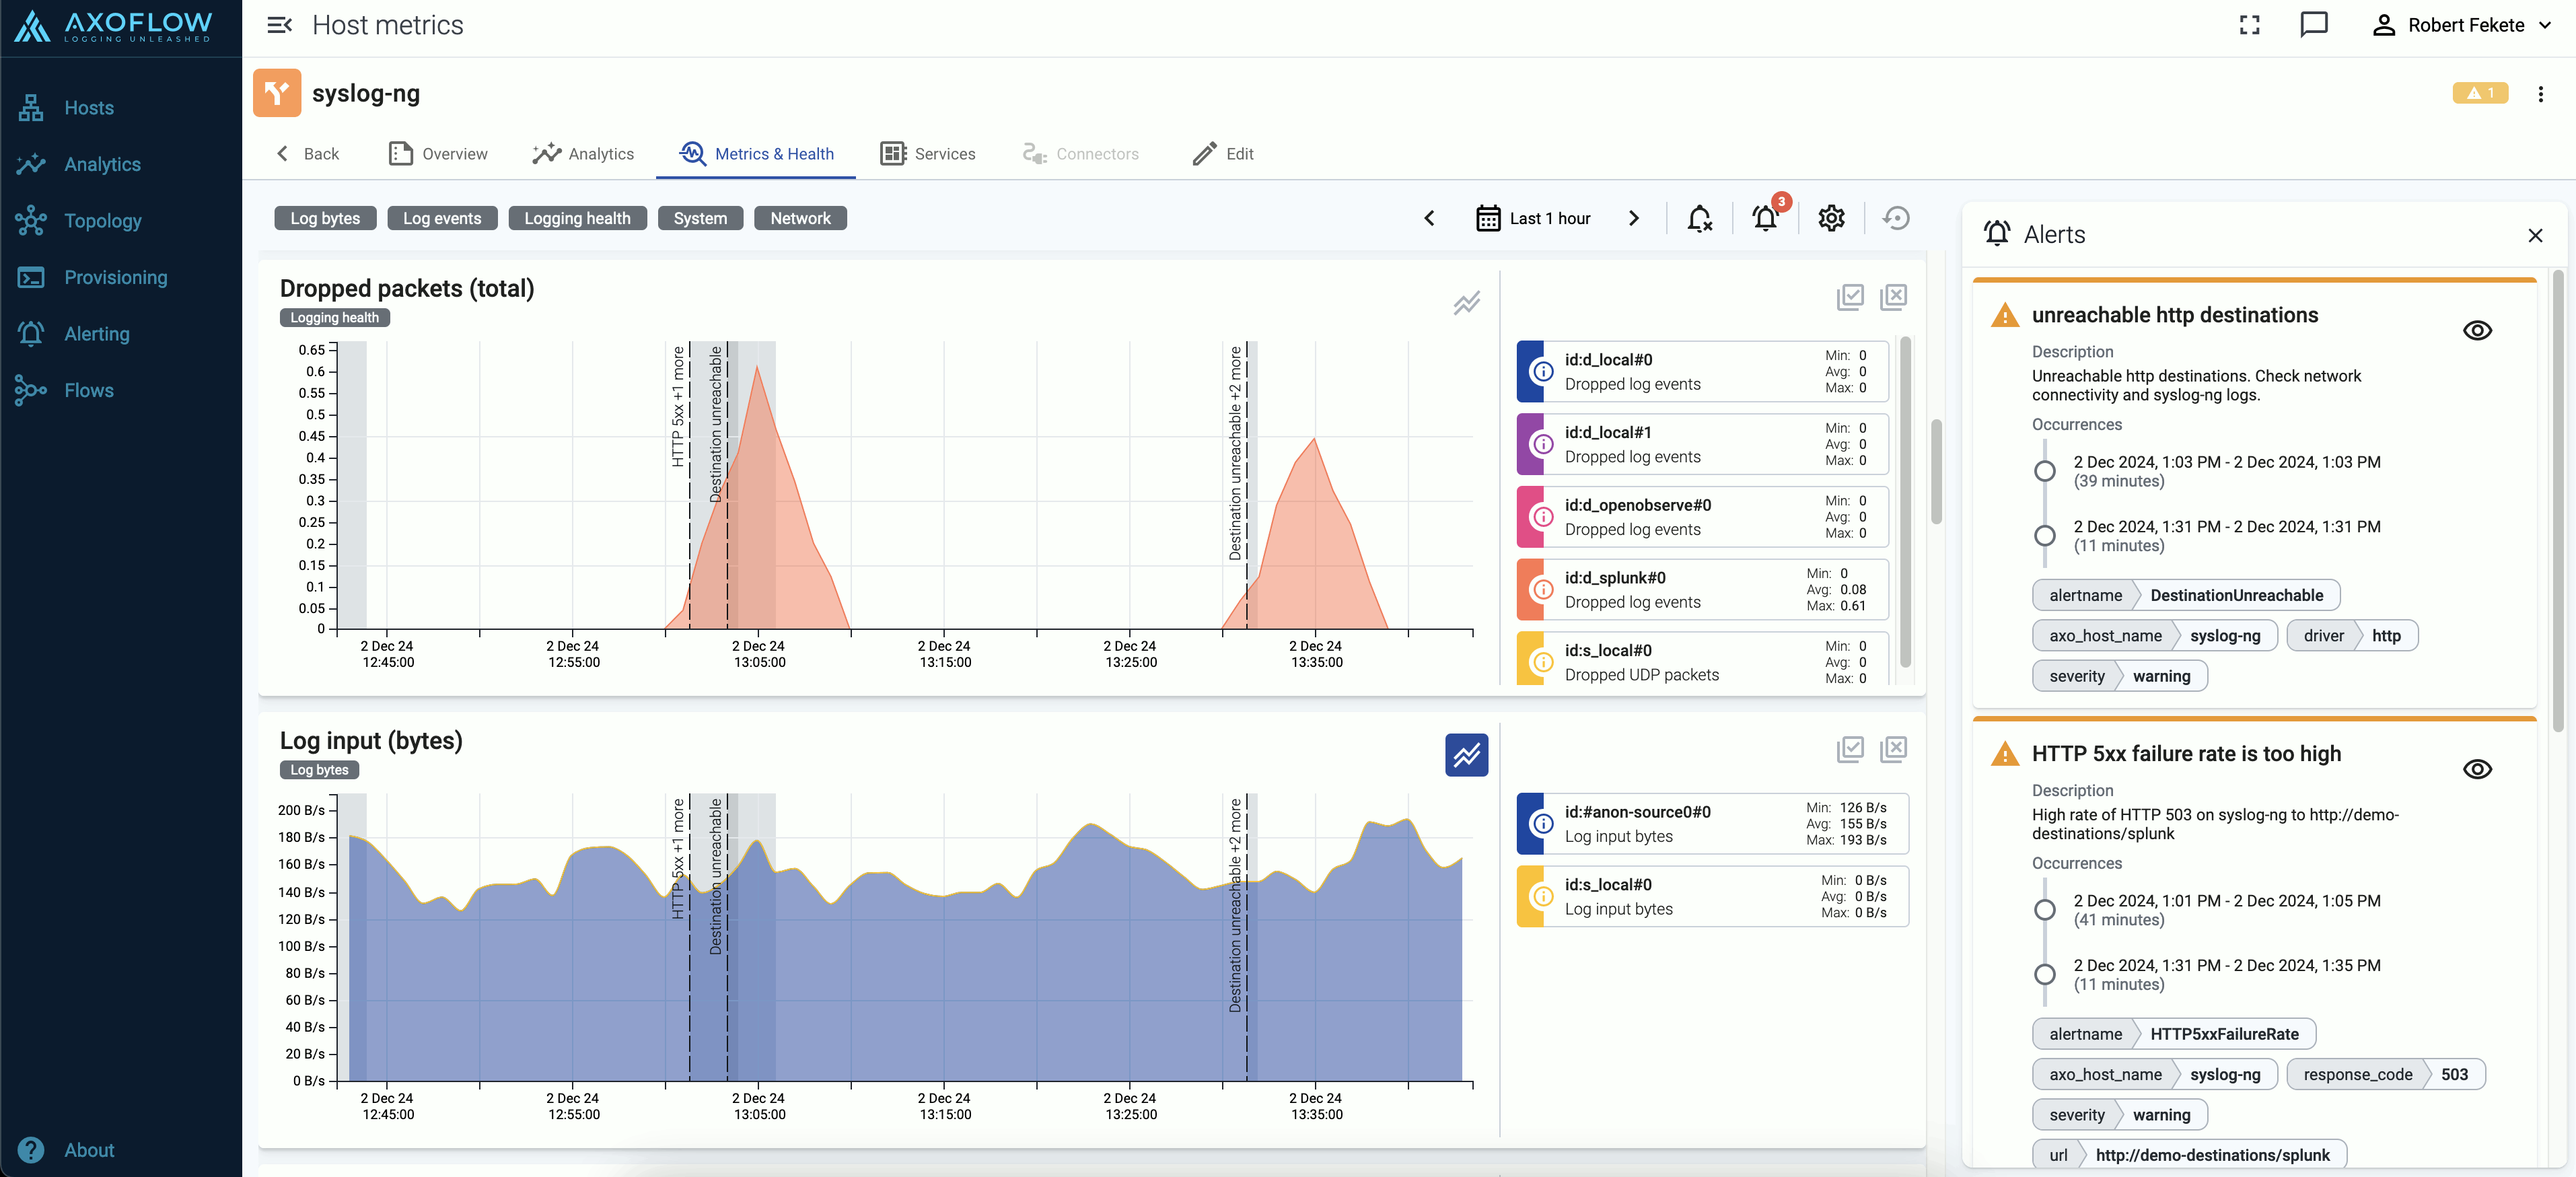
Alerts are indicated at a number of places:
-
On the Alerting page. Select an alert to display its details.
-
On the Topology page:
-
On the Overview page of the host:
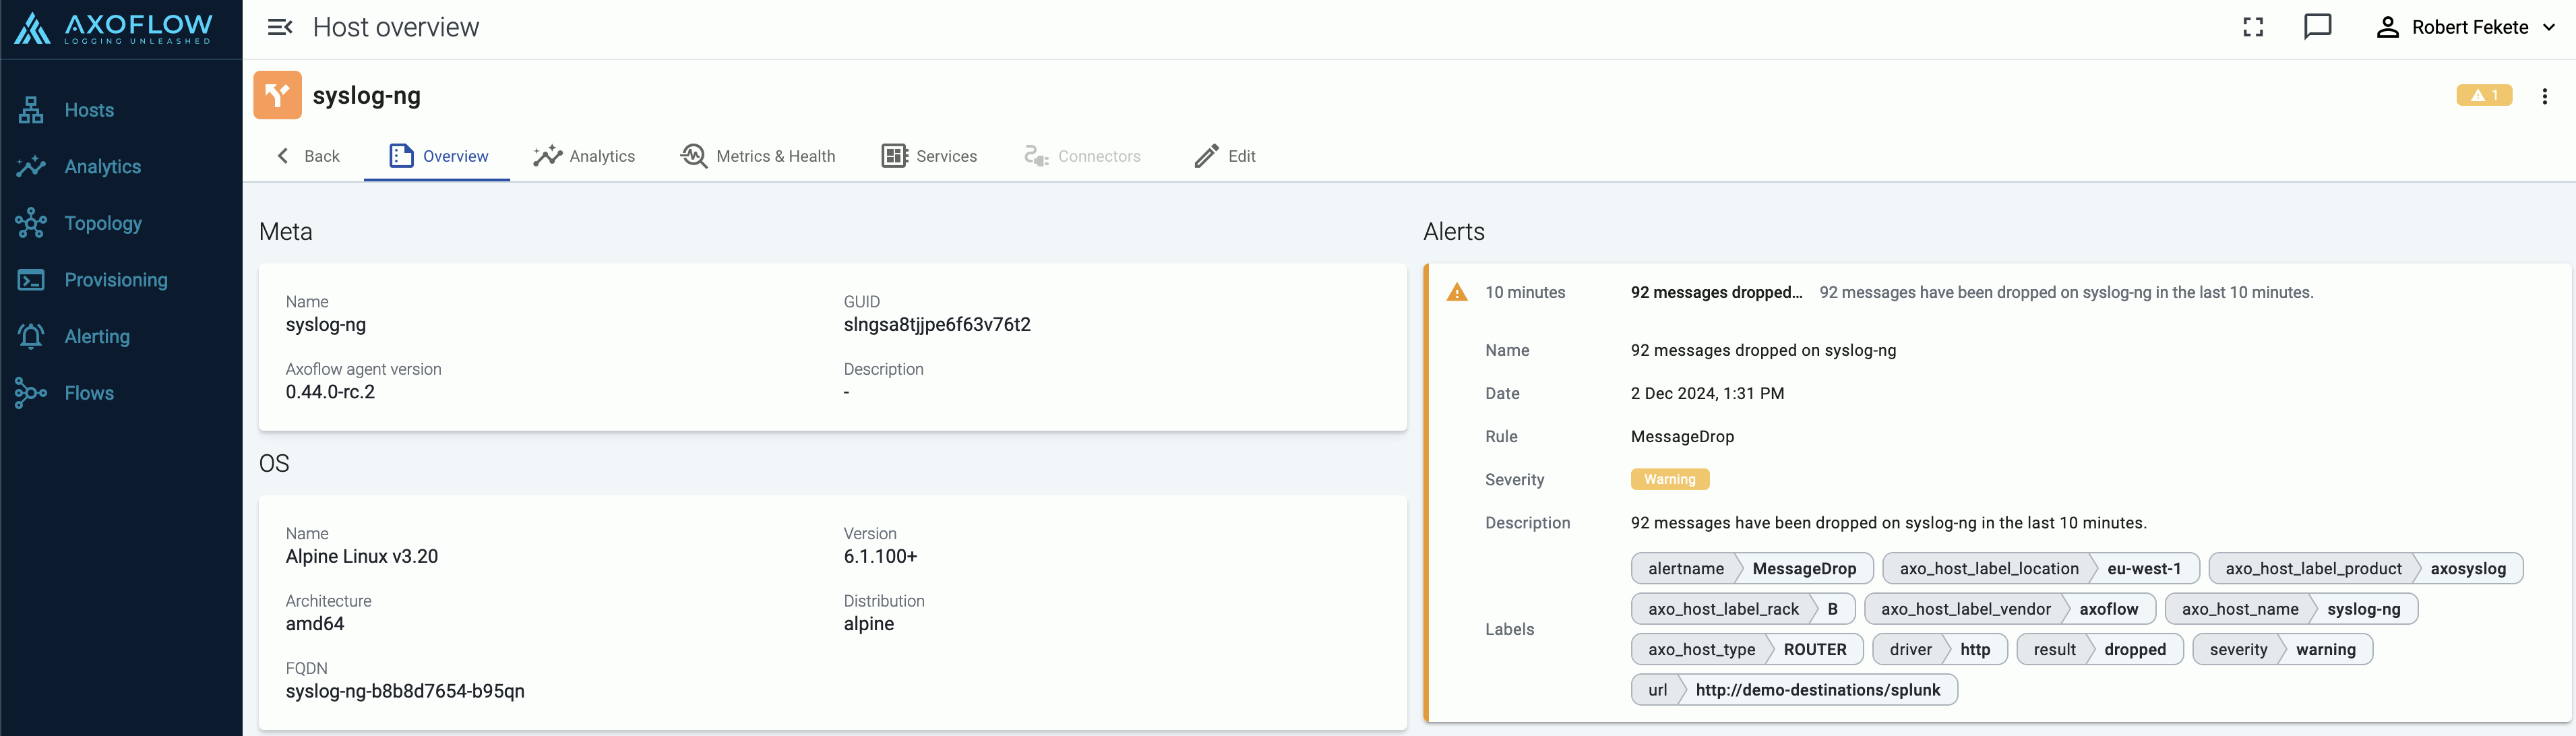
-
On the Metrics & Health page of the host the alerts are shown as an overlay to the metrics:
5 - Private connections
5.1 - Google Private Service Connect
If you want your hosts in Google Cloud to access the AxoConsole without leaving the Google network, we recommend that you use Google Cloud Private Service Connect (PSC) to secure the connection from your VPC to Axoflow.
Prerequisites
Contact Axoflow and provide the list of projects so we can set up an endpoint for your PSC. You will receive information from us that you’ll need to properly configure your connection.
You will also need to allocate a dedicated IP address for the connection in a subnet that’s accessible for the hosts.
Steps
After you have received the details of your target endpoint from Axoflow, complete the following steps to configure Google Cloud Private Service Connect from your VPC to AxoConsole.
-
Open Google Cloud Console and navigate to Private Service Connect > Connected endpoints.
-
Select the project you want to connect to Axoflow.
-
Navigate to Connect endpoint and complete the following steps.
- Select Target > Published service.
- Set Target service to the service name you’ve received from Axoflow. The service name should be similar to:
projects/axoflow-shared/regions/<region-code>/serviceAttachments/<your-tenant-ID> - Set Endpoint name to the name you prefer, or the one recommended by Axoflow. The recommended service name is similar to:
psc-axoflow-<your-tenant-ID> - Select your VPC in the Network field.
- Set Subnet where the endpoint should appear. Since subnets are regional resources, select a subnet in the region you received from Axoflow.
- Select Create IP address and allocate an address for the endpoint. Save the address, you’ll need it later to verify that the connection is working.
- Select Enable global access.
- There is no need to enable the directory API even if it’s offered by Google.
- Select Add endpoint.
-
Test the connection.
-
Log in to a machine where you want to use the PSC using SSH.
-
Test the connection. Run the following command using the IP address you’ve allocated for the endpoint.
curl -vk https://<IP-address-allocated-for-the-endpoint>If the connection is established, you’ll receive an HTTP 404 response.
-
-
If the connection is established, configure DNS resolution on the hosts either for selected machines or the whole VPC.
Setting up selected machines to use the PSC
-
Add the following entry to the
/etc/hostsfile of the machine.<IP-address-allocated-for-the-endpoint> <your-tenant-id>.cloud.axoflow.io kcp.<your-tenant-id>.cloud.axoflow.io telemetry.<your-tenant-id>.cloud.axoflow.io -
Run the following command to test DNS resolution:
curl -v https://<your-tenant-id>.cloud.axoflow.ioIt should load an HTML page from the IP address of the endpoint.
-
If the host is running axolet, restart it by running:
sudo systemctl restart axolet.serviceCheck the axolet logs to verify that there’re no errors:
sudo journalctl -fu axolet -
Deploy the changes of the
/etc/hostsfile to all your VMs.
Setting up whole VPC networks to use the PSC
-
Open Google Cloud Console and in the Cloud DNS service navigate to the Create a DNS zone page.
-
Create a new private zone with the zone name
<your-tenant-id>.cloud.axoflow.io, and select the networks you want to use the PSC in. -
Add the following three A records, all of which targeted to the
<IP-address-allocated-for-the-endpoint>:<your-tenant-id>.cloud.axoflow.iokcp.<your-tenant-id>.cloud.axoflow.iotelemetry.<your-tenant-id>.cloud.axoflow.io