The following chapters show you how to configure specific appliances, applications, and other sources to send their log data to Axoflow.
This is the multi-page printable view of this section. Click here to print.
Sources
- 1: Generic tips
- 2: Edge collection rules
- 2.1: File Collector
- 2.2: Journald Collector
- 2.3: Windows Event Log
- 2.4: Windows Event Tracing
- 3: Data forwarding from edge hosts
- 4: AxoRouter connector rules
- 5: OpenTelemetry
- 6: Syslog
- 7: Webhook
- 8: Windows Event Collector (WEC)
- 9: Vendors
- 9.1: A10 Networks
- 9.1.1: vThunder
- 9.2: Amazon
- 9.2.1: CloudWatch
- 9.3: Axoflow
- 9.3.1: AxoSyslog
- 9.4: Broadcom
- 9.4.1: Edge Secure Web Gateway (Edge SWG)
- 9.4.2: ESX
- 9.4.3: NSX
- 9.4.4: vCenter
- 9.5: Check Point
- 9.5.1: Anti-Bot
- 9.5.2: Anti-Malware
- 9.5.3: Anti-Phishing
- 9.5.4: Anti-Spam and Email Security
- 9.5.5: CPMI Client
- 9.5.6: cpmidu_update_tool
- 9.5.7: Database Tool
- 9.5.8: Edge Secure Web Gateway (Edge SWG)
- 9.5.9: Endpoint Compliance
- 9.5.10: Endpoint Management
- 9.5.11: Forensics
- 9.5.12: GO Password Reset
- 9.5.13: HTTPS Inspection
- 9.5.14: IPS
- 9.5.15: MDS Query Tool
- 9.5.16: Media Encryption & Port Protection
- 9.5.17: Mobile Access
- 9.5.18: Next-Generation Firewall (NGFW)
- 9.5.19: QoS
- 9.5.20: Quantum
- 9.5.21: Query Database
- 9.5.22: SmartConsole
- 9.5.23: SmartUpdate
- 9.5.24: Threat Emulation and Anti-Exploit
- 9.5.25: URL Filtering
- 9.5.26: Web API
- 9.6: Cisco
- 9.6.1: Access Control System (ACS)
- 9.6.2: Adaptive Security Appliance (ASA)
- 9.6.3: Application Control Engine (ACE)
- 9.6.4: Cisco IOS
- 9.6.5: Digital Network Architecture (DNA)
- 9.6.6: Email Security Appliance (ESA)
- 9.6.7: Firepower
- 9.6.8: Firepower Threat Defence (FTD)
- 9.6.9: Firewall Services Module (FWSM)
- 9.6.10: HyperFlex (HX, UCSH)
- 9.6.11: Identity Services Engine (ISE)
- 9.6.12: Integrated Management Controller (IMC)
- 9.6.13: IOS XR
- 9.6.14: Meraki MX
- 9.6.15: Private Internet eXchange (PIX)
- 9.6.16: TelePresence Video Communication Server (VCS)
- 9.6.17: Unified Computing System Manager (UCSM)
- 9.6.18: Unified Communications Manager (UCM)
- 9.6.19: Viptela
- 9.7: Citrix
- 9.7.1: Netscaler
- 9.8: Corelight
- 9.9: CyberArk
- 9.9.1: Privileged Threat Analytics (PTA)
- 9.9.2: Vault
- 9.10: F5 Networks
- 9.10.1: BIG-IP
- 9.11: FireEye
- 9.12: Forcepoint
- 9.12.1: Email Security
- 9.12.2: Next-Generation Firewall (NGFW)
- 9.12.3: WebProtect
- 9.13: Fortinet
- 9.13.1: FortiGate firewalls
- 9.13.2: FortiMail
- 9.13.3: FortiProxy
- 9.13.4: FortiWeb
- 9.14: Fortra
- 9.14.1: Powertech SIEM Agent for IBM i
- 9.15: General Unix/Linux host
- 9.15.1: Generic Linux services
- 9.16: Imperva
- 9.16.1: Incapsula
- 9.16.2: SecureSphere
- 9.17: Infoblox
- 9.17.1: NIOS
- 9.18: Ivanti
- 9.18.1: Connect secure
- 9.19: Juniper
- 9.19.1: Junos OS
- 9.20: Kaspersky
- 9.20.1: Endpoint Security
- 9.21: Kubernetes
- 9.21.1: NGINX Ingress
- 9.21.2: Telemetry Controller
- 9.22: MicroFocus
- 9.23: Microsoft
- 9.23.1: Azure Event Hubs
- 9.23.2: Cloud App Security (MCAS)
- 9.23.3: Windows hosts
- 9.24: MikroTik
- 9.24.1: RouterOS
- 9.25: NetFlow Logic
- 9.25.1: NetFlow Optimizer
- 9.26: Netgate
- 9.26.1: pfSense
- 9.27: Netmotion
- 9.27.1: Netmotion
- 9.28: NETSCOUT
- 9.28.1: Arbor Edge Defense (AED)
- 9.28.2: Arbor Pravail (APS)
- 9.29: Omnissa
- 9.29.1: Horizon
- 9.30: OpenText
- 9.30.1: ArcSight
- 9.30.2: Self Service Password Reset (SSPR)
- 9.31: Palo Alto Networks
- 9.31.1: Cortex XSOAR
- 9.31.2: Palo Alto firewalls
- 9.32: Ping Identity
- 9.32.1: PingAccess
- 9.33: Powertech
- 9.34: Progress
- 9.35: Riverbed
- 9.35.1: SteelConnect
- 9.35.2: SteelHead
- 9.36: RSA
- 9.36.1: Authentication Manager
- 9.37: rsyslog
- 9.38: SecureAuth
- 9.38.1: Identity Platform
- 9.39: Skyhigh Security
- 9.39.1: Secure Web Gateway
- 9.40: SonicWall
- 9.40.1: SonicWall
- 9.41: Splunk
- 9.41.1: Heavy Forwarder
- 9.42: Superna
- 9.42.1: Eyeglass
- 9.43: syslog-ng
- 9.44: Thales
- 9.44.1: Vormetric Data Security Platform
- 9.45: Trellix
- 9.45.1: Central Management System (CMS)
- 9.45.2: Email Threat Prevention (ETP)
- 9.45.3: Endpoint Security (HX)
- 9.45.4: ePolicy Orchestrator (EPO)
- 9.45.5: MPS
- 9.46: Trend Micro
- 9.46.1: Deep Security Agent
- 9.47: Ubiquiti
- 9.47.1: Unifi
- 9.48: Varonis
- 9.48.1: DatAdvantage
- 9.49: Vectra AI
- 9.49.1: X-Series
- 9.50: Zscaler appliances
- 9.50.1: Zscaler Nanolog Streaming Service
- 9.50.2: Zscaler Log Streaming Service
1 - Generic tips
The following section gives you a generic overview on how to configure a source to send its log data to Axoflow.
-
If your source has a specific entry in the Vendors section, follow that instead of the generic procedure.
-
To collect data from an edge host, see Edge collection rules.
- Sources are hosts that are sending data to a data aggregator, like AxoRouter.
- Edges are source hosts that are running a collector agent managed by AxoConsole, or have an Axolet agent reporting metrics from the host.
CAUTION:
Make sure to set data forwarding on your appliances/servers as described in this guide. Different settings like alternate message formats or ports might be valid, but can result in data loss or incorrect parsing.Default connectors
Sources can send their data to an AxoRouter connector. By default, AxoConsole has AxoRouter connector rules that create the following connectors on AxoRouter deployments.
The following connector types are available:
Parsing and classification is enabled for the default connectors. To create other connectors, or modify the default ones see AxoRouter connector rules. (The default connector rules have “Factory default connector rule” in their description.)
Open ports
By default, AxoRouter accepts data on the following ports (unless you’ve modified the default connector rules):
- 514 UDP and TCP for RFC3164 (BSD-syslog) and RFC5424 (IETF-syslog) formatted traffic. AxoRouter automatically recognizes and handles both formats.
- 601 TCP for RFC5424 (IETF-syslog) and RFC3164 (BSD-syslog) formatted traffic. AxoRouter automatically recognizes and handles both formats.
- 6514 TCP for TLS-encrypted syslog traffic.
- 4317 TCP for OpenTelemetry log data.
To receive data on other ports or other protocols, configure other connector rules for the AxoRouter host.
For TLS-encrypted syslog connections, create a new connector rule or edit an existing one, and configure the keys and certificates needed to encrypt the connections. For details, see Syslog.
Note
Make sure to enable the ports you’re using on the firewall of your host.
Prerequisites
To configure a source to send data to Axoflow, make sure that:
- You have administrative access to the device or host.
- The date, time, and time zone are correctly set on the source.
- You have an AxoRouter deployed and configured with a Syslog connector that has parsing and classification enabled (by default, every AxoRouter has such connectors). This device is going to receive the data from the source.
-
You know the IP address the AxoRouter. To find it:
- Open the AxoConsole.
- Select the Routers or the Topology page.
- Select on AxoRouter instance that is going to receive the logs.
- Check the Networks > Address field.
Steps
-
Log in to your device. You need administrator privileges to perform the configuration.
-
If needed, enable syslog forwarding on the device.
-
Set AxoRouter as the syslog server. Typically, you can configure the following parameters:
-
Name or IP Address of the syslog server: Set the address of your AxoRouter.
-
Protocol: If possible, set TCP or TLS.
Note If you’re sending data over TLS, make sure to configure a TLS-enabled connector rule in Axoflow. -
Syslog Format: If possible, set RFC5424 (or equivalent), otherwise leave the default.
-
Port: Set a port appropriate for the protocol and syslog format you have configured.
By default, AxoRouter accepts data on the following ports (unless you’ve modified the default connector rules):
- 514 UDP and TCP for RFC3164 (BSD-syslog) and RFC5424 (IETF-syslog) formatted traffic. AxoRouter automatically recognizes and handles both formats.
- 601 TCP for RFC5424 (IETF-syslog) and RFC3164 (BSD-syslog) formatted traffic. AxoRouter automatically recognizes and handles both formats.
- 6514 TCP for TLS-encrypted syslog traffic.
- 4317 TCP for OpenTelemetry log data.
To receive data on other ports or other protocols, configure other connector rules for the AxoRouter host.
For TLS-encrypted syslog connections, create a new connector rule or edit an existing one, and configure the keys and certificates needed to encrypt the connections. For details, see Syslog.
Note Make sure to enable the ports you’re using on the firewall of your host.
-
-
Add the source to AxoConsole.
-
Open the AxoConsole and select Topology.
-
Select Add Item > Source.
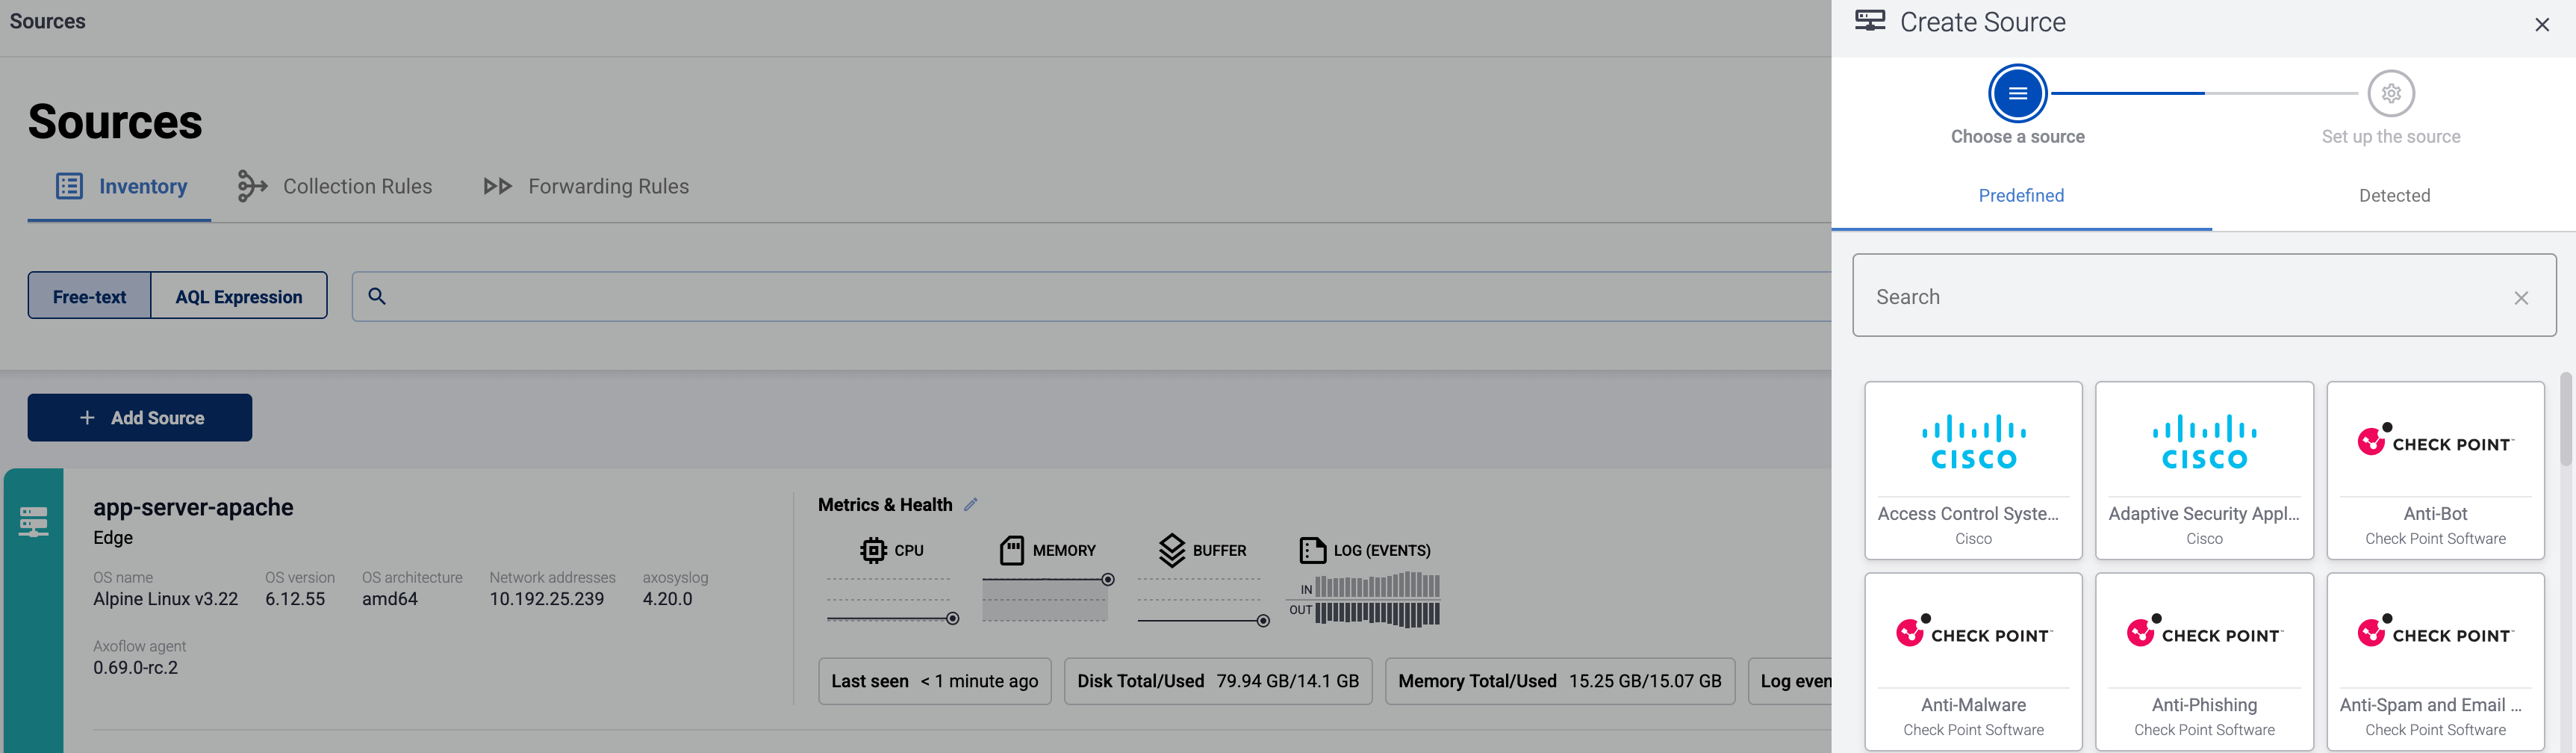
-
If the source is actively sending data to an AxoRouter instance, select Detected, then select your source.
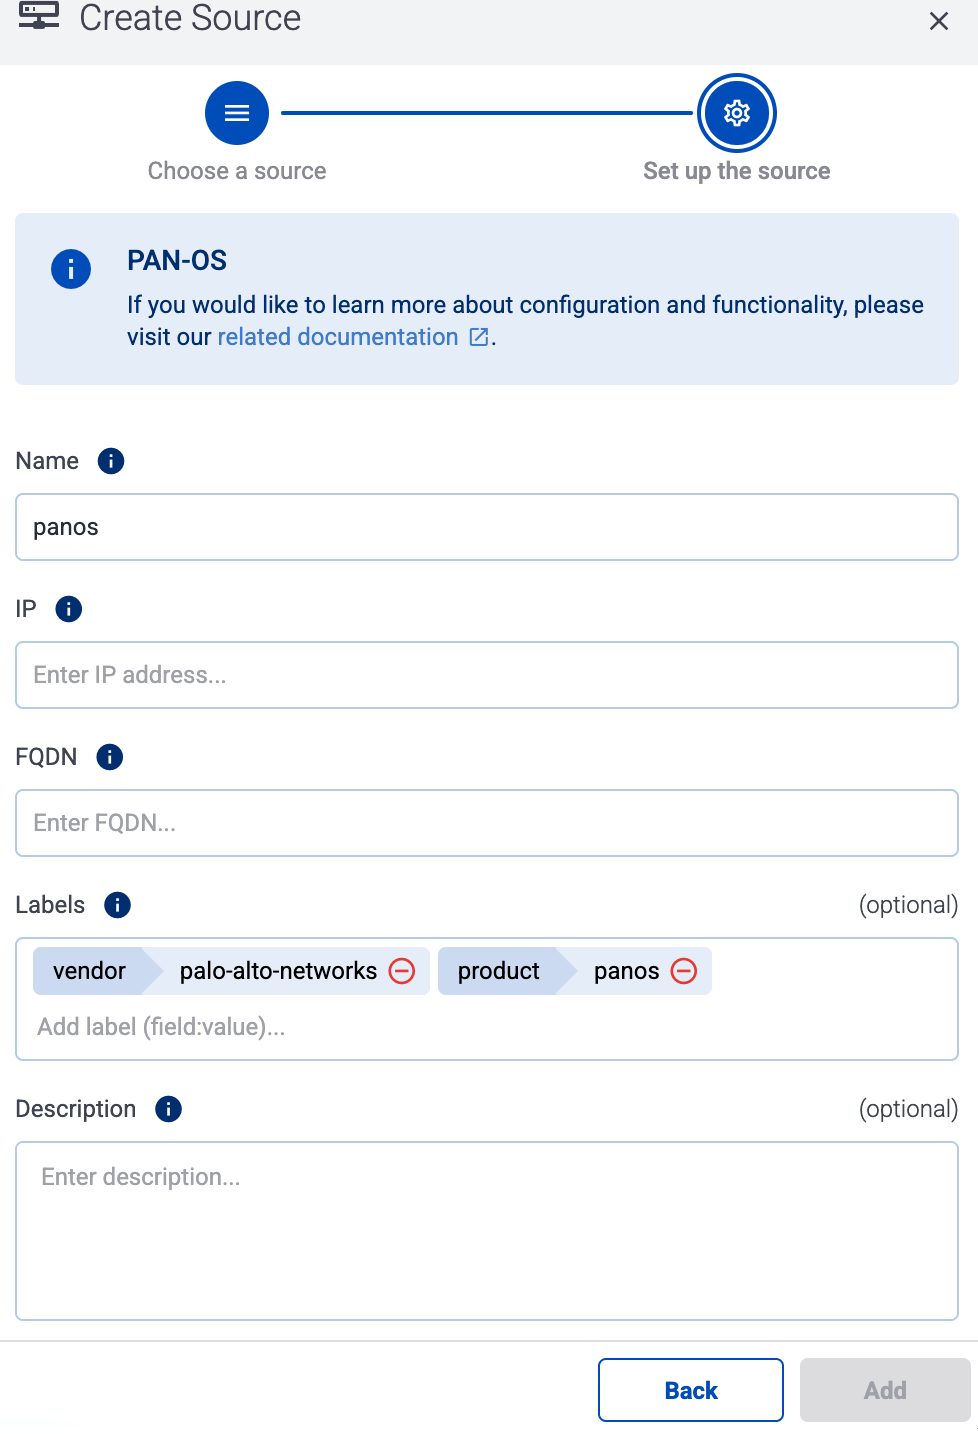
-
Otherwise, select the vendor and product corresponding to your source from the Predefined sources, then enter the parameters of the source, like IP address and FQDN.
Note During log tapping, you can add hosts that are actively sending data to an AxoRouter instance by clicking Register source. -
-
(Optional) Add custom labels as needed.
-
Select Add.
-
Note
If your syslog source is running
syslog-ng, Splunk Connect for Syslog (SC4S), or AxoSyslog as its log forwarder agent, consider installing Axolet on the host and instrumenting the configuration of the log forwarder to receive detailed metrics about the host and the processed data. For details, see Manage and monitor the pipeline.
2 - Edge collection rules
Collection rules define how edge hosts collect their local data. To collect data from non-edge sources, see AxoRouter connector rules.
- Sources are hosts that are sending data to a data aggregator, like AxoRouter.
- Edges are source hosts that are running a collector agent managed by AxoConsole, or have an Axolet agent reporting metrics from the host.
Note
Collection rules and data forwarding rules are currently supported on Windows hosts.
Collection rules are high-level policies that determine how data should be collected on a set of edge hosts based on dynamic host labels.

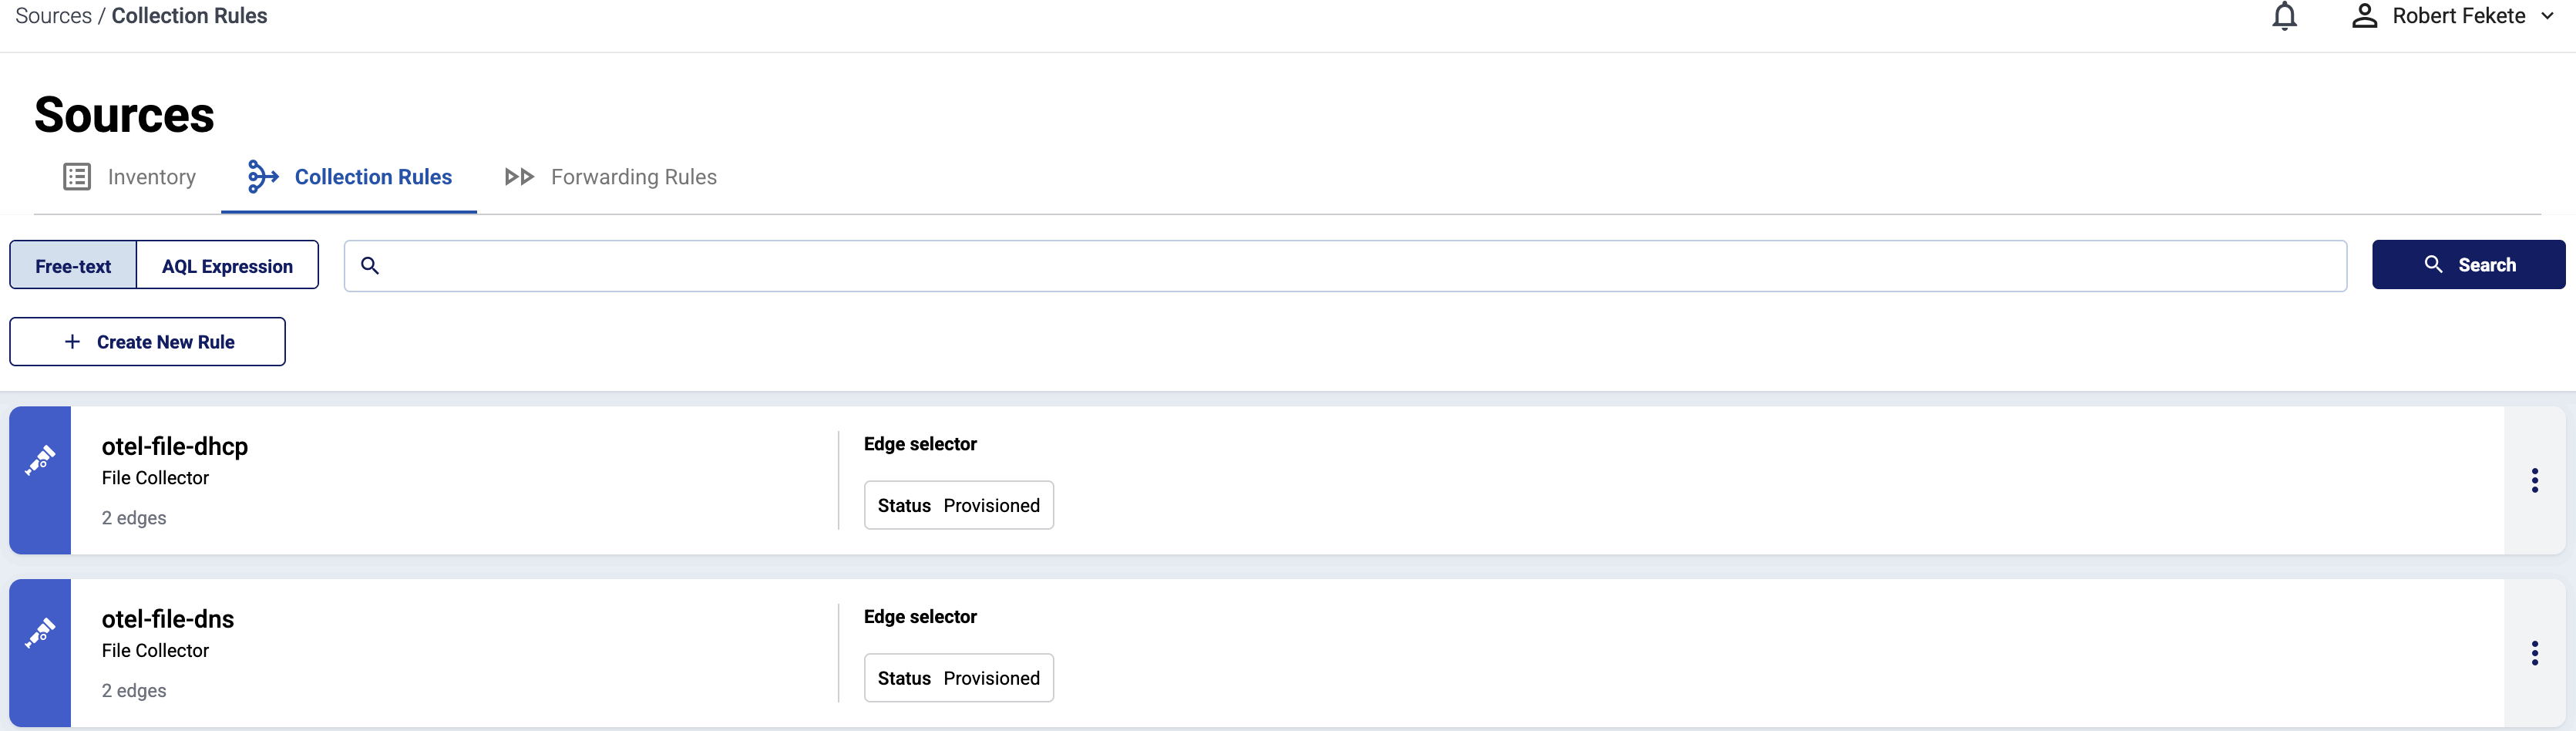
To see every collection rule configured in AxoConsole, select Sources > Collection Rules from the main menu.
Collection rules have the following main elements:
-
the way they collect data (for example, from files, or Windows Event Logs), and other specific parameters (for example, the path and filename)
-
the edge selector, which determines the list of edge hosts that will create a collector based on that rule.
You can use any labels and metadata of the edge hosts in the edge selectors, for example, the hostname, or any custom labels. For example, using the
label.product = windowsselector will create a collector only on Windows hosts.
Selecting a collection rule shows the details of the rule, including:
- The list of Matched hosts: the edge hosts that will have a collector based on that rule. If you click on the name of a matched host, the Collection Rules page of the AxoRouter host opens, showing you the collectors configured for that host.
-
- Idle: The rule doesn’t match any hosts currently.
- Provisioned: Connectors based on this rule were successfully provisioned for every matching host.
- Error: Some error(s) occurred while provisioning connectors based on this rule. See the Status message field for details.
- Unknown: The rule is in an unknown state.
-
Attributes: Various significant attributes of connectors provisioned based on this rule.
Create collection rule
To create a new connector rule, complete the following steps.
-
Select Routers > Connector Rules > Add Rule. (Alternatively, you can select Add Connector > Create a connector rule on the Connectors page of an AxoRouter host.)
-
Select the type of collector you want to create. For example, File Collector. The following collector types are available:
- File Collector(OpenTelemetry)
- Windows Event Log
- Windows Event Tracing (ETW)
-
Configure the collection rule.
-
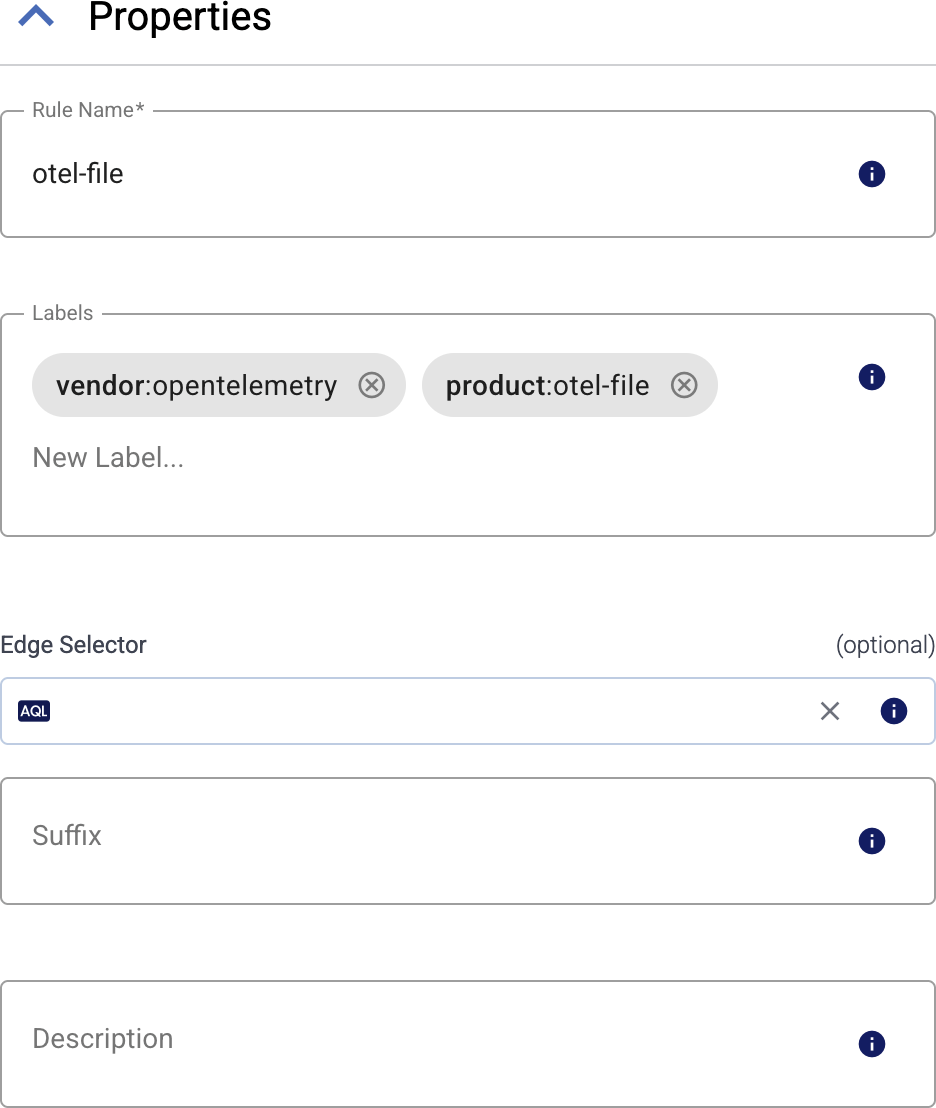
Enter a name for the collection rule into the Rule Name field.
-
(Optional) Add labels to the collection rule.
You can use these metrics labels as:
- Filter labels on the Analytics page
- in the Filter By Label field during log tapping
- in Flow Processing steps, for example, in the Query field of Select Messages steps.
-
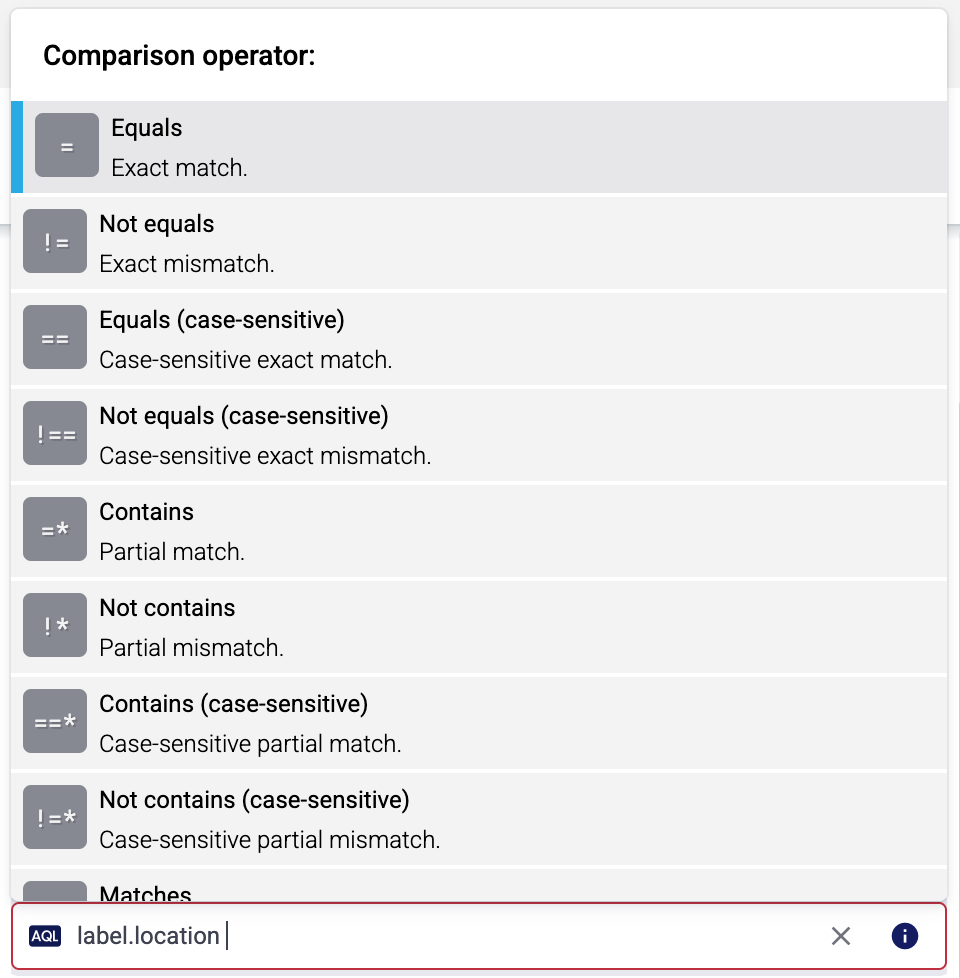
Set the Edge Selector for the collection rule. The selector determines which edge hosts will have a collector based on this collection rule.
- Only edge hosts will match the rule.
- If you leave the Edge Selector field empty, the rule will match every edge host.
- To select only a specific host, set the
namefield to the name of the host as selector. - If you set multiple fields in the selector, the collection rule will apply only to edge hosts that match all elements of the selector. (There in an AND relationship between the fields.) For example,
label.location = us-east-1 AND label.product = windows
-
(Optional) Enter a Suffix for the collection rule. This suffix will be used in the name of the collector instances created on the edge hosts. For example, if the name of a matching edge host is “my-edge”, and the suffix of the rule is “otel-file-collector”, the collector created for the edge will be named “my-edge-otel-file-collector”.
If the Suffix field is empty, the name of the collection rule is used instead.
-
(Optional) Enter a description for the rule.
-
-
Configure the options specific to the collector type. For details, see the specific pages:
- File Collector(OpenTelemetry)
- Windows Event Log
- Windows Event Tracing (ETW)
-
Select Add. Based on the collection rule, Axoflow automatically creates collectors on the edge hosts that match the Edge Selector.
CAUTION:
Make sure to configure Data Forwarding Rules for your edge hosts to transfer the collected data to the OpenTelemetry connector of an AxoRouter.
Modify collection rule
To modify an existing collection rule, complete the following steps.
Note
- You cannot directly modify the collector of an edge host, only via modifying a collection rule.
- Modifying a collection rule affects every edge host that matches the Edge Selector of the rule.
- To apply an existing collection rule to a new edge host, you can:
- Add a label to the edge host so the Edge Selector of the collection rule matches the new host, and/or
- Change the Edge Selector of the collection rule to match the new host.
-
Find the collection rule you want to modify:
- Select Sources > Collection Rules from the main menu, then select the collection rule you want to modify.
- Alternatively, find the edge host whose collector you want to modify on the Topology page, then select Collection Rules. Find the collection rule you want to modify, then select ⋮ > Edit collection rule.
-
Modify the configuration of the collection rule as needed.
CAUTION:
The changes are applied immediately after you click Update. Double-check your changes to avoid losing data. -
Select Update.
Add edge host to existing collection rule
To add an edge host to an existing collector rule, you have two options, depending on the Edge Selector of the collection rule:
- Modify the Edge Selector field of the collection rule to include the new edge host.
- Modify the labels of the edge host so it matches the edge selector of the collection rule.
2.1 - File Collector
Collect logs from a local file that’s available on the edge host.
Prerequisites
This collector can be deployed to edge hosts running Axoflow agent for Linux and Axoflow agent for Windows.
Add new File Collector
To create a new Collection Rule that collects data from files on edge hosts, complete the following steps:
-
Select Sources > Collection Rules > Add Rule. (Alternatively, you can select Add Collector > Create a collection rule on the Collectors page of an edge host.)
-
Select File Collector.
-
Configure the connector rule.
-
Enter a name for the collection rule into the Rule Name field.
-
(Optional) Add labels to the collection rule.
You can use these metrics labels as:
- Filter labels on the Analytics page
- in the Filter By Label field during log tapping
- in Flow Processing steps, for example, in the Query field of Select Messages steps.
-
Set the Edge Selector for the collection rule. The selector determines which edge hosts will have a collector based on this collection rule.
- Only edge hosts will match the rule.
- If you leave the Edge Selector field empty, the rule will match every edge host.
- To select only a specific host, set the
namefield to the name of the host as selector. - If you set multiple fields in the selector, the collection rule will apply only to edge hosts that match all elements of the selector. (There in an AND relationship between the fields.) For example,
label.location = us-east-1 AND label.product = windows
-
(Optional) Enter a Suffix for the collection rule. This suffix will be used in the name of the collector instances created on the edge hosts. For example, if the name of a matching edge host is “my-edge”, and the suffix of the rule is “otel-file-collector”, the collector created for the edge will be named “my-edge-otel-file-collector”.
If the Suffix field is empty, the name of the collection rule is used instead.
-
(Optional) Enter a description for the rule.
-
-
Enter the path of the log file, or a pattern to match multiple files into the File pattern field, for example:
C:\Windows\System32\DNS\dns.logor/path/to/**/*.log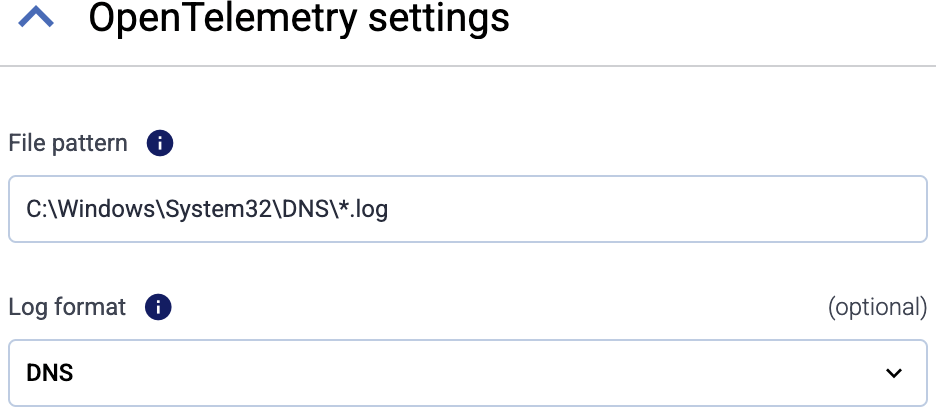
CAUTION:
On Linux hosts, the collector runs as theaxoflow-otel-collectoruser, which is a member of theadmandsystemd-journalgroups. Make sure that theaxoflow-otel-collectoruser has read access to the file you want to collect logs from. Usually, theadmgroup can read logs from the/var/log/directory on Debian-based systems, but not on RHEL-based systems.You can use the following special characters:
-
*: Matches one or more characters that aren’t path separators. -
/**/: Matches zero or more directories. -
?: Matches a single non-path-separator character. -
[class]: Matches any single non-path-separator character from the specified class. The following classes are available:[abc123]: Matches any single character of the specified characters.[a-z0-9]: Matches any single alphanumeric character in the range of a-z or 0-9.[^class]or[!class]: Negates the class, so it matches any single character which does not match the class.
-
-
(Optional) If needed, set advanced options under More options.
-
To apply a specific parser on the messages of the log file, select it from the Log format field. Currently Windows DNS and DHCP log files are supported.11
-
Select Add. Based on the collection rule, Axoflow automatically creates collectors on the edge hosts that match the Edge Selector.
CAUTION:
Make sure to configure Data Forwarding Rules for your edge hosts to transfer the collected data to the OpenTelemetry connector of an AxoRouter.
Related metrics
You can use these metrics labels as:
- Filter labels on the Analytics page
- in the Filter By Label field during log tapping
- in Flow Processing steps, for example, in the Query field of Select Messages steps.
| label | value |
|---|---|
| edge_connector_name | The name of the collector that collected the message. |
| edge_connector_type | otelFile |
| edge_connector_label_ | Labels set by the collector. By default: vendor:opentelemety, product:otel-file |
| edge_connector_rule_id | The ID of the Collector Rule resource in Axoflow that created the collector. |
| edge_flow_name | The name of the data forwarding rule that sent the message. |
Advanced options
-
Exclude file pattern: Exclude some files that match the File pattern. You can use the same special characters as in the File pattern field.
-
Exclude older than: Exclude files whose modification time is older than the specified value, for example:
1h,24h,7d. -
Multi-line start pattern: Regex pattern to identify the start of a multi-line log entry. Mutually exclusive with Multi-line end pattern.
-
Multi-line end pattern: Regex pattern to identify the end of a multi-line log entry. Mutually exclusive with Multi-line start pattern.
-
Multi-line omit pattern: If enabled, the lines matching the multiline pattern are omitted from the entry.
-
Force flush period: Always flush the current batch if the after the specified period. Example values:
1s,5m,1h. Default value:500ms -
Encoding: Specifies the encoding of the file being read. Default value:
utf-8. The following values are supported:nop: No encoding validation. Treats the file as a stream of raw bytesutf-8: UTF-8 encodingutf-8-raw: UTF-8 encoding without replacing invalid UTF-8 bytesutf-16le: UTF-16 encoding with little-endian byte orderutf-16be: UTF-16 encoding with big-endian byte orderascii: ASCII encodingbig5: The Big5 Chinese character encoding
-
Poll interval: The duration between filesystem polls, for example:
1s,5m,1h. Default value:200ms -
Retry on failure max elapsed time: Maximum time (including retries) to send a log batch to a downstream consumer before discarding it, for example:
1s,5m,1h. Retrying never stops if set to0. Default value0 -
Initial buffer size: The initial size (in KiB) of the buffer to read file headers and logs. The buffer will grow as needed; larger values may cause unnecessary memory allocation, while smaller values may require multiple copies during growth. Default value:
16KiB -
Max log size: Maximum size of a log entry in megabytes. Larger log entries will be truncated. Default value:
1MiB -
Max concurrent files: Maximal number of files to read from in parallel.
-
Max batches: Maximum number of batches to keep in memory; applicable only when more than
1024files match the File pattern. -
Compression: Specifies the compression format of the files being read. Possible values are the empty string,
gzip, andauto. Useautowhen your File pattern matches a mix of compressed and uncompressed files. -
Start at: Specifies where to start reading logs on startup:
beginningorendof the file. Default value:beginning
2.2 - Journald Collector
Collect logs from the journald system service of Linux-based edge hosts.
Prerequisites
This collector can be deployed to edge hosts running Axoflow agent for Linux.
Add new Journald Collector
To create a new Collection Rule that collects logs from journald, complete the following steps:
-
Select Sources > Collection Rules > Add Rule. (Alternatively, you can select Add Collector > Create a collection rule on the Collectors page of an edge host.)
-
Select Journald Collector.
-
Configure the connector rule.
-
Enter a name for the collection rule into the Rule Name field.
-
(Optional) Add labels to the collection rule.
You can use these metrics labels as:
- Filter labels on the Analytics page
- in the Filter By Label field during log tapping
- in Flow Processing steps, for example, in the Query field of Select Messages steps.
-
Set the Edge Selector for the collection rule. The selector determines which edge hosts will have a collector based on this collection rule.
- Only edge hosts will match the rule.
- If you leave the Edge Selector field empty, the rule will match every edge host.
- To select only a specific host, set the
namefield to the name of the host as selector. - If you set multiple fields in the selector, the collection rule will apply only to edge hosts that match all elements of the selector. (There in an AND relationship between the fields.) For example,
label.location = us-east-1 AND label.product = windows
-
(Optional) Enter a Suffix for the collection rule. This suffix will be used in the name of the collector instances created on the edge hosts. For example, if the name of a matching edge host is “my-edge”, and the suffix of the rule is “otel-file-collector”, the collector created for the edge will be named “my-edge-otel-file-collector”.
If the Suffix field is empty, the name of the collection rule is used instead.
-
(Optional) Enter a description for the rule.
-
-
(Optional) To read older entries from the journal files, set Start at to
Beginning. Otherwise, Axoflow agent will only forward the journal entries that are created after the collector has been deployed.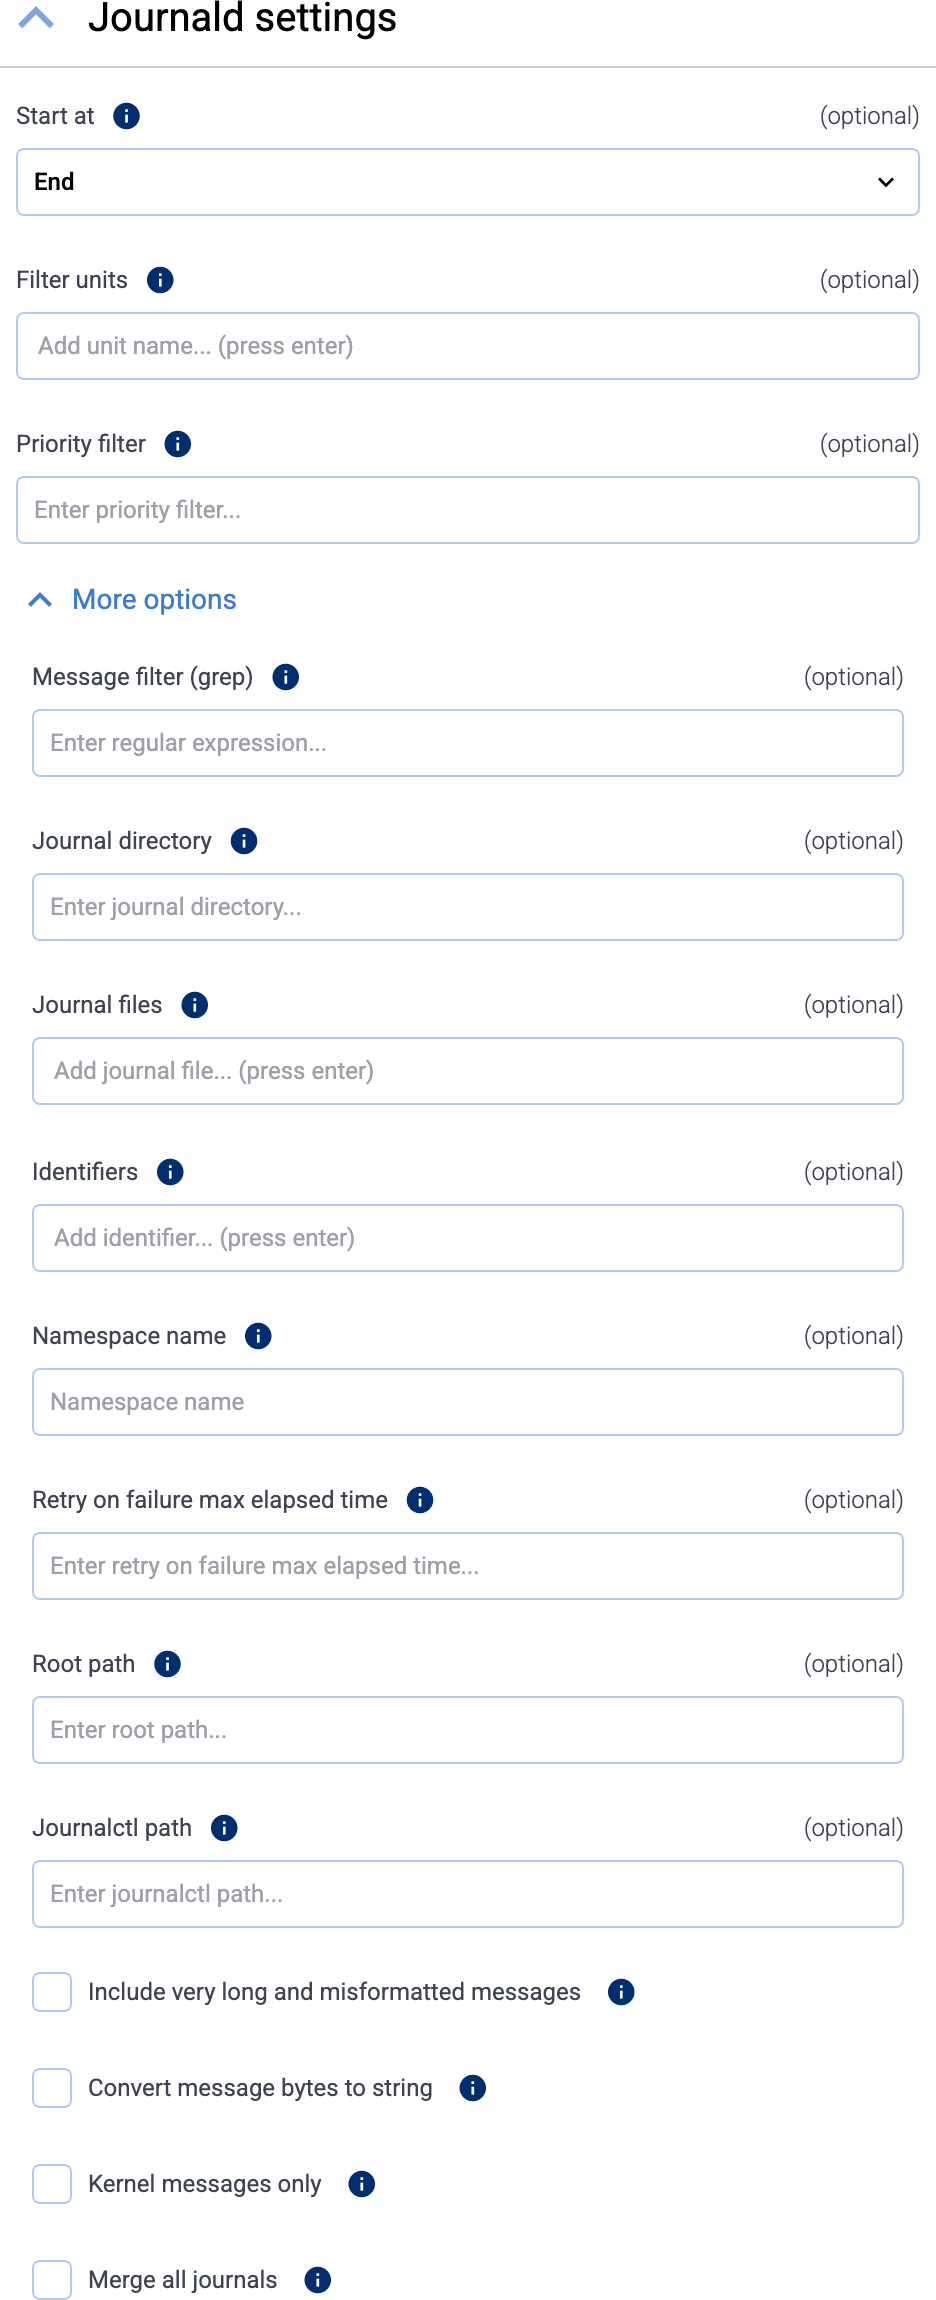
-
(Optional) To read only the entries from specific journald units, list the units in the Filter units field (for example,
nginx.service). By default, Axoflow agent reads the entries of every unit. To list the units available on a host, run the following command on the host:sudo systemctl list-units -
(Optional) To read only entries with the specified or higher priority, enter the priority value into the Priority filter field. Default value:
info(so debug level entries are omitted). The possible values in decreasing order are:emerg,alert,crit,err,warning,notice,info,debug. -
(Optional) If needed, set advanced options under More options.
-
Select Add. Based on the collection rule, Axoflow automatically creates collectors on the edge hosts that match the Edge Selector.
CAUTION:
Make sure to configure Data Forwarding Rules for your edge hosts to transfer the collected data to the OpenTelemetry connector of an AxoRouter.
Related metrics
You can use these metrics labels as:
- Filter labels on the Analytics page
- in the Filter By Label field during log tapping
- in Flow Processing steps, for example, in the Query field of Select Messages steps.
| label | value |
|---|---|
| edge_connector_name | The name of the collector that collected the message. |
| edge_connector_type | otelJournald |
| edge_connector_label_ | Labels set by the collector. By default: vendor:opentelemety, product:otel-journald |
| edge_connector_rule_id | The ID of the Collector Rule resource in Axoflow that created the collector. |
| edge_flow_name | The name of the data forwarding rule that sent the message. |
Advanced options
Note that if you set more than one filter-like fields (for example, Priority filter and Identifiers), Axoflow agent reads only entries that match all filters (there’s a logical AND operator between the fields). Within a field (for example, if you specify multiple Identifiers) the filters have an OR relation, so any matching entry is read (unless it gets excluded by another filter).
- Message filter (grep): Read only entries where the
MESSAGEfield matches the specified regular expression. - Journal directory: Specifies the directory containing journal files to read entries from. Relative to the Root path. Default value:
/run/log/journalor/run/journal, depending on the platform. - Journal files: Specifies the list of journal files to read entries from. Relative to the Root path. By default it’s empty, meaning that all files will be read.
- Identifiers: Read only entries of the listed message identifiers (SYSTEMD_IDENTIFIER), for example,
2. - Namespace name: Query the given namespace. See man page systemd-journald.service(8) for details.
- Retry on failure max elapsed time: Maximum amount of time (including retries) spent trying to send a logs batch to AxoRouter, for example,
5 minutes. When this value is reached, the data that wasn’t sent is discarded. Default value:0(keep retrying indefinitely) - Root path: The chroot to use when executing the
journalctlcommand. By default, it’s empty (no chroot is used). To set a path, use an absolute path. Note that if you set a root path, other options of the collector must be set relative to the root path (for example, Journal directory), while others must be absolute (for example, Journalctl path). - Journalctl path: The
journalctlcommand to execute. Relative to the Root path, unless the Root path is set, in which case Journalctl path must be absolute. Default value:journalctl - Include very long and misformatted entries: Read very long logs and logs with unprintable characters.
- Convert message bytes to string: If the
MESSAGEfield of an entry incudes an array of bytes, convert the array to string. - Kernel messages only: Read only kernel messages (dmesg). This shows logs from the current boot and that match
_TRANSPORT=kernel. - Merge all journals: Read from all available journals, including remote ones.
2.3 - Windows Event Log
Collect logs from the Event Log of the host.
Prerequisites
This collector can be deployed to edge hosts running Axoflow agent for Windows.
Add new Event Log Collector
To create a new Collection Rule that collects data from files on edge hosts, complete the following steps:
-
Select Sources > Collection Rules > Add Rule. (Alternatively, you can select Add Collector > Create a collection rule on the Collectors page of an edge host.)
-
Select Windows Event Log.
-
Configure the connector rule.
-
Enter a name for the collection rule into the Rule Name field.
-
(Optional) Add labels to the collection rule.
You can use these metrics labels as:
- Filter labels on the Analytics page
- in the Filter By Label field during log tapping
- in Flow Processing steps, for example, in the Query field of Select Messages steps.
-
Set the Edge Selector for the collection rule. The selector determines which edge hosts will have a collector based on this collection rule.
- Only edge hosts will match the rule.
- If you leave the Edge Selector field empty, the rule will match every edge host.
- To select only a specific host, set the
namefield to the name of the host as selector. - If you set multiple fields in the selector, the collection rule will apply only to edge hosts that match all elements of the selector. (There in an AND relationship between the fields.) For example,
label.location = us-east-1 AND label.product = windows
-
(Optional) Enter a Suffix for the collection rule. This suffix will be used in the name of the collector instances created on the edge hosts. For example, if the name of a matching edge host is “my-edge”, and the suffix of the rule is “otel-file-collector”, the collector created for the edge will be named “my-edge-otel-file-collector”.
If the Suffix field is empty, the name of the collection rule is used instead.
-
(Optional) Enter a description for the rule.
-
-
Set how to collect the event logs:
-
To collect data from the following channels, select Channels, then the channels you want to collect data from: Application, System, Security, Setup, ForwardedEvents.
-
Alternatively, select Query and set a custom XML query to collect the data, for example:
<QueryList>
    <Query Id="0">
        <Select Path="Application">
            *[System[(Level <= 3) and
            TimeCreated[timediff(@SystemTime) <= 86400000]]]
        </Select>
        <Suppress Path="Application">
            *[System[(Level = 2)]]
        </Suppress>
        <Select Path="System">
            *[System[(Level=1  or Level=2 or Level=3) and
            TimeCreated[timediff(@SystemTime) <= 86400000]]]
        </Select>
    </Query>
</QueryList>
-
-
(Optional) If needed, set advanced options under More options.
-
Select Add. Based on the collection rule, Axoflow automatically creates collectors on the edge hosts that match the Edge Selector.
CAUTION:
Make sure to configure Data Forwarding Rules for your edge hosts to transfer the collected data to the OpenTelemetry connector of an AxoRouter.
Related metrics
You can use these metrics labels as:
- Filter labels on the Analytics page
- in the Filter By Label field during log tapping
- in Flow Processing steps, for example, in the Query field of Select Messages steps.
| label | value |
|---|---|
| edge_connector_name | The name of the collector that collected the message. |
| edge_connector_type | windowsEventLog |
| edge_connector_label_ | Labels set by the collector. By default: vendor:microsoft, product:windows-event-log |
| edge_connector_rule_id | The ID of the Collector Rule resource in Axoflow that created the collector. |
| edge_flow_name | The name of the data forwarding rule that sent the message. |
Advanced options
- Max reads: The maximum number of records to read, before beginning a new batch.
- Poll interval: The duration between filesystem polls, for example:
1s,5m,1h. Default value:200ms - Retry on failure max elapsed time: Maximum time (including retries) to send a log batch to a downstream consumer before discarding it, for example:
1s,5m,1h. Retrying never stops if set to0. Default value0 - Start at: Specifies where to start reading logs on startup:
beginningorendof the file. Default value:beginning - Ignore channel errors: If enabled, the connector keeps working if it cannot open an event log channel.
- Raw: If disabled, the body of the emitted log records will contain a structured representation of the event. If enabled, the body will be the original XML string.
- Include log.record.original: If enabled,
log.record.originalis added to the attributes of the event. This stores the original XML string as configured in Suppress rendering info. - Suppress rendering info: If disabled, additional syscalls may be made to retrieve detailed information about the event. If enabled, some unresolved values may be present in the event.
2.4 - Windows Event Tracing
Collect logs from Event Tracing for Windows (ETW).
Prerequisites
This collector can be deployed to edge hosts running Axoflow agent for Windows.
Add new ETW Collector
To create a new Collection Rule that collects Event Tracing data from on edge hosts, complete the following steps:
-
Select Sources > Collection Rules > Add Rule. (Alternatively, you can select Add Collector > Create a collection rule on the Collectors page of an edge host.)
-
Select Windows Event Tracing.
-
Configure the connector rule.
-
Enter a name for the collection rule into the Rule Name field.
-
(Optional) Add labels to the collection rule.
You can use these metrics labels as:
- Filter labels on the Analytics page
- in the Filter By Label field during log tapping
- in Flow Processing steps, for example, in the Query field of Select Messages steps.
-
Set the Edge Selector for the collection rule. The selector determines which edge hosts will have a collector based on this collection rule.
- Only edge hosts will match the rule.
- If you leave the Edge Selector field empty, the rule will match every edge host.
- To select only a specific host, set the
namefield to the name of the host as selector. - If you set multiple fields in the selector, the collection rule will apply only to edge hosts that match all elements of the selector. (There in an AND relationship between the fields.) For example,
label.location = us-east-1 AND label.product = windows
-
(Optional) Enter a Suffix for the collection rule. This suffix will be used in the name of the collector instances created on the edge hosts. For example, if the name of a matching edge host is “my-edge”, and the suffix of the rule is “otel-file-collector”, the collector created for the edge will be named “my-edge-otel-file-collector”.
If the Suffix field is empty, the name of the collection rule is used instead.
-
(Optional) Enter a description for the rule.
-
-
Select the configuration profile to use. The following profiles are available:
- DNS server (full trace): A pre-defined profile for collecting every available DNS server traces.
- DNS server (queries only): A pre-defined profile for collecting only DNS queries.
- Custom: Use a fully-customized configuration.
-
(Optional) If needed, set advanced options under More options.
Note that if you set an advanced option when using a pre-defined profile, your changes override the related default setting of the pre-defined profile.
-
Select Add. Based on the collection rule, Axoflow automatically creates collectors on the edge hosts that match the Edge Selector.
CAUTION:
Make sure to configure Data Forwarding Rules for your edge hosts to transfer the collected data to the OpenTelemetry connector of an AxoRouter.Note When using Log tapping, ETW events look a bit weird: the body of these events is empty. That’s normal, the reason for that is that everything is sent as metadata.
Related metrics
You can use these metrics labels as:
- Filter labels on the Analytics page
- in the Filter By Label field during log tapping
- in Flow Processing steps, for example, in the Query field of Select Messages steps.
| label | value |
|---|---|
| edge_connector_name | The name of the collector that collected the message. |
| edge_connector_type | windowsEventTracing |
| edge_connector_label_ | Labels set by the collector. By default: vendor:microsoft, product:windows-event-tracing |
| edge_connector_rule_id | The ID of the Collector Rule resource in Axoflow that created the collector. |
| edge_flow_name | The name of the data forwarding rule that sent the message. |
Advanced options
Note that if you set an advanced option when using a pre-defined profile, your changes override the related default setting of the pre-defined profile.
-
Provider: The provider to subscribe to, for example,
Microsoft-Windows-DNSServerfor DNS logs. For a complete list, open a command prompt on the edge host and runlogman query providers.Note that provider name is case sensitive. Alternatively, you can use the GUID of the provider as well, in the following format:
{9e814aad-3204-11d2-9a82-006008a86939}. If you’re manually setting the provider, consider enabling the Ignore missing provider option as well. -
Level: Log level of trace events to be included. Specifying a log level means that all higher priority log levels will be collected as well. Possible values are (starting with the highest priority):
critical,error,warning,information,verbose. -
Ignore missing provider: Continue working if the specified provider is missing from the host.
CAUTION:
If this option is disabled and the provider is missing, the all other connectors of the agent can stop, not just the ETW connectors. -
Match any keywords: Collect only traces that match at least one of the specified keywords of the provider. Note that these keywords are not literal strings, but bitmasks that correspond to the specific provider. To match on multiple keywords, you have to add the bitmasks of the corresponding keywords.
-
Match all keywords: Collect only traces that match all of the specified keywords of the provider. Note that these keywords are not literal strings, but bitmasks that correspond to the specific provider. To match on multiple keywords, you have to add the bitmasks of the corresponding keywords.
-
Buffer size: Buffer size allocated for each ETW trace session, in kilobytes. Minimum is 4, maximum is 16384.
-
Minimum buffers: Minimum number of buffers allocated for each ETW trace session. Note that the minimum and maximum buffers behave like hints to the ETW subsystem and aren’t guaranteed to be allocated as specified.
-
Maximum buffers: Maximum number of buffers allocated for each ETW trace session. Note that the minimum and maximum buffers behave like hints to the ETW subsystem and aren’t guaranteed to be allocated as specified.
-
Flush time: How often, in seconds, any non-empty trace buffers are flushed.
0will enable a default timeout of1second. -
Event buffer size: Number of ETW events the ETW receiver stores in memory for processing.
-
Number of workers: Number of workers that process ETW events.
3 - Data forwarding from edge hosts
To send data from an edge host to an AxoRouter, create a data forwarding rule.
- Sources are hosts that are sending data to a data aggregator, like AxoRouter.
- Edges are source hosts that are running a collector agent managed by AxoConsole, or have an Axolet agent reporting metrics from the host.
Note
Collection rules and data forwarding rules are currently supported on Windows hosts.
Data forwarding rules are high-level policies that determine how data should be forwarded from a set of edge hosts to an AxoRouter’s OpenTelemetry connector. You can use dynamic host labels to specify the edge hosts that the forwarding rule applies to.
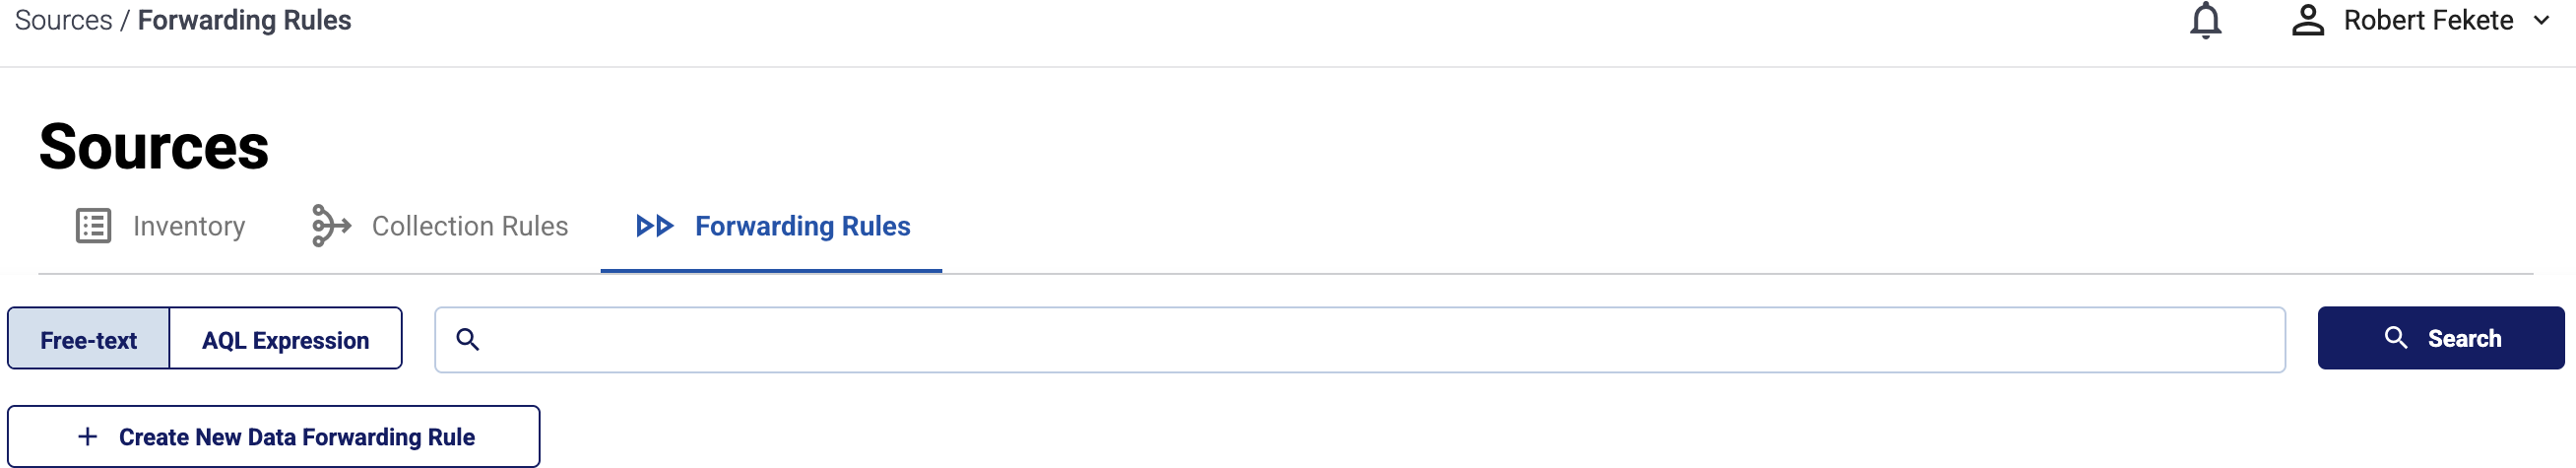
To see every data forwarding rule configured in AxoConsole, select Sources > Forwarding Rules from the main menu.
Data forwarding rules have the following main elements:
-
the edge selector, which determines the list of edge hosts that will create a data forwarding rule based on that rule.
You can use any labels and metadata of the edge hosts in the edge selectors, for example, the hostname, or any custom labels. For example, using the
label.product = windowsselector will create a collector only on Windows hosts. -
the Router connector to send the data to. This must be an OpenTelemetry connector of an AxoRouter.
Selecting a data forwarding rule shows the details of the rule, including the list of Matched edges.
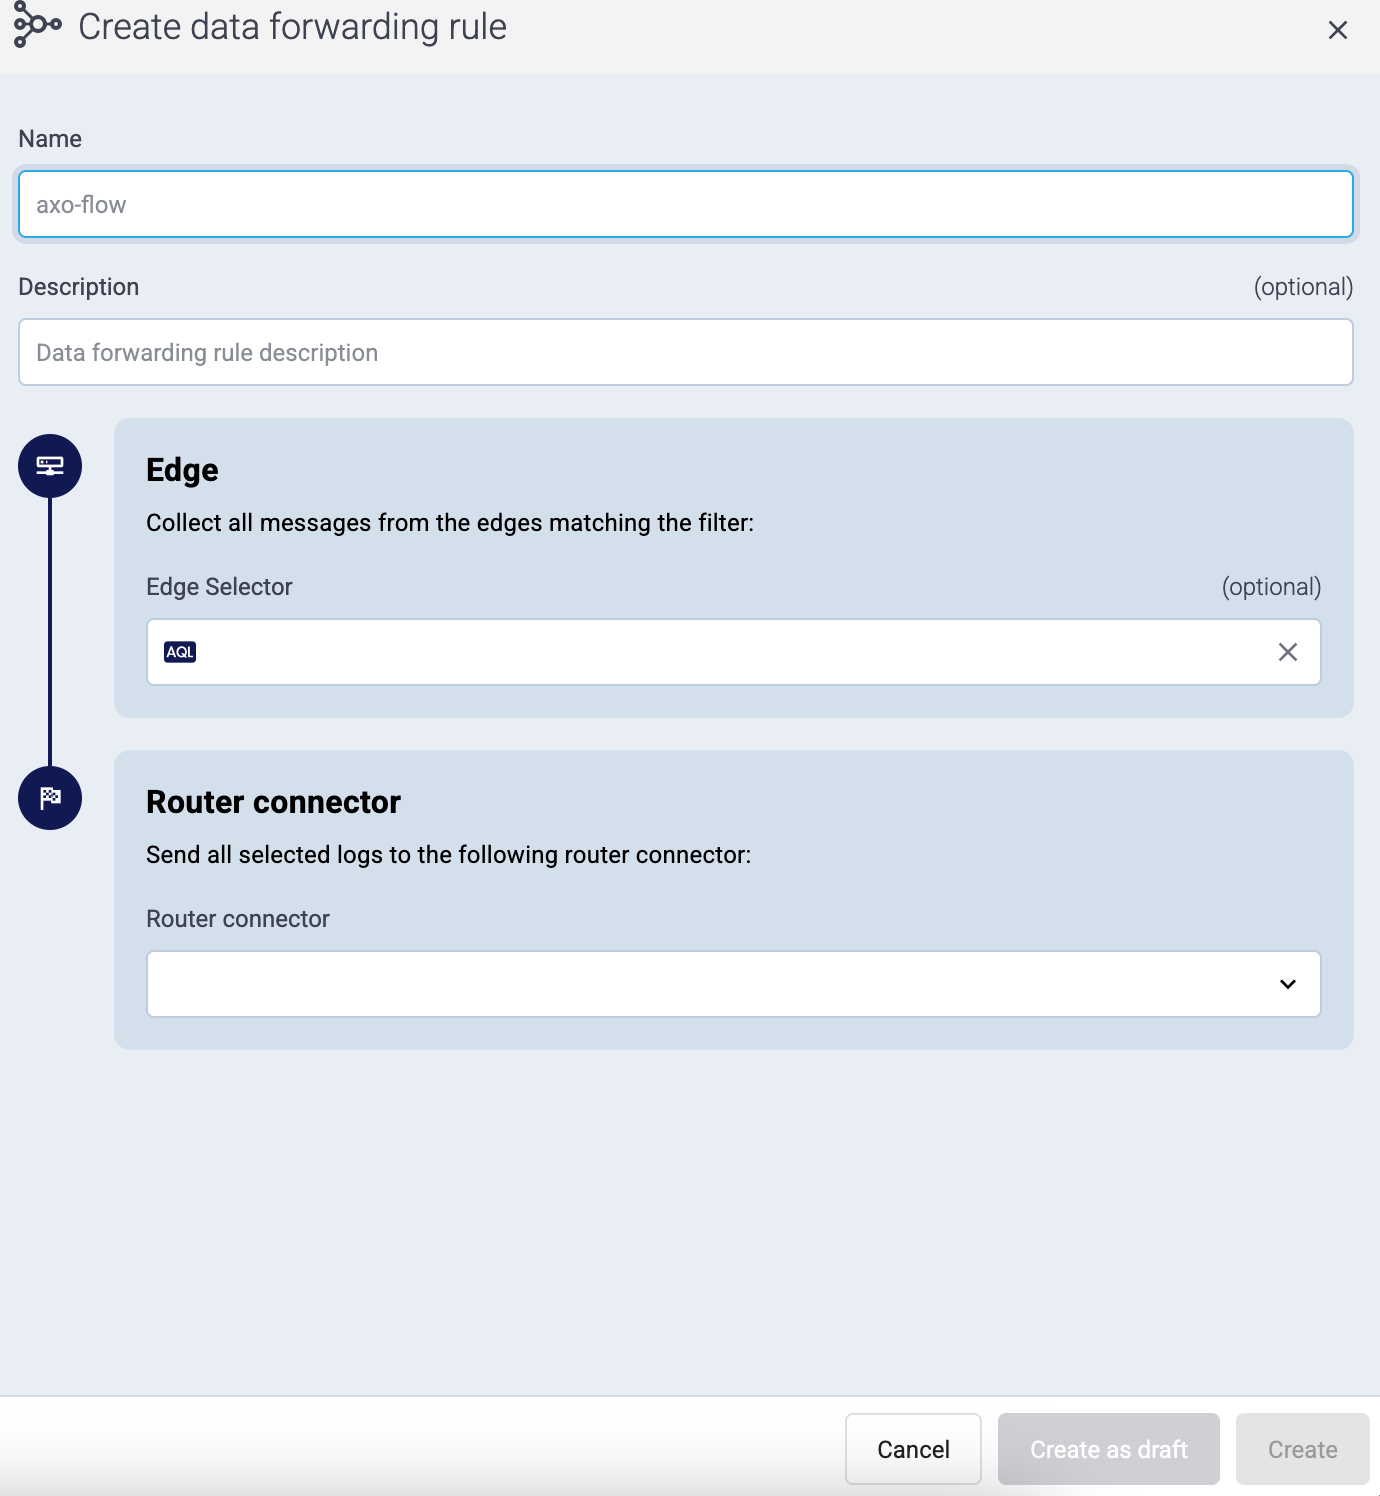
Create data forwarding rule
To create a new data forwarding rule, complete the following steps.
-
If the primary IP address (the first IP address shown in the Network addresses section on the Routers page for each AxoRouter) is not accessible from your edge hosts, set a Network address override (IP address or an FQDN) that’s accessible. Otherwise, data forwarding from edge hosts will fail.
-
Select Sources > Forwarding Rules > Add Rule.
-
Enter a name for the collection rule into the Rule Name field.
-
(Optional) Enter a description for the rule.
-
Set the Edge Selector for the rule. The selector determines which edge hosts will have data forwarding configured based on this rule.
- Only edge hosts will match the rule.
- If you leave the Edge Selector field empty, the rule will match every edge host.
- To select only a specific host, set the
namefield to the name of the host as selector. - If you set multiple fields in the selector, the collection rule will apply only to edge hosts that match all elements of the selector. (There in an AND relationship between the fields.) For example,
label.location = us-east-1 AND label.product = windows
-
Select the OpenTelemetry connector of an AxoRouter where you want to send the data.
-
Select Add to create and immediately apply the data forwarding rule to the matching edge hosts. Alternatively, select Add as draft to create the rule in a disabled state. You can enable the rule later on the Data Sources > Forwarding Rules page.
Modify forwarding rule
To modify an existing data forwarding rule, complete the following steps.
Note
- You cannot directly modify the data forwarding settings of an edge host, only via modifying a data forwarding rule.
- Modifying a rule affects every edge host that matches the Edge Selector of the rule.
- To apply an existing rule to a new edge host, you can:
- Add a label to the edge host so the Edge Selector of the rule matches the new host, and/or
- Change the Edge Selector of the rule to match the new host.
-
Find the data forwarding rule you want to modify:
- Select Sources > Forwarding Rules from the main menu, then select the rule you want to modify.
- Alternatively, find the edge host whose data forwarding you want to modify on the Topology page, then select Forwarding Rules. Find the rule you want to modify, click on its name to display its details, then select Edit.
-
Modify the configuration of the data forwarding rule as needed.
CAUTION:
The changes are applied immediately after you click Update. Double-check your changes to avoid losing data. -
Select Update.
Add edge host to existing forwarding rule
To add an edge host to an existing data forwarding rule, you have two options, depending on the Edge Selector of the data forwarding rule:
- Modify the Edge Selector field of the rule to include the new edge host.
- Modify the labels of the edge host so it matches the edge selector of the rule.
4 - AxoRouter connector rules
Connectors define the methods and entry points where AxoRouter receives data from the sources. To collect data from edge hosts, see Edge collection rules.
In addition to providing a simple protocol specific listener, Connectors implement critical processing steps - for example classification and parsing - right at the ingestion point to enrich data before it gets processed by Flows.
On top of this, Connector rules are high-level policies that determine what kind of Connectors should be available on a set of AxoRouter instances based on dynamic host labels.

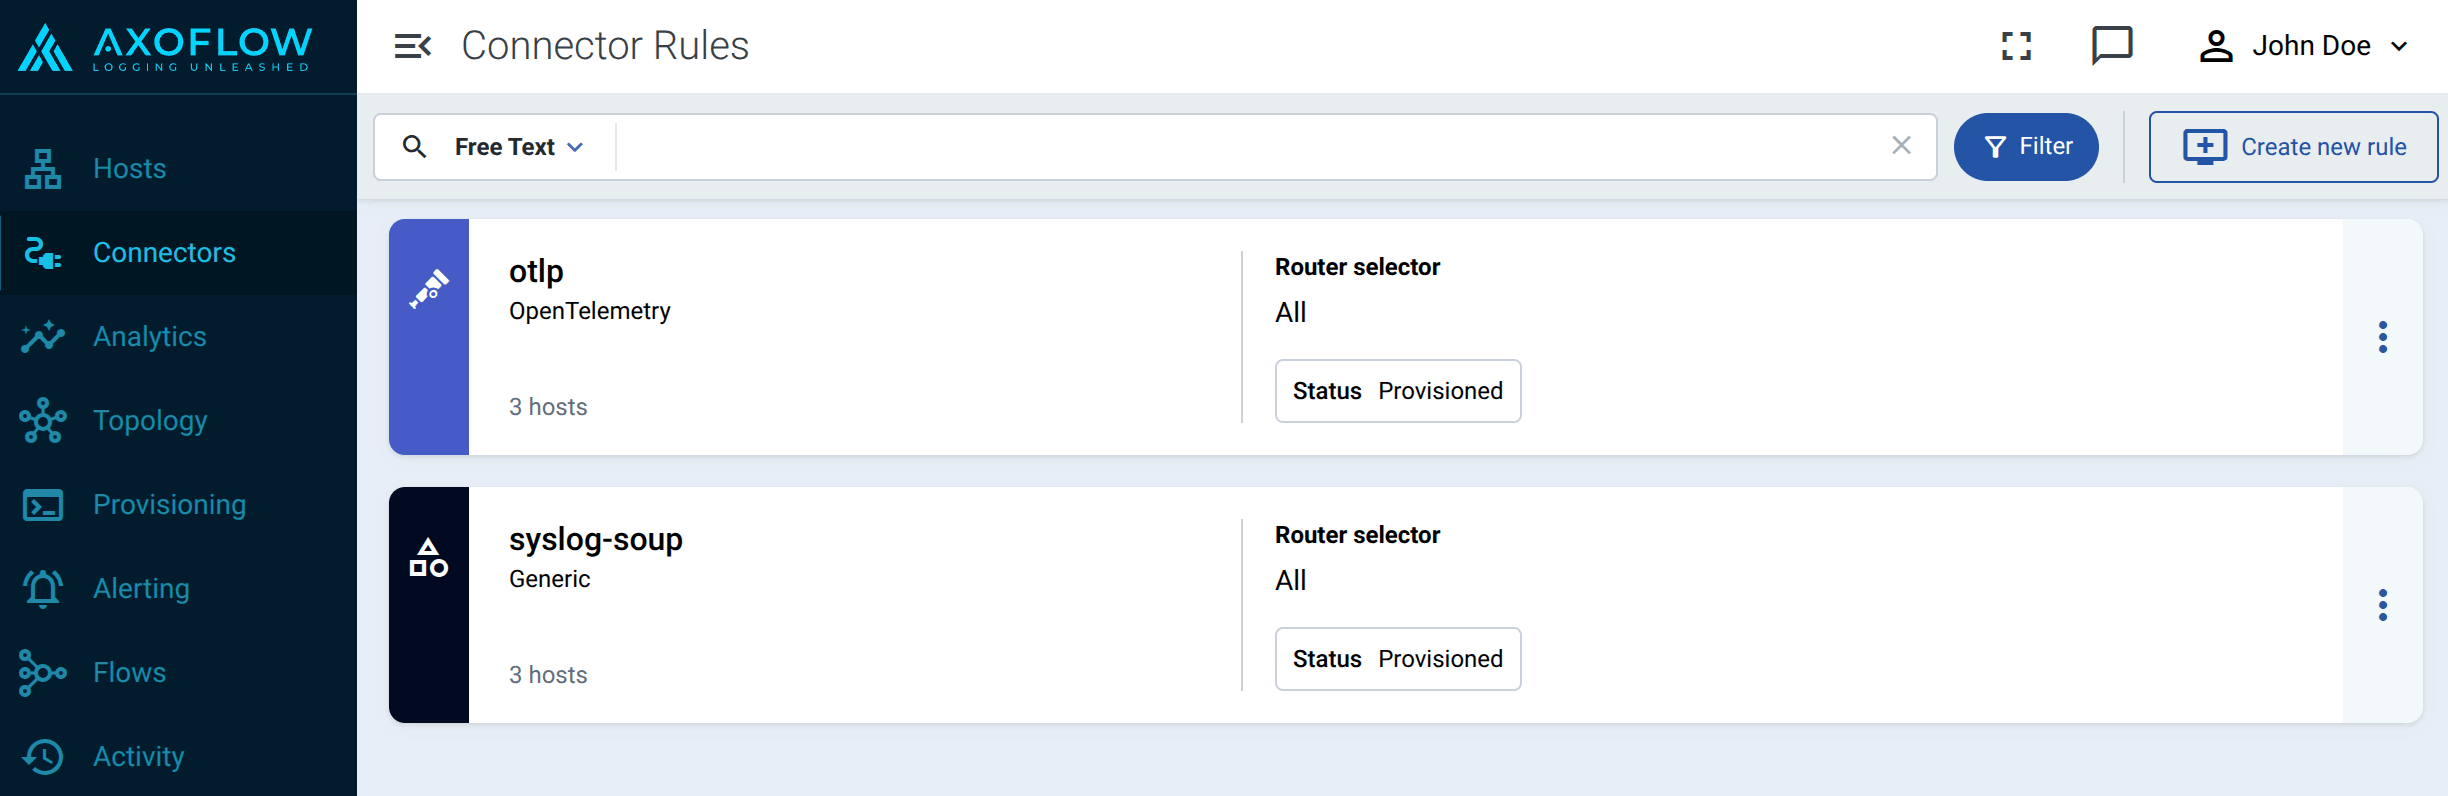
To see every connector rule configured in AxoConsole, select Routers > Connector Rules from the main menu.
Connector rules have the following main elements:
-
the way they accept data (for example, via syslog, using the OpenTelemetry protocol), and other protocol-specific parameters (for example, port number)
-
the router selector, which determines the list of AxoRouter instances that will create a connector based on that rule.
You can use any labels and metadata of the AxoRouter hosts in the Router selectors, for example, the hostname of the AxoRouter, or any custom labels.
- If you leave the Router Selector field empty, the selector will match every AxoRouter instance.
- To select only a specific AxoRouter instance, set the
namefield to the name of the instance as selector. For example,name = my-axorouter. - If you set multiple fields in the selector, the selector will match only AxoRouter instances that match all elements of the selector. (There in an AND relationship between the fields.)
label.wec = enabledselector on a Windows Event Collector (WEC) rule will create a WEC connector on AxoRouter hosts that have theweclabel set toenabled.
Selecting a connector rule shows the details of the connector rule, including:
- The list of Matched hosts: the AxoRouter deployments that will have a connector based on that connector rule. If you click on the name of a matched router, the Connectors page of the AxoRouter host opens, showing you the connectors configured for that host.
-
- Idle: The rule doesn’t match any hosts currently.
- Provisioned: Connectors based on this rule were successfully provisioned for every matching host.
- Error: Some error(s) occurred while provisioning connectors based on this rule. See the Status message field for details.
- Unknown: The rule is in an unknown state.
-
Attributes: Various significant attributes of connectors provisioned based on this rule.
Create connector rule
To create a new connector rule, complete the following steps.
-
Select Routers > Connector Rules > Add Rule. (Alternatively, you can select Add Connector > Create a connector rule on the Connectors page of an AxoRouter host.)
-
Select the type of connector you want to create. For example, OpenTelemetry. The following connector types are available:
-
Configure the connector rule.
-
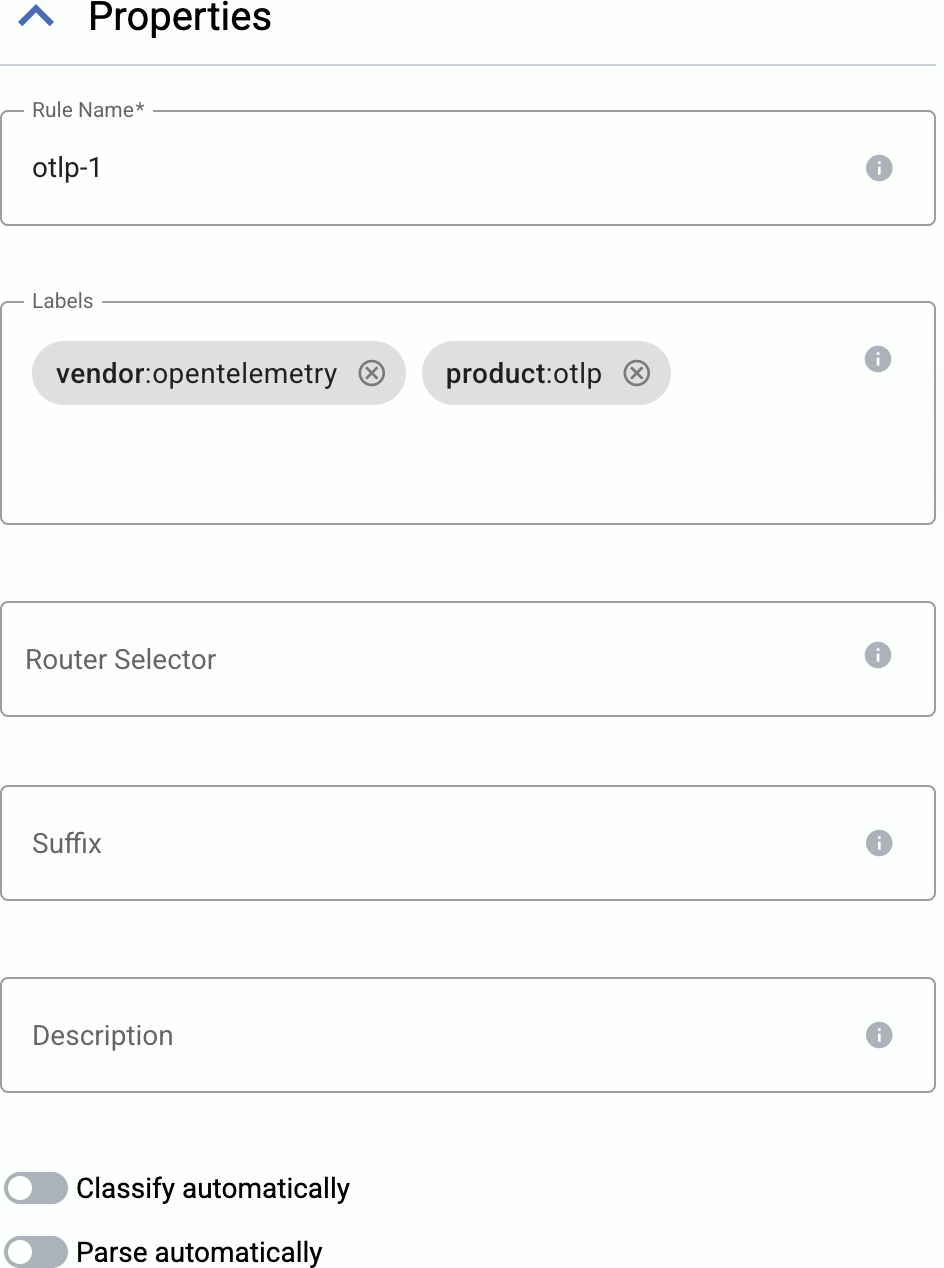
Enter a name for the connector rule into the Rule Name field.
-
(Optional) Add labels to the connector rule. You will be able to use these labels in Flow Processing steps, for example, in the Query field of Select Messages steps. For details about the message schema and the related connector-specific fields, see the
meta.connectorobject. -
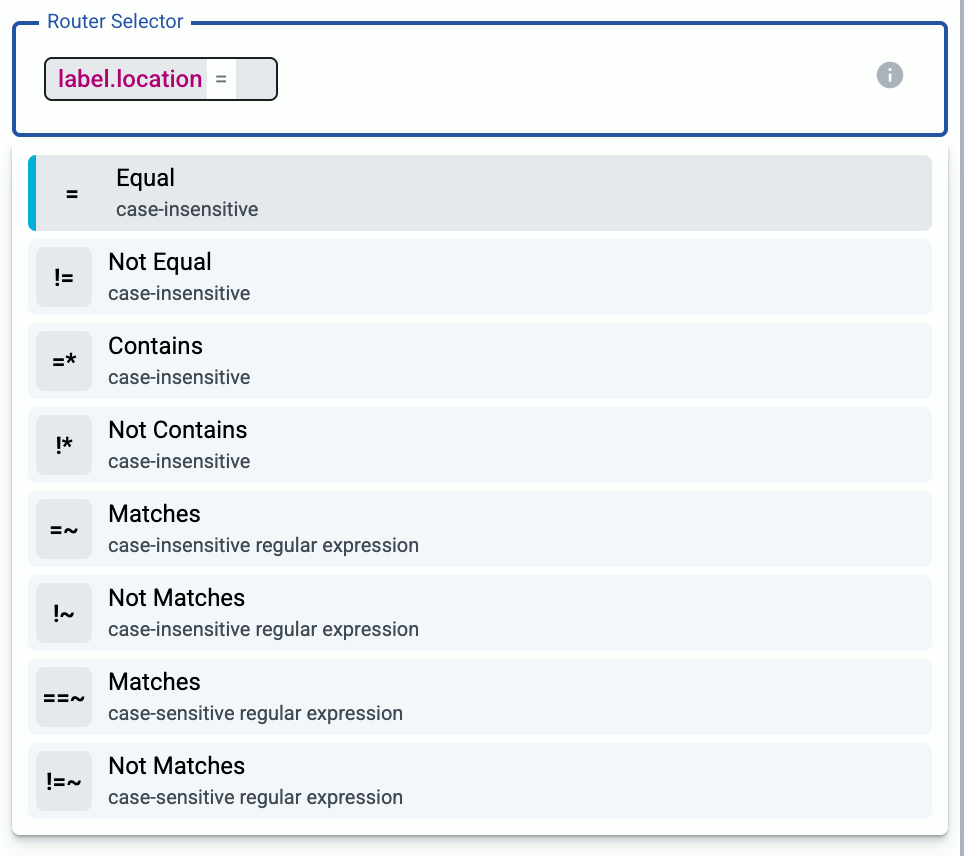
Set the Router Selector for the connector rule. The selector determines which AxoRouter instances will have a connector based on this connector rule.
You can use any labels and metadata of the AxoRouter hosts in the Router selectors, for example, the hostname of the AxoRouter, or any custom labels.
- If you leave the Router Selector field empty, the selector will match every AxoRouter instance.
- To select only a specific AxoRouter instance, set the
namefield to the name of the instance as selector. For example,name = my-axorouter. - If you set multiple fields in the selector, the selector will match only AxoRouter instances that match all elements of the selector. (There in an AND relationship between the fields.)
-
(Optional) Enter a Suffix for the connector rule. This suffix will be used in the name of the connector instances created on the AxoRouter hosts. For example, if the name of a matching AxoRouter instance is “my-axorouter”, and the suffix of the rule is “otlp-rule”, the connector created for the AxoRouter will be named “my-axorouter-otlp-rule”.
If the Suffix field is empty, the name of the connector rule is used instead.
-
(Optional) Enter a description for the rule.
-
If needed, enable the Classify and Parse preprocessing steps so AxoRouter automatically identifies and parses messages sent by supported data sources. If your source is not listed, contact us.
Enabling these options processes all data received by the connectors created based on this connector rule. If you want to apply classification and parsing more selectively, you can use the Classify and Parse processing steps in your Flows.
Note that the Parse processing step requires Classify to be enabled. Parsing automatically parses the data from the content of the message, and replaces the message content (the
log.bodyfield in the internal message schema) with the structured information. -
(Optional) If needed, you can add other preprocessing steps to the connector rule. You can use the same processing steps as in flows. These can be useful if you use a dedicated connector rule to fix or annotate data coming from some specific sources.
-
-
Configure the protocol-specific settings. For details, see the specific pages:
-
Select Add.
Axoflow automatically creates connectors on the AxoRouter hosts that match the Router Selector.
Make sure to enable the ports you’ve configured in the connector on the firewall of the AxoRouter host, and on other firewalls between the AxoRouter host and your data sources.
Modify connector rule
To modify an existing connector rule, complete the following steps.
Note
- You cannot directly modify the connector of an AxoRouter host, only via modifying a connector rule.
- Modifying a connector rule affects every AxoRouter that matches the Router Selector of the rule.
- To apply an existing connector rule to a new AxoRouter instance, you can:
- Add a label to the AxoRouter host so the Router Selector of the connector rule matches the new host, and/or
- Change the Router Selector of the connector rule to match the new host.
-
Find the connector rule you want to modify:
- Select Routers > Connector Rules from the main menu, then select the connector rule you want to modify.
- Alternatively, find the AxoRouter instance whose connector you want to modify on the Topology page, then select Connector Rules. Find the connector you want to modify, then select ⋮ > Edit connector rule.
-
Modify the configuration of the connector rule as needed.
CAUTION:
The changes are applied immediately after you click Update. Double-check your changes to avoid losing data. -
Select Update.
Add AxoRouter to existing connector rule
To add an AxoRouter to an existing connector rule, you have two options, depending on the Router Selector of the connector rule:
- Modify the Router Selector field of the connector rule to include the new AxoRouter host.
- Modify the labels of the AxoRouter host so it matches the router selector of the connector rule.
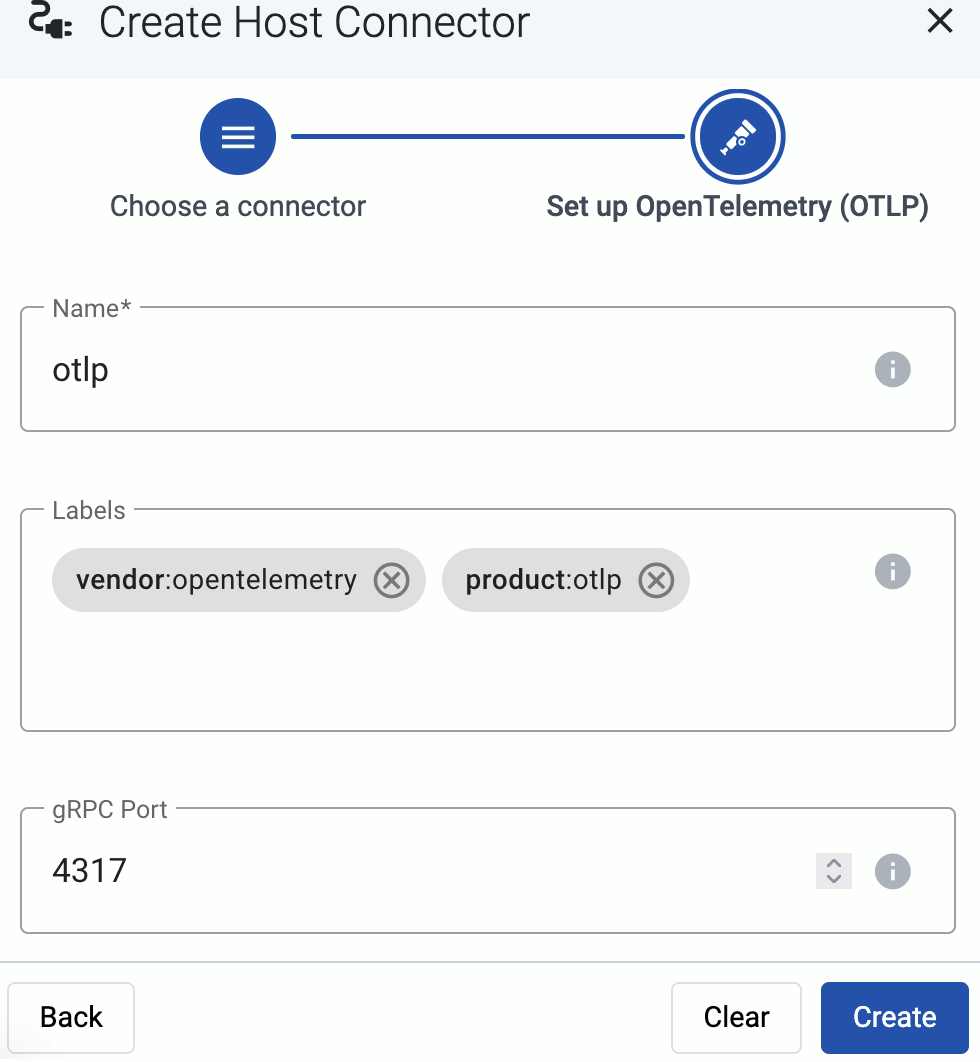
5 - OpenTelemetry
Receive logs, metrics, and traces from OpenTelemetry clients over the OpenTelemetry Protocol (OTLP/gRPC).
Prerequisites
If you want to enable TLS encryption for this connector to encrypt the communication with the sources, you’ll need to set appropriate keys and certificates.
CAUTION:
Copy the keys and certificates to AxoRouter before starting to configure the connector. Otherwise, you won’t be able to make configuration changes that require reloading the AxoRouter service, including starting log tapping or flow tapping.Note the following points:
-
Keys and certificates must be in PEM format.
-
If the file contains a certificate chain, the file must begin with the certificate of the host, followed by the CA certificate that signed the certificate of the host, and any other signing CAs in order.
-
You must manually copy these files to their place on the AxoRouter host, currently you can’t distribute them from AxoConsole.
The files must be readable by the
axorouterservice. -
The recommended path for certificates is under
/etc/axorouter/user-config/(for example,/etc/axorouter/user-config/tls-key.pem). (If you need to use a different path, you have to append an option like-v /your/path:/your/pathto theAXOROUTER_PODMAN_ARGSvariable of/etc/axorouter/container.env.) -
When referring to the key or certificate during when configuring the connector, use absolute paths (for example,
/etc/axorouter/user-config/tls-key.pem).
Add new OpenTelemetry connector
To add a new connector to an AxoRouter host, complete the following steps:
-
Select Routers > Connector Rules > Add Rule. (Alternatively, you can select Add Connector > Create a connector rule on the Connectors page of an AxoRouter host.)
-
Select OpenTelemetry.
-
Configure the connector rule.
-
Enter a name for the connector rule into the Rule Name field.
-
(Optional) Add labels to the connector rule. You will be able to use these labels in Flow Processing steps, for example, in the Query field of Select Messages steps. For details about the message schema and the related connector-specific fields, see the
meta.connectorobject. -
Set the Router Selector for the connector rule. The selector determines which AxoRouter instances will have a connector based on this connector rule.
You can use any labels and metadata of the AxoRouter hosts in the Router selectors, for example, the hostname of the AxoRouter, or any custom labels.
- If you leave the Router Selector field empty, the selector will match every AxoRouter instance.
- To select only a specific AxoRouter instance, set the
namefield to the name of the instance as selector. For example,name = my-axorouter. - If you set multiple fields in the selector, the selector will match only AxoRouter instances that match all elements of the selector. (There in an AND relationship between the fields.)
-
(Optional) Enter a Suffix for the connector rule. This suffix will be used in the name of the connector instances created on the AxoRouter hosts. For example, if the name of a matching AxoRouter instance is “my-axorouter”, and the suffix of the rule is “otlp-rule”, the connector created for the AxoRouter will be named “my-axorouter-otlp-rule”.
If the Suffix field is empty, the name of the connector rule is used instead.
-
(Optional) Enter a description for the rule.
-
If needed, enable the Classify and Parse preprocessing steps so AxoRouter automatically identifies and parses messages sent by supported data sources. If your source is not listed, contact us.
Enabling these options processes all data received by the connectors created based on this connector rule. If you want to apply classification and parsing more selectively, you can use the Classify and Parse processing steps in your Flows.
Note that the Parse processing step requires Classify to be enabled. Parsing automatically parses the data from the content of the message, and replaces the message content (the
log.bodyfield in the internal message schema) with the structured information. -
(Optional) If needed, you can add other preprocessing steps to the connector rule. You can use the same processing steps as in flows. These can be useful if you use a dedicated connector rule to fix or annotate data coming from some specific sources.
-
-
If needed, configure the port number where you want to receive data.
-
Configure TLS settings for the connector.
-
Select Server TLS.
-
Set the path to the key and certificates.
When using TLS, set the paths for the certificates and keys used for the TLS-encrypted communication with the clients. For details, see Prerequisites.
- Server certificate path: The certificate that AxoRouter shows to the clients.
- Server private key path: The private key of the server certificate.
- CA certificate path: The CA certificate that AxoRouter uses to verify the certificate of the sender if Verify peer certificate is enabled.
-
To require the certificates of the clients to be valid, select Verify client certificate. When selected, the certificate of the client cannot be self-signed, and its common name must match the hostname or IP address of the client.
-
-
(Optional) Adjust the flow-control related options if needed.
-
Initial log window size: The size (number of messages) of the initial window used in flow control. For details, see the AxoSyslog documentation.
If you change the value of Initial log window size, the change will affect only new connections, the Initial log window size of already established connections will not change. To apply the new Initial log window size value to every connection, restart the
axorouter.serviceservice on the Services page of the matching AxoRouters. A simple configuration reload is NOT sufficient.If the connector rule is receiving data using the UDP protocol, always restart the
axorouter.serviceservice on the Services page of the matching AxoRouters.
- Log fetch limit: The maximum number of messages fetched from a source during a single poll loop. For details, see the AxoSyslog documentation.
-
-
Select Add.
Axoflow automatically creates connectors on the AxoRouter hosts that match the Router Selector.
Make sure to enable the ports you’ve configured in the connector on the firewall of the AxoRouter host, and on other firewalls between the AxoRouter host and your data sources.
Labels
| Analytics label | Message field | value |
|---|---|---|
connector.type |
meta.connector.type |
otlp |
connector.name |
meta.connector.name |
The Name of the connector |
connector.port |
meta.connector.port |
The port number where the connector receives data |
You can use the labels as:
- Filter labels on the Analytics page,
- in the Filter By Label field during log tapping.
You can use the message fields
- in Flow Processing steps, for example, in the Query field of Select Messages steps,
- in AQL expressions in the search bars.
6 - Syslog
The Syslog connector can receive all kinds of syslog messages. You can configure it to receive data on specific ports, and apply parsing, classification, and enrichment to the messages, in addition to standard syslog parsing.
Prerequisites
If you want to enable TLS encryption for this connector to encrypt the communication with the sources, you’ll need to set appropriate keys and certificates.
CAUTION:
Copy the keys and certificates to AxoRouter before starting to configure the connector. Otherwise, you won’t be able to make configuration changes that require reloading the AxoRouter service, including starting log tapping or flow tapping.Note the following points:
-
Keys and certificates must be in PEM format.
-
If the file contains a certificate chain, the file must begin with the certificate of the host, followed by the CA certificate that signed the certificate of the host, and any other signing CAs in order.
-
You must manually copy these files to their place on the AxoRouter host, currently you can’t distribute them from AxoConsole.
The files must be readable by the
axorouterservice. -
The recommended path for certificates is under
/etc/axorouter/user-config/(for example,/etc/axorouter/user-config/tls-key.pem). (If you need to use a different path, you have to append an option like-v /your/path:/your/pathto theAXOROUTER_PODMAN_ARGSvariable of/etc/axorouter/container.env.) -
When referring to the key or certificate during when configuring the connector, use absolute paths (for example,
/etc/axorouter/user-config/tls-key.pem).
Add new syslog connector
To create a new syslog connector, complete the following steps:
-
Select Routers > Connector Rules > Add Rule. (Alternatively, you can select Add Connector > Create a connector rule on the Connectors page of an AxoRouter host.)
-
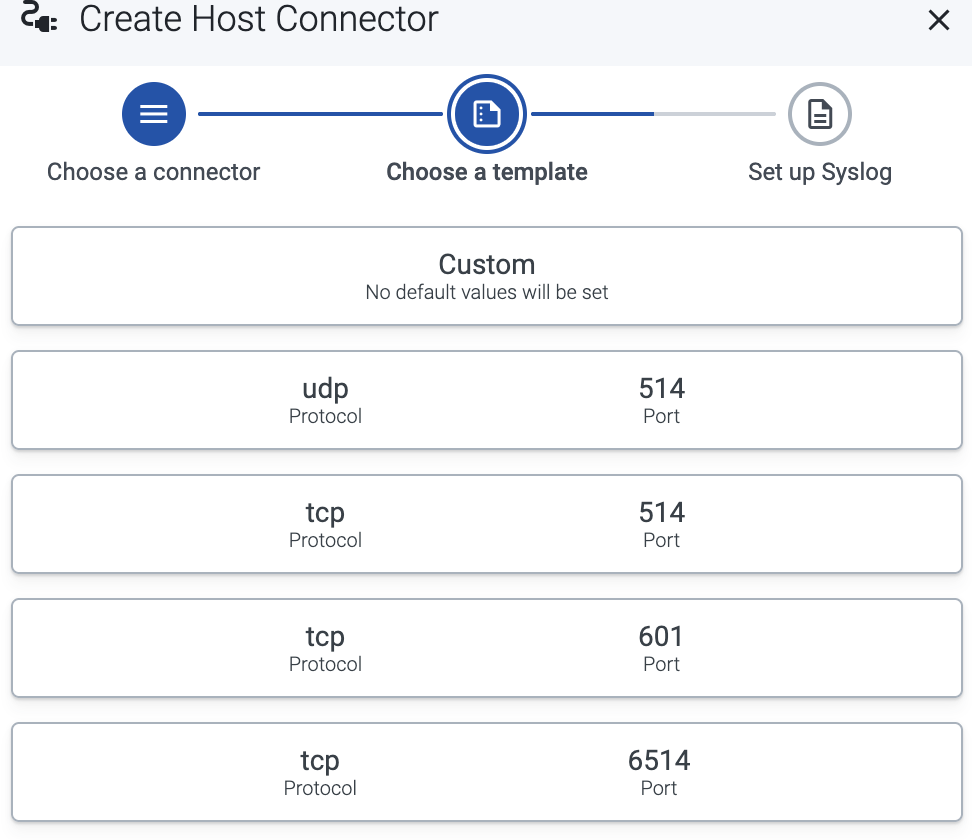
Select Syslog.
-
Select the template to use one of the standard syslog ports and networking protocols, for example, UDP 514 for the RFC3164 syslog protocol.
To configure a different port, or to specify the protocol elements manually, select Custom.
-
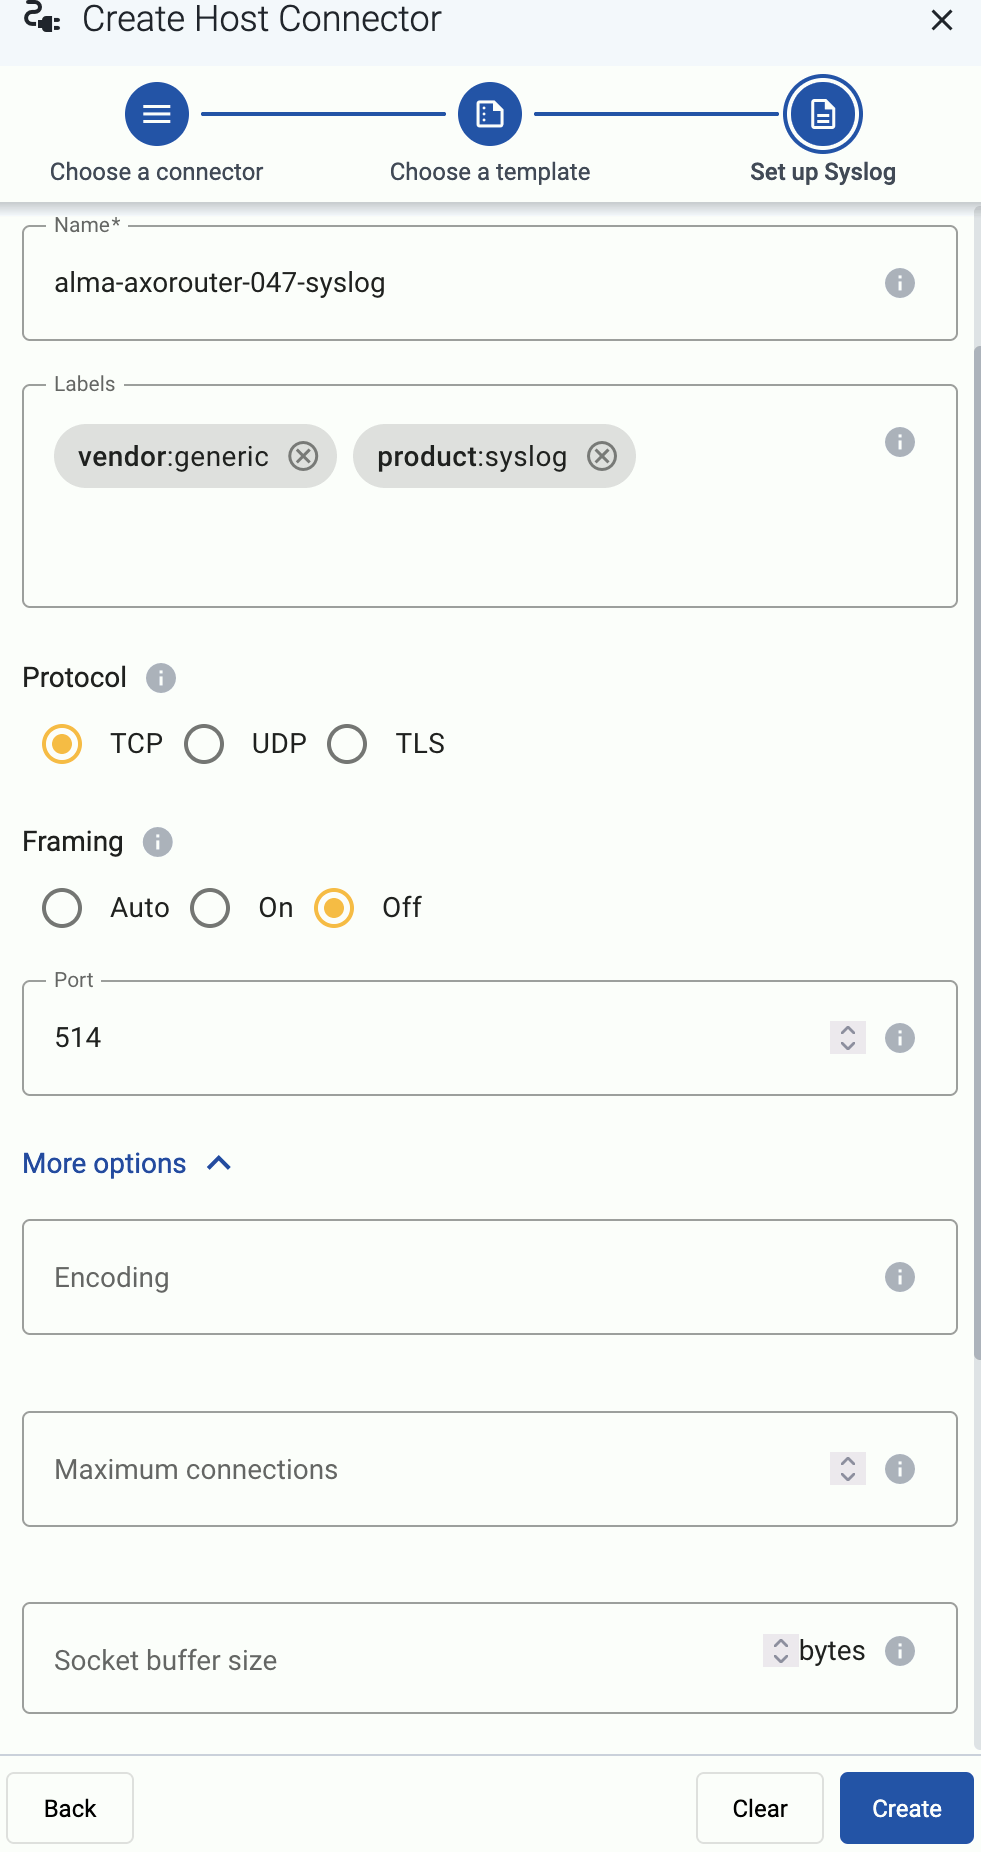
Configure the connector rule.
-
Enter a name for the connector rule into the Rule Name field.
-
(Optional) Add labels to the connector rule. You will be able to use these labels in Flow Processing steps, for example, in the Query field of Select Messages steps. For details about the message schema and the related connector-specific fields, see the
meta.connectorobject. -
Set the Router Selector for the connector rule. The selector determines which AxoRouter instances will have a connector based on this connector rule.
You can use any labels and metadata of the AxoRouter hosts in the Router selectors, for example, the hostname of the AxoRouter, or any custom labels.
- If you leave the Router Selector field empty, the selector will match every AxoRouter instance.
- To select only a specific AxoRouter instance, set the
namefield to the name of the instance as selector. For example,name = my-axorouter. - If you set multiple fields in the selector, the selector will match only AxoRouter instances that match all elements of the selector. (There in an AND relationship between the fields.)
-
(Optional) Enter a Suffix for the connector rule. This suffix will be used in the name of the connector instances created on the AxoRouter hosts. For example, if the name of a matching AxoRouter instance is “my-axorouter”, and the suffix of the rule is “otlp-rule”, the connector created for the AxoRouter will be named “my-axorouter-otlp-rule”.
If the Suffix field is empty, the name of the connector rule is used instead.
-
(Optional) Enter a description for the rule.
-
If needed, enable the Classify and Parse preprocessing steps so AxoRouter automatically identifies and parses messages sent by supported data sources. If your source is not listed, contact us.
Enabling these options processes all data received by the connectors created based on this connector rule. If you want to apply classification and parsing more selectively, you can use the Classify and Parse processing steps in your Flows.
Note that the Parse processing step requires Classify to be enabled. Parsing automatically parses the data from the content of the message, and replaces the message content (the
log.bodyfield in the internal message schema) with the structured information. -
(Optional) If needed, you can add other preprocessing steps to the connector rule. You can use the same processing steps as in flows. These can be useful if you use a dedicated connector rule to fix or annotate data coming from some specific sources.
-
-
Select the protocol to use for receiving syslog data: TCP, UDP, or TLS.
When using TLS, set the paths for the certificates and keys used for the TLS-encrypted communication with the clients. For details, see Prerequisites.
- CA certificate path: The CA certificate that AxoRouter uses to authenticate the clients.
- Server certificate path: The certificate that AxoRouter shows to the clients.
- Server private key path: The private key of the server certificate.
-
(Optional) If explicitly needed for your use case, you can configure Framing manually when using the TCP and TLS protocols. Otherwise, leave it on Auto.
- Auto (newlines or octet counts): Auto-detect RFC 5424 framing or no framing. NUL terminated framing cannot be autodetected currently.
- RFC 5424 framing (octet counts): The payload contains the length of the message as specified in RFC6587 3.4.1.
- No framing (newline separated): Traditional newline-separated messages (non-transparent-framing) as specified in RFC6587 3.4.2.
- NUL terminated: Proprietary protocol where (possibly multi-line) messages are separated by a NUL byte. Use this when receiving messages from Splunk Heavy Forwarders using the Axoflow Forwarder Add-on.
-
Set the Port of the connector. The port number must be unique on the AxoRouter host. AxoConsole will not provision a connector to an AxoRouter if it would cause a port collision, but other software on the given host may already be using the chosen port number (for example, an SSH server on TCP port 22). In this case, AxoRouter won’t be able to reload the configuration and it will indicate an error.
-
(Optional) If you’re expecting high-volume UDP traffic on your AxoRouter instances that will have this connector, enable UDP loadbalancing by entering the number of UDP sockets to use into the UDP socket count field. The maximum recommended value is the number of cores available in the AxoRouter host.
If the value of UDP socket count is higher than 1 and EBPF load balancing is disabled, messages from a specific source host is always processed by the same socket (based on its IP address:port).
To loadbalance every message, including messages coming from a single host (for example, a high-traffic firewall that send a high volume of messages from a single IP:port pair), you can enable the EBPF load balancing option. Note that if you enable EBPF loadbalancing, messages of the same high-traffic source may be processed out of order. For details on how eBPF loadbalancing works, see the Scaling syslog to 1M EPS with eBPF blog post.

-
(Optional) If needed for your environment, set protocol-specific connector options as needed.
You can also modify the product and vendor labels of the connector. In that case, Axoflow will treat the incoming messages as it was received and classified as data from the specified product. This is useful if you want to send data from a specific product to a dedicated port.
These labels and other parameters of the connector will be available under the
meta.connectorkey as metadata for the messages received via the connector, and can be used in routing decisions and processing steps. You can check the metadata of the messages using log tapping.
-
Select Add.
Axoflow automatically creates connectors on the AxoRouter hosts that match the Router Selector.
Make sure to enable the ports you’ve configured in the connector on the firewall of the AxoRouter host, and on other firewalls between the AxoRouter host and your data sources.
Protocol-specific connector options
- Encoding: The character set of the messages, for example,
UTF-8. - Maximum connections: The maximum number of simultaneous connections the connector can receive.
- Socket buffer size: The size of the socket buffer (in bytes).
- Processing workers: Number of worker threads to use to process the messages received by the source connector. Note that this enables parallel processing, which might cause that the messages will be processed out of order. Increasing the number of worker threads can drastically improve the performance of the source. For details, see the AxoSyslog documentation.
Flow-control options
-
Initial log window size: The size (number of messages) of the initial window used in flow control. For details, see the AxoSyslog documentation.
If you change the value of Initial log window size, the change will affect only new connections, the Initial log window size of already established connections will not change. To apply the new Initial log window size value to every connection, restart the
axorouter.serviceservice on the Services page of the matching AxoRouters. A simple configuration reload is NOT sufficient.If the connector rule is receiving data using the UDP protocol, always restart the
axorouter.serviceservice on the Services page of the matching AxoRouters.
- Log fetch limit: The maximum number of messages fetched from a source during a single poll loop. For details, see the AxoSyslog documentation.
TCP options
- TCP Keepalive Time Interval: The interval (number of seconds) between subsequential keepalive probes, regardless of the traffic exchanged in the connection.
- TCP Keepalive Probes: The number of unacknowledged probes to send before considering the connection dead.
- TCP Keepalive Time: The interval (in seconds) between the last data packet sent and the first keepalive probe.
TLS options
For TLS, you can use the TCP-specific options, and also the following:
- Require MTLS: If enabled, the peers must have a TLS certificate, otherwise AxoRouter will reject the connection.
- Verify client certificate: If enabled, AxoRouter verifies certificate of the peer, and rejects connections with invalid certificates.
Labels
The AxoRouter syslog connector adds the following meta labels:
| Analytics label | Message field | value |
|---|---|---|
connector.type |
meta.connector.type |
syslog |
connector.name |
meta.connector.name |
The Name of the connector |
connector.port |
meta.connector.port |
The port number where the connector receives data |
You can use the labels as:
- Filter labels on the Analytics page,
- in the Filter By Label field during log tapping.
You can use the message fields
- in Flow Processing steps, for example, in the Query field of Select Messages steps,
- in AQL expressions in the search bars.
7 - Webhook
Webhook connectors of AxoRouter can be used to receive log events through HTTP(S) POST requests.
You can specify static and dynamic URLs to receive the data. AxoRouter automatically parses the JSON payload of the request, and adds it to the log.body field of the message as a JSON object. Other types of payload (including invalid JSON objects) is added to the log.body field as a string. Note that you can add further parsing to the body using processing steps in Flows, for example, using FilterX or Regex processing steps.
Prerequisites
To receive data via HTTPS, you’ll need a key and a certificate that the connector will show to the clients.
If you want to enable TLS encryption for this connector to encrypt the communication with the sources, you’ll need to set appropriate keys and certificates.
CAUTION:
Copy the keys and certificates to AxoRouter before starting to configure the connector. Otherwise, you won’t be able to make configuration changes that require reloading the AxoRouter service, including starting log tapping or flow tapping.Note the following points:
-
Keys and certificates must be in PEM format.
-
If the file contains a certificate chain, the file must begin with the certificate of the host, followed by the CA certificate that signed the certificate of the host, and any other signing CAs in order.
-
You must manually copy these files to their place on the AxoRouter host, currently you can’t distribute them from AxoConsole.
The files must be readable by the
axorouterservice. -
The recommended path for certificates is under
/etc/axorouter/user-config/(for example,/etc/axorouter/user-config/tls-key.pem). (If you need to use a different path, you have to append an option like-v /your/path:/your/pathto theAXOROUTER_PODMAN_ARGSvariable of/etc/axorouter/container.env.) -
When referring to the key or certificate during when configuring the connector, use absolute paths (for example,
/etc/axorouter/user-config/tls-key.pem).
Add new webhook connector
To add a new connector to an AxoRouter host, complete the following steps:
-
Select Routers > Connector Rules > Add Rule. (Alternatively, you can select Add Connector > Create a connector rule on the Connectors page of an AxoRouter host.)
-
Select Webhook.
-
Configure the connector rule.
-
Enter a name for the connector rule into the Rule Name field.
-
(Optional) Add labels to the connector rule. You will be able to use these labels in Flow Processing steps, for example, in the Query field of Select Messages steps. For details about the message schema and the related connector-specific fields, see the
meta.connectorobject. -
Set the Router Selector for the connector rule. The selector determines which AxoRouter instances will have a connector based on this connector rule.
You can use any labels and metadata of the AxoRouter hosts in the Router selectors, for example, the hostname of the AxoRouter, or any custom labels.
- If you leave the Router Selector field empty, the selector will match every AxoRouter instance.
- To select only a specific AxoRouter instance, set the
namefield to the name of the instance as selector. For example,name = my-axorouter. - If you set multiple fields in the selector, the selector will match only AxoRouter instances that match all elements of the selector. (There in an AND relationship between the fields.)
-
(Optional) Enter a Suffix for the connector rule. This suffix will be used in the name of the connector instances created on the AxoRouter hosts. For example, if the name of a matching AxoRouter instance is “my-axorouter”, and the suffix of the rule is “otlp-rule”, the connector created for the AxoRouter will be named “my-axorouter-otlp-rule”.
If the Suffix field is empty, the name of the connector rule is used instead.
-
(Optional) Enter a description for the rule.
-
If needed, enable the Classify and Parse preprocessing steps so AxoRouter automatically identifies and parses messages sent by supported data sources. If your source is not listed, contact us.
Enabling these options processes all data received by the connectors created based on this connector rule. If you want to apply classification and parsing more selectively, you can use the Classify and Parse processing steps in your Flows.
Note that the Parse processing step requires Classify to be enabled. Parsing automatically parses the data from the content of the message, and replaces the message content (the
log.bodyfield in the internal message schema) with the structured information. -
(Optional) If needed, you can add other preprocessing steps to the connector rule. You can use the same processing steps as in flows. These can be useful if you use a dedicated connector rule to fix or annotate data coming from some specific sources.
-
-
Select the protocol you want to use: HTTPS or HTTP.
-
Set the port number where the webhook will receive the POST requests, for example,
8080. -
Set the endpoints where the webhook will receive data in the Paths field. You can use static paths, or regular expressions. In regular expressions you can use named capture groups to automatically set macro values in AxoRouter. For example, the
/events/(?P<HOST>.*)path sets the hostname for the data received in the request based on the second part of the URL: a request to the/events/my-example-hostURL sets the host field of that message tomy-example-host.By default, the
/eventsand/events/(?P<HOST>.*)paths are active. -
For HTTPS endpoints, set the path to the Key and the Certificate files. AxoRouter uses these to encrypt the TLS channel. You can use absolute paths (for example,
/etc/axorouter/user-config/tls-key.pem). The key and the certificate must be in PEM format.You must manually copy these files to their place, currently you can’t distribute them from Axoflow.
-
Select Add.
Axoflow automatically creates connectors on the AxoRouter hosts that match the Router Selector.
Make sure to enable the ports you’ve configured in the connector on the firewall of the AxoRouter host, and on other firewalls between the AxoRouter host and your data sources.
-
Send a test request to the webhook.
-
Open the Overview tab of the AxoRouter host where you’ve created the webhook connector and check the IP address or FQDN of the host.
-
Open a terminal on your computer and send a POST request to the path you’ve configured in the webhook.
curl -X POST -H 'Content-Type: application/json' --data '{"host":"myhost", "body": "sample webhook message" }' <;router-IP-address>:<webhook-port-number>/<webhook-path>/For example, if you’ve used the default values of the webhook connector you can use:
curl -X POST -H 'Content-Type: application/json' --data '{"host":"myhost", "body": "sample webhook message" }' <;router-IP-address>/events/Expected output:
{"status": "received"}
-
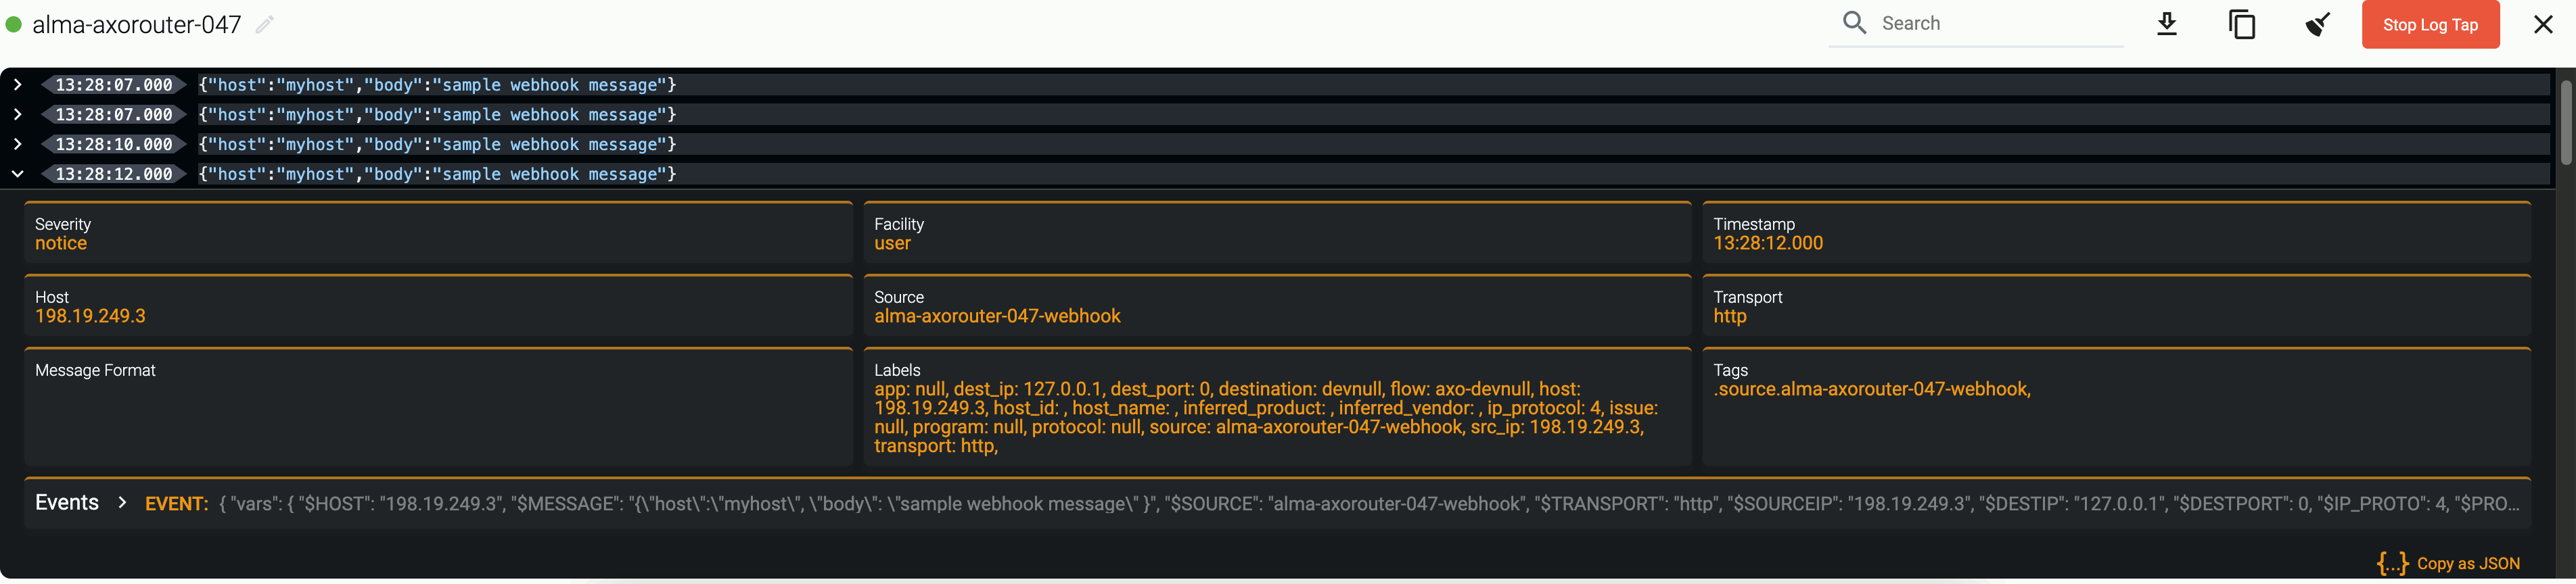
Metadata fields
The AxoRouter webhook connector adds the following fields to the meta variable:
| Analytics label | Message field | value |
|---|---|---|
connector.type |
meta.connector.type |
webhook |
connector.name |
meta.connector.name |
The Name of the connector |
connector.port |
meta.connector.port |
The port number where the connector receives data |
connector.labels.product |
meta.connector.labels.product |
Default value: webhook |
connector.labels.vendor |
meta.connector.labels.vendor |
Default value: generic |
You can use the labels as:
- Filter labels on the Analytics page,
- in the Filter By Label field during log tapping.
You can use the message fields
- in Flow Processing steps, for example, in the Query field of Select Messages steps,
- in AQL expressions in the search bars.
8 - Windows Event Collector (WEC)
The AxoRouter Windows Events connector can receive Windows Event Logs by running a Windows Event Collector (WEC) server. After enabling the Windows Events connector, you can configure your Microsoft Windows hosts to forward their event logs to AxoRouter using Windows Event Forwarding (WEF).
Windows Event Forwarding (WEF) reads any operational or administrative event logged on a Windows host and forwards the events you choose to a Windows Event Collector (WEC) server - in this case, AxoRouter.

Prerequisites
When using TLS authentication, you’ll need a
- CA certificate (in PEM format) that AxoRouter uses to authenticate the clients.
- A certificate and the matching private key (in PEM format) that AxoRouter shows to the clients.
These files must be available on the AxoRouter host, and readable by the axorouter service for the connector to work.
Add new Windows Event Log connector
To add a new connector to an AxoRouter host, complete the following steps.
Note
Currently you can configure one Windows Events connector for an AxoRouter.
-
Select Routers > Connector Rules > Add Rule. (Alternatively, you can select Add Connector > Create a connector rule on the Connectors page of an AxoRouter host.)
-
Select Windows Events.
-
Configure the connector rule.
-
Enter a name for the connector rule into the Rule Name field.
-
(Optional) Add labels to the connector rule. You will be able to use these labels in Flow Processing steps, for example, in the Query field of Select Messages steps. For details about the message schema and the related connector-specific fields, see the
meta.connectorobject. -
Set the Router Selector for the connector rule. The selector determines which AxoRouter instances will have a connector based on this connector rule.
You can use any labels and metadata of the AxoRouter hosts in the Router selectors, for example, the hostname of the AxoRouter, or any custom labels.
- If you leave the Router Selector field empty, the selector will match every AxoRouter instance.
- To select only a specific AxoRouter instance, set the
namefield to the name of the instance as selector. For example,name = my-axorouter. - If you set multiple fields in the selector, the selector will match only AxoRouter instances that match all elements of the selector. (There in an AND relationship between the fields.)
-
(Optional) Enter a Suffix for the connector rule. This suffix will be used in the name of the connector instances created on the AxoRouter hosts. For example, if the name of a matching AxoRouter instance is “my-axorouter”, and the suffix of the rule is “otlp-rule”, the connector created for the AxoRouter will be named “my-axorouter-otlp-rule”.
If the Suffix field is empty, the name of the connector rule is used instead.
-
(Optional) Enter a description for the rule.
-
If needed, enable the Classify and Parse preprocessing steps so AxoRouter automatically identifies and parses messages sent by supported data sources. If your source is not listed, contact us.
Enabling these options processes all data received by the connectors created based on this connector rule. If you want to apply classification and parsing more selectively, you can use the Classify and Parse processing steps in your Flows.
Note that the Parse processing step requires Classify to be enabled. Parsing automatically parses the data from the content of the message, and replaces the message content (the
log.bodyfield in the internal message schema) with the structured information. -
(Optional) If needed, you can add other preprocessing steps to the connector rule. You can use the same processing steps as in flows. These can be useful if you use a dedicated connector rule to fix or annotate data coming from some specific sources.
-
-
Configure the protocol-level settings of the connector.
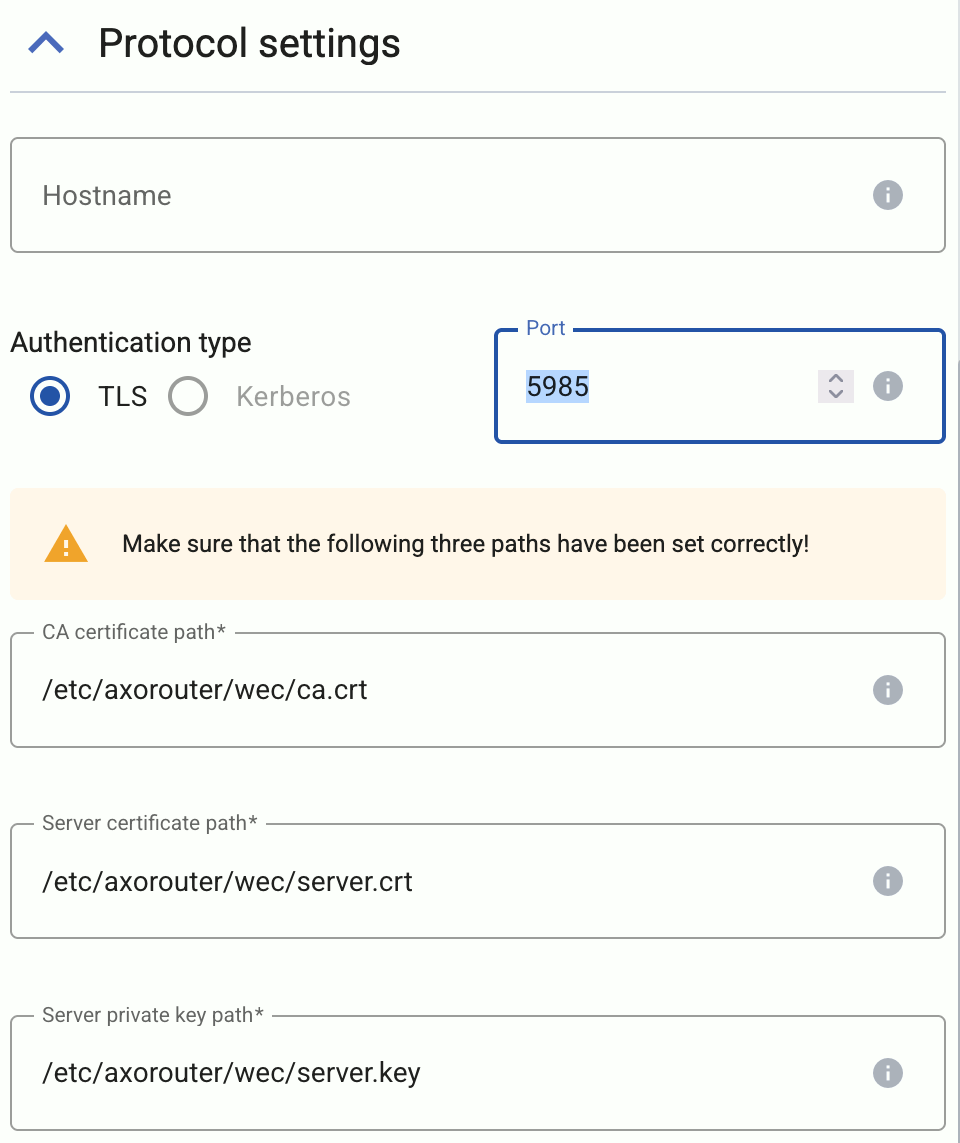
-
(Optional) Set the Hostname field. The clients will address this hostname. Note that:
- This is the hostname that is configured as the Subscription Manager address in the Group Policy Editor.
- If unset, the server will automatically detect it from the request’s host header.
-
(Optional) If for some reason don’t want to run the connection on the default port (
5986), adjust the Port field. -
Set the paths for the certificates and keys used for the TLS-encrypted communication with the clients.
Use absolute paths (for example,
/etc/axorouter/user-config/tls-key.pem). The key and the certificate must be in PEM format. You have to make sure that these files are available on the AxoRouter host, currently you can’t distribute them from AxoConsole.- CA certificate path: The CA certificate that AxoRouter uses to authenticate the clients. The file can contain multiple issuer certificates to allow clients connecting from multiple different domains simultaneously. If you want to limit which clients are accepted, set the More options > Certificate subject filter field.
- Server certificate path: The certificate that AxoRouter shows to the clients. The Common Name must match the hostname used by the clients to contact the server.
- Server private key path: The private key of the server certificate.
-
(Optional) If needed, set the number of workers.
- Processing workers: Number of worker threads to use to process the messages received by the source connector. Note that this enables parallel processing, which might cause that the messages will be processed out of order. Increasing the number of worker threads can drastically improve the performance of the source. For details, see the AxoSyslog documentation.
-
-
Configure the subscriptions of the connector.
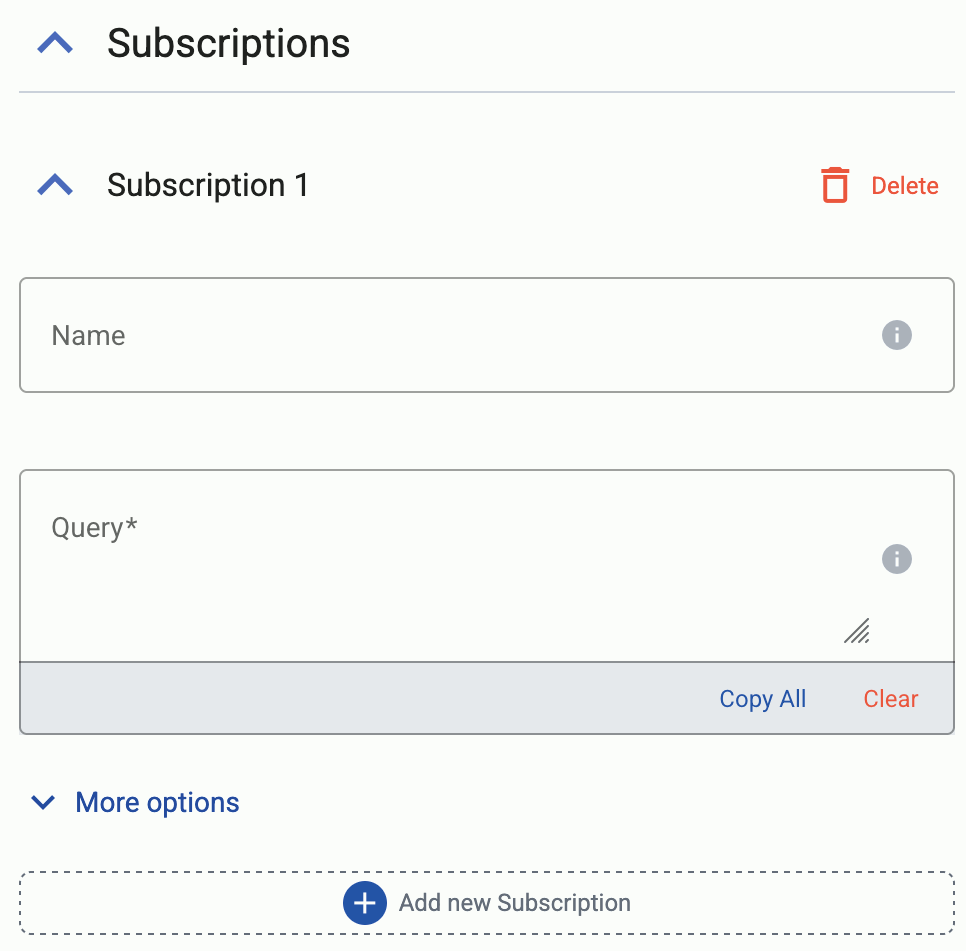
-
Select Add new Subscription.
-
(Optional) Set a name for the subscription. If you leave it empty, AxoConsole automatically generates a name.
-
Enter the event filter query into the Query field. This query specifies which events are collected by the subscription. For details on the query syntax, see the Microsoft documentation.
A single query can retrieve events from a maximum of 256 different channels.
For example, the following example queries every event from the Security, System, Application, and Setup channels.
<QueryList> <Query Id="0"> <Select Path="Application">*</Select> <Select Path="Security">*</Select> <Select Path="Setup">*</Select> <Select Path="System">*</Select> </Query> </QueryList> -
(Optional) If needed, you can configure other low-level options in the More options section. For details, see Additional options.
-
-
Select Add.
Axoflow automatically creates connectors on the AxoRouter hosts that match the Router Selector.
Make sure to enable the ports you’ve configured in the connector on the firewall of the AxoRouter host, and on other firewalls between the AxoRouter host and your data sources.
-
Configure Windows Event Forwarding on your Windows clients.
Additional options
You can set the following options of the WEC connector under Subscriptions > More options.
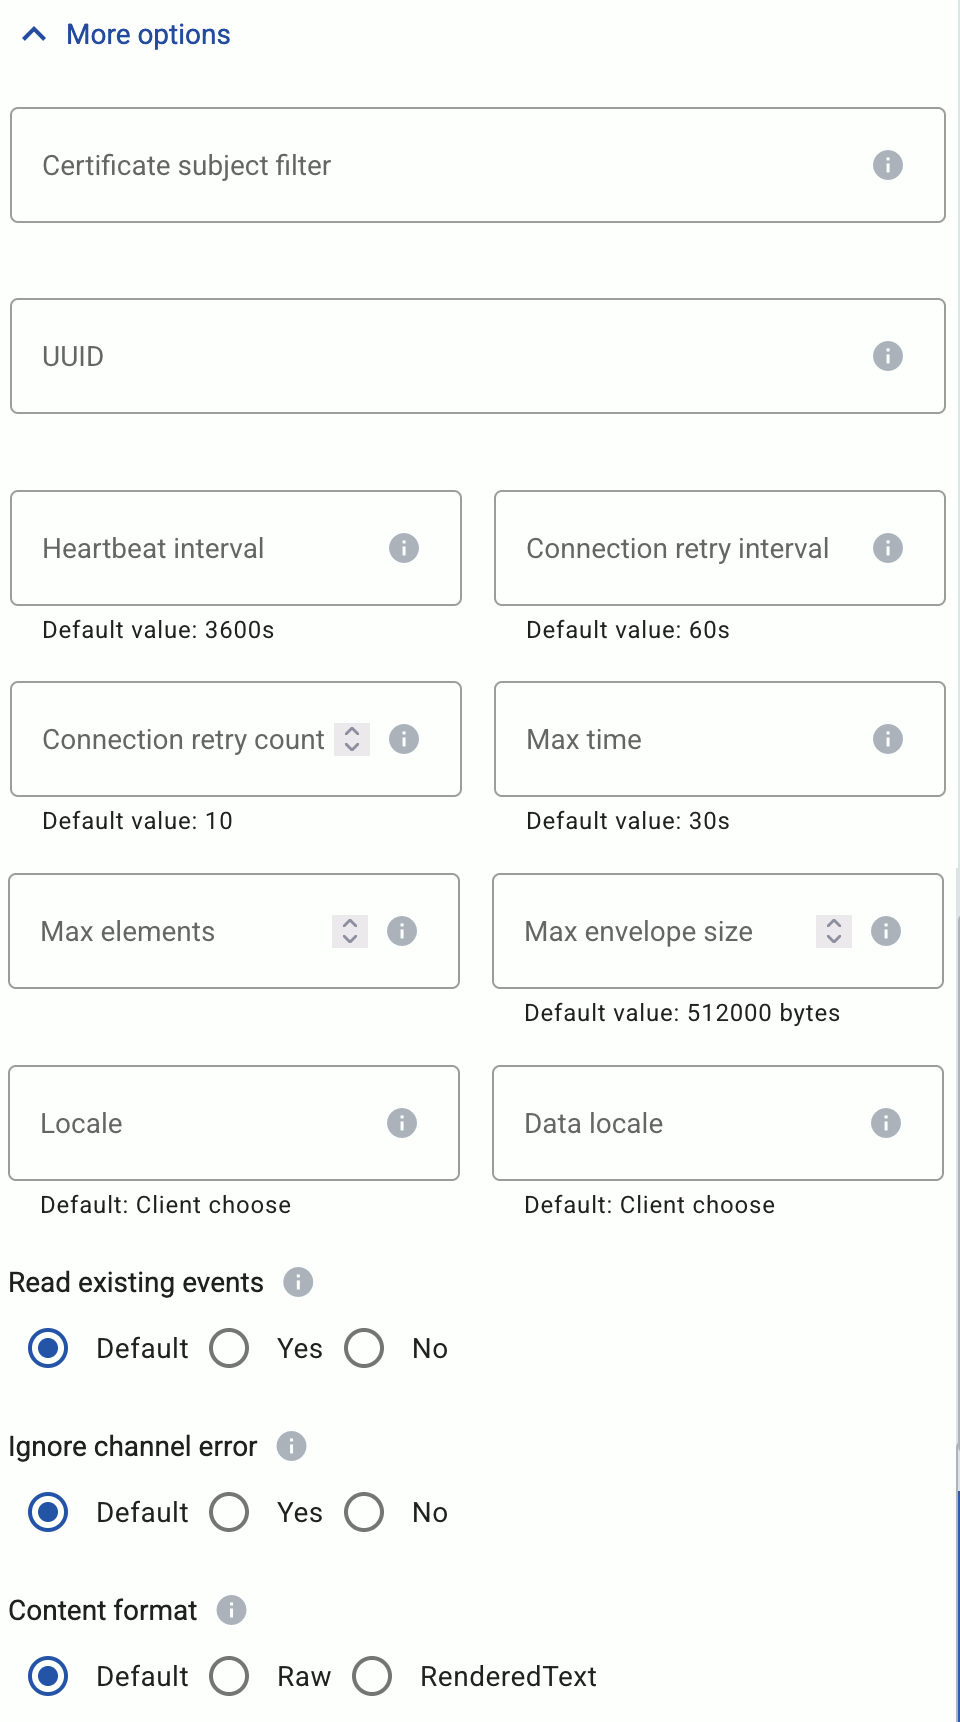
-
Certificate subject filter: A simple string to filter the clients based on the Common Name of their certificate. You can use the
*and?wildcard characters. -
UUID: A unique ID for the subscription. If empty, AxoConsole automatically generates it.
-
Heartbeat interval: The number of seconds, before the client will send a heartbeat message. The client sends heartbeat messages if it has no new events to send. Default value:
3600s -
Connection retry interval: Time between reconnection attempts. Default value:
60s -
Connection retry count: Number of times the client will attempt to reconnect if AxoRouter is unreachable. Default value:
10 -
Max time: The maximum number of seconds the client aggregates new events before sending them in a batch. Default value:
30s -
Max elements: The maximum number of events that the client aggregates before sending them in a batch. By default it’s empty, meaning that only the Max time and Max envelope size options limit the aggregation. Default value: empty
-
Max envelope size: The maximum number of bytes in the SOAP envelope used to deliver the events. Default value:
512000 bytes -
Locale: The language in which rendering information is expected, for example,
en-US. Default value:Client choose -
Data locale: The language in which numerical data is expected to be formatted, for example,
en-US. Default value:Client choose -
Read existing events: If enabled (Yes), the event source sends:
- all existing events that match the filter, and
- any events that subsequently occur for that event source.
If disabled (No), existing events will be ignored.
Default value: No
-
Ignore channel error: Subscription queries that result in errors will terminate the processing of the clients. Enable this option to ignore such errors. Default value: Yes
-
Content format: Determines whether to include rendering information (
RenderedText) with events or not (Raw). Default value: Raw
Configure Windows Event Forwarding
To configure Windows Event Forwarding (WEF) on your Windows clients to forward their events to the AxoRouter WEC connector, complete the following steps.
-
Configure the host so it can validate the certificate of AxoRouter.
- Open the Microsoft Management Console (
mmc.exe). - Select File > Add/Remove Snap-ins.
- Add the Certificates snap-in.
- Select Computer Account.
- Right-click Personal, then select All Tasks > Import.
- Select and import the client certificate file (
.p12). The Windows client will show this certificate to AxoRouter. - Import the CA certificate used to issue the certificate of AxoRouter, then move it to Trusted Root Certification Authorities.
- Open the Microsoft Management Console (
-
Set forwarding security data.
-
Open
CompMgmt.msc.- On domain controller hosts, navigate to Active Directory Users and Computers, select your domain, then select Builtin.
- On generic Windows hosts, navigate to Local Users and Groups > Groups > Event Log Readers, then open Event Log Readers Properties.
-
Add the
NETWORK SERVICEaccount to the Event Log Readers group. -
Reboot the host.
-
Open a command prompt with elevated privileges and run the following commands.
winrm qc -q
winrm set winrm/config/client/auth @{Certificate="true"}
-
-
Configure the Subscription Manager.
-
Open
gpedit.msc. -
Select Computer Configuration > Administrative Templates > Windows Components node > Event Forwarding.
-
Select SubscriptionManagers, then select Enabled.
-
Click Show.
-
Add a subscription. Use the hostname or IP address of AxoRouter you’ve set in the connector. For example:
Server=https://<FQDN-of-AxoRouter>:5986/wsman/SubscriptionManager/WEC,Refresh=<Refresh-interval-in-seconds>,IssuerCA=<fingerprint-of-AxoRouters-root-CA>The refresh interval determines how often the client checks for changes in the subscriptions. We recommend using 30 seconds during a test period (while you’re fine-tuning your subscriptions), and an hour (
3600) or longer in production environments.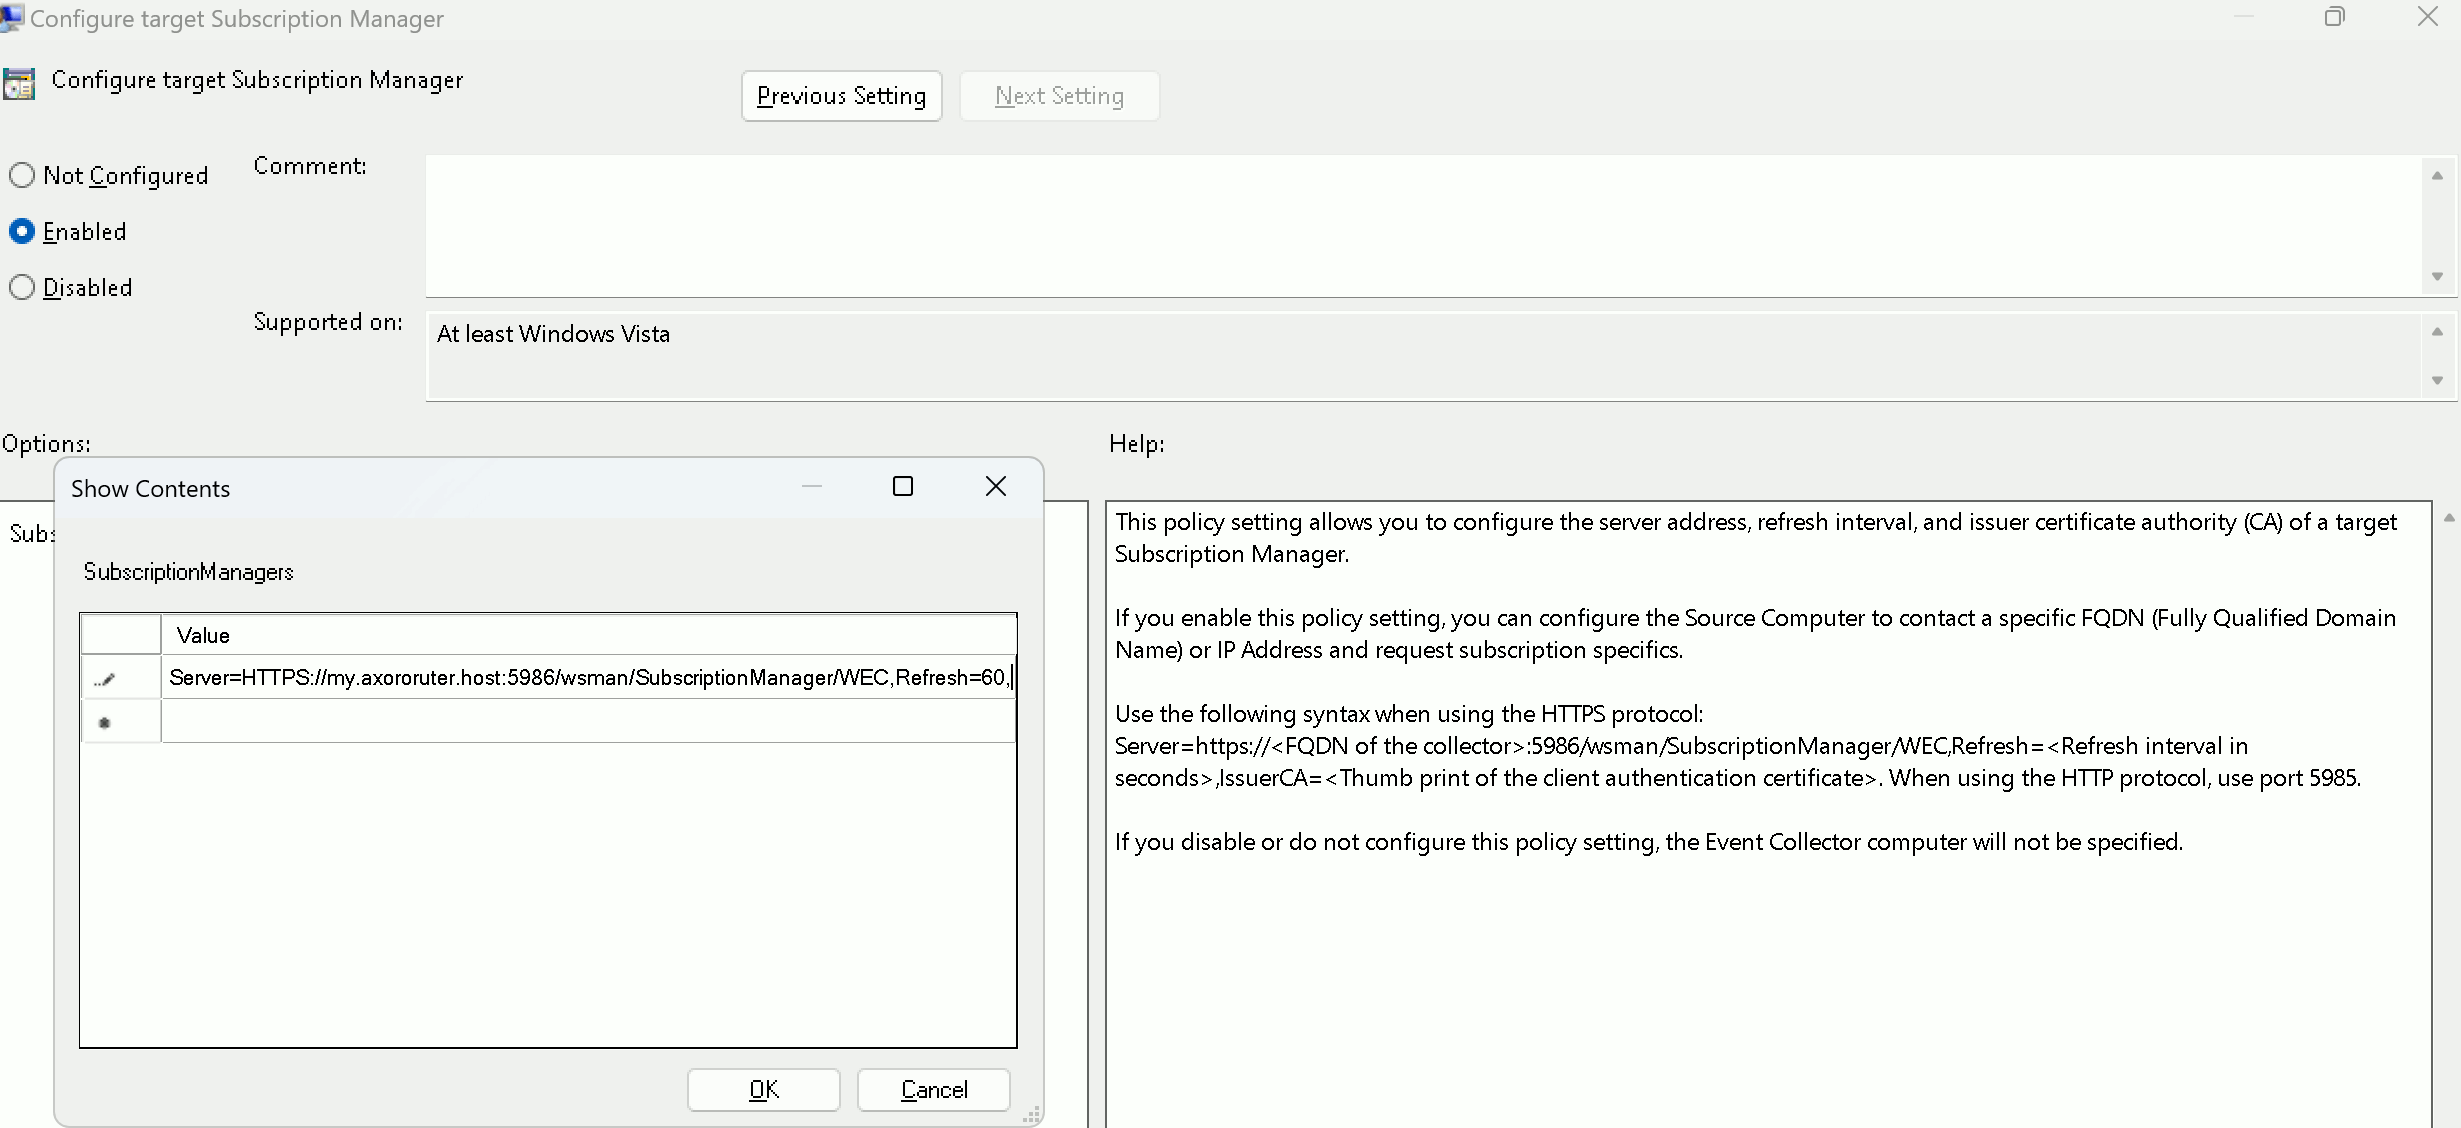
During testing and troubleshooting, the Applications and Services Logs\Microsoft\Windows\Eventlog-ForwardingPlugin and Applications and Services Logs\Microsoft\Windows\Windows Remote Management event log channels can be useful.
-
Metadata fields
The AxoRouter Windows Events connector adds the following fields to the meta variable:
| Analytics label | Message field | value |
|---|---|---|
connector.type |
meta.connector.type |
windowsEvents |
connector.name |
meta.connector.name |
The Name of the connector |
connector.port |
meta.connector.port |
The port number where the connector receives data |
You can use the labels as:
- Filter labels on the Analytics page,
- in the Filter By Label field during log tapping.
You can use the message fields
- in Flow Processing steps, for example, in the Query field of Select Messages steps,
- in AQL expressions in the search bars.
9 - Vendors
Prerequisites
- You have administrative access to the source device or host.
- You have an AxoRouter deployed and configured with a Syslog connector that has parsing and classification enabled (by default, every AxoRouter has such connectors). This device is going to receive the data from the source device or host.
-
You know the IP address the AxoRouter. To find it:
- Open the AxoConsole.
- Select the Routers or the Topology page.
- Select on AxoRouter instance that is going to receive the logs.
- Check the Networks > Address field.
Steps
To onboard a source that is specifically supported by Axoflow, complete the following steps. Onboarding allows you to collect metrics about the host, and display the host on the Topology page.
-
Open the AxoConsole.
-
Select Topology.
-
Select Add Item > Source.
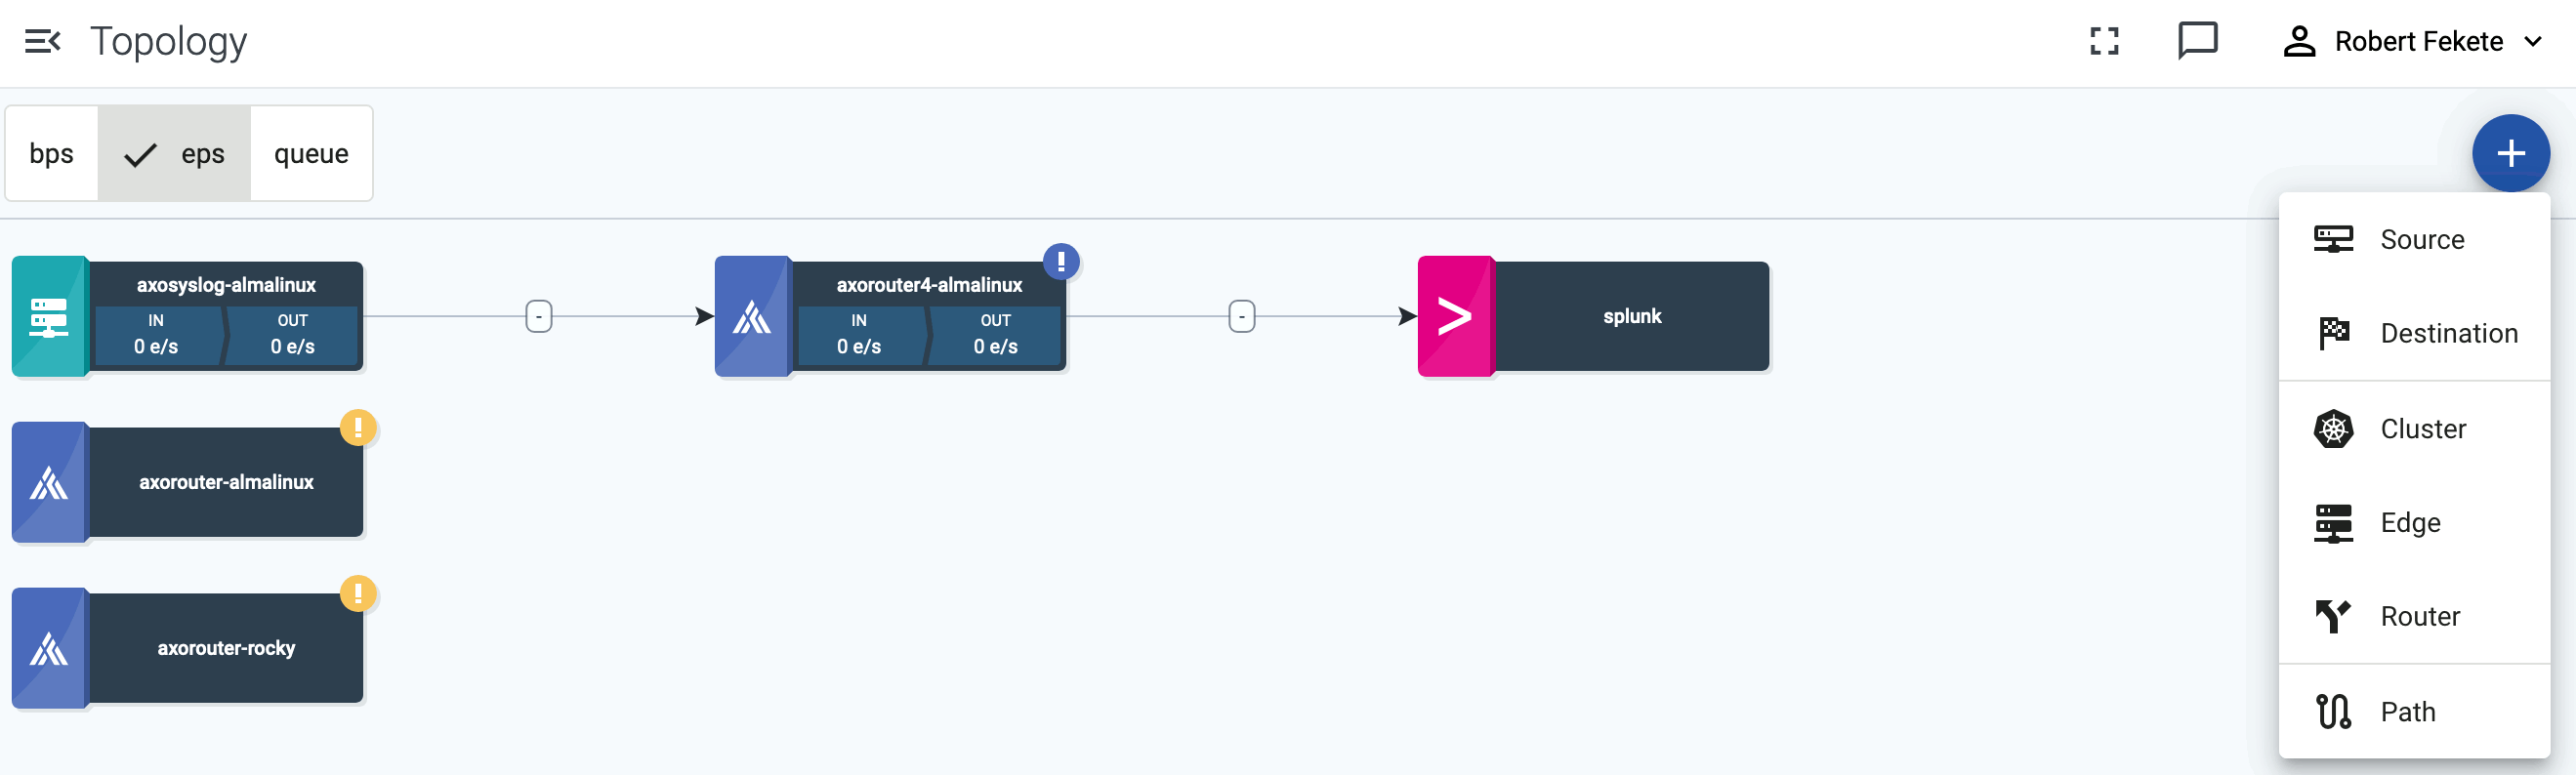
-
If the source is already sending logs to an AxoRouter instance that is registered in the AxoConsole, select Detected, then select the source.
Otherwise, select the type of the source you want to onboard, and follow the on-screen instructions.
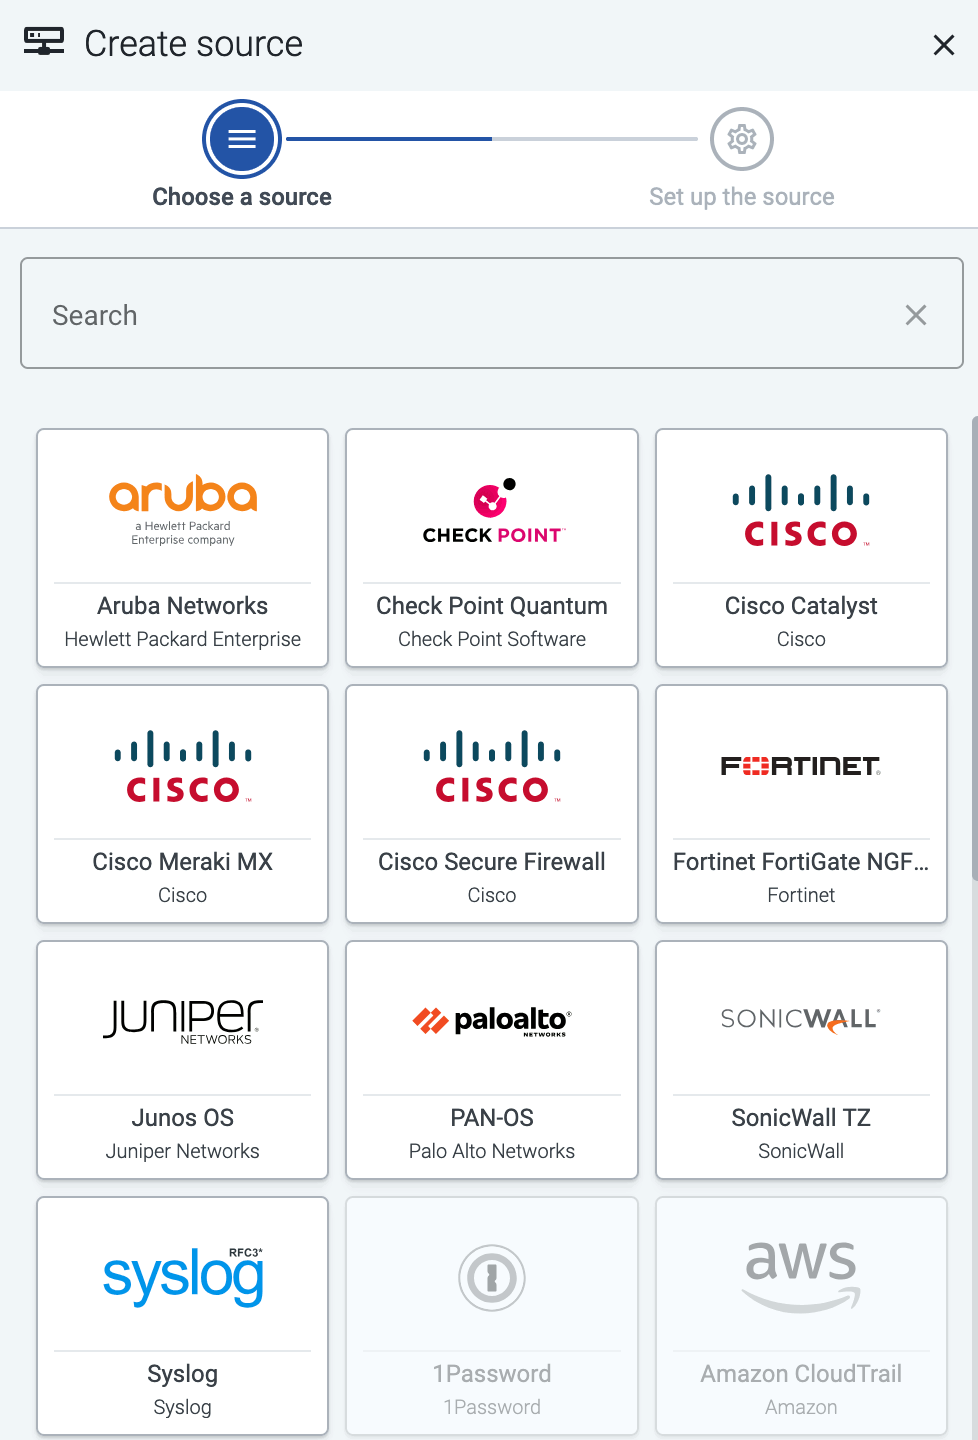
-
Connect the source to the destination or AxoRouter instance it’s sending logs to. If you’ve added the source from the Detected list, you can skip this step, as the path is created automatically.
-
Select Topology > Add Item > Path.
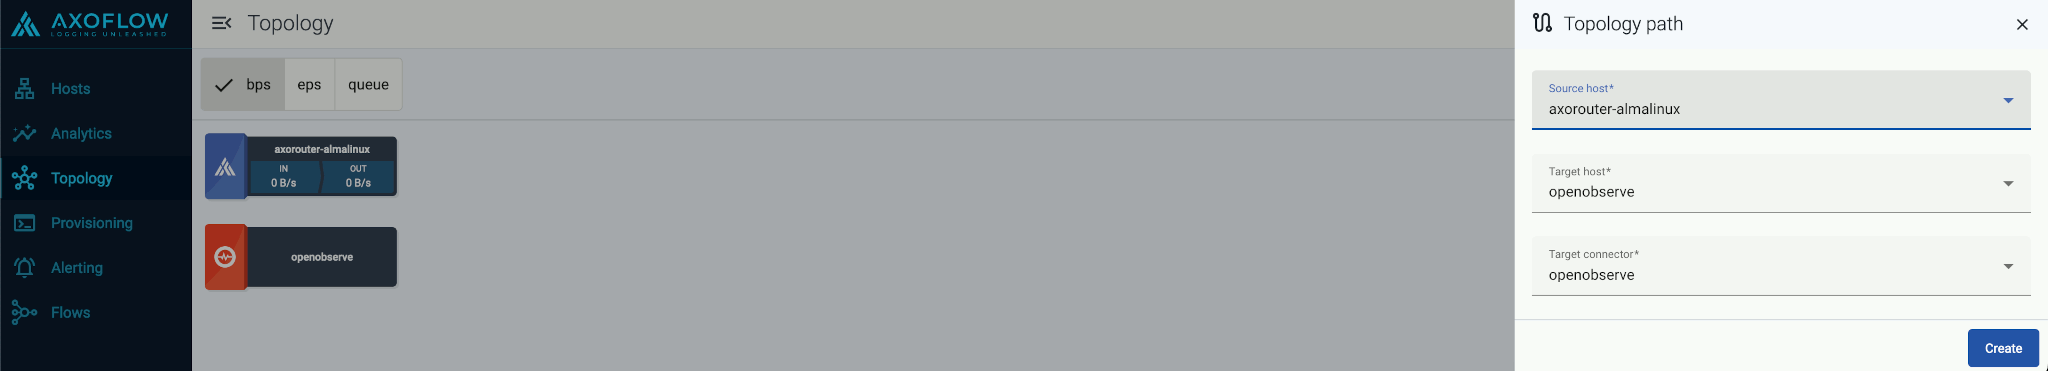
-
Select your data source in the Source host field.
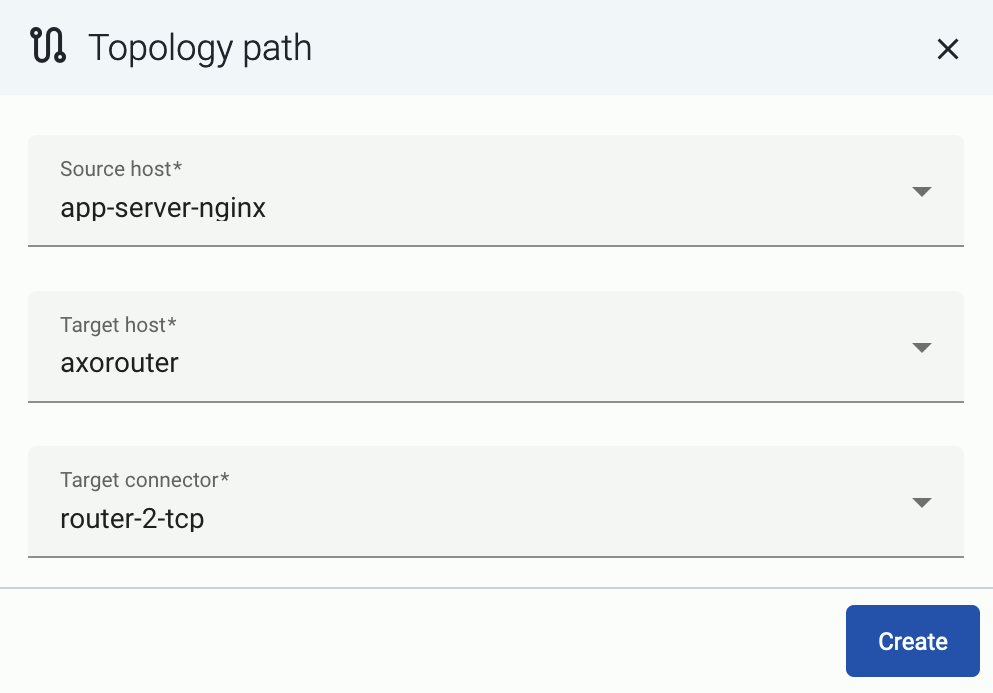
-
Select the target router or aggregator this source is sending its data to in the Target host field, for example,
axorouter. -
Select the Target connector. The connector determines how the destination receives the data (for example, using which protocol or port).
-
Select Add. The new path appears on the Topology page.
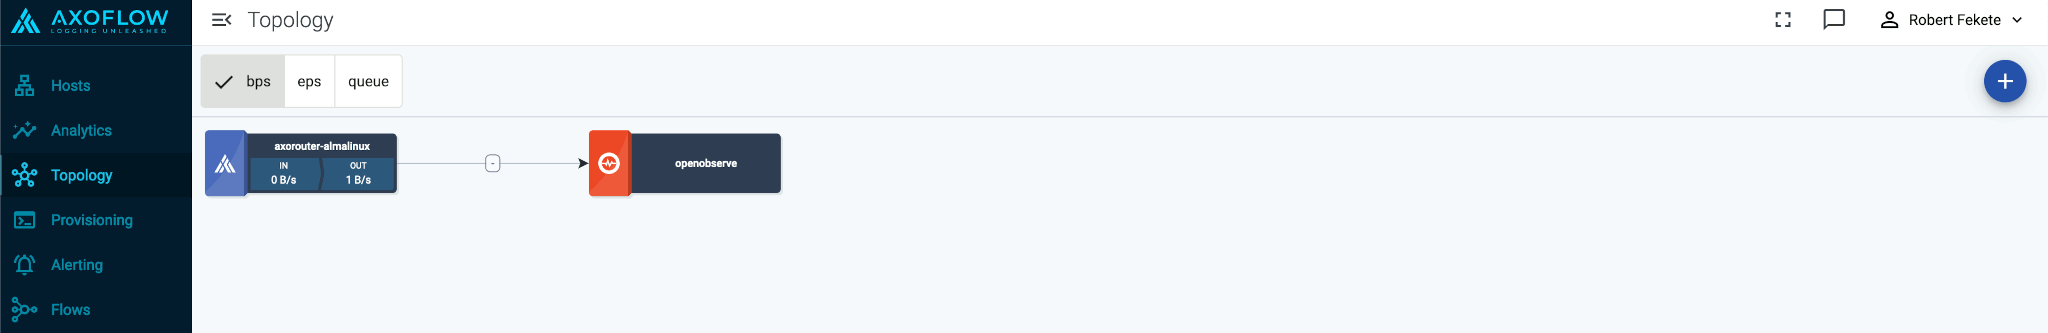
-
-
Configure the source to send logs to an AxoRouter instance. Specific instructions regarding individual vendors are listed below, along with default metadata (labels) and specific metadata for Splunk.
NoteUnless instructed otherwise, configure your source to send the logs to the Syslog connector of AxoRouter, using the appropriate port. Use RFC5424 if the source supports it.
- 514 UDP and TCP for RFC3164 (BSD-syslog) and RFC5424 (IETF-syslog) formatted traffic. AxoRouter automatically recognizes and handles both formats.
- 601 TCP for RFC5424 (IETF-syslog) and RFC3164 (BSD-syslog) formatted traffic. AxoRouter automatically recognizes and handles both formats.
- 6514 TCP for TLS-encrypted syslog traffic.
9.1 - A10 Networks
9.1.1 - vThunder
vThunder: Delivers application load balancing, traffic management, and DDoS protection for enterprise networks.
To onboard such a source to Axoflow, complete the generic appliance onboarding steps.
Labels
Axoflow automatically adds the following labels to data collected from this source:
| Analytics label | Message field | value |
|---|---|---|
vendor |
meta.vendor |
a10networks |
product |
meta.product |
vthunder |
You can use the labels as:
- Filter labels on the Analytics page,
- in the Filter By Label field during log tapping.
You can use the message fields
- in Flow Processing steps, for example, in the Query field of Select Messages steps,
- in AQL expressions in the search bars.
Sending data to Splunk
When sending the data collected from this source to Splunk, Axoflow uses the following sourcetype and index settings:
| sourcetype | source | index |
|---|---|---|
a10networks:vThunder:cef |
a10networks:vThunder |
netwaf |
Sending data to Google SecOps
When sending the data collected from this source to a dynamic Google SecOps destination, Axoflow sets the following log type: A10_LOAD_BALANCER.
9.2 - Amazon
9.2.1 - CloudWatch
CloudWatch: Monitors AWS resources and applications by collecting metrics, logs, and setting alarms.
Axoflow can collect data from your Amazon CloudWatch. At a high level, the process looks like this:
- Deploy an Axoflow Cloud Connector that will collect the data from your CloudWatch. Axoflow Cloud Connector is a simple container that you can deploy into AWS, another cloud provider, or on-prem.
- The connector forwards the collected data to the OpenTelemetry connector of an AxoRouter instance. This AxoRouter can be deployed within AWS, another cloud provider, or on-prem.
- Configure a Flow on AxoConsole that processes and routes the collected data to your destination (for example, Splunk or another SIEM).

Prerequisites
- An AWS account with an active subscription.
- A virtual machine or Kubernetes node running to deploy Axoflow Cloud Connector on.
- An AxoRouter instance that can receive data from the connector. Verify that it has an OpenTelemetry Connector (it’s enabled by default).
-
You know the IP address the AxoRouter. To find it:
- Open the AxoConsole.
- Select the Routers or the Topology page.
- Select on AxoRouter instance that is going to receive the logs.
- Check the Networks > Address field.
- The Axoflow Cloud Connector must be able to access the AxoRouter on the port the OpenTelemetry Connector is listening on (by default, port 4317). Depending on where the Axoflow Cloud Connector and AxoRouter are deployed, you might need to adjust firewall and ingress/egress rules in your environment.
- Depending on how you want to authenticate Axoflow Cloud Connector, you’ll need an AWS_PROFILE or AWS access keys.
Steps
To collect data from AWS CloudWatch, complete the following steps.
-
Deploy an Axoflow Cloud Connector.
-
Access the Kubernetes node or virtual machine where you want to deploy Axoflow Cloud Connector.
-
Set the following environment variable to the IP address of the AxoRouter where you want to forward the data from CloudWatch. This IP address must be accessible from the connector. You can find the IP address of AxoRouter on the Routers > AxoRouter > Overview page.
export AXOROUTER_ENDPOINT=<AxoRouter-IP-address> -
(Optional) By default, the connector stores positional and other persistence-related data in the
/etc/axoflow-otel-collector/storagedirectory. In case you want to use a different directory, set theSTORAGE_DIRECTORYenvironment variable. -
Run the following command to generate a UUID for the connector. AxoConsole will use this ID to identify the connector.
UUID_FULL=$(uuidgen 2>/dev/null || cat /proc/sys/kernel/random/uuid 2>/dev/null || python3 -c "import uuid; print(uuid.uuid4())") export AXOCLOUDCONNECTOR_DEVICE_ID=$(echo "$UUID_FULL" | cut -d'-' -f1) -
Set TLS encryption to secure the communication between Axoflow Cloud Connector and AxoRouter.
Configure the TLS-related settings of Axoflow Cloud Connector using the following environment variables.
Variable Required Default Description AXOROUTER_TLS_INSECURENo falseDisables TLS encryption if set to trueAXOROUTER_TLS_INCLUDE_SYSTEM_CA_CERTS_POOLNo falseSet to trueto use the system CA certificatesAXOROUTER_TLS_CA_FILENo - Path to the CA certificate file used to validate the certificate of AxoRouter AXOROUTER_TLS_CA_PEMNo - PEM-encoded CA certificate AXOROUTER_TLS_INSECURE_SKIP_VERIFYNo falseSet to trueto disable TLS certificate verification of AxoRouterAXOROUTER_TLS_CERT_FILENo - Path to the certificate file of Axoflow Cloud Connector AXOROUTER_TLS_CERT_PEMNo - PEM-encoded client certificate AXOROUTER_TLS_KEY_FILENo - Path to the client private key file of Axoflow Cloud Connector AXOROUTER_TLS_KEY_PEMNo - PEM-encoded client private key AXOROUTER_TLS_MIN_VERSIONNo 1.2Minimum TLS version to use AXOROUTER_TLS_MAX_VERSIONNo - Maximum TLS version to use Note You’ll have to include the TLS-related environment variables you set in the docker command used to deploy Axoflow Cloud Connector. -
Configure the authentication that the Axoflow Cloud Connector will use to access CloudWatch. Set the environment variables for the authentication method you want to use.
-
AWS Profile with a configuration file: Set the region and the AWS_PROFILE
export AWS_PROFILE="" export AWS_REGION="" -
AWS Credentials: To use AWS access keys, set an access key and a matching secret.
export AWS_ACCESS_KEY_ID="" export AWS_SECRET_ACCESS_KEY="" export AWS_REGION="" -
EC2 instance profile:
export AWS_REGION=""
-
-
Deploy the Axoflow Cloud Connector. The exact command depends on the authentication method and the TLS settings you want to configure.
-
AWS Profile with a configuration file: Set the region and the AWS_PROFILE. Also, pass the TLS-related settings you’ve set earlier.
docker run --rm \ -v "${STORAGE_DIRECTORY}":"${STORAGE_DIRECTORY}" \ -e AWS_PROFILE="${AWS_PROFILE}" \ -e AWS_REGION="${AWS_REGION}" \ -e AWS_SDK_LOAD_CONFIG=1 \ -e AXOROUTER_ENDPOINT="${AXOROUTER_ENDPOINT}" \ -e STORAGE_DIRECTORY="${STORAGE_DIRECTORY}" \ -e AXOCLOUDCONNECTOR_DEVICE_ID="${AXOCLOUDCONNECTOR_DEVICE_ID}" \ -e <TlS-related-environment-variable>="${<TlS-related-environment-variable>}" \ -v "${HOME}/.aws:/cloudconnectors/.aws:ro" \ ghcr.io/axoflow/axocloudconnectors:latest -
AWS Credentials: To use AWS access keys, set an access key and a matching secret. Also, pass the TLS-related settings you’ve set earlier.
docker run --rm \ -v "${STORAGE_DIRECTORY}":"${STORAGE_DIRECTORY}" \ -e AWS_ACCESS_KEY_ID="${AWS_ACCESS_KEY_ID}" \ -e AWS_SECRET_ACCESS_KEY="${AWS_SECRET_ACCESS_KEY}" \ -e AWS_REGION="${AWS_REGION}" \ -e AXOROUTER_ENDPOINT="${AXOROUTER_ENDPOINT}" \ -e AXOCLOUDCONNECTOR_DEVICE_ID="${AXOCLOUDCONNECTOR_DEVICE_ID}" \ -e <TlS-related-environment-variable>="${<TlS-related-environment-variable>}" \ -e STORAGE_DIRECTORY="${STORAGE_DIRECTORY}" \ ghcr.io/axoflow/axocloudconnectors:latest -
EC2 instance profile: Also, pass the TLS-related settings you’ve set earlier.
docker run --rm \
-v "${STORAGE_DIRECTORY}":"${STORAGE_DIRECTORY}" \
-e AWS_REGION="${AWS_REGION}" \
-e AXOROUTER_ENDPOINT="${AXOROUTER_ENDPOINT}" \
-e AXOCLOUDCONNECTOR_DEVICE_ID="${AXOCLOUDCONNECTOR_DEVICE_ID}" \
-e <TlS-related-environment-variable>="${<TlS-related-environment-variable>}" \
-e STORAGE_DIRECTORY="${STORAGE_DIRECTORY}" \
ghcr.io/axoflow/axocloudconnectors:latest
The Axoflow Cloud Connector starts forwarding logs to the AxoRouter instance.
-
-
-
Add the appliance to AxoConsole.
- Open the AxoConsole and select Topology.
- Select Add Item > Source.
- Select AWS CloudWatch.
- Enter the IP address and the FQDN of the Axoflow Cloud Connector instance.
- Select Add.
-
Create a Flow to route the data from the AxoRouter instance to a destination. You can use the Labels of this source to select messages from this source.
Labels
Axoflow automatically adds the following labels to data collected from this source:
| Analytics label | Message field | value |
|---|---|---|
vendor |
meta.vendor |
amazon |
product |
meta.product |
aws-cloudwatch |
You can use the labels as:
- Filter labels on the Analytics page,
- in the Filter By Label field during log tapping.
You can use the message fields
- in Flow Processing steps, for example, in the Query field of Select Messages steps,
- in AQL expressions in the search bars.
Sending data to Splunk
When sending the data collected from this source to Splunk, Axoflow uses the following sourcetype and index settings:
| sourcetype | index |
|---|---|
aws:cloudwatchlogs |
aws-activity |
Sending data to Google SecOps
When sending the data collected from this source to a dynamic Google SecOps destination, Axoflow sets the following log type: AWS_CLOUDWATCH.
9.3 - Axoflow
9.3.1 - AxoSyslog
AxoSyslog: High-performance, configurable syslog service for collecting, processing, and forwarding log data.
Configure AxoSyslog to send data to an OpenTelemetry Connector of an AxoRouter instance using its syslog-ng-otlp destination. If that’s not possible for some reason, use the syslog-ng destination with a Syslog Connector of an AxoRouter instance.
For the best integration of your AxoSyslog instances with AxoConsole, see AxoSyslog.
Labels
Enable classification and parsing in the connector rule that receives data from this source. Axoflow will identify the messages and add labels accordingly.
9.4 - Broadcom
9.4.1 - Edge Secure Web Gateway (Edge SWG)
Edge Secure Web Gateway (Edge SWG): Secures web traffic through policy enforcement, SSL inspection, and real-time threat protection.
To onboard such a source to Axoflow, complete the generic appliance onboarding steps.
Labels
Axoflow automatically adds the following labels to data collected from this source:
| Analytics label | Message field | value |
|---|---|---|
vendor |
meta.vendor |
broadcom |
product |
meta.product |
edge-swg |
service |
meta.service.name |
bluecoat, ProxySG |
You can use the labels as:
- Filter labels on the Analytics page,
- in the Filter By Label field during log tapping.
You can use the message fields
- in Flow Processing steps, for example, in the Query field of Select Messages steps,
- in AQL expressions in the search bars.
Sending data to Splunk
When sending the data collected from this source to Splunk, Axoflow uses the following sourcetype and index settings:
| sourcetype | index |
|---|---|
bluecoat:proxysg:access:syslog |
netops |
bluecoat:proxysg:access:kv |
netproxy |
Sending data to Google SecOps
When sending the data collected from this source to a dynamic Google SecOps destination, Axoflow sets the following log type: BROADCOM_EDGE_SWG.
Earlier name/vendor
- Blue Coat Proxy
- Blue Coat ProxySG
- Symantec ProxySG
- Symantec Edge Secure Web Gateway
- Symantec Edge SWG
9.4.2 - ESX
ESX: The primary function of ESX is to partition a physical server into multiple virtual machines (VMs), allowing different operating systems to run simultaneously and improving hardware utilization.
To onboard such a source to Axoflow, complete the generic appliance onboarding steps.
Labels
Axoflow automatically adds the following labels to data collected from this source:
| Analytics label | Message field | value |
|---|---|---|
vendor |
meta.vendor |
broadcom |
product |
meta.product |
esx |
service |
meta.service.name |
vmk, lsud, vsan, iofiltervpd, hostd, cmmdstimemachine, vmware, vpxa, eam, rhttpproxy, sdrsInjector, fdm, esxupdate, healthd, ConfigStore, kmxa, crx-cli, backup.sh, configStoreBackup, Host, vmauthd, localcli, watchdog-vsanperfsvc, watchdog-iofiltervpd, apiForwarder, tmpwatch, .etc.init.d.vsanmgmtd, ComplianceManager, hostprofiletrace, vobd, ucs-tool-esxi-inv, usbarb, auto-backup, cmmdsTimeMachineDump |
You can use the labels as:
- Filter labels on the Analytics page,
- in the Filter By Label field during log tapping.
You can use the message fields
- in Flow Processing steps, for example, in the Query field of Select Messages steps,
- in AQL expressions in the search bars.
Sending data to Splunk
When sending the data collected from this source to Splunk, Axoflow uses the following sourcetype and index settings:
| source | sourcetype | index |
|---|---|---|
vmware:esxlog:<service-name> |
vmware:esxlog:<service-name> |
infraops |
The service-name in the source and sourcetype is the same as the service label, for example, vmware:esxlog:vmware
Sending data to Google SecOps
When sending the data collected from this source to a dynamic Google SecOps destination, Axoflow sets the following log type: VMWARE_ESX.
Earlier name/vendor
- VMware ESX
9.4.3 - NSX
NSX: Provides network virtualization, micro-segmentation, and security for software-defined data centers.
To onboard such a source to Axoflow, complete the generic appliance onboarding steps.
Configure your NSX appliances, NSX Edges, and hypervisors to send their logs to the Syslog (autodetect and classify) connector of an AxoRouter instance. Use either:
- The TCP protocol (port 601 when using the default connector), or
- TLS-encrypted TCP protocol (port 6514 when using the default connector)
For details on configuring NSX, see Configure Remote Logging in the NSX Administration Guide.
Labels
Axoflow automatically adds the following labels to data collected from this source:
| Analytics label | Message field | value |
|---|---|---|
vendor |
meta.vendor |
broadcom |
product |
meta.product |
nsx |
service |
meta.service.name |
NSX, NSXV, FIREWALL-PKTLOG, dfwpktlogs |
You can use the labels as:
- Filter labels on the Analytics page,
- in the Filter By Label field during log tapping.
You can use the message fields
- in Flow Processing steps, for example, in the Query field of Select Messages steps,
- in AQL expressions in the search bars.
Sending data to Splunk
When sending the data collected from this source to Splunk, Axoflow uses the following sourcetype and index settings:
| sourcetype | index |
|---|---|
vmware:nsxlog:dfwpktlogs |
netfw |
vmware:nsxlog:firewall-pktlog |
netfw |
vmware:nsxlog:nsx |
infraops |
vmware:nsxlog:nsxv |
infraops |
Sending data to Google SecOps
When sending the data collected from this source to a dynamic Google SecOps destination, Axoflow sets the following log type: VMWARE_NSX.
Earlier name/vendor
- VMware NSX
- NSX-T Data Center
9.4.4 - vCenter
vCenter: vCenter is a centralized management platform that provides a single console for managing an entire VMware vSphere virtual infrastructure, including multiple ESXi hosts and virtual machines.
To onboard such a source to Axoflow, complete the generic appliance onboarding steps.
Labels
Axoflow automatically adds the following labels to data collected from this source:
| Analytics label | Message field | value |
|---|---|---|
vendor |
meta.vendor |
broadcom |
product |
meta.product |
vcenter |
service |
meta.service.name |
vpxd, vws, stats, cim-diag, sms, vim, cis-license, applmgmt-audit, updatemgr, vmafdd, vmcad, vmdird, vmon, osfsd, wcpxsvc, wcpsvc, mbcs, vmcam, vpostgres, vsphere, vcha, vcenter-server |
You can use the labels as:
- Filter labels on the Analytics page,
- in the Filter By Label field during log tapping.
You can use the message fields
- in Flow Processing steps, for example, in the Query field of Select Messages steps,
- in AQL expressions in the search bars.
Sending data to Splunk
When sending the data collected from this source to Splunk, Axoflow uses the following sourcetype and index settings:
| source | sourcetype | index |
|---|---|---|
vmware:vclog:<service-name> |
vmware:vclog:<service-name> |
infraops |
The service-name in the source and sourcetype is the same as the service label, for example, vmware:vclog:vmon
Sending data to Google SecOps
When sending the data collected from this source to a dynamic Google SecOps destination, Axoflow sets the following log type: VMWARE_VCENTER.
Earlier name/vendor
- VMware vCenter
9.5 - Check Point
9.5.1 - Anti-Bot
Anti-Bot: Detects and blocks botnet communications and command-and-control traffic to prevent malware infections.
To onboard such a source to Axoflow, complete the generic appliance onboarding steps.
Labels
Axoflow automatically adds the following labels to data collected from this source:
| Analytics label | Message field | value |
|---|---|---|
vendor |
meta.vendor |
checkpoint |
product |
meta.product |
anti-bot |
You can use the labels as:
- Filter labels on the Analytics page,
- in the Filter By Label field during log tapping.
You can use the message fields
- in Flow Processing steps, for example, in the Query field of Select Messages steps,
- in AQL expressions in the search bars.
Sending data to Splunk
When sending the data collected from this source to Splunk, Axoflow uses the following sourcetype and index settings:
| sourcetype | source | index |
|---|---|---|
cp_log |
checkpoint:endpoint |
netops |
Sending data to Google SecOps
When sending the data collected from this source to a dynamic Google SecOps destination, Axoflow sets the following log type: CHECKPOINT_EDR.
9.5.2 - Anti-Malware
Anti-Malware: Protects endpoints from viruses, ransomware, and other malware using signature and behavior analysis.
To onboard such a source to Axoflow, complete the generic appliance onboarding steps.
Labels
Axoflow automatically adds the following labels to data collected from this source:
| Analytics label | Message field | value |
|---|---|---|
vendor |
meta.vendor |
checkpoint |
product |
meta.product |
anti-malware |
You can use the labels as:
- Filter labels on the Analytics page,
- in the Filter By Label field during log tapping.
You can use the message fields
- in Flow Processing steps, for example, in the Query field of Select Messages steps,
- in AQL expressions in the search bars.
Sending data to Splunk
When sending the data collected from this source to Splunk, Axoflow uses the following sourcetype and index settings:
| sourcetype | source | index |
|---|---|---|
cp_log |
checkpoint:endpoint |
netops |
Sending data to Google SecOps
When sending the data collected from this source to a dynamic Google SecOps destination, Axoflow sets the following log type: CHECKPOINT_EDR.
9.5.3 - Anti-Phishing
Anti-Phishing: Prevents phishing attacks by analyzing email content and links to block credential theft attempts.
To onboard such a source to Axoflow, complete the generic appliance onboarding steps.
Labels
Axoflow automatically adds the following labels to data collected from this source:
| Analytics label | Message field | value |
|---|---|---|
vendor |
meta.vendor |
checkpoint |
product |
meta.product |
anti-phishing |
You can use the labels as:
- Filter labels on the Analytics page,
- in the Filter By Label field during log tapping.
You can use the message fields
- in Flow Processing steps, for example, in the Query field of Select Messages steps,
- in AQL expressions in the search bars.
Sending data to Splunk
When sending the data collected from this source to Splunk, Axoflow uses the following sourcetype and index settings:
| sourcetype | source | index |
|---|---|---|
cp_log |
checkpoint:email |
email |
Sending data to Google SecOps
When sending the data collected from this source to a dynamic Google SecOps destination, Axoflow sets the following log type: CHECKPOINT_EMAIL.
9.5.4 - Anti-Spam and Email Security
Anti-Spam and Email Security: Blocks spam and malicious email content using reputation checks and email filtering techniques.
To onboard such a source to Axoflow, complete the generic appliance onboarding steps.
Labels
Axoflow automatically adds the following labels to data collected from this source:
| Analytics label | Message field | value |
|---|---|---|
vendor |
meta.vendor |
checkpoint |
product |
meta.product |
antispam-emailsecurity |
You can use the labels as:
- Filter labels on the Analytics page,
- in the Filter By Label field during log tapping.
You can use the message fields
- in Flow Processing steps, for example, in the Query field of Select Messages steps,
- in AQL expressions in the search bars.
Sending data to Splunk
When sending the data collected from this source to Splunk, Axoflow uses the following sourcetype and index settings:
| sourcetype | source | index |
|---|---|---|
cp_log |
checkpoint:email |
email |
Sending data to Google SecOps
When sending the data collected from this source to a dynamic Google SecOps destination, Axoflow sets the following log type: CHECKPOINT_EMAIL.
9.5.5 - CPMI Client
CPMI Client: Legacy Check Point management client used to interface with security policies and logs.
To onboard such a source to Axoflow, complete the generic appliance onboarding steps.
Labels
Axoflow automatically adds the following labels to data collected from this source:
| Analytics label | Message field | value |
|---|---|---|
vendor |
meta.vendor |
checkpoint |
product |
meta.product |
cpmi-client |
You can use the labels as:
- Filter labels on the Analytics page,
- in the Filter By Label field during log tapping.
You can use the message fields
- in Flow Processing steps, for example, in the Query field of Select Messages steps,
- in AQL expressions in the search bars.
Sending data to Splunk
When sending the data collected from this source to Splunk, Axoflow uses the following sourcetype and index settings:
| sourcetype | index |
|---|---|
cp_log |
netops |
Sending data to Google SecOps
When sending the data collected from this source to a dynamic Google SecOps destination, Axoflow sets the following log type: CHECKPOINT_FIREWALL.
9.5.6 - cpmidu_update_tool
cpmidu_update_tool: Utility used to update configuration and database files for Check Point Multi-Domain environments.
To onboard such a source to Axoflow, complete the generic appliance onboarding steps.
Labels
Axoflow automatically adds the following labels to data collected from this source:
| Analytics label | Message field | value |
|---|---|---|
vendor |
meta.vendor |
checkpoint |
product |
meta.product |
cpmidu-update-tool |
You can use the labels as:
- Filter labels on the Analytics page,
- in the Filter By Label field during log tapping.
You can use the message fields
- in Flow Processing steps, for example, in the Query field of Select Messages steps,
- in AQL expressions in the search bars.
Sending data to Splunk
When sending the data collected from this source to Splunk, Axoflow uses the following sourcetype and index settings:
| sourcetype | source | index |
|---|---|---|
cp_log |
checkpoint:audit |
netops |
Sending data to Google SecOps
When sending the data collected from this source to a dynamic Google SecOps destination, Axoflow sets the following log type: CHECKPOINT_FIREWALL.
9.5.7 - Database Tool
Database Tool: Command-line tool to extract, query, or update Check Point configuration and policy databases.
To onboard such a source to Axoflow, complete the generic appliance onboarding steps.
Labels
Axoflow automatically adds the following labels to data collected from this source:
| Analytics label | Message field | value |
|---|---|---|
vendor |
meta.vendor |
checkpoint |
product |
meta.product |
database-tool |
You can use the labels as:
- Filter labels on the Analytics page,
- in the Filter By Label field during log tapping.
You can use the message fields
- in Flow Processing steps, for example, in the Query field of Select Messages steps,
- in AQL expressions in the search bars.
Sending data to Splunk
When sending the data collected from this source to Splunk, Axoflow uses the following sourcetype and index settings:
| sourcetype | source | index |
|---|---|---|
cp_log |
checkpoint:audit |
netops |
9.5.8 - Edge Secure Web Gateway (Edge SWG)
Edge Secure Web Gateway (Edge SWG): Provides configuration profiles for secure mobile access and web filtering on iOS devices.
To onboard such a source to Axoflow, complete the generic appliance onboarding steps.
Labels
Axoflow automatically adds the following labels to data collected from this source:
| Analytics label | Message field | value |
|---|---|---|
vendor |
meta.vendor |
checkpoint |
product |
meta.product |
ios-profiles |
You can use the labels as:
- Filter labels on the Analytics page,
- in the Filter By Label field during log tapping.
You can use the message fields
- in Flow Processing steps, for example, in the Query field of Select Messages steps,
- in AQL expressions in the search bars.
Sending data to Splunk
When sending the data collected from this source to Splunk, Axoflow uses the following sourcetype and index settings:
| sourcetype | source | index |
|---|---|---|
cp_log |
checkpoint:network |
netops |
Sending data to Google SecOps
When sending the data collected from this source to a dynamic Google SecOps destination, Axoflow sets the following log type: CHECKPOINT_HARMONY.
9.5.9 - Endpoint Compliance
Endpoint Compliance: Checks endpoint status and posture before granting network access, enforcing security policies.
To onboard such a source to Axoflow, complete the generic appliance onboarding steps.
Labels
Axoflow automatically adds the following labels to data collected from this source:
| Analytics label | Message field | value |
|---|---|---|
vendor |
meta.vendor |
checkpoint |
product |
meta.product |
endpoint-compliance |
You can use the labels as:
- Filter labels on the Analytics page,
- in the Filter By Label field during log tapping.
You can use the message fields
- in Flow Processing steps, for example, in the Query field of Select Messages steps,
- in AQL expressions in the search bars.
Sending data to Splunk
When sending the data collected from this source to Splunk, Axoflow uses the following sourcetype and index settings:
| sourcetype | source | index |
|---|---|---|
cp_log |
checkpoint:endpoint |
netops |
Sending data to Google SecOps
When sending the data collected from this source to a dynamic Google SecOps destination, Axoflow sets the following log type: CHECKPOINT_EDR.
9.5.10 - Endpoint Management
Endpoint Management: Centralized platform for managing endpoint protection, updates, and policy enforcement.
To onboard such a source to Axoflow, complete the generic appliance onboarding steps.
Labels
Axoflow automatically adds the following labels to data collected from this source:
| Analytics label | Message field | value |
|---|---|---|
vendor |
meta.vendor |
checkpoint |
product |
meta.product |
endpoint-management |
You can use the labels as:
- Filter labels on the Analytics page,
- in the Filter By Label field during log tapping.
You can use the message fields
- in Flow Processing steps, for example, in the Query field of Select Messages steps,
- in AQL expressions in the search bars.
Sending data to Splunk
When sending the data collected from this source to Splunk, Axoflow uses the following sourcetype and index settings:
| sourcetype | source | index |
|---|---|---|
cp_log |
checkpoint:endpoint |
netops |
9.5.11 - Forensics
Forensics: Analyzes security incidents on endpoints to uncover attack vectors and malicious activity.
To onboard such a source to Axoflow, complete the generic appliance onboarding steps.
Labels
Axoflow automatically adds the following labels to data collected from this source:
| Analytics label | Message field | value |
|---|---|---|
vendor |
meta.vendor |
checkpoint |
product |
meta.product |
forensics |
You can use the labels as:
- Filter labels on the Analytics page,
- in the Filter By Label field during log tapping.
You can use the message fields
- in Flow Processing steps, for example, in the Query field of Select Messages steps,
- in AQL expressions in the search bars.
Sending data to Splunk
When sending the data collected from this source to Splunk, Axoflow uses the following sourcetype and index settings:
| sourcetype | source | index |
|---|---|---|
cp_log |
checkpoint:endpoint |
netops |
Sending data to Google SecOps
When sending the data collected from this source to a dynamic Google SecOps destination, Axoflow sets the following log type: CHECKPOINT_EDR.
9.5.12 - GO Password Reset
GO Password Reset: Facilitates secure password reset processes for users across integrated environments.
To onboard such a source to Axoflow, complete the generic appliance onboarding steps.
Labels
Axoflow automatically adds the following labels to data collected from this source:
| Analytics label | Message field | value |
|---|---|---|
vendor |
meta.vendor |
checkpoint |
product |
meta.product |
go-password-reset |
You can use the labels as:
- Filter labels on the Analytics page,
- in the Filter By Label field during log tapping.
You can use the message fields
- in Flow Processing steps, for example, in the Query field of Select Messages steps,
- in AQL expressions in the search bars.
Sending data to Splunk
When sending the data collected from this source to Splunk, Axoflow uses the following sourcetype and index settings:
| sourcetype | source | index |
|---|---|---|
cp_log |
checkpoint:audit |
netops |
Sending data to Google SecOps
When sending the data collected from this source to a dynamic Google SecOps destination, Axoflow sets the following log type: CHECKPOINT_AUDIT.
9.5.13 - HTTPS Inspection
HTTPS Inspection: Decrypts and inspects HTTPS traffic to detect hidden threats within encrypted web sessions.
To onboard such a source to Axoflow, complete the generic appliance onboarding steps.
Labels
Axoflow automatically adds the following labels to data collected from this source:
| Analytics label | Message field | value |
|---|---|---|
vendor |
meta.vendor |
checkpoint |
product |
meta.product |
https-inspection |
service |
meta.service.name |
CP-GW |
You can use the labels as:
- Filter labels on the Analytics page,
- in the Filter By Label field during log tapping.
You can use the message fields
- in Flow Processing steps, for example, in the Query field of Select Messages steps,
- in AQL expressions in the search bars.
Sending data to Splunk
When sending the data collected from this source to Splunk, Axoflow uses the following sourcetype and index settings:
| sourcetype | source | index |
|---|---|---|
cp_log |
checkpoint:firewall |
netfw |
Sending data to Google SecOps
When sending the data collected from this source to a dynamic Google SecOps destination, Axoflow sets the following log type: CHECKPOINT_FIREWALL.
9.5.14 - IPS
IPS: Detects and blocks known and unknown exploits, malware, and vulnerabilities in network traffic.
To onboard such a source to Axoflow, complete the generic appliance onboarding steps.
Labels
Axoflow automatically adds the following labels to data collected from this source:
| Analytics label | Message field | value |
|---|---|---|
vendor |
meta.vendor |
checkpoint |
product |
meta.product |
ips |
You can use the labels as:
- Filter labels on the Analytics page,
- in the Filter By Label field during log tapping.
You can use the message fields
- in Flow Processing steps, for example, in the Query field of Select Messages steps,
- in AQL expressions in the search bars.
Sending data to Splunk
When sending the data collected from this source to Splunk, Axoflow uses the following sourcetype and index settings:
| sourcetype | source | index |
|---|---|---|
cp_log |
checkpoint:ids |
netids |
Sending data to Google SecOps
When sending the data collected from this source to a dynamic Google SecOps destination, Axoflow sets the following log type: CHECKPOINT_EDR.
9.5.15 - MDS Query Tool
MDS Query Tool: CLI tool for querying multi-domain configurations and policies in Check Point environments.
To onboard such a source to Axoflow, complete the generic appliance onboarding steps.
Labels
Axoflow automatically adds the following labels to data collected from this source:
| Analytics label | Message field | value |
|---|---|---|
vendor |
meta.vendor |
checkpoint |
product |
meta.product |
mds-query-tool |
You can use the labels as:
- Filter labels on the Analytics page,
- in the Filter By Label field during log tapping.
You can use the message fields
- in Flow Processing steps, for example, in the Query field of Select Messages steps,
- in AQL expressions in the search bars.
Sending data to Splunk
When sending the data collected from this source to Splunk, Axoflow uses the following sourcetype and index settings:
| sourcetype | index |
|---|---|
cp_log |
netops |
9.5.16 - Media Encryption & Port Protection
Media Encryption & Port Protection: Secures USB ports and encrypts removable media to protect sensitive data on endpoints.
To onboard such a source to Axoflow, complete the generic appliance onboarding steps.
Labels
Axoflow automatically adds the following labels to data collected from this source:
| Analytics label | Message field | value |
|---|---|---|
vendor |
meta.vendor |
checkpoint |
product |
meta.product |
media-port |
You can use the labels as:
- Filter labels on the Analytics page,
- in the Filter By Label field during log tapping.
You can use the message fields
- in Flow Processing steps, for example, in the Query field of Select Messages steps,
- in AQL expressions in the search bars.
Sending data to Splunk
When sending the data collected from this source to Splunk, Axoflow uses the following sourcetype and index settings:
| sourcetype | source | index |
|---|---|---|
cp_log |
checkpoint:endpoint |
netops |
Sending data to Google SecOps
When sending the data collected from this source to a dynamic Google SecOps destination, Axoflow sets the following log type: CHECKPOINT_EDR.
9.5.17 - Mobile Access
Mobile Access: Enables secure remote access to corporate apps and data from mobile devices.
To onboard such a source to Axoflow, complete the generic appliance onboarding steps.
Labels
Axoflow automatically adds the following labels to data collected from this source:
| Analytics label | Message field | value |
|---|---|---|
vendor |
meta.vendor |
checkpoint |
product |
meta.product |
mobile-access |
You can use the labels as:
- Filter labels on the Analytics page,
- in the Filter By Label field during log tapping.
You can use the message fields
- in Flow Processing steps, for example, in the Query field of Select Messages steps,
- in AQL expressions in the search bars.
Sending data to Splunk
When sending the data collected from this source to Splunk, Axoflow uses the following sourcetype and index settings:
| sourcetype | source | index |
|---|---|---|
cp_log |
checkpoint:network |
netops |
9.5.18 - Next-Generation Firewall (NGFW)
Next-Generation Firewall (NGFW): Next-generation firewall providing intrusion prevention, application control, and threat protection.
To onboard such a source to Axoflow, complete the generic appliance onboarding steps.
Labels
Axoflow automatically adds the following labels to data collected from this source:
| Analytics label | Message field | value |
|---|---|---|
vendor |
meta.vendor |
checkpoint |
product |
meta.product |
firewall |
service |
meta.service.name |
CP-GW |
You can use the labels as:
- Filter labels on the Analytics page,
- in the Filter By Label field during log tapping.
You can use the message fields
- in Flow Processing steps, for example, in the Query field of Select Messages steps,
- in AQL expressions in the search bars.
Sending data to Splunk
When sending the data collected from this source to Splunk, Axoflow uses the following sourcetype and index settings:
| sourcetype | source | index |
|---|---|---|
cp_log |
checkpoint:firewall |
netfw |
Sending data to Google SecOps
When sending the data collected from this source to a dynamic Google SecOps destination, Axoflow sets the following log type: CHECKPOINT_FIREWALL.
9.5.19 - QoS
QoS: Implements bandwidth control and traffic prioritization policies for optimized network usage.
To onboard such a source to Axoflow, complete the generic appliance onboarding steps.
Labels
Axoflow automatically adds the following labels to data collected from this source:
| Analytics label | Message field | value |
|---|---|---|
vendor |
meta.vendor |
checkpoint |
product |
meta.product |
qos |
You can use the labels as:
- Filter labels on the Analytics page,
- in the Filter By Label field during log tapping.
You can use the message fields
- in Flow Processing steps, for example, in the Query field of Select Messages steps,
- in AQL expressions in the search bars.
Sending data to Splunk
When sending the data collected from this source to Splunk, Axoflow uses the following sourcetype and index settings:
| sourcetype | source | index |
|---|---|---|
cp_log |
checkpoint:firewall |
netfw |
Sending data to Google SecOps
When sending the data collected from this source to a dynamic Google SecOps destination, Axoflow sets the following log type: CHECKPOINT_FIREWALL.
9.5.20 - Quantum
Quantum: Unified threat prevention platform delivering firewall, VPN, and intrusion prevention capabilities.
If you’d like to send data from this source to AxoRouter, contact our support team for details.
9.5.21 - Query Database
Query Database: Accesses and queries internal policy or object databases in Check Point systems.
To onboard such a source to Axoflow, complete the generic appliance onboarding steps.
Labels
Axoflow automatically adds the following labels to data collected from this source:
| Analytics label | Message field | value |
|---|---|---|
vendor |
meta.vendor |
checkpoint |
product |
meta.product |
query-database |
You can use the labels as:
- Filter labels on the Analytics page,
- in the Filter By Label field during log tapping.
You can use the message fields
- in Flow Processing steps, for example, in the Query field of Select Messages steps,
- in AQL expressions in the search bars.
Sending data to Splunk
When sending the data collected from this source to Splunk, Axoflow uses the following sourcetype and index settings:
| sourcetype | source | index |
|---|---|---|
cp_log |
checkpoint:audit |
netops |
9.5.22 - SmartConsole
SmartConsole: Graphical interface for managing Check Point security policies, logs, and monitoring.
To onboard such a source to Axoflow, complete the generic appliance onboarding steps.
Labels
Axoflow automatically adds the following labels to data collected from this source:
| Analytics label | Message field | value |
|---|---|---|
vendor |
meta.vendor |
checkpoint |
product |
meta.product |
smartconsole |
You can use the labels as:
- Filter labels on the Analytics page,
- in the Filter By Label field during log tapping.
You can use the message fields
- in Flow Processing steps, for example, in the Query field of Select Messages steps,
- in AQL expressions in the search bars.
Sending data to Splunk
When sending the data collected from this source to Splunk, Axoflow uses the following sourcetype and index settings:
| sourcetype | source | index |
|---|---|---|
cp_log |
checkpoint:audit |
netops |
9.5.23 - SmartUpdate
SmartUpdate: Tool for updating and managing licenses, software, and hotfixes in Check Point environments.
To onboard such a source to Axoflow, complete the generic appliance onboarding steps.
Labels
Axoflow automatically adds the following labels to data collected from this source:
| Analytics label | Message field | value |
|---|---|---|
vendor |
meta.vendor |
checkpoint |
product |
meta.product |
smartupdate |
You can use the labels as:
- Filter labels on the Analytics page,
- in the Filter By Label field during log tapping.
You can use the message fields
- in Flow Processing steps, for example, in the Query field of Select Messages steps,
- in AQL expressions in the search bars.
Sending data to Splunk
When sending the data collected from this source to Splunk, Axoflow uses the following sourcetype and index settings:
| sourcetype | source | index |
|---|---|---|
cp_log |
checkpoint:audit |
netops |
9.5.24 - Threat Emulation and Anti-Exploit
Threat Emulation and Anti-Exploit: Emulates files in a virtual environment to detect and block advanced persistent threats and exploits.
To onboard such a source to Axoflow, complete the generic appliance onboarding steps.
Labels
Axoflow automatically adds the following labels to data collected from this source:
| Analytics label | Message field | value |
|---|---|---|
vendor |
meta.vendor |
checkpoint |
product |
meta.product |
threat-emulation |
You can use the labels as:
- Filter labels on the Analytics page,
- in the Filter By Label field during log tapping.
You can use the message fields
- in Flow Processing steps, for example, in the Query field of Select Messages steps,
- in AQL expressions in the search bars.
Sending data to Splunk
When sending the data collected from this source to Splunk, Axoflow uses the following sourcetype and index settings:
| sourcetype | source | index |
|---|---|---|
cp_log |
checkpoint:endpoint |
netops |
Sending data to Google SecOps
When sending the data collected from this source to a dynamic Google SecOps destination, Axoflow sets the following log type: CHECKPOINT_EDR.
9.5.25 - URL Filtering
URL Filtering: Controls and logs web access based on URL categories and custom site rules to enforce policy.
To onboard such a source to Axoflow, complete the generic appliance onboarding steps.
Labels
Axoflow automatically adds the following labels to data collected from this source:
| Analytics label | Message field | value |
|---|---|---|
vendor |
meta.vendor |
checkpoint |
product |
meta.product |
url-filtering |
service |
meta.service.name |
CP-GW |
You can use the labels as:
- Filter labels on the Analytics page,
- in the Filter By Label field during log tapping.
You can use the message fields
- in Flow Processing steps, for example, in the Query field of Select Messages steps,
- in AQL expressions in the search bars.
Sending data to Splunk
When sending the data collected from this source to Splunk, Axoflow uses the following sourcetype and index settings:
| sourcetype | source | index |
|---|---|---|
cp_log |
checkpoint:firewall |
netfw |
Sending data to Google SecOps
When sending the data collected from this source to a dynamic Google SecOps destination, Axoflow sets the following log type: CHECKPOINT_FIREWALL.
9.5.26 - Web API
Web API: Provides programmatic access to Check Point security management through RESTful API endpoints.
To onboard such a source to Axoflow, complete the generic appliance onboarding steps.
Labels
Axoflow automatically adds the following labels to data collected from this source:
| Analytics label | Message field | value |
|---|---|---|
vendor |
meta.vendor |
checkpoint |
product |
meta.product |
web-api |
You can use the labels as:
- Filter labels on the Analytics page,
- in the Filter By Label field during log tapping.
You can use the message fields
- in Flow Processing steps, for example, in the Query field of Select Messages steps,
- in AQL expressions in the search bars.
Sending data to Splunk
When sending the data collected from this source to Splunk, Axoflow uses the following sourcetype and index settings:
| sourcetype | source | index |
|---|---|---|
cp_log |
checkpoint:audit |
netops |
9.6 - Cisco
9.6.1 - Access Control System (ACS)
Access Control System (ACS): Centralizes network access control with RADIUS and TACACS+ for authentication and authorization.
To onboard such a source to Axoflow, complete the generic appliance onboarding steps.
Labels
Axoflow automatically adds the following labels to data collected from this source:
| Analytics label | Message field | value |
|---|---|---|
vendor |
meta.vendor |
cisco |
product |
meta.product |
acs |
service |
meta.service.name |
CSCOacs_Single_Authentications, CSCOacs_Multi_Authentications |
You can use the labels as:
- Filter labels on the Analytics page,
- in the Filter By Label field during log tapping.
You can use the message fields
- in Flow Processing steps, for example, in the Query field of Select Messages steps,
- in AQL expressions in the search bars.
Sending data to Splunk
When sending the data collected from this source to Splunk, Axoflow uses the following sourcetype and index settings:
| sourcetype | index |
|---|---|
cisco:acs |
netauth |
Sending data to Google SecOps
When sending the data collected from this source to a dynamic Google SecOps destination, Axoflow sets the following log type: CISCO_ACS.
9.6.2 - Adaptive Security Appliance (ASA)
Adaptive Security Appliance (ASA): Provides stateful firewall, VPN support, and advanced threat protection for secure network perimeters.
To onboard such a source to Axoflow, complete the generic appliance onboarding steps.
Labels
Axoflow automatically adds the following labels to data collected from this source:
| Analytics label | Message field | value |
|---|---|---|
vendor |
meta.vendor |
cisco |
product |
meta.product |
asa |
You can use the labels as:
- Filter labels on the Analytics page,
- in the Filter By Label field during log tapping.
You can use the message fields
- in Flow Processing steps, for example, in the Query field of Select Messages steps,
- in AQL expressions in the search bars.
Sending data to Splunk
When sending the data collected from this source to Splunk, Axoflow uses the following sourcetype and index settings:
| sourcetype | index |
|---|---|
cisco:asa |
netfw |
Sending data to Google SecOps
When sending the data collected from this source to a dynamic Google SecOps destination, Axoflow sets the following log type: CISCO_ASA_FIREWALL.
9.6.3 - Application Control Engine (ACE)
Application Control Engine (ACE): Provides application-aware load balancing, SSL offload, and traffic control for Cisco networks.
To onboard such a source to Axoflow, complete the generic appliance onboarding steps.
Labels
Axoflow automatically adds the following labels to data collected from this source:
| Analytics label | Message field | value |
|---|---|---|
vendor |
meta.vendor |
cisco |
product |
meta.product |
ace |
You can use the labels as:
- Filter labels on the Analytics page,
- in the Filter By Label field during log tapping.
You can use the message fields
- in Flow Processing steps, for example, in the Query field of Select Messages steps,
- in AQL expressions in the search bars.
Sending data to Splunk
When sending the data collected from this source to Splunk, Axoflow uses the following sourcetype and index settings:
| sourcetype | index |
|---|---|
cisco:ace |
netops |
Sending data to Google SecOps
When sending the data collected from this source to a dynamic Google SecOps destination, Axoflow sets the following log type: CISCO_ACE.
9.6.4 - Cisco IOS
Cisco IOS: Network operating system for Cisco routers and switches, enabling routing, switching, and security.
To onboard such a source to Axoflow, complete the generic appliance onboarding steps.
Labels
Axoflow automatically adds the following labels to data collected from this source:
| Analytics label | Message field | value |
|---|---|---|
vendor |
meta.vendor |
cisco |
product |
meta.product |
ios |
You can use the labels as:
- Filter labels on the Analytics page,
- in the Filter By Label field during log tapping.
You can use the message fields
- in Flow Processing steps, for example, in the Query field of Select Messages steps,
- in AQL expressions in the search bars.
Sending data to Splunk
When sending the data collected from this source to Splunk, Axoflow uses the following sourcetype and index settings:
| sourcetype | index |
|---|---|
cisco:ios |
netops |
Sending data to Google SecOps
When sending the data collected from this source to a dynamic Google SecOps destination, Axoflow sets the following log type: CISCO_IOS.
9.6.5 - Digital Network Architecture (DNA)
Digital Network Architecture (DNA): Provides software-defined networking, policy automation, and analytics for enterprise infrastructure.
To onboard such a source to Axoflow, complete the generic appliance onboarding steps.
Labels
Axoflow automatically adds the following labels to data collected from this source:
| Analytics label | Message field | value |
|---|---|---|
vendor |
meta.vendor |
cisco |
product |
meta.product |
dna |
service |
meta.service.name |
DNAC |
You can use the labels as:
- Filter labels on the Analytics page,
- in the Filter By Label field during log tapping.
You can use the message fields
- in Flow Processing steps, for example, in the Query field of Select Messages steps,
- in AQL expressions in the search bars.
Sending data to Splunk
When sending the data collected from this source to Splunk, Axoflow uses the following sourcetype and index settings:
| sourcetype | index |
|---|---|
cisco:dna |
netops |
Sending data to Google SecOps
When sending the data collected from this source to a dynamic Google SecOps destination, Axoflow sets the following log type: CISCO_DNAC.
9.6.6 - Email Security Appliance (ESA)
Email Security Appliance (ESA): Protects email systems from spam, phishing, malware, and data loss with advanced threat filtering.
To onboard such a source to Axoflow, complete the generic appliance onboarding steps.
Note that the device can be configured to send plain-text syslog or CEF-formatted logs. AxoRouter can automatically parse all flavors.
Labels
Axoflow automatically adds the following labels to data collected from this source:
| label | value |
|---|---|
vendor |
meta.vendor |
product |
meta.product |
service |
meta.service.name |
You can use the labels as:
- Filter labels on the Analytics page,
- in the Filter By Label field during log tapping.
You can use the message fields
- in Flow Processing steps, for example, in the Query field of Select Messages steps,
- in AQL expressions in the search bars.
Sending data to Splunk
When sending the data collected from this source to Splunk, Axoflow uses the following sourcetype, index, and source settings:
| sourcetype | index | source |
|---|---|---|
| cisco:esa:http | esa:http | |
| cisco:esa:textmail | esa:textmail | |
| cisco:esa:amp | esa:amp | |
| cisco:esa:antispam | esa:antispam | |
| cisco:esa:system_logs | esa:system_logs | |
| cisco:esa:system_logs | esa:euq_logs | |
| cisco:esa:system_logs | esa:service_logs | |
| cisco:esa:system_logs | esa:reportd_logs | |
| cisco:esa:system_logs | esa:sntpd_logs | |
| cisco:esa:system_logs | esa:smartlicense | |
| cisco:esa:error_logs | esa:error_logs | |
| cisco:esa:error_logs | esa:updater_logs | |
| cisco:esa:content_scanner | esa:content_scanner | |
| cisco:esa:authentication | esa:authentication | |
| cisco:esa:http | esa:http | |
| cisco:esa:textmail | esa:textmail | |
| cisco:esa:amp | esa:amp | |
| cisco:esa | program: <variable> | |
| cisco:esa:cef | esa:consolidated |
Tested with: Splunk Add-on for Cisco ESA
Sending data to Google SecOps
When sending the data collected from this source to a dynamic Google SecOps destination, Axoflow sets the following log type: CISCO_EMAIL_SECURITY.
9.6.7 - Firepower
Firepower: Provides next-gen firewall features including intrusion prevention, app control, and malware protection.
To onboard such a source to Axoflow, complete the generic appliance onboarding steps.
Labels
Axoflow automatically adds the following labels to data collected from this source:
| Analytics label | Message field | value |
|---|---|---|
vendor |
meta.vendor |
cisco |
product |
meta.product |
firepower |
service |
meta.service.name |
SFIMS |
You can use the labels as:
- Filter labels on the Analytics page,
- in the Filter By Label field during log tapping.
You can use the message fields
- in Flow Processing steps, for example, in the Query field of Select Messages steps,
- in AQL expressions in the search bars.
Sending data to Splunk
When sending the data collected from this source to Splunk, Axoflow uses the following sourcetype and index settings:
| sourcetype | index |
|---|---|
cisco:firepower:syslog |
netids |
Sending data to Google SecOps
When sending the data collected from this source to a dynamic Google SecOps destination, Axoflow sets the following log type: CISCO_FIREPOWER_FIREWALL.
9.6.8 - Firepower Threat Defence (FTD)
Firepower Threat Defence (FTD): Unifies firewall, VPN, and intrusion prevention into a single software for comprehensive threat defense.
To onboard such a source to Axoflow, complete the generic appliance onboarding steps.
Labels
Axoflow automatically adds the following labels to data collected from this source:
| Analytics label | Message field | value |
|---|---|---|
vendor |
meta.vendor |
cisco |
product |
meta.product |
ftd |
You can use the labels as:
- Filter labels on the Analytics page,
- in the Filter By Label field during log tapping.
You can use the message fields
- in Flow Processing steps, for example, in the Query field of Select Messages steps,
- in AQL expressions in the search bars.
Sending data to Splunk
When sending the data collected from this source to Splunk, Axoflow uses the following sourcetype and index settings:
| sourcetype | index |
|---|---|
cisco:ftd |
netfw |
9.6.9 - Firewall Services Module (FWSM)
Firewall Services Module (FWSM): Delivers multi-context, high-performance firewall services integrated into Cisco Catalyst switches.
To onboard such a source to Axoflow, complete the generic appliance onboarding steps.
Labels
Axoflow automatically adds the following labels to data collected from this source:
| Analytics label | Message field | value |
|---|---|---|
vendor |
meta.vendor |
cisco |
product |
meta.product |
fwsm |
You can use the labels as:
- Filter labels on the Analytics page,
- in the Filter By Label field during log tapping.
You can use the message fields
- in Flow Processing steps, for example, in the Query field of Select Messages steps,
- in AQL expressions in the search bars.
Sending data to Splunk
When sending the data collected from this source to Splunk, Axoflow uses the following sourcetype and index settings:
| sourcetype | index |
|---|---|
cisco:fwsm |
netfw |
Sending data to Google SecOps
When sending the data collected from this source to a dynamic Google SecOps destination, Axoflow sets the following log type: CISCO_FWSM.
9.6.10 - HyperFlex (HX, UCSH)
HyperFlex (HX, UCSH): Infrastructure solution combining compute, storage, and networking in a single system.
To onboard such a source to Axoflow, complete the generic appliance onboarding steps.
Labels
Axoflow automatically adds the following labels to data collected from this source:
| Analytics label | Message field | value |
|---|---|---|
vendor |
meta.vendor |
cisco |
product |
meta.product |
ucsh |
service |
meta.service.name |
hx-audit-rest, hx-device-connector, hx-ssl-access |
You can use the labels as:
- Filter labels on the Analytics page,
- in the Filter By Label field during log tapping.
You can use the message fields
- in Flow Processing steps, for example, in the Query field of Select Messages steps,
- in AQL expressions in the search bars.
Sending data to Splunk
When sending the data collected from this source to Splunk, Axoflow uses the following sourcetype and index settings:
| sourcetype | index |
|---|---|
cisco:ucsh:hx |
infraops |
Sending data to Google SecOps
When sending the data collected from this source to a dynamic Google SecOps destination, Axoflow sets the following log type: CISCO_UCS.
9.6.11 - Identity Services Engine (ISE)
Identity Services Engine (ISE): Manages network access control and enforces policies with user and device authentication capabilities.
To onboard such a source to Axoflow, complete the generic appliance onboarding steps.
For details on configuring your Identity Services Engine to forward its logs to an AxoRouter instance, see Configure Remote Syslog Collection Locations in Cisco Identity Services Engine (ISE) Administrator Guide.
Labels
Axoflow automatically adds the following labels to data collected from this source:
| Analytics label | Message field | value |
|---|---|---|
vendor |
meta.vendor |
cisco |
product |
meta.product |
ise |
service |
meta.service.name |
CISE_Alarm, CISE_Passed_Authentications, CISE_RADIUS_Accounting, CISE_System_Statistics |
You can use the labels as:
- Filter labels on the Analytics page,
- in the Filter By Label field during log tapping.
You can use the message fields
- in Flow Processing steps, for example, in the Query field of Select Messages steps,
- in AQL expressions in the search bars.
Sending data to Splunk
When sending the data collected from this source to Splunk, Axoflow uses the following sourcetype and index settings:
| sourcetype | index |
|---|---|
cisco:ise:syslog |
netauth |
Sending data to Google SecOps
When sending the data collected from this source to a dynamic Google SecOps destination, Axoflow sets the following log type: CISCO_ISE.
9.6.12 - Integrated Management Controller (IMC)
Integrated Management Controller (IMC): Provides out-of-band server management for Cisco UCS, enabling hardware monitoring and configuration.
To onboard such a source to Axoflow, complete the generic appliance onboarding steps.
Labels
Axoflow automatically adds the following labels to data collected from this source:
| Analytics label | Message field | value |
|---|---|---|
vendor |
meta.vendor |
cisco |
product |
meta.product |
cimc |
You can use the labels as:
- Filter labels on the Analytics page,
- in the Filter By Label field during log tapping.
You can use the message fields
- in Flow Processing steps, for example, in the Query field of Select Messages steps,
- in AQL expressions in the search bars.
Sending data to Splunk
When sending the data collected from this source to Splunk, Axoflow uses the following sourcetype and index settings:
| sourcetype | index |
|---|---|
cisco:cimc |
infraops |
9.6.13 - IOS XR
IOS XR: High-performance, modular network operating system for carrier-grade routing and scalability.
To onboard such a source to Axoflow, complete the generic appliance onboarding steps.
Labels
Axoflow automatically adds the following labels to data collected from this source:
| Analytics label | Message field | value |
|---|---|---|
vendor |
meta.vendor |
cisco |
product |
meta.product |
xr |
service |
meta.service.name |
config, nfsvr, plat_sl_client, ssh_syslog_proxy |
You can use the labels as:
- Filter labels on the Analytics page,
- in the Filter By Label field during log tapping.
You can use the message fields
- in Flow Processing steps, for example, in the Query field of Select Messages steps,
- in AQL expressions in the search bars.
Sending data to Splunk
When sending the data collected from this source to Splunk, Axoflow uses the following sourcetype and index settings:
| sourcetype | index |
|---|---|
cisco:xr |
netops |
9.6.14 - Meraki MX
Meraki MX: Cloud-managed network appliance offering firewall, VPN, SD-WAN, and security in a single platform.
To onboard such a source to Axoflow, complete the generic appliance onboarding steps.
Labels
Axoflow automatically adds the following labels to data collected from this source:
| Analytics label | Message field | value |
|---|---|---|
vendor |
meta.vendor |
cisco |
product |
meta.product |
meraki |
You can use the labels as:
- Filter labels on the Analytics page,
- in the Filter By Label field during log tapping.
You can use the message fields
- in Flow Processing steps, for example, in the Query field of Select Messages steps,
- in AQL expressions in the search bars.
Sending data to Splunk
When sending the data collected from this source to Splunk, Axoflow uses the following sourcetype and index settings:
| sourcetype | index |
|---|---|
cisco:meraki |
netfw |
Tested with: TA-meraki
Sending data to Google SecOps
When sending the data collected from this source to a dynamic Google SecOps destination, Axoflow sets the following log type: CISCO_MERAKI.
9.6.15 - Private Internet eXchange (PIX)
Private Internet eXchange (PIX): Legacy firewall appliance delivering stateful inspection and secure network access control.
To onboard such a source to Axoflow, complete the generic appliance onboarding steps.
Labels
Axoflow automatically adds the following labels to data collected from this source:
| Analytics label | Message field | value |
|---|---|---|
vendor |
meta.vendor |
cisco |
product |
meta.product |
pix |
You can use the labels as:
- Filter labels on the Analytics page,
- in the Filter By Label field during log tapping.
You can use the message fields
- in Flow Processing steps, for example, in the Query field of Select Messages steps,
- in AQL expressions in the search bars.
Sending data to Splunk
When sending the data collected from this source to Splunk, Axoflow uses the following sourcetype and index settings:
| sourcetype | index |
|---|---|
cisco:pix |
netfw |
Sending data to Google SecOps
When sending the data collected from this source to a dynamic Google SecOps destination, Axoflow sets the following log type: CISCO_PIX_FIREWALL.
9.6.16 - TelePresence Video Communication Server (VCS)
TelePresence Video Communication Server (VCS): Enables video conferencing control and call routing for Cisco TelePresence systems and endpoints.
To onboard such a source to Axoflow, complete the generic appliance onboarding steps.
Labels
Axoflow automatically adds the following labels to data collected from this source:
| Analytics label | Message field | value |
|---|---|---|
vendor |
meta.vendor |
cisco |
product |
meta.product |
tvcs |
service |
meta.service.name |
tvcs |
You can use the labels as:
- Filter labels on the Analytics page,
- in the Filter By Label field during log tapping.
You can use the message fields
- in Flow Processing steps, for example, in the Query field of Select Messages steps,
- in AQL expressions in the search bars.
Sending data to Splunk
When sending the data collected from this source to Splunk, Axoflow uses the following sourcetype and index settings:
| sourcetype | index |
|---|---|
cisco:tvcs |
main |
9.6.17 - Unified Computing System Manager (UCSM)
Unified Computing System Manager (UCSM): Centralized management platform for Cisco Unified Computing System (UCS) servers and resources.
To onboard such a source to Axoflow, complete the generic appliance onboarding steps.
Labels
Axoflow automatically adds the following labels to data collected from this source:
| Analytics label | Message field | value |
|---|---|---|
vendor |
meta.vendor |
cisco |
product |
meta.product |
ucsm |
You can use the labels as:
- Filter labels on the Analytics page,
- in the Filter By Label field during log tapping.
You can use the message fields
- in Flow Processing steps, for example, in the Query field of Select Messages steps,
- in AQL expressions in the search bars.
Sending data to Splunk
When sending the data collected from this source to Splunk, Axoflow uses the following sourcetype and index settings:
| sourcetype | index |
|---|---|
cisco:ucs |
infraops |
Sending data to Google SecOps
When sending the data collected from this source to a dynamic Google SecOps destination, Axoflow sets the following log type: CISCO_UCS.
9.6.18 - Unified Communications Manager (UCM)
Unified Communications Manager (UCM): Delivers unified voice, video, messaging, and mobility services in enterprise IP telephony systems.
To onboard such a source to Axoflow, complete the generic appliance onboarding steps.
Labels
Axoflow automatically adds the following labels to data collected from this source:
| Analytics label | Message field | value |
|---|---|---|
vendor |
meta.vendor |
cisco |
product |
meta.product |
ucm |
You can use the labels as:
- Filter labels on the Analytics page,
- in the Filter By Label field during log tapping.
You can use the message fields
- in Flow Processing steps, for example, in the Query field of Select Messages steps,
- in AQL expressions in the search bars.
Sending data to Splunk
When sending the data collected from this source to Splunk, Axoflow uses the following sourcetype and index settings:
| sourcetype | index |
|---|---|
cisco:ucm |
netops |
Sending data to Google SecOps
When sending the data collected from this source to a dynamic Google SecOps destination, Axoflow sets the following log type: CISCO_UCM.
9.6.19 - Viptela
Viptela: Software-defined WAN solution providing secure connectivity, centralized control, and traffic optimization.
To onboard such a source to Axoflow, complete the generic appliance onboarding steps.
Labels
Axoflow automatically adds the following labels to data collected from this source:
| Analytics label | Message field | value |
|---|---|---|
vendor |
meta.vendor |
cisco |
product |
meta.product |
viptela |
service |
meta.service.name |
SYSMGR |
You can use the labels as:
- Filter labels on the Analytics page,
- in the Filter By Label field during log tapping.
You can use the message fields
- in Flow Processing steps, for example, in the Query field of Select Messages steps,
- in AQL expressions in the search bars.
Sending data to Splunk
When sending the data collected from this source to Splunk, Axoflow uses the following sourcetype and index settings:
| sourcetype | index |
|---|---|
cisco:viptela |
netops |
Sending data to Google SecOps
When sending the data collected from this source to a dynamic Google SecOps destination, Axoflow sets the following log type: CISCO_VIPTELA.
9.7 - Citrix
9.7.1 - Netscaler
Netscaler: Offers application delivery, load balancing, and security features for optimized app performance.
To onboard such a source to Axoflow, complete the generic appliance onboarding steps.
Labels
Axoflow automatically adds the following labels to data collected from this source:
| Analytics label | Message field | value |
|---|---|---|
vendor |
meta.vendor |
citrix |
product |
meta.product |
netscaler |
service |
meta.service.name |
svm_service |
You can use the labels as:
- Filter labels on the Analytics page,
- in the Filter By Label field during log tapping.
You can use the message fields
- in Flow Processing steps, for example, in the Query field of Select Messages steps,
- in AQL expressions in the search bars.
Sending data to Splunk
When sending the data collected from this source to Splunk, Axoflow uses the following sourcetype and index settings:
| sourcetype | index |
|---|---|
citrix:netscaler:appfw:cef |
netfw |
citrix:netscaler:syslog |
netfw |
citrix:netscaler:appfw |
netfw |
Sending data to Google SecOps
When sending the data collected from this source to a dynamic Google SecOps destination, Axoflow sets the following log type: CITRIX_NETSCALER_WEB_LOGS.
9.8 - Corelight
9.8.1 - Open Network Detection & Response (NDR)
Open Network Detection & Response (NDR): Provides network detection and response by analyzing traffic for advanced threats and anomalous behavior.
To onboard such a source to Axoflow, complete the generic appliance onboarding steps.
Labels
Axoflow automatically adds the following labels to data collected from this source:
| Analytics label | Message field | value |
|---|---|---|
vendor |
meta.vendor |
corelight |
product |
meta.product |
ndr-platform |
You can use the labels as:
- Filter labels on the Analytics page,
- in the Filter By Label field during log tapping.
You can use the message fields
- in Flow Processing steps, for example, in the Query field of Select Messages steps,
- in AQL expressions in the search bars.
Sending data to Splunk
When sending the data collected from this source to Splunk, Axoflow uses the following sourcetype, source, and index settings:
| sourcetype | index |
|---|---|
corelight_alerts |
main |
corelight_conn |
main |
corelight_corelight |
main |
corelight_corelight_metrics_bro |
main |
corelight_corelight_metrics_iface |
main |
corelight_dhcp |
main |
corelight_dpd |
main |
corelight_etc_viz |
main |
corelight_evt_all |
main |
corelight_evt_http |
main |
corelight_evt_suri |
main |
corelight_files |
main |
corelight_ftp |
main |
corelight_http |
main |
corelight_http_red |
main |
corelight_idx |
main |
corelight_irc |
main |
corelight_kerberos |
main |
corelight_metrics_bro |
main |
corelight_metrics_iface |
main |
corelight_rdp |
main |
corelight_smb |
main |
corelight_smb_files |
main |
corelight_socks |
main |
corelight_ssh |
main |
corelight_ssh_red |
main |
corelight_ssl |
main |
corelight_st_base |
main |
corelight_suri |
main |
corelight_suricata_corelight |
main |
corelight_x509 |
main |
Sending data to Google SecOps
When sending the data collected from this source to a dynamic Google SecOps destination, Axoflow sets the following log type: CORELIGHT.
9.9 - CyberArk
9.9.1 - Privileged Threat Analytics (PTA)
Privileged Threat Analytics (PTA): Analyzes privileged account behavior to detect threats and suspicious activity in real time.
To onboard such a source to Axoflow, complete the generic appliance onboarding steps.
Labels
Axoflow automatically adds the following labels to data collected from this source:
| Analytics label | Message field | value |
|---|---|---|
vendor |
meta.vendor |
cyberark |
product |
meta.product |
pta |
You can use the labels as:
- Filter labels on the Analytics page,
- in the Filter By Label field during log tapping.
You can use the message fields
- in Flow Processing steps, for example, in the Query field of Select Messages steps,
- in AQL expressions in the search bars.
Sending data to Splunk
When sending the data collected from this source to Splunk, Axoflow uses the following sourcetype and index settings:
| sourcetype | index |
|---|---|
cyberark:pta:cef |
main |
Sending data to Google SecOps
When sending the data collected from this source to a dynamic Google SecOps destination, Axoflow sets the following log type: CYBERARK_PTA.
9.9.2 - Vault
Vault: Stores and manages privileged credentials, session recordings, and access control policies securely.
To onboard such a source to Axoflow, complete the generic appliance onboarding steps.
Labels
Axoflow automatically adds the following labels to data collected from this source:
| Analytics label | Message field | value |
|---|---|---|
vendor |
meta.vendor |
cyberark |
product |
meta.product |
vault |
You can use the labels as:
- Filter labels on the Analytics page,
- in the Filter By Label field during log tapping.
You can use the message fields
- in Flow Processing steps, for example, in the Query field of Select Messages steps,
- in AQL expressions in the search bars.
Sending data to Splunk
When sending the data collected from this source to Splunk, Axoflow uses the following sourcetype and index settings:
| sourcetype | index |
|---|---|
cyberark:epv:cef |
netauth |
Sending data to Google SecOps
When sending the data collected from this source to a dynamic Google SecOps destination, Axoflow sets the following log type: CYBERARK.
9.10 - F5 Networks
9.10.1 - BIG-IP
BIG-IP: Provides load balancing, traffic management, and application security for optimized service delivery.
To onboard such a source to Axoflow, complete the generic appliance onboarding steps.
Note that the device can be configured to send logs formatted as plain-text syslog, JSON, or key-value pairs. AxoRouter can automatically parse all flavors.
Labels
Axoflow automatically adds the following labels to data collected from this source:
| Analytics label | Message field | value |
|---|---|---|
vendor |
meta.vendor |
f5 |
product |
meta.product |
bigip |
service |
meta.service.name |
ASM, apmd, audit_forwarder, CROND, F5, httpd, mcpd, sshd, sshd(pam_audit), systemd-journal, tmm, tmm1, tmm2, tmsh |
You can use the labels as:
- Filter labels on the Analytics page,
- in the Filter By Label field during log tapping.
You can use the message fields
- in Flow Processing steps, for example, in the Query field of Select Messages steps,
- in AQL expressions in the search bars.
Sending data to Splunk
When sending the data collected from this source to Splunk, Axoflow uses the following sourcetype and index settings:
| sourcetype | index |
|---|---|
| f5:bigip:syslog | netops |
| f5:bigip:ltm:access_json | netops |
| f5:bigip:asm:syslog | netops |
| f5:bigip:apm:syslog | netops |
| f5:bigip:ltm:ssl:error | netops |
| f5:bigip:ltm:tcl:error | netops |
| f5:bigip:ltm:traffic | netops |
| f5:bigip:ltm:log:error | netops |
| f5:bigip:gtm:dns:request:irule | netops |
| f5:bigip:gtm:dns:response:irule | netops |
| f5:bigip:ltm:http:irule | netops |
| f5:bigip:ltm:failed:irule | netops |
| nix:syslog | netops |
Tested with: Splunk Add-on for F5 BIG-IP
Sending data to Google SecOps
When sending the data collected from this source to a dynamic Google SecOps destination, Axoflow sets the following log type: F5_BIGIP_APM.
9.11 - FireEye
9.12 - Forcepoint
9.12.1 - Email Security
Email Security: Protects email systems from spam, phishing, malware, and data exfiltration using advanced threat defense.
To onboard such a source to Axoflow, complete the generic appliance onboarding steps.
Labels
Axoflow automatically adds the following labels to data collected from this source:
| Analytics label | Message field | value |
|---|---|---|
vendor |
meta.vendor |
forcepoint |
product |
meta.product |
email |
You can use the labels as:
- Filter labels on the Analytics page,
- in the Filter By Label field during log tapping.
You can use the message fields
- in Flow Processing steps, for example, in the Query field of Select Messages steps,
- in AQL expressions in the search bars.
Sending data to Splunk
When sending the data collected from this source to Splunk, Axoflow uses the following sourcetype, source, and index settings:
| sourcetype | index |
|---|---|
forcepoint:email:cef |
email |
forcepoint:email:kv |
email |
forcepoint:email:leef |
email |
Sending data to Google SecOps
When sending the data collected from this source to a dynamic Google SecOps destination, Axoflow sets the following log type: FORCEPOINT_EMAILSECURITY.
Earlier name/vendor
- Websense Email Security
9.12.2 - Next-Generation Firewall (NGFW)
Next-Generation Firewall (NGFW): Next-gen firewall with deep packet inspection, policy enforcement, and integrated intrusion prevention.
To onboard such a source to Axoflow, complete the generic appliance onboarding steps.
Labels
Axoflow automatically adds the following labels to data collected from this source:
| Analytics label | Message field | value |
|---|---|---|
vendor |
meta.vendor |
forcepoint |
product |
meta.product |
firewall |
You can use the labels as:
- Filter labels on the Analytics page,
- in the Filter By Label field during log tapping.
You can use the message fields
- in Flow Processing steps, for example, in the Query field of Select Messages steps,
- in AQL expressions in the search bars.
Sending data to Splunk
When sending the data collected from this source to Splunk, Axoflow uses the following sourcetype, source, and index settings:
| sourcetype | index |
|---|---|
websense:cg:cef |
netproxy |
Sending data to Google SecOps
When sending the data collected from this source to a dynamic Google SecOps destination, Axoflow sets the following log type: FORCEPOINT_FIREWALL.
Earlier name/vendor
- Websense Webprotect
- Forcepoint Webprotect
- Forcepoint Secure Web Gateway
9.12.3 - WebProtect
WebProtect: Provides web traffic filtering, malware protection, and data loss prevention for secure internet access.
To onboard such a source to Axoflow, complete the generic appliance onboarding steps.
Labels
Axoflow automatically adds the following labels to data collected from this source:
| Analytics label | Message field | value |
|---|---|---|
vendor |
meta.vendor |
forcepoint |
product |
meta.product |
webprotect |
You can use the labels as:
- Filter labels on the Analytics page,
- in the Filter By Label field during log tapping.
You can use the message fields
- in Flow Processing steps, for example, in the Query field of Select Messages steps,
- in AQL expressions in the search bars.
Sending data to Splunk
When sending the data collected from this source to Splunk, Axoflow uses the following sourcetype, source, and index settings:
| sourcetype | index |
|---|---|
websense:cg:cef |
netproxy |
websense:cg:kv |
netproxy |
websense:cg:leef |
netproxy |
Earlier name/vendor
- Websense Firewall
9.13 - Fortinet
9.13.1 - FortiGate firewalls
FortiGate firewalls: Enterprise firewall platform offering threat protection, VPN, and traffic filtering for secure networking.
The following sections show you how to configure FortiGate Next-Generation Firewall (NGFW) to send their log data to Axoflow.
CAUTION:
Make sure to set data forwarding on your appliances/servers as described in this guide. Different settings like alternate message formats or ports might be valid, but can result in data loss or incorrect parsing.Prerequisites
- You have administrative access to the firewall.
- The date, time, and time zone are correctly set on the firewall.
- You have an AxoRouter deployed and configured with a Syslog connector that has parsing and classification enabled (by default, every AxoRouter has such connectors). This device is going to receive the data from the firewall.
-
You know the IP address the AxoRouter. To find it:
- Open the AxoConsole.
- Select the Routers or the Topology page.
- Select on AxoRouter instance that is going to receive the logs.
- Check the Networks > Address field.
Steps
Note: The steps involving the FortiGate user interface are just for your convenience, for details, see the official FortiGate documentation.
-
Log in to your FortiGate device. You need administrator privileges to perform the configuration.
-
Register the address of your AxoRouter as an Address Object.
-
Select Log & Report > Log Settings > Global Settings.
-
Configure the following settings:
- Event Logging: Click All.
- Local traffic logging: Click All.
- Syslog logging: Enable this option.
- IP address/FQDN: Enter the address of your AxoRouter:
%axorouter-ip%
-
Click Apply.
-
-
Add the source to AxoConsole.
-
Open the AxoConsole and select Topology.
-
Select Add Item > Source.
-
If the source is actively sending data to an AxoRouter instance, select Detected, then select your source.
-
Otherwise, select the vendor and product corresponding to your source from the Predefined sources, then enter the parameters of the source, like IP address and FQDN.
Note During log tapping, you can add hosts that are actively sending data to an AxoRouter instance by clicking Register source. -
-
(Optional) Add custom labels as needed.
-
Select Add.
-
Labels
Axoflow automatically adds the following labels to data collected from this source:
| Analytics label | Message field | value |
|---|---|---|
vendor |
meta.vendor |
fortinet |
product |
meta.product |
fortigate |
service |
meta.service.name |
fortigate |
You can use the labels as:
- Filter labels on the Analytics page,
- in the Filter By Label field during log tapping.
You can use the message fields
- in Flow Processing steps, for example, in the Query field of Select Messages steps,
- in AQL expressions in the search bars.
Sending data to Splunk
When sending the data collected from this source to Splunk, Axoflow uses the following sourcetype and index settings:
| sourcetype | index |
|---|---|
fortigate_event |
netops |
fortigate_traffic |
netfw |
fortigate_utm |
netfw |
Tested with: Fortinet FortiGate Add-On for Splunk technical add-on
Sending data to Google SecOps
When sending the data collected from this source to a dynamic Google SecOps destination, Axoflow sets the following log type: FORTINET_FIREWALL.
9.13.2 - FortiMail
FortiMail: Secures inbound and outbound email with spam filtering, malware protection, and advanced threat detection.
To onboard such a source to Axoflow, complete the generic appliance onboarding steps.
Labels
Axoflow automatically adds the following labels to data collected from this source:
| Analytics label | Message field | value |
|---|---|---|
vendor |
meta.vendor |
fortinet |
product |
meta.product |
fortimail |
service |
meta.service.name |
fortiweb |
You can use the labels as:
- Filter labels on the Analytics page,
- in the Filter By Label field during log tapping.
You can use the message fields
- in Flow Processing steps, for example, in the Query field of Select Messages steps,
- in AQL expressions in the search bars.
Sending data to Splunk
When sending the data collected from this source to Splunk, Axoflow uses the following sourcetype and index settings:
| sourcetype | index |
|---|---|
fml:log |
email |
Tested with: FortiMail Add-on for Splunk technical add-on
Sending data to Google SecOps
When sending the data collected from this source to a dynamic Google SecOps destination, Axoflow sets the following log type: FORTINET_FORTIMAIL.
9.13.3 - FortiProxy
FortiProxy: Protects from internet threats like malware, phishing, and data loss by inspecting web traffic, filtering content, controlling applications, and enforcing security policies
To send logs from FortiProxy to AxoRouter, configure remote logging to a syslog server on FortiProxy. Use the IP address of AxoRouter as the syslog server IP address. Set FortiProxy to send logs in the default format. (If you need to send the logs in CEF format, contact our support team). For details, see Generic tips.
Labels
Axoflow automatically adds the following labels to data collected from this source:
| Analytics label | Message field | value |
|---|---|---|
vendor |
meta.vendor |
fortinet |
product |
meta.product |
fortiproxy |
service |
meta.service.name |
fortigate |
You can use the labels as:
- Filter labels on the Analytics page,
- in the Filter By Label field during log tapping.
You can use the message fields
- in Flow Processing steps, for example, in the Query field of Select Messages steps,
- in AQL expressions in the search bars.
Sending data to Splunk
When sending the data collected from this source to Splunk, Axoflow uses the following sourcetype and index settings:
| sourcetype | index |
|---|---|
fortiproxy_anomaly |
netfw |
fortiproxy_event |
netops |
fortiproxy_traffic |
netfw |
fortiproxy_utm |
netfw |
Sending data to Google SecOps
When sending the data collected from this source to a dynamic Google SecOps destination, Axoflow sets the following log type: FORTINET_WEBPROXY.
9.13.4 - FortiWeb
FortiWeb: Web application firewall protecting websites from attacks like XSS, SQL injection, and bot threats.
To onboard such a source to Axoflow, complete the generic appliance onboarding steps.
Labels
Axoflow automatically adds the following labels to data collected from this source:
| Analytics label | Message field | value |
|---|---|---|
vendor |
meta.vendor |
fortinet |
product |
meta.product |
fortiweb |
service |
meta.service.name |
fortiweb |
You can use the labels as:
- Filter labels on the Analytics page,
- in the Filter By Label field during log tapping.
You can use the message fields
- in Flow Processing steps, for example, in the Query field of Select Messages steps,
- in AQL expressions in the search bars.
Sending data to Splunk
When sending the data collected from this source to Splunk, Axoflow uses the following sourcetype and index settings:
| sourcetype | index |
|---|---|
fwb_log |
netops |
fwb_attack |
netids |
fwb_event |
netops |
fwb_traffic |
netfw |
Tested with: Fortinet FortiWeb Add-0n for Splunk technical add-on
Sending data to Google SecOps
When sending the data collected from this source to a dynamic Google SecOps destination, Axoflow sets the following log type: FORTINET_FORTIWEB.
9.14 - Fortra
9.14.1 - Powertech SIEM Agent for IBM i
Powertech SIEM Agent for IBM i: Monitors IBM i system activity and forwards security events for centralized analysis in SIEM platforms.
To onboard such a source to Axoflow, complete the generic appliance onboarding steps.
Note that the device can be configured to send logs formatted as CEF or LEEF. AxoRouter can automatically parse all flavors.
Labels
Axoflow automatically adds the following labels to data collected from this source:
| Analytics label | Message field | value |
|---|---|---|
vendor |
meta.vendor |
forta |
product |
meta.product |
powertech-siem-agent |
You can use the labels as:
- Filter labels on the Analytics page,
- in the Filter By Label field during log tapping.
You can use the message fields
- in Flow Processing steps, for example, in the Query field of Select Messages steps,
- in AQL expressions in the search bars.
Sending data to Splunk
When sending the data collected from this source to Splunk, Axoflow uses the following sourcetype, source, and index settings:
| sourcetype | source | index |
|---|---|---|
PowerTech:SIEMAgent:cef |
PowerTech:SIEMAgent |
netops |
PowerTech:SIEMAgent:leef |
PowerTech:SIEMAgent |
netops |
Sending data to Google SecOps
When sending the data collected from this source to a dynamic Google SecOps destination, Axoflow sets the following log type: FORTRA_POWERTECH_SIEM_AGENT.
Earlier name/vendor
Powertech Interact
9.15 - General Unix/Linux host
9.15.1 - Generic Linux services
Generic Linux services: A generic placeholder for program classifications
These classifications include non-vendor specific services and applications commonly found on Linux/Unix hosts.
To onboard such a source to Axoflow, complete the generic appliance onboarding steps.
Labels
Axoflow automatically adds the following labels to data collected from this source:
| Analytics label | Message field | value |
|---|---|---|
vendor |
meta.vendor |
nix |
product |
meta.product |
generic |
service |
meta.service.name |
bind, chronyd, cron, cupsd, dbus-daemon, dhcpd, dnsmasq, dnf, dockerd, NetworkManager, nginx, nxlog, rsyslogd, sshd, su, sudo, syslog-ng, or systemd |
You can use the labels as:
- Filter labels on the Analytics page,
- in the Filter By Label field during log tapping.
You can use the message fields
- in Flow Processing steps, for example, in the Query field of Select Messages steps,
- in AQL expressions in the search bars.
Sending data to Splunk
When sending the data collected from this source to Splunk, Axoflow uses the following sourcetype and index settings:
| source | sourcetype | index |
|---|---|---|
program:chron |
nix:syslog |
netops |
program:chronyd |
nix:syslog |
netops |
program:cupsd |
nix:syslog |
netops |
program:dbus-daemon |
nix:syslog |
netops |
program:dhcpd |
isc:dhcpd |
netipam |
program:dnf |
nix:syslog |
netops |
program:dockerd |
nix:syslog |
netops |
program:dnsmasq |
nix:syslog |
netdns |
program:named |
isc:bind:network |
netdns |
program:NetworkManager |
nix:syslog |
netops |
program:nxlog |
nix:syslog |
netops |
program:rsyslogd |
nix:syslog |
netops |
program:sshd |
nix:syslog |
netops |
program:su |
nix:syslog |
netauth |
program:sudo |
nix:syslog |
netauth |
program:syslog-ng |
nix:syslog |
netops |
program:systemd |
nix:syslog |
netops |
Tested with: Splunk Add-on for Infoblox
Sending data to Google SecOps
When sending the data collected from this source to a dynamic Google SecOps destination, Axoflow sets the following log type: BIND_DNS, ISC_DHCP, NIX_SYSTEM, or OPENSSH.
9.16 - Imperva
9.16.1 - Incapsula
Incapsula: Cloud-based WAF, DDoS protection, and bot mitigation service for securing web applications and APIs.
To onboard such a source to Axoflow, complete the generic appliance onboarding steps.
Labels
Axoflow automatically adds the following labels to data collected from this source:
| Analytics label | Message field | value |
|---|---|---|
vendor |
meta.vendor |
imperva |
product |
meta.product |
incapsula |
You can use the labels as:
- Filter labels on the Analytics page,
- in the Filter By Label field during log tapping.
You can use the message fields
- in Flow Processing steps, for example, in the Query field of Select Messages steps,
- in AQL expressions in the search bars.
Sending data to Splunk
When sending the data collected from this source to Splunk, Axoflow uses the following sourcetype, source, and index settings:
| sourcetype | source | index |
|---|---|---|
cef |
Imperva:Incapsula |
netwaf |
Sending data to Google SecOps
When sending the data collected from this source to a dynamic Google SecOps destination, Axoflow sets the following log type: IMPERVA_CEF.
9.16.2 - SecureSphere
SecureSphere: Provides on-prem web application, database, and file security with granular activity monitoring.
To onboard such a source to Axoflow, complete the generic appliance onboarding steps.
Labels
Axoflow automatically adds the following labels to data collected from this source:
| Analytics label | Message field | value |
|---|---|---|
vendor |
meta.vendor |
imperva |
product |
meta.product |
securesphere |
You can use the labels as:
- Filter labels on the Analytics page,
- in the Filter By Label field during log tapping.
You can use the message fields
- in Flow Processing steps, for example, in the Query field of Select Messages steps,
- in AQL expressions in the search bars.
Sending data to Splunk
When sending the data collected from this source to Splunk, Axoflow uses the following sourcetype, source, and index settings:
| sourcetype | index |
|---|---|
imperva:waf:firewall:cef |
netwaf |
imperva:waf:security:cef |
netwaf |
imperva:waf |
netwaf |
Sending data to Google SecOps
When sending the data collected from this source to a dynamic Google SecOps destination, Axoflow sets the following log type: IMPERVA_SECURESPHERE.
9.17 - Infoblox
9.17.1 - NIOS
NIOS: Delivers secure DNS, DHCP, and IPAM (DDI) services with centralized network control and automation.
To onboard such a source to Axoflow, complete the generic appliance onboarding steps.
Labels
Axoflow automatically adds the following labels to data collected from this source:
| Analytics label | Message field | value |
|---|---|---|
vendor |
meta.vendor |
infloblox |
product |
meta.product |
nios |
service |
meta.service.name |
named, threat-protect-log |
You can use the labels as:
- Filter labels on the Analytics page,
- in the Filter By Label field during log tapping.
You can use the message fields
- in Flow Processing steps, for example, in the Query field of Select Messages steps,
- in AQL expressions in the search bars.
Sending data to Splunk
When sending the data collected from this source to Splunk, Axoflow uses the following sourcetype and index settings:
| sourcetype | index | source |
|---|---|---|
infoblox:threatprotect |
netids |
Infoblox:NIOS |
infoblox:dns |
netids |
Infoblox:NIOS |
Tested with: Splunk Add-on for Infoblox
Sending data to Google SecOps
When sending the data collected from this source to a dynamic Google SecOps destination, Axoflow sets the following log type: INFOBLOX, INFOBLOX_DNS.
9.18 - Ivanti
9.18.1 - Connect secure
Connect secure: Provides dynamic IP address assignment and network configuration for DHCP-enabled devices.
To onboard such a source to Axoflow, complete the generic appliance onboarding steps.
Labels
Axoflow automatically adds the following labels to data collected from this source:
| Analytics label | Message field | value |
|---|---|---|
vendor |
meta.vendor |
ivanti |
product |
meta.product |
connect-secure |
service |
meta.service.name |
PulseSecure |
You can use the labels as:
- Filter labels on the Analytics page,
- in the Filter By Label field during log tapping.
You can use the message fields
- in Flow Processing steps, for example, in the Query field of Select Messages steps,
- in AQL expressions in the search bars.
Sending data to Splunk
When sending the data collected from this source to Splunk, Axoflow uses the following sourcetype, source, and index settings:
| sourcetype | source | index |
|---|---|---|
pulse:connectsecure |
netfw |
|
pulse:connectsecure:web |
netproxy |
Sending data to Google SecOps
When sending the data collected from this source to a dynamic Google SecOps destination, Axoflow sets the following log type: IVANTI_CONNECT_SECURE.
Earlier name/vendor
Pulse Connect Secure
9.19 - Juniper
9.19.1 - Junos OS
Junos OS: Junos OS is the network operating system for Juniper physical and virtual networking and security products.
To onboard such a source to Axoflow, complete the generic appliance onboarding steps.
Labels
Axoflow automatically adds the following labels to data collected from this source:
| Analytics label | Message field | value |
|---|---|---|
vendor |
meta.vendor |
juniper |
product |
meta.product |
junos |
service |
meta.service.name |
eswd, ifinfo, mcsnoopd, mgd, mib2d, rpd, RT_AAMW, RT_FLOW, RT_IDP, RT_SECINTEL, RT_UTM, tfeb0 |
You can use the labels as:
- Filter labels on the Analytics page,
- in the Filter By Label field during log tapping.
You can use the message fields
- in Flow Processing steps, for example, in the Query field of Select Messages steps,
- in AQL expressions in the search bars.
Sending data to Splunk
When sending the data collected from this source to Splunk, Axoflow uses the following sourcetype and index settings:
| sourcetype | index |
|---|---|
juniper:junos:aamw:structured |
netfw |
juniper:junos:firewall |
netfw |
juniper:junos:firewall |
netids |
juniper:junos:firewall:structured |
netfw |
juniper:junos:firewall:structured |
netids |
juniper:junos:idp |
netids |
juniper:junos:idp:structured |
netids |
juniper:legacy |
netops |
juniper:junos:secintel:structured |
netfw |
juniper:junos:snmp |
netops |
juniper:structured |
netops |
Tested with: Splunk Add-on for Juniper
Sending data to Google SecOps
When sending the data collected from this source to a dynamic Google SecOps destination, Axoflow sets the following log type: JUNIPER_JUNOS.
9.20 - Kaspersky
9.20.1 - Endpoint Security
Endpoint Security: Protects endpoints from malware, ransomware, and intrusions with antivirus, firewall, and threat detection.
To onboard such a source to Axoflow, complete the generic appliance onboarding steps.
Note that the device can be configured to send logs formatted as plain-text syslog, CEF, or LEEF. AxoRouter can automatically parse all flavors.
Labels
Axoflow automatically adds the following labels to data collected from this source:
| Analytics label | Message field | value |
|---|---|---|
vendor |
meta.vendor |
kaspersky |
product |
meta.product |
endpoint_security |
service |
meta.service.name |
`KES |
You can use the labels as:
- Filter labels on the Analytics page,
- in the Filter By Label field during log tapping.
You can use the message fields
- in Flow Processing steps, for example, in the Query field of Select Messages steps,
- in AQL expressions in the search bars.
Note that the device can be configured to send plain syslog text, LEEF, or CEF-formatted output.
Sending data to Splunk
When sending the data collected from this source to Splunk, Axoflow uses the following sourcetype and index settings:
| sourcetype | index |
|---|---|
kaspersky:cef |
epav |
kaspersky:es |
epav |
kaspersky:gnrl |
epav |
kaspersky:klau |
epav |
kaspersky:klbl |
epav |
kaspersky:klmo |
epav |
kaspersky:klna |
epav |
kaspersky:klpr |
epav |
kaspersky:klsr |
epav |
kaspersky:leef |
epav |
kaspersky:sysl |
epav |
Sending data to Google SecOps
When sending the data collected from this source to a dynamic Google SecOps destination, Axoflow sets the following log type: KASPERSKY_ENDPOINT.
9.21 - Kubernetes
9.21.1 - NGINX Ingress
NGINX Ingress: Ingress NGINX Controller
Configure your log collector (for example, Telemetry Controller) to send data to an OpenTelemetry Connector of an AxoRouter instance using the OTLP/gRPC protocol.
Labels
Axoflow automatically adds the following labels to data collected from this source:
| Analytics label | Message field | value |
|---|---|---|
vendor |
meta.vendor |
kubernetes |
product |
meta.product |
nginx |
service |
meta.service.name |
ingress-nginx |
You can use the labels as:
- Filter labels on the Analytics page,
- in the Filter By Label field during log tapping.
You can use the message fields
- in Flow Processing steps, for example, in the Query field of Select Messages steps,
- in AQL expressions in the search bars.
9.21.2 - Telemetry Controller
Telemetry Controller: Telemetry Controller
Configure Telemetry Controller to send data to an OpenTelemetry Connector of an AxoRouter instance.
Labels
Axoflow automatically adds the following labels to data collected from this source:
| Analytics label | Message field | value |
|---|---|---|
vendor |
meta.vendor |
kubernetes |
product |
meta.product |
telemetry-controller |
kubernetes_namespace |
meta.kubernetes.namespace |
dynamic |
kubernetes_container |
meta.kubernetes.container |
dynamic |
You can use the labels as:
- Filter labels on the Analytics page,
- in the Filter By Label field during log tapping.
You can use the message fields
- in Flow Processing steps, for example, in the Query field of Select Messages steps,
- in AQL expressions in the search bars.
9.22 - MicroFocus
9.23 - Microsoft
9.23.1 - Azure Event Hubs
Azure Event Hubs: Big data streaming platform to ingest and process events.
Axoflow can collect data from your Azure Event Hubs. At a high level, the process looks like this:
- Deploy an Axoflow Cloud Connector that will collect the data from your Event Hub. Axoflow Cloud Connector is a simple container that you can deploy into Azure, another cloud provider, or on-prem.
- The connector forwards the collected data to the OpenTelemetry connector of an AxoRouter instance. This AxoRouter can be deployed within Azure, another cloud provider, or on-prem.
- Configure a Flow on AxoConsole that processes and routes the collected data to your destination (for example, Splunk or another SIEM).

Prerequisites
- An Azure account with an active subscription.
- A virtual machine or Kubernetes node running to deploy Axoflow Cloud Connector on.
- An AxoRouter instance that can receive data from the connector. Verify that it has an OpenTelemetry Connector (it’s enabled by default).
-
You know the IP address the AxoRouter. To find it:
- Open the AxoConsole.
- Select the Routers or the Topology page.
- Select on AxoRouter instance that is going to receive the logs.
- Check the Networks > Address field.
- The Axoflow Cloud Connector must be able to access the AxoRouter on the port the OpenTelemetry Connector is listening on (by default, port 4317). Depending on where the Axoflow Cloud Connector and AxoRouter are deployed, you might need to adjust firewall and ingress/egress rules in your environment.
- An Event Hubs connection string.
Steps
To collect data from Azure Event Hubs, complete the following steps.
-
Deploy an Axoflow Cloud Connector into Azure.
-
Access the Kubernetes node or virtual machine.
-
Set the following environment variable to the IP address of the AxoRouter where you want to forward the data from Event Hubs. This IP address must be accessible from the connector. You can find the IP address of AxoRouter on the Routers > AxoRouter > Overview page.
export AXOROUTER_ENDPOINT=<AxoRouter-IP-address> -
(Optional) By default, the connector stores positional and other persistence-related data in the
/etc/axoflow-otel-collector/storagedirectory. In case you want to use a different directory, set theSTORAGE_DIRECTORYenvironment variable. -
Run the following command to generate a UUID for the connector. AxoConsole will use this ID to identify the connector.
UUID_FULL=$(uuidgen 2>/dev/null || cat /proc/sys/kernel/random/uuid 2>/dev/null || python3 -c "import uuid; print(uuid.uuid4())") export AXOCLOUDCONNECTOR_DEVICE_ID=$(echo "$UUID_FULL" | cut -d'-' -f1) -
Set TLS encryption to secure the communication between Axoflow Cloud Connector and AxoRouter.
Configure the TLS-related settings of Axoflow Cloud Connector using the following environment variables.
Variable Required Default Description AXOROUTER_TLS_INSECURENo falseDisables TLS encryption if set to trueAXOROUTER_TLS_INCLUDE_SYSTEM_CA_CERTS_POOLNo falseSet to trueto use the system CA certificatesAXOROUTER_TLS_CA_FILENo - Path to the CA certificate file used to validate the certificate of AxoRouter AXOROUTER_TLS_CA_PEMNo - PEM-encoded CA certificate AXOROUTER_TLS_INSECURE_SKIP_VERIFYNo falseSet to trueto disable TLS certificate verification of AxoRouterAXOROUTER_TLS_CERT_FILENo - Path to the certificate file of Axoflow Cloud Connector AXOROUTER_TLS_CERT_PEMNo - PEM-encoded client certificate AXOROUTER_TLS_KEY_FILENo - Path to the client private key file of Axoflow Cloud Connector AXOROUTER_TLS_KEY_PEMNo - PEM-encoded client private key AXOROUTER_TLS_MIN_VERSIONNo 1.2Minimum TLS version to use AXOROUTER_TLS_MAX_VERSIONNo - Maximum TLS version to use Note You’ll have to include the TLS-related environment variables you set in the docker command used to deploy Axoflow Cloud Connector. -
Set the
AZURE_EVENTHUB_CONNECTION_STRINGenvironment variable.export AZURE_EVENTHUB_CONNECTION_STRING="Endpoint=sb://<NamespaceName>.servicebus.windows.net/;SharedAccessKeyName=<KeyName>;SharedAccessKey=<KeyValue>;EntityPath=<EventHubName>" -
Deploy the Axoflow Cloud Connector by running the following command. Also, pass the TLS-related settings you’ve set earlier.
docker run --rm \
-v "${STORAGE_DIRECTORY}":"${STORAGE_DIRECTORY}" \
-e AZURE_EVENTHUB_CONNECTION_STRING="${AZURE_EVENTHUB_CONNECTION_STRING}" \
-e AXOROUTER_ENDPOINT="${AXOROUTER_ENDPOINT}" \
-e STORAGE_DIRECTORY="${STORAGE_DIRECTORY}" \
-e <TlS-related-environment-variable>="${<TlS-related-environment-variable>}" \
-e AXOCLOUDCONNECTOR_DEVICE_ID="${AXOCLOUDCONNECTOR_DEVICE_ID}" \
ghcr.io/axoflow/axocloudconnectors:latest
The Axoflow Cloud Connector starts forwarding logs to the AxoRouter instance.
-
-
Add the appliance to AxoConsole.
- Open the AxoConsole and select Topology.
- Select Add Item > Source.
- Select Azure Event Hubs.
- Enter the IP address and the FQDN of the Axoflow Cloud Connector instance.
- Select Add.
-
Create a Flow to route the data from the AxoRouter instance to a destination. You can use the Labels of this source to select messages from this source.
Labels
Axoflow automatically adds the following labels to data collected from this source:
| Analytics label | Message field | value |
|---|---|---|
vendor |
meta.vendor |
microsoft |
product |
meta.product |
azure-event-hubs |
service |
meta.service.name |
signin |
You can use the labels as:
- Filter labels on the Analytics page,
- in the Filter By Label field during log tapping.
You can use the message fields
- in Flow Processing steps, for example, in the Query field of Select Messages steps,
- in AQL expressions in the search bars.
Event Hubs Audit logs labels
| Analytics label | Message field | value |
|---|---|---|
vendor |
meta.vendor |
microsoft |
product |
meta.product |
azure-event-hubs-audit |
Event Hubs Provisioning logs labels
| Analytics label | Message field | value |
|---|---|---|
vendor |
meta.vendor |
microsoft |
product |
meta.product |
azure-event-hubs-provisioning |
Event Hubs Signin logs labels
| Analytics label | Message field | value |
|---|---|---|
vendor |
meta.vendor |
microsoft |
product |
meta.product |
azure-event-hubs-signin |
Sending data to Splunk
When sending the data collected from this source to Splunk, Axoflow uses the following sourcetype and index settings:
| sourcetype | index |
|---|---|
mscs:azure:eventhub:log |
azure-activity |
Configure the TLS-related settings of Axoflow Cloud Connector using the following environment variables.
| Variable | Required | Default | Description |
|---|---|---|---|
AXOROUTER_TLS_INSECURE |
No | false |
Disables TLS encryption if set to true |
AXOROUTER_TLS_INCLUDE_SYSTEM_CA_CERTS_POOL |
No | false |
Set to true to use the system CA certificates |
AXOROUTER_TLS_CA_FILE |
No | - | Path to the CA certificate file used to validate the certificate of AxoRouter |
AXOROUTER_TLS_CA_PEM |
No | - | PEM-encoded CA certificate |
AXOROUTER_TLS_INSECURE_SKIP_VERIFY |
No | false |
Set to true to disable TLS certificate verification of AxoRouter |
AXOROUTER_TLS_CERT_FILE |
No | - | Path to the certificate file of Axoflow Cloud Connector |
AXOROUTER_TLS_CERT_PEM |
No | - | PEM-encoded client certificate |
AXOROUTER_TLS_KEY_FILE |
No | - | Path to the client private key file of Axoflow Cloud Connector |
AXOROUTER_TLS_KEY_PEM |
No | - | PEM-encoded client private key |
AXOROUTER_TLS_MIN_VERSION |
No | 1.2 |
Minimum TLS version to use |
AXOROUTER_TLS_MAX_VERSION |
No | - | Maximum TLS version to use |
Sending data to Google SecOps
When sending the data collected from this source to a dynamic Google SecOps destination, Axoflow sets the following log type: AZURE_EVENTHUB.
9.23.2 - Cloud App Security (MCAS)
Cloud App Security (MCAS): Monitors cloud app usage, detects anomalies, and enforces security policies across SaaS services.
To onboard such a source to Axoflow, complete the generic appliance onboarding steps.
Labels
Axoflow automatically adds the following labels to data collected from this source:
| Analytics label | Message field | value |
|---|---|---|
vendor |
meta.vendor |
microsoft |
product |
meta.product |
cas |
You can use the labels as:
- Filter labels on the Analytics page,
- in the Filter By Label field during log tapping.
You can use the message fields
- in Flow Processing steps, for example, in the Query field of Select Messages steps,
- in AQL expressions in the search bars.
Sending data to Splunk
When sending the data collected from this source to Splunk, Axoflow uses the following sourcetype and index settings:
| sourcetype | source | index |
|---|---|---|
cef |
microsoft:cas |
main |
Sending data to Google SecOps
When sending the data collected from this source to a dynamic Google SecOps destination, Axoflow sets the following log type: MICROSOFT_DEFENDER_CLOUD_ALERTS.
9.23.3 - Windows hosts
Windows hosts: Event logs from core services like security, system, DNS, and DHCP for operational and forensic analysis.
To collect event logs from Microsoft Windows hosts, Axoflow supports both agent-based and agentless methods.
- For a collector agent, we recommend using the Axoflow OpenTelemetry Collector distribution. For details, see Windows host - agent based solution.
- To use an agentless solution, see Windows Event Collector (WEC).
Labels
Labels assigned to data received from Windows hosts depend on how AxoRouter receives the data. For details, see Windows host - agent based solution and Windows Event Collector (WEC).
Sending data to Splunk
When sending the data collected from this source to Splunk, Axoflow uses the following sourcetype and index settings:
| sourcetype | index |
|---|---|
windows:eventlog:snare |
oswin |
windows:eventlog:xml |
oswin |
Sending data to Google SecOps
When sending the data collected from this source to a dynamic Google SecOps destination, Axoflow sets the following log type: WINEVTLOG, WINEVTLOG_XML, WINDOWS_DHCP, WINDOWS_DNS.
9.24 - MikroTik
9.24.1 - RouterOS
RouterOS: Router operating system providing firewall, bandwidth management, routing, and hotspot functionality.
To onboard such a source to Axoflow, complete the generic appliance onboarding steps.
Labels
Axoflow automatically adds the following labels to data collected from this source:
| Analytics label | Message field | value |
|---|---|---|
vendor |
meta.vendor |
mikrotik |
product |
meta.product |
routeros |
service |
meta.service.name |
forward |
You can use the labels as:
- Filter labels on the Analytics page,
- in the Filter By Label field during log tapping.
You can use the message fields
- in Flow Processing steps, for example, in the Query field of Select Messages steps,
- in AQL expressions in the search bars.
Sending data to Splunk
When sending the data collected from this source to Splunk, Axoflow uses the following sourcetype and index settings:
| sourcetype | index |
|---|---|
routeros |
netfw |
routeros |
netops |
Sending data to Google SecOps
When sending the data collected from this source to a dynamic Google SecOps destination, Axoflow sets the following log type: MIKROTIK_ROUTER.
9.25 - NetFlow Logic
9.25.1 - NetFlow Optimizer
NetFlow Optimizer: Aggregates and transforms flow data (NetFlow, IPFIX) into actionable security and performance insights.
The following sections show you how to configure NetFlow Optimizer to send their log data to Axoflow.
CAUTION:
Make sure to set data forwarding on your appliances/servers as described in this guide. Different settings like alternate message formats or ports might be valid, but can result in data loss or incorrect parsing.Prerequisites
- You have administrative access to NetFlow Optimizer.
- You have an AxoRouter deployed and configured with a Syslog connector that has parsing and classification enabled (by default, every AxoRouter has such connectors). This device is going to receive the data from NetFlow Optimizer.
-
You know the IP address the AxoRouter. To find it:
- Open the AxoConsole.
- Select the Routers or the Topology page.
- Select on AxoRouter instance that is going to receive the logs.
- Check the Networks > Address field.
Steps
Note: The steps involving the NetFlow Optimizer user interface are just for your convenience, for details, see the official documentation.
-
Log in to NetFlow Optimizer.
-
Select Outputs, then click the plus sign to add an output to NetFlow Optimizer.
-
Configure a Syslog (UDP) output:
- Name: Enter a name for the output, for example,
Axoflow. - Address: The IP address of the AxoRouter instance where you want to send the messages.
- Port: Set this parameter to 514.
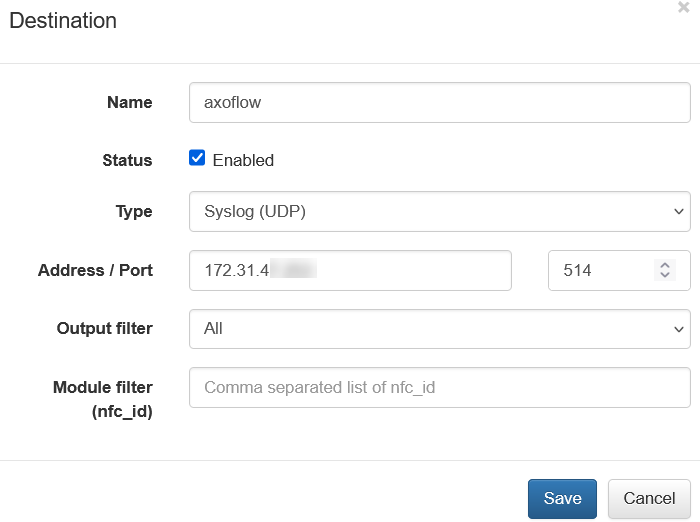
- Name: Enter a name for the output, for example,
-
Click Save.
-
Add the source to AxoConsole.
-
Open the AxoConsole and select Topology.
-
Select Add Item > Source.
-
If the source is actively sending data to an AxoRouter instance, select Detected, then select your source.
-
Otherwise, select the vendor and product corresponding to your source from the Predefined sources, then enter the parameters of the source, like IP address and FQDN.
Note During log tapping, you can add hosts that are actively sending data to an AxoRouter instance by clicking Register source. -
-
(Optional) Add custom labels as needed.
-
Select Add.
-
Labels
Axoflow automatically adds the following labels to data collected from this source:
| Analytics label | Message field | value |
|---|---|---|
vendor |
meta.vendor |
netflow |
product |
meta.product |
optimizer |
service |
meta.service.name |
Network Conversations Monitor, SNMP Custom OID Sets Monitor, Sampling Monitor, SNMP Information Monitor, DNS Service Monitor, DNS Users Monitor, Network Subnets Monitor, Asset Access Monitor, Services Performance Monitor, Top Bandwidth Consumers for Cisco ASA, Top Traffic Destinations for Cisco ASA, Top Policy Violators for Cisco ASA, Top Hosts with most Connections for Cisco ASA, Outbound Mail Spammers Monitor, Inbound Mail Spammers Monitor, Unauthorized Mail Servers Monitor, Rejected Emails Monitor, Top Bandwidth Consumers for Palo Alto Networks Firewall, Top Traffic Destinations for Palo Alto Networks Firewall, Hosts with Most Policy Violations for Palo Alto Networks Firewall, Most Active Hosts for Palo Alto Networks Firewall, Bandwidth Consumption per Application for Palo Alto Networks Firewall, Bandwidth Consumption per Application/User for Palo Alto Networks, Top Applications Traffic Monitor, Top Applications Host Pairs Monitor, Visitors by Country, Botnet C&C Traffic Monitor, Custom Threat lists Monitor, Host Reputation Monitor, Threat Feeds Traffic Monitor, TCP Health Monitor, Network Conversations Monitor, Top Connections Monitor, Top Pairs Monitor, CBQoS Monitor, Traffic by Autonomous Systems, Top Traffic Monitor, Top Packets Monitor, SNMP Custom OID Sets Monitor, Top Bandwidth Consumers for NSX Distributed Firewall, Top Traffic Destinations for NSX Distributed Firewall, Top Policy Violators for NSX Distributed Firewall, Top Hosts with most Connections for NSX Distributed Firewall, Top Host VM:Host Pairs, Top VM:Host Traffic Monitor, AWS VPC Flow logs, Micro-segmentation Top Pairs Monitor, AWS Top Traffic Monitor, GCP VPC Flow Logs, GCP Top Traffic Monitor, Azure NSG Flow Logs, Cisco AVC Top Applications Monitor, Cisco AVC Bandwidth Consumption Monitor, Azure Top Traffic Monitor, Cisco AnyConnect Top Traffic Monitor, SNMP Traps Monitor, Auto-discovery Reporter, Top Traffic Monitor Geo City, Top Traffic Monitor Geo Country, Flow Data |
You can use the labels as:
- Filter labels on the Analytics page,
- in the Filter By Label field during log tapping.
You can use the message fields
- in Flow Processing steps, for example, in the Query field of Select Messages steps,
- in AQL expressions in the search bars.
Sending data to Splunk
When sending the data collected from this source to Splunk, Axoflow uses the following sourcetype and index settings:
| sourcetype | index |
|---|---|
flowintegrator |
flowintegrator |
9.26 - Netgate
9.26.1 - pfSense
pfSense: Open-source firewall and router platform with VPN, traffic shaping, and intrusion detection capabilities.
To onboard such a source to Axoflow, complete the generic appliance onboarding steps.
Labels
Axoflow automatically adds the following labels to data collected from this source:
| Analytics label | Message field | value |
|---|---|---|
vendor |
meta.vendor |
netgate |
product |
meta.product |
pfsense |
service |
meta.service.name |
filterlog |
You can use the labels as:
- Filter labels on the Analytics page,
- in the Filter By Label field during log tapping.
You can use the message fields
- in Flow Processing steps, for example, in the Query field of Select Messages steps,
- in AQL expressions in the search bars.
Sending data to Splunk
When sending the data collected from this source to Splunk, Axoflow uses the following sourcetype and index settings:
| sourcetype | index |
|---|---|
pfsense:filterlog |
netfw |
pfsense:<program> |
netops |
The pfsense:<program> variant is simply a generic linux event that is generated by the underlying OS on the appliance.
Tested with: TA-pfsense
Sending data to Google SecOps
When sending the data collected from this source to a dynamic Google SecOps destination, Axoflow sets the following log type: PFSENSE.
9.27 - Netmotion
9.27.1 - Netmotion
Netmotion: Provides secure, optimized remote access with performance monitoring for mobile and distributed workforces.
To onboard such a source to Axoflow, complete the generic appliance onboarding steps.
Labels
Axoflow automatically adds the following labels to data collected from this source:
| Analytics label | Message field | value |
|---|---|---|
vendor |
meta.vendor |
netmotion |
product |
meta.product |
netmotion |
service |
meta.service.name |
LocalityServer, nmreporting.exe |
You can use the labels as:
- Filter labels on the Analytics page,
- in the Filter By Label field during log tapping.
You can use the message fields
- in Flow Processing steps, for example, in the Query field of Select Messages steps,
- in AQL expressions in the search bars.
Sending data to Splunk
When sending the data collected from this source to Splunk, Axoflow uses the following sourcetype and index settings:
| sourcetype | index |
|---|---|
netmotion:reporting |
netops |
netmotion:mobilityserver:nm_mobilityanalyticsappdata |
netops |
Sending data to Google SecOps
When sending the data collected from this source to a dynamic Google SecOps destination, Axoflow sets the following log type: NETMOTION.
9.28 - NETSCOUT
9.28.1 - Arbor Edge Defense (AED)
Arbor Edge Defense (AED): Edge-based DDoS protection and threat mitigation system to block attacks before they enter the network.
To onboard such a source to Axoflow, complete the generic appliance onboarding steps.
Labels
Axoflow automatically adds the following labels to data collected from this source:
| Analytics label | Message field | value |
|---|---|---|
vendor |
meta.vendor |
netscout |
product |
meta.product |
arbor-edge |
You can use the labels as:
- Filter labels on the Analytics page,
- in the Filter By Label field during log tapping.
You can use the message fields
- in Flow Processing steps, for example, in the Query field of Select Messages steps,
- in AQL expressions in the search bars.
Sending data to Splunk
When sending the data collected from this source to Splunk, Axoflow uses the following sourcetype, source, and index settings:
| sourcetype | source | index |
|---|---|---|
netscout:aed |
netscout:aed |
netids |
Sending data to Google SecOps
When sending the data collected from this source to a dynamic Google SecOps destination, Axoflow sets the following log type: ARBOR_EDGE_DEFENSE.
9.28.2 - Arbor Pravail (APS)
Arbor Pravail (APS): Monitors and mitigates advanced persistent threats and malware with inline packet inspection.
To onboard such a source to Axoflow, complete the generic appliance onboarding steps.
Labels
Axoflow automatically adds the following labels to data collected from this source:
| Analytics label | Message field | value |
|---|---|---|
vendor |
meta.vendor |
netscout |
product |
meta.product |
arbor-pravail |
service |
meta.service.name |
arbor-networks-aps, pravail |
You can use the labels as:
- Filter labels on the Analytics page,
- in the Filter By Label field during log tapping.
You can use the message fields
- in Flow Processing steps, for example, in the Query field of Select Messages steps,
- in AQL expressions in the search bars.
Sending data to Splunk
When sending the data collected from this source to Splunk, Axoflow uses the following sourcetype, source, and index settings:
| sourcetype | source | index |
|---|---|---|
netscout:aps |
netscout:aps |
netids |
Sending data to Google SecOps
When sending the data collected from this source to a dynamic Google SecOps destination, Axoflow sets the following log type: ARBOR_EDGE_DEFENSE.
Earlier name/vendor
- Arbor Networks Pravail (APS)
9.29 - Omnissa
Earlier name/vendor
VMware Horizon
9.29.1 - Horizon
Horizon: Horizon is a platform for managing and delivering virtual desktops and applications to end-users across a variety of devices and locations.
To onboard such a source to Axoflow, complete the generic appliance onboarding steps.
Labels
Axoflow automatically adds the following labels to data collected from this source:
| Analytics label | Message field | value |
|---|---|---|
vendor |
meta.vendor |
omnissa |
product |
meta.product |
horizon |
service |
meta.service.name |
view |
You can use the labels as:
- Filter labels on the Analytics page,
- in the Filter By Label field during log tapping.
You can use the message fields
- in Flow Processing steps, for example, in the Query field of Select Messages steps,
- in AQL expressions in the search bars.
Sending data to Splunk
When sending the data collected from this source to Splunk, Axoflow uses the following sourcetype and index settings:
| sourcetype | index |
|---|---|
vmware:horizon |
infraops |
Sending data to Google SecOps
When sending the data collected from this source to a dynamic Google SecOps destination, Axoflow sets the following log type: VMWARE_HORIZON.
Earlier name/vendor
VMware Horizon
9.30 - OpenText
9.30.1 - ArcSight
ArcSight: SIEM platform for collecting, correlating, and analyzing security event data across IT environments.
To onboard such a source to Axoflow, complete the generic appliance onboarding steps.
Labels
Axoflow automatically adds the following labels to data collected from this source:
| Analytics label | Message field | value |
|---|---|---|
vendor |
meta.vendor |
opentext |
product |
meta.product |
arcsight |
You can use the labels as:
- Filter labels on the Analytics page,
- in the Filter By Label field during log tapping.
You can use the message fields
- in Flow Processing steps, for example, in the Query field of Select Messages steps,
- in AQL expressions in the search bars.
Sending data to Splunk
When sending the data collected from this source to Splunk, Axoflow uses the following sourcetype, source, and index settings:
| sourcetype | source | index |
|---|---|---|
cef |
ArcSight:ArcSight |
main |
Sending data to Google SecOps
When sending the data collected from this source to a dynamic Google SecOps destination, Axoflow sets the following log type: ARCSIGHT_CEF.
Earlier name/vendor
MicroFocus ArcSight
9.30.2 - Self Service Password Reset (SSPR)
Self Service Password Reset (SSPR): Allows users to securely reset their own passwords without IT assistance, reducing helpdesk load.
To onboard such a source to Axoflow, complete the generic appliance onboarding steps.
Labels
Axoflow automatically adds the following labels to data collected from this source:
| Analytics label | Message field | value |
|---|---|---|
vendor |
meta.vendor |
opentext |
product |
meta.product |
sspr |
service |
meta.service.name |
SSPR |
You can use the labels as:
- Filter labels on the Analytics page,
- in the Filter By Label field during log tapping.
You can use the message fields
- in Flow Processing steps, for example, in the Query field of Select Messages steps,
- in AQL expressions in the search bars.
Sending data to Splunk
When sending the data collected from this source to Splunk, Axoflow uses the following sourcetype, source, and index settings:
| sourcetype | index |
|---|---|
sspr |
netauth |
Earlier name/vendor
NetIQ Self Service Password Reset
9.31 - Palo Alto Networks
9.31.1 - Cortex XSOAR
Cortex XSOAR: Security orchestration, automation, and response platform for threat detection and incident management.
To onboard such a source to Axoflow, complete the generic appliance onboarding steps.
Labels
Axoflow automatically adds the following labels to data collected from this source:
| Analytics label | Message field | value |
|---|---|---|
vendor |
meta.vendor |
palo-alto-networks |
product |
meta.product |
cortex-xsoar |
You can use the labels as:
- Filter labels on the Analytics page,
- in the Filter By Label field during log tapping.
You can use the message fields
- in Flow Processing steps, for example, in the Query field of Select Messages steps,
- in AQL expressions in the search bars.
Sending data to Splunk
When sending the data collected from this source to Splunk, Axoflow uses the following sourcetype, source, and index settings:
| sourcetype | source | index |
|---|---|---|
cef |
tim:cef |
infraops |
Sending data to Google SecOps
When sending the data collected from this source to a dynamic Google SecOps destination, Axoflow sets the following log type: PAN_XSOAR.
Earlier name/vendor
Threat Intelligence Management (TIM)
9.31.2 - Palo Alto firewalls
Palo Alto firewalls: Firewall operating system delivering network security features including traffic control and threat prevention.
The following sections show you how to configure Palo Alto Networks Next-Generation Firewall devices to send their log data to Axoflow.
CAUTION:
Make sure to set data forwarding on your appliances/servers as described in this guide. Different settings like alternate message formats or ports might be valid, but can result in data loss or incorrect parsing.Prerequisites
- You have administrative access to the firewall.
- The date, time, and time zone are correctly set on the firewall.
- You have an AxoRouter deployed and configured with a Syslog connector that has parsing and classification enabled (by default, every AxoRouter has such connectors). This device is going to receive the data from the firewall.
-
You know the IP address the AxoRouter. To find it:
- Open the AxoConsole.
- Select the Routers or the Topology page.
- Select on AxoRouter instance that is going to receive the logs.
- Check the Networks > Address field.
Steps
Note: The steps involving the Palo Alto Networks Next-Generation Firewall user interface are just for your convenience, for details, see the official PAN-OS® documentation.
-
Log in to your firewall device. You need administrator privileges to perform the configuration.
-
Configure a Syslog server profile.
-
Select Device > Server Profiles > Syslog.
-
Click Add and enter a Name for the profile, for example,
axorouter. -
Configure the following settings:
- Syslog Server: Enter the IP address of your AxoRouter:
%axorouter-ip% - Transport: Select TCP or TLS.
- Port: Set the port to
601. (This is needed for the recommended IETF log format. If for some reason you need to use the BSD format, set the port to514.) - Format: Select IETF.
- Syslog logging: Enable this option.
- Syslog Server: Enter the IP address of your AxoRouter:
-
Click OK.
-
-
Configure syslog forwarding for Traffic, Threat, and WildFire Submission logs. For details, see Configure Log Forwarding the official PAN-OS® documentation.
- Select Objects > Log Forwarding.
- Click Add.
- Enter a Name for the profile, for example,
axoflow. - For each log type, severity level, or WildFire verdict, select the Syslog server profile.
- Click OK.
- Assign the log forwarding profile to a security policy to trigger log generation and forwarding.
- Select Policies > Security and select a policy rule.
- Select Actions, then select the Log Forwarding profile you created (for example,
axoflow). - For Traffic logs, select one or both of the Log at Session Start and Log At Session End options.
- Click OK.
-
Configure syslog forwarding for System, Config, HIP Match, and Correlation logs.
- Select Device > Log Settings.
- For System and Correlation logs, select each Severity level, select the Syslog server profile, and click OK.
- For Config, HIP Match, and Correlation logs, edit the section, select the Syslog server profile, and click OK.
-
Click Commit.
-
Add the source to AxoConsole.
-
Open the AxoConsole and select Topology.
-
Select Add Item > Source.
-
If the source is actively sending data to an AxoRouter instance, select Detected, then select your source.
-
Otherwise, select the vendor and product corresponding to your source from the Predefined sources, then enter the parameters of the source, like IP address and FQDN.
Note During log tapping, you can add hosts that are actively sending data to an AxoRouter instance by clicking Register source. -
-
(Optional) Add custom labels as needed.
-
Select Add.
-
Labels
Axoflow automatically adds the following labels to data collected from this source:
| Analytics label | Message field | value |
|---|---|---|
vendor |
meta.vendor |
palo-alto-networks |
product |
meta.product |
panos |
You can use the labels as:
- Filter labels on the Analytics page,
- in the Filter By Label field during log tapping.
You can use the message fields
- in Flow Processing steps, for example, in the Query field of Select Messages steps,
- in AQL expressions in the search bars.
Sending data to Splunk
When sending the data collected from this source to Splunk, Axoflow uses the following sourcetype and index settings:
| sourcetype | index |
|---|---|
pan:audit |
netops |
pan:globalprotect |
netfw |
pan:hipmatch |
epintel |
pan:traffic |
netfw |
pan:threat |
netproxy |
pan:system |
netops |
Tested with: Palo Alto Networks Add-on for Splunk technical add-on
Sending data to Google SecOps
When sending the data collected from this source to a dynamic Google SecOps destination, Axoflow sets the following log type: PAN_FIREWALL.
9.32 - Ping Identity
9.32.1 - PingAccess
PingAccess: A centralized access security solution which provides secure access to applications and APIs down to the URL level
To onboard such a source to Axoflow, complete the generic appliance onboarding steps.
Labels
Axoflow automatically adds the following labels to data collected from this source:
| Analytics label | Message field | value |
|---|---|---|
vendor |
meta.vendor |
ping-identity |
product |
meta.product |
pingaccess |
You can use the labels as:
- Filter labels on the Analytics page,
- in the Filter By Label field during log tapping.
You can use the message fields
- in Flow Processing steps, for example, in the Query field of Select Messages steps,
- in AQL expressions in the search bars.
Sending data to Splunk
When sending the data collected from this source to Splunk, Axoflow uses the following sourcetype and index settings:
| sourcetype | source | index |
|---|---|---|
source.engine |
pingaccess |
netauth |
Tested with: SecureAuth IdP Splunk App
9.33 - Powertech
9.34 - Progress
9.34.1 - Flowmon Anomaly Detection System (ADS)
Flowmon Anomaly Detection System (ADS): Detects network anomalies and threats through flow-based behavior analysis and machine learning.
To onboard such a source to Axoflow, complete the generic appliance onboarding steps.
Labels
Axoflow automatically adds the following labels to data collected from this source:
| Analytics label | Message field | value |
|---|---|---|
vendor |
meta.vendor |
progress |
product |
meta.product |
flowmon-ads |
service |
meta.service.name |
ADS |
You can use the labels as:
- Filter labels on the Analytics page,
- in the Filter By Label field during log tapping.
You can use the message fields
- in Flow Processing steps, for example, in the Query field of Select Messages steps,
- in AQL expressions in the search bars.
Sending data to Splunk
When sending the data collected from this source to Splunk, Axoflow uses the following sourcetype and index settings:
| sourcetype | index |
|---|---|
flowmon-ads |
netids |
Earlier name/vendor
- Flowmon Networks
9.35 - Riverbed
9.35.1 - SteelConnect
SteelConnect: WAN optimization appliance that accelerates application performance and reduces bandwidth usage.
To onboard such a source to Axoflow, complete the generic appliance onboarding steps.
Labels
Axoflow automatically adds the following labels to data collected from this source:
| Analytics label | Message field | value |
|---|---|---|
vendor |
meta.vendor |
riverbed |
product |
meta.product |
steelconnect |
service |
meta.service.name |
/opt/hal/bin/hal, alarmd, crld, domaind, hald_model, link_control, lumberjack_rbt-upgrader, lumberjack_rbt, mdreq, mgmtd, ocd, periodic_raidcheck, pm, rcud, restd, rgpd, rscored-upgrader, rscored, rstild-upgrader, rstild, sched, statsd, wdt, webasd |
You can use the labels as:
- Filter labels on the Analytics page,
- in the Filter By Label field during log tapping.
You can use the message fields
- in Flow Processing steps, for example, in the Query field of Select Messages steps,
- in AQL expressions in the search bars.
Sending data to Splunk
When sending the data collected from this source to Splunk, Axoflow uses the following sourcetype and index settings:
| sourcetype | index |
|---|---|
riverbed:syslog |
netops |
Sending data to Google SecOps
When sending the data collected from this source to a dynamic Google SecOps destination, Axoflow sets the following log type: STEELHEAD.
9.35.2 - SteelHead
SteelHead: Software-defined WAN solution for centralized network management and secure cloud connectivity.
To onboard such a source to Axoflow, complete the generic appliance onboarding steps.
Labels
Axoflow automatically adds the following labels to data collected from this source:
| Analytics label | Message field | value |
|---|---|---|
vendor |
meta.vendor |
riverbed |
product |
meta.product |
steelhead |
service |
meta.service.name |
sport |
You can use the labels as:
- Filter labels on the Analytics page,
- in the Filter By Label field during log tapping.
You can use the message fields
- in Flow Processing steps, for example, in the Query field of Select Messages steps,
- in AQL expressions in the search bars.
Sending data to Splunk
When sending the data collected from this source to Splunk, Axoflow uses the following sourcetype and index settings:
| sourcetype | index |
|---|---|
riverbed:steelhead |
netops |
Sending data to Google SecOps
When sending the data collected from this source to a dynamic Google SecOps destination, Axoflow sets the following log type: RIVERBED.
9.36 - RSA
9.36.1 - Authentication Manager
Authentication Manager: Manages two-factor authentication using RSA SecurID tokens for secure access to enterprise resources.
To onboard such a source to Axoflow, complete the generic appliance onboarding steps.
Labels
Axoflow automatically adds the following labels to data collected from this source:
| Analytics label | Message field | value |
|---|---|---|
vendor |
meta.vendor |
rsa |
product |
meta.product |
authentication-manager |
service |
meta.service.name |
SecureAuth2 |
You can use the labels as:
- Filter labels on the Analytics page,
- in the Filter By Label field during log tapping.
You can use the message fields
- in Flow Processing steps, for example, in the Query field of Select Messages steps,
- in AQL expressions in the search bars.
Sending data to Splunk
When sending the data collected from this source to Splunk, Axoflow uses the following sourcetype and index settings:
| sourcetype | index |
|---|---|
rsa:securid:admin:syslog |
netauth |
rsa:securid:system:syslog |
netauth |
rsa:securid:runtime:syslog |
netauth |
rsa:securid:syslog |
netauth |
Sending data to Google SecOps
When sending the data collected from this source to a dynamic Google SecOps destination, Axoflow sets the following log type: RSA_AUTH_MANAGER.
9.37 - rsyslog
Axoflow treats rsyslog sources as a generic syslog source. To send data from rsyslog to Axoflow, just configure rsyslog to send data to an AxoRouter instance using the syslog protocol.
Note that even if rsyslog is acting as a relay (receiving data from other clients and forwarding them to AxoRouter), on the Topology page it will be displayed as a data source.
Prerequisites
- You have administrative access to the device running rsyslog.
- The date, time, and time zone are correctly set on the appliance.
- You have an AxoRouter deployed and configured with a Syslog connector that has parsing and classification enabled (by default, every AxoRouter has such connectors). This device is going to receive the data from the source.
-
You know the IP address the AxoRouter. To find it:
- Open the AxoConsole.
- Select the Routers or the Topology page.
- Select on AxoRouter instance that is going to receive the logs.
- Check the Networks > Address field.
9.38 - SecureAuth
9.38.1 - Identity Platform
Identity Platform: Delivers identity and access management with adaptive authentication and single sign-on capabilities.
To onboard such a source to Axoflow, complete the generic appliance onboarding steps.
Labels
Axoflow automatically adds the following labels to data collected from this source:
| Analytics label | Message field | value |
|---|---|---|
vendor |
meta.vendor |
secureauth |
product |
meta.product |
idp |
You can use the labels as:
- Filter labels on the Analytics page,
- in the Filter By Label field during log tapping.
You can use the message fields
- in Flow Processing steps, for example, in the Query field of Select Messages steps,
- in AQL expressions in the search bars.
Sending data to Splunk
When sending the data collected from this source to Splunk, Axoflow uses the following sourcetype and index settings:
| sourcetype | index |
|---|---|
secureauth:idp |
netops |
Tested with: SecureAuth IdP Splunk App
Sending data to Google SecOps
When sending the data collected from this source to a dynamic Google SecOps destination, Axoflow sets the following log type: SECUREAUTH_SSO.
9.39 - Skyhigh Security
9.39.1 - Secure Web Gateway
Secure Web Gateway: Inspects and filters web traffic to protect against malware, enforce policies, and prevent data loss.
To onboard such a source to Axoflow, complete the generic appliance onboarding steps.
Labels
Axoflow automatically adds the following labels to data collected from this source:
| Analytics label | Message field | value |
|---|---|---|
vendor |
meta.vendor |
skyhigh |
product |
meta.product |
secure-web-gateway |
service |
meta.service.name |
mwg |
You can use the labels as:
- Filter labels on the Analytics page,
- in the Filter By Label field during log tapping.
You can use the message fields
- in Flow Processing steps, for example, in the Query field of Select Messages steps,
- in AQL expressions in the search bars.
Sending data to Splunk
When sending the data collected from this source to Splunk, Axoflow uses the following sourcetype and index settings:
| sourcetype | source | index |
|---|---|---|
mcafee:wg:leef |
mcafee:wg |
netproxy |
mcafee:wg:kv |
mcafee:wg |
netproxy |
Sending data to Google SecOps
When sending the data collected from this source to a dynamic Google SecOps destination, Axoflow sets the following log type: MCAFEE_WEBPROXY.
Earlier name/vendor
McAfee Secure Web Gateway
9.40 - SonicWall
9.40.1 - SonicWall
SonicWall: Delivers firewall, VPN, and deep packet inspection to protect networks from cyber threats and intrusions.
The following sections show you how to configure SonicWall firewalls to send their log data to Axoflow.
CAUTION:
Make sure to set data forwarding on your appliances/servers as described in this guide. Different settings like alternate message formats or ports might be valid, but can result in data loss or incorrect parsing.Prerequisites
- You have administrative access to the firewall.
- The date, time, and time zone are correctly set on the firewall.
- You have an AxoRouter deployed and configured with a Syslog connector that has parsing and classification enabled (by default, every AxoRouter has such connectors). This device is going to receive the data from the firewall.
-
You know the IP address the AxoRouter. To find it:
- Open the AxoConsole.
- Select the Routers or the Topology page.
- Select on AxoRouter instance that is going to receive the logs.
- Check the Networks > Address field.
Steps for SonicOS 7.x
Note: The steps involving the SonicWall user interface are just for your convenience, for details, see the official SonicWall documentation.
-
Log in to your SonicWall device. You need administrator privileges to perform the configuration.
-
Register the address of your AxoRouter as an Address Object.
-
Select MENU > OBJECT.
-
Select Match Objects > Addresses > Address objects.
-
Click Add Address.
-
Configure the following settings:
- Name: Enter a name for the AxoRouter, for example,
AxoRouter. - Zone Assignment: Select the correct zone.
- Type: Select Host.
- IP Address: Enter the IP address of your AxoRouter:
%axorouter-ip%
- Name: Enter a name for the AxoRouter, for example,
-
Click Save.
-
-
Set your AxoRouter as a syslog server.
-
Navigate to Device > Log > Syslog.
-
Select the Syslog Servers tab.
-
Click Add.
-
Configure the following options:
- Name or IP Address: Select the Address Object of AxoRouter.
- Server Type: Select Syslog Server.
- Syslog Format: Select Enhanced.
If your Syslog server does not use default port 514, type the port number in the Port field.
By default, AxoRouter accepts data on the following ports (unless you’ve modified the default connector rules):
- 514 UDP and TCP for RFC3164 (BSD-syslog) and RFC5424 (IETF-syslog) formatted traffic. AxoRouter automatically recognizes and handles both formats.
- 601 TCP for RFC5424 (IETF-syslog) and RFC3164 (BSD-syslog) formatted traffic. AxoRouter automatically recognizes and handles both formats.
- 6514 TCP for TLS-encrypted syslog traffic.
- 4317 TCP for OpenTelemetry log data.
To receive data on other ports or other protocols, configure other connector rules for the AxoRouter host.
For TLS-encrypted syslog connections, create a new connector rule or edit an existing one, and configure the keys and certificates needed to encrypt the connections. For details, see Syslog.
Note Make sure to enable the ports you’re using on the firewall of your host.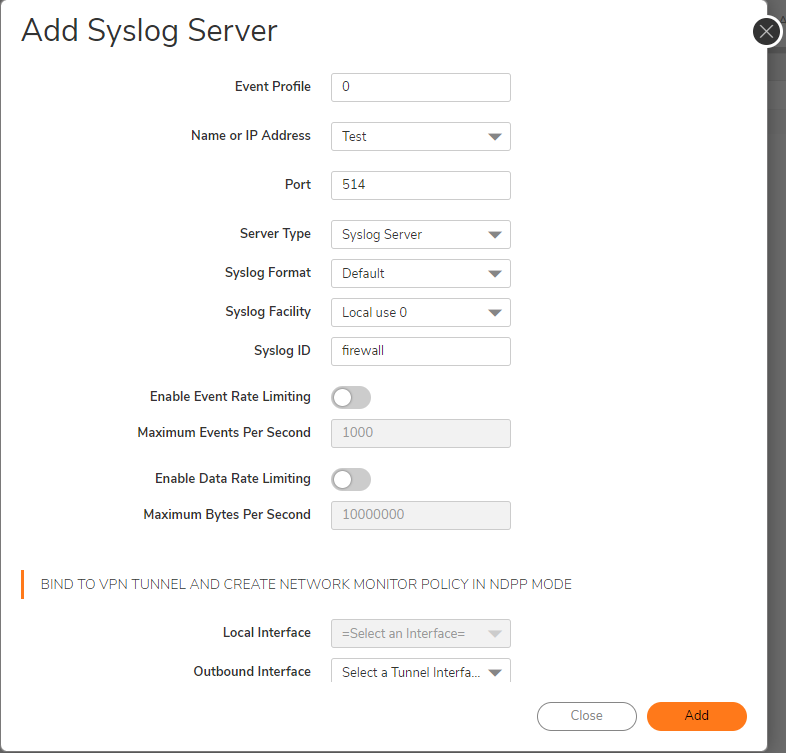
-
-
Add the source to AxoConsole.
-
Open the AxoConsole and select Topology.
-
Select Add Item > Source.
-
If the source is actively sending data to an AxoRouter instance, select Detected, then select your source.
-
Otherwise, select the vendor and product corresponding to your source from the Predefined sources, then enter the parameters of the source, like IP address and FQDN.
Note During log tapping, you can add hosts that are actively sending data to an AxoRouter instance by clicking Register source. -
-
(Optional) Add custom labels as needed.
-
Select Add.
-
Steps for SonicOS 6.x
Note: The steps involving the SonicWall user interface are just for your convenience, for details, see the official SonicWall documentation.
-
Log in to your SonicWall device. You need administrator privileges to perform the configuration.
-
Register the address of your AxoRouter as an Address Object.
-
Select MANAGE > Policies > Objects > Address Objects.
-
Click Add.
-
Configure the following settings:
- Name: Enter a name for the AxoRouter, for example,
AxoRouter. - Zone Assignment: Select the correct zone.
- Type: Select Host.
- IP Address: Enter the IP address of your AxoRouter:
%axorouter-ip%
- Name: Enter a name for the AxoRouter, for example,
-
Click Add.
-
-
Set your AxoRouter as a syslog server.
-
Navigate to MANAGE > Log Settings > SYSLOG.
-
Click ADD.
-
Configure the following options:
- Syslog ID: Enter an ID for the firewall. This ID will be used as the hostname in the log messages.
- Name or IP Address: Select the Address Object of AxoRouter.
- Server Type: Select Syslog Server.
- Enable the Enhanced Syslog Fields Settings.
-
Click OK.
-
-
Add the source to AxoConsole.
-
Open the AxoConsole and select Topology.
-
Select Add Item > Source.
-
If the source is actively sending data to an AxoRouter instance, select Detected, then select your source.
-
Otherwise, select the vendor and product corresponding to your source from the Predefined sources, then enter the parameters of the source, like IP address and FQDN.
Note During log tapping, you can add hosts that are actively sending data to an AxoRouter instance by clicking Register source. -
-
(Optional) Add custom labels as needed.
-
Select Add.
-
Labels
Axoflow automatically adds the following labels to data collected from this source:
| Analytics label | Message field | value |
|---|---|---|
vendor |
meta.vendor |
dell |
product |
meta.product |
sonicwall |
You can use the labels as:
- Filter labels on the Analytics page,
- in the Filter By Label field during log tapping.
You can use the message fields
- in Flow Processing steps, for example, in the Query field of Select Messages steps,
- in AQL expressions in the search bars.
Sending data to Splunk
When sending the data collected from this source to Splunk, Axoflow uses the following sourcetype and index settings:
| sourcetype | index |
|---|---|
dell:sonicwall |
netfw |
Tested with: Dell SonicWall Add-on for Splunk technical add-on
Sending data to Google SecOps
When sending the data collected from this source to a dynamic Google SecOps destination, Axoflow sets the following log type: SONIC_FIREWALL.
9.41 - Splunk
9.41.1 - Heavy Forwarder
Heavy Forwarder: Receive data from Splunk.
This page describes how to configure your Splunk Heavy Forwarders to send data to AxoRouter.
Forwarding considerations
The Axoflow Forwarder Add-on works beside an existing Splunk configuration by creating an axoflow server group. Messages get cloned to the axoflow group separately during a transformation process.
The axoflow server group should not be part of the defaultGroup in the [tcpout] stanza otherwise all messages will be sent to AxoRouter twice. If the defaultGroup is not configured already, you can either:
-
Disable forwarding completely.
[tcpout] defaultGroup = NoForward -
Use a specific default group. For example, use
default-autolb-group, as servers added through the UI will be part of it by default.[tcpout] defaultGroup = default-autolb-group
Prerequisites
- Once you made sure
defaultGroupis configured correctly, you’ll need to install the Axoflow Forwarder Add-on on your Heavy Forwarders. Currently, you can request the add-on directly from Axoflow. Contact our support team for details. -
You know the IP address the AxoRouter. To find it:
- Open the AxoConsole.
- Select the Routers or the Topology page.
- Select on AxoRouter instance that is going to receive the logs.
- Check the Networks > Address field.
Steps
To configure your Splunk Heavy Forwarders to send data to AxoRouter. Complete the following steps.
-
Create a new Syslog Connector rule with the following parameters:
-
Select Routers > Add Rule > Syslog > Custom
-
Enter
splunk-hfinto the Rule Name field.
-
Set the Router Selector so it matches the AxoRouter instances where your Splunk Heavy Forwarders will be forwarding their data. If you leave the Router Selector field empty, the rule will match all AxoRouters.
You can use any labels and metadata of the AxoRouter hosts in the Router selectors, for example, the hostname of the AxoRouter, or any custom labels.
- If you leave the Router Selector field empty, the selector will match every AxoRouter instance.
- To select only a specific AxoRouter instance, set the
namefield to the name of the instance as selector. For example,name = my-axorouter. - If you set multiple fields in the selector, the selector will match only AxoRouter instances that match all elements of the selector. (There in an AND relationship between the fields.)
-
In the Preprocessing steps section, enable Classify.

-
In the Syslog settings section:
- Select the TCP protocol.
- Select NUL terminated framing.
- Enter 9900 into the Port field.
-
Select Add.
-
-
Install the Axoflow Forwarder Add-on you’ve received from the Axoflow Support Team on your Splunk Heavy Forwarders.
-
Configure name resolution for the
axorouterhost by completing one of the following:-
Add
axorouterto the/etc/hostsfile to resolve to the IP address of your AxoRouter instance where this host is sending data. -
Alternatively, you can add the following snippet to your
/opt/splunk/etc/system/local/outputs.conffile:[tcpout:axoflow] server = <AXOROUTER_IP1>:9900, <AXOROUTER_IP2>:9900 # configure maxQueueSize to allow for a temporary in-memory buffer if the destination is slow or unavailable # maxQueueSize = 100MB # configure a persistentQueueSize to allow for data to be queued on disk if the destination is slow or unavailable # persistentQueueSize = 1GBNote that if you set multiple AxoRouters in the
serverfield, the forwarder will load-balance among them.Configure either in-memory (
maxQueueSize) or on-disk (persistentQueueSize) queueing to avoid data loss in case the destination is slow or unavailable.
-
-
Install the Axoflow Forwarder Add-on using the Splunk UI.
-
Restart
splunkd.
-
-
Add the source to AxoConsole.
-
Open the AxoConsole and select Topology.
-
Select Add Item > Source.
-
If the source is actively sending data to an AxoRouter instance, select Detected, then select your source.
-
Otherwise, select the vendor and product corresponding to your source from the Predefined sources, then enter the parameters of the source, like IP address and FQDN.
Note During log tapping, you can add hosts that are actively sending data to an AxoRouter instance by clicking Register source. -
-
(Optional) Add custom labels as needed.
-
Select Add.
-
Classification on AxoRouter
Note that when AxoRouter receives logs from Splunk HF using the Axoflow Forwarder Add-on:
- If classification is disabled on AxoRouter, the original source, sourcetype, index, timestamp and host metadata are preserved.
- If classification is enabled, then a successful classification overrides the sourcetype and the index, while the timestamp and host are overwritten if the original message contains these more specific information.
- If you want to disable the automatic classification on AxoRouter for certain messages received from the Axoflow Forwarder Add-on, add a Condition to the Classify processing step in the related flow, so the Condition won’t match the sourcetype. For example:
meta.envelope.splunk.sourcetype != your-sourcetype
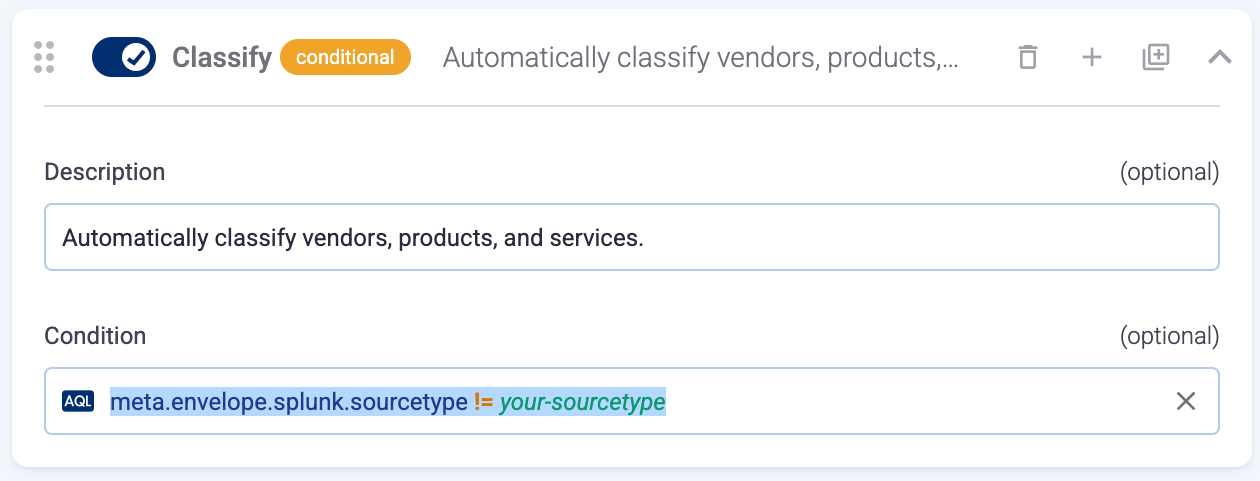
9.42 - Superna
9.42.1 - Eyeglass
Eyeglass: Manages and automates data protection, DR, and reporting for PowerScale environments.
The following sections show you how to configure Superna Eyeglass to send their log data to Axoflow.
CAUTION:
Make sure to set data forwarding on your appliances/servers as described in this guide. Different settings like alternate message formats or ports might be valid, but can result in data loss or incorrect parsing.Prerequisites
- You have administrative access to Superna Eyeglass.
- You have an AxoRouter deployed and configured with a webhook connector. This device is going to receive the data from Superna Eyeglass.
-
You know the IP address the AxoRouter. To find it:
- Open the AxoConsole.
- Select the Routers or the Topology page.
- Select on AxoRouter instance that is going to receive the logs.
- Check the Networks > Address field.
Steps
Note: The steps involving the Superna Eyeglass user interface are just for your convenience, for details, see the official documentation.
-
Log in to Ransomware Defender and open the Zero Trust menu.
-
Click the plus sign to add a webhook target.
-
Set the parameters of the webhook.
- Name: Enter a name for the webhook, for example,
Axoflow. - URL: Enter the URL of the webhook connector of the AxoRouter instance where you want to post messages.
- Event Severity Filter: Select the severities of the events that you want to forward to the webhook.
- Lifecycle filter: Select the lifecycle changes that trigger a post message to the webhook.
- Name: Enter a name for the webhook, for example,
-
Click Save, then the Test webhooks button. This will send a post message with a sample payload.
-
Add the source to AxoConsole.
-
Open the AxoConsole and select Topology.
-
Select Add Item > Source.
-
If the source is actively sending data to an AxoRouter instance, select Detected, then select your source.
-
Otherwise, select the vendor and product corresponding to your source from the Predefined sources, then enter the parameters of the source, like IP address and FQDN.
Note During log tapping, you can add hosts that are actively sending data to an AxoRouter instance by clicking Register source. -
-
(Optional) Add custom labels as needed.
-
Select Add.
-
Labels
Axoflow automatically adds the following labels to data collected from this source:
| Analytics label | Message field | value |
|---|---|---|
vendor |
meta.vendor |
superna |
product |
meta.product |
eyeglass |
You can use the labels as:
- Filter labels on the Analytics page,
- in the Filter By Label field during log tapping.
You can use the message fields
- in Flow Processing steps, for example, in the Query field of Select Messages steps,
- in AQL expressions in the search bars.
Sending data to Splunk
When sending the data collected from this source to Splunk, Axoflow uses the following sourcetype and index settings:
| sourcetype | index |
|---|---|
superna:eyeglass |
main |
Sending data to Google SecOps
When sending the data collected from this source to a dynamic Google SecOps destination, Axoflow sets the following log type: SUPERNA_EYEGLASS.
9.43 - syslog-ng
By default, Axoflow treats syslog-ng sources as a generic syslog source.
- The easiest way to send data from syslog-ng to Axoflow is to configure it to send data to an AxoRouter instance using the syslog protocol.
- If you’re using syslog-ng Open Source Edition version 4.4 or newer, use the
syslog-ng-otlp()driver to send data to AxoRouter using the OpenTelemetry Protocol.
Note that even if syslog-ng is acting as a relay (receiving data from other clients and forwarding them to AxoRouter), on the Topology page it will be displayed as a data source.
Prerequisites
- You have administrative access to the device running syslog-ng.
- The date, time, and time zone are correctly set on the appliance.
- You have an AxoRouter deployed and configured with a Syslog connector that has parsing and classification enabled (by default, every AxoRouter has such connectors). This device is going to receive the data from the source.
-
You know the IP address the AxoRouter. To find it:
- Open the AxoConsole.
- Select the Routers or the Topology page.
- Select on AxoRouter instance that is going to receive the logs.
- Check the Networks > Address field.
Note
To receive more detailed metrics about the data processed by syslog-ng, consider onboarding the host into Axoflow and instrumenting its configuration.
9.44 - Thales
9.44.1 - Vormetric Data Security Platform
Vormetric Data Security Platform: Provides data encryption, key management, and access controls across cloud and on-premise environments.
To onboard such a source to Axoflow, complete the generic appliance onboarding steps.
Labels
Axoflow automatically adds the following labels to data collected from this source:
| Analytics label | Message field | value |
|---|---|---|
vendor |
meta.vendor |
thales |
product |
meta.product |
vormetric |
service |
meta.service.name |
vee-FS |
You can use the labels as:
- Filter labels on the Analytics page,
- in the Filter By Label field during log tapping.
You can use the message fields
- in Flow Processing steps, for example, in the Query field of Select Messages steps,
- in AQL expressions in the search bars.
Sending data to Splunk
When sending the data collected from this source to Splunk, Axoflow uses the following sourcetype and index settings:
| sourcetype | index |
|---|---|
thales:vormetric |
netauth |
Sending data to Google SecOps
When sending the data collected from this source to a dynamic Google SecOps destination, Axoflow sets the following log type: VORMETRIC.
9.45 - Trellix
9.45.1 - Central Management System (CMS)
Central Management System (CMS): Centralized policy and configuration management platform for Trellix security products.
To onboard such a source to Axoflow, complete the generic appliance onboarding steps.
Labels
Axoflow automatically adds the following labels to data collected from this source:
| Analytics label | Message field | value |
|---|---|---|
vendor |
meta.vendor |
trellix |
product |
meta.product |
cms |
service |
meta.service.name |
fenotify |
You can use the labels as:
- Filter labels on the Analytics page,
- in the Filter By Label field during log tapping.
You can use the message fields
- in Flow Processing steps, for example, in the Query field of Select Messages steps,
- in AQL expressions in the search bars.
Sending data to Splunk
When sending the data collected from this source to Splunk, Axoflow uses the following sourcetype and index settings:
| sourcetype | source | index |
|---|---|---|
trellix:cms |
trellix:cms |
netops |
Sending data to Google SecOps
When sending the data collected from this source to a dynamic Google SecOps destination, Axoflow sets the following log type: FIREEYE_CMS.
9.45.2 - Email Threat Prevention (ETP)
Email Threat Prevention (ETP): Analyzes and filters email traffic to block phishing, malware, and targeted email-based threats.
To onboard such a source to Axoflow, complete the generic appliance onboarding steps.
Labels
Axoflow automatically adds the following labels to data collected from this source:
| Analytics label | Message field | value |
|---|---|---|
vendor |
meta.vendor |
trellix |
product |
meta.product |
etp |
You can use the labels as:
- Filter labels on the Analytics page,
- in the Filter By Label field during log tapping.
You can use the message fields
- in Flow Processing steps, for example, in the Query field of Select Messages steps,
- in AQL expressions in the search bars.
Sending data to Splunk
When sending the data collected from this source to Splunk, Axoflow uses the following sourcetype and index settings:
| sourcetype | index |
|---|---|
fe_etp |
fireeye |
Sending data to Google SecOps
When sending the data collected from this source to a dynamic Google SecOps destination, Axoflow sets the following log type: FIREEYE_ETP.
9.45.3 - Endpoint Security (HX)
Endpoint Security (HX): Detects and responds to advanced threats on endpoints using behavior-based analysis and threat intel.
To onboard such a source to Axoflow, complete the generic appliance onboarding steps.
Note that the device can be configured to send logs formatted as JSON or CEF. AxoRouter can automatically parse all flavors.
Labels
Axoflow automatically adds the following labels to data collected from this source:
| Analytics label | Message field | value |
|---|---|---|
vendor |
meta.vendor |
trellix |
product |
meta.product |
hx |
service |
meta.service.name |
cef, fenotify |
You can use the labels as:
- Filter labels on the Analytics page,
- in the Filter By Label field during log tapping.
You can use the message fields
- in Flow Processing steps, for example, in the Query field of Select Messages steps,
- in AQL expressions in the search bars.
Sending data to Splunk
When sending the data collected from this source to Splunk, Axoflow uses the following sourcetype and index settings:
| sourcetype | index |
|---|---|
hx_json |
fireeye |
fe_json |
fireeye |
hx_cef_syslog |
fireeye |
Tested with: FireEye Add-on for Splunk Enterprise
Sending data to Google SecOps
When sending the data collected from this source to a dynamic Google SecOps destination, Axoflow sets the following log type: FIREEYE_HX.
Earlier name/vendor
FireEye Endpoint Security (HX)
9.45.4 - ePolicy Orchestrator (EPO)
ePolicy Orchestrator (EPO): Analyzes and filters email traffic to block phishing, malware, and targeted email-based threats.
To onboard such a source to Axoflow, complete the generic appliance onboarding steps.
Labels
Axoflow automatically adds the following labels to data collected from this source:
| Analytics label | Message field | value |
|---|---|---|
vendor |
meta.vendor |
trellix |
product |
meta.product |
epo |
You can use the labels as:
- Filter labels on the Analytics page,
- in the Filter By Label field during log tapping.
You can use the message fields
- in Flow Processing steps, for example, in the Query field of Select Messages steps,
- in AQL expressions in the search bars.
Sending data to Splunk
When sending the data collected from this source to Splunk, Axoflow uses the following sourcetype and index settings:
| sourcetype | index | source |
|---|---|---|
mcafee:epo:syslog |
epav |
trellix_endpoint_security |
Sending data to Google SecOps
When sending the data collected from this source to a dynamic Google SecOps destination, Axoflow sets the following log type: MCAFEE_EPO.
Earlier name/vendor
McAfee ePolicy Ochestrator (EPO)
9.45.5 - MPS
MPS: Appliance for detecting and blocking advanced threats through inline malware inspection.
To onboard such a source to Axoflow, complete the generic appliance onboarding steps.
Labels
Axoflow automatically adds the following labels to data collected from this source:
| Analytics label | Message field | value |
|---|---|---|
vendor |
meta.vendor |
trellix |
product |
meta.product |
mps |
You can use the labels as:
- Filter labels on the Analytics page,
- in the Filter By Label field during log tapping.
You can use the message fields
- in Flow Processing steps, for example, in the Query field of Select Messages steps,
- in AQL expressions in the search bars.
Sending data to Splunk
When sending the data collected from this source to Splunk, Axoflow uses the following sourcetype and index settings:
| sourcetype | source | index |
|---|---|---|
trellix:mps |
trellix:mps |
netops |
9.46 - Trend Micro
9.46.1 - Deep Security Agent
Deep Security Agent: Provides anti-malware, intrusion prevention, and log inspection for cloud and on-prem servers.
To onboard such a source to Axoflow, complete the generic appliance onboarding steps.
Labels
Axoflow automatically adds the following labels to data collected from this source:
| Analytics label | Message field | value |
|---|---|---|
vendor |
meta.vendor |
trend-micro |
product |
meta.product |
deep-security-agent |
You can use the labels as:
- Filter labels on the Analytics page,
- in the Filter By Label field during log tapping.
You can use the message fields
- in Flow Processing steps, for example, in the Query field of Select Messages steps,
- in AQL expressions in the search bars.
Sending data to Splunk
When sending the data collected from this source to Splunk, Axoflow uses the following sourcetype and index settings:
| sourcetype | index |
|---|---|
deepsecurity |
epintel |
deepsecurity-system_events |
epintel |
deepsecurity-intrusion_prevention |
epintel |
deepsecurity-firewall |
epintel |
deepsecurity-antimalware |
epintel |
deepsecurity-integrity_monitoring |
epintel |
deepsecurity-log_inspection |
epintel |
deepsecurity-web_reputation |
epintel |
deepsecurity-app_control |
epintel |
deepsecurity-system_events |
epintel |
Sending data to Google SecOps
When sending the data collected from this source to a dynamic Google SecOps destination, Axoflow sets the following log type: TRENDMICRO_DEEP_SECURITY.
9.47 - Ubiquiti
9.47.1 - Unifi
Unifi: Manages network devices including routers, switches, and access points with centralized control.
To onboard such a source to Axoflow, complete the generic appliance onboarding steps.
Labels
Axoflow automatically adds the following labels to data collected from this source:
| Analytics label | Message field | value |
|---|---|---|
vendor |
meta.vendor |
ubiquiti |
product |
meta.product |
unifi |
service |
meta.service.name |
crond, logread, kernel, mcad, switch, UDMPRO |
You can use the labels as:
- Filter labels on the Analytics page,
- in the Filter By Label field during log tapping.
You can use the message fields
- in Flow Processing steps, for example, in the Query field of Select Messages steps,
- in AQL expressions in the search bars.
Sending data to Splunk
When sending the data collected from this source to Splunk, Axoflow uses the following sourcetype and index settings:
| sourcetype | index |
|---|---|
ubnt |
netops |
ubnt:cef |
netops |
ubnt:dhcp |
netops |
ubnt:dnsmasq |
netops |
ubnt:edgeswitch |
netops |
ubnt:hostapd |
netops |
ubnt:link |
netops |
ubnt:mcad |
netops |
ubnt:sudo |
netops |
ubnt:wireless |
netops |
ubnt:fw |
netfw |
ubnt:fw:cef |
netfw |
Sending data to Google SecOps
When sending the data collected from this source to a dynamic Google SecOps destination, Axoflow sets the following log type: UBIQUITI_SWITCH.
9.48 - Varonis
9.48.1 - DatAdvantage
DatAdvantage: Monitors data access and permissions to detect insider threats and automate compliance reporting.
To onboard such a source to Axoflow, complete the generic appliance onboarding steps.
Labels
Axoflow automatically adds the following labels to data collected from this source:
| Analytics label | Message field | value |
|---|---|---|
vendor |
meta.vendor |
varonis |
product |
meta.product |
datadvantage |
You can use the labels as:
- Filter labels on the Analytics page,
- in the Filter By Label field during log tapping.
You can use the message fields
- in Flow Processing steps, for example, in the Query field of Select Messages steps,
- in AQL expressions in the search bars.
Sending data to Splunk
When sending the data collected from this source to Splunk, Axoflow uses the following sourcetype and index settings:
| sourcetype | index |
|---|---|
varonis:ta |
main |
Sending data to Google SecOps
When sending the data collected from this source to a dynamic Google SecOps destination, Axoflow sets the following log type: VARONIS.
9.49 - Vectra AI
Earlier name/vendor
Vectra Cognito
9.49.1 - X-Series
X-Series: Detects and investigates cyberattacks across cloud, data center, and enterprise networks using AI.
To onboard such a source to Axoflow, complete the generic appliance onboarding steps.
Labels
Axoflow automatically adds the following labels to data collected from this source:
| Analytics label | Message field | value |
|---|---|---|
vendor |
meta.vendor |
vectra |
product |
meta.product |
x-series |
service |
meta.service.name |
vectra_cef, vectra_cef_account_detection, vectra_cef_audit |
You can use the labels as:
- Filter labels on the Analytics page,
- in the Filter By Label field during log tapping.
You can use the message fields
- in Flow Processing steps, for example, in the Query field of Select Messages steps,
- in AQL expressions in the search bars.
Sending data to Splunk
When sending the data collected from this source to Splunk, Axoflow uses the following sourcetype and index settings:
| sourcetype | index |
|---|---|
vectra:cognito:detect |
main |
vectra:cognito:accountdetect |
main |
vectra:cognito:accountscoring |
main |
vectra:cognito:audit |
main |
vectra:cognito:campaigns |
main |
vectra:cognito:health |
main |
vectra:cognito:hostscoring |
main |
vectra:cognito:accountlockdown |
main |
Sending data to Google SecOps
When sending the data collected from this source to a dynamic Google SecOps destination, Axoflow sets the following log type: VECTRA_DETECT.
9.50 - Zscaler appliances
9.50.1 - Zscaler Nanolog Streaming Service
Zscaler Nanolog Streaming Service: Cloud-based secure internet gateway that inspects traffic for threats and enforces policies.
To onboard such a source to Axoflow, complete the generic appliance onboarding steps.
Labels
Axoflow automatically adds the following labels to data collected from this source:
| Analytics label | Message field | value |
|---|---|---|
vendor |
meta.vendor |
zscaler |
product |
meta.product |
nss |
service |
meta.service.name |
ZscalerNSS |
You can use the labels as:
- Filter labels on the Analytics page,
- in the Filter By Label field during log tapping.
You can use the message fields
- in Flow Processing steps, for example, in the Query field of Select Messages steps,
- in AQL expressions in the search bars.
Sending data to Splunk
When sending the data collected from this source to Splunk, Axoflow uses the following sourcetype and index settings:
| sourcetype | index |
|---|---|
zscalernss-alerts |
netops |
zscalernss-tunnel |
netops |
zscalernss-web |
netproxy |
zscalernss-web:leef |
netproxy |
Tested with: Zscaler Technical Add-On for Splunk
Sending data to Google SecOps
When sending the data collected from this source to a dynamic Google SecOps destination, Axoflow sets the following log type: ZSCALER_INTERNET_ACCESS.
9.50.2 - Zscaler Log Streaming Service
Zscaler Log Streaming Service: Provides secure remote access to internal apps without exposing them to the public internet.
To onboard such a source to Axoflow, complete the generic appliance onboarding steps.
Labels
Axoflow automatically adds the following labels to data collected from this source:
| Analytics label | Message field | value |
|---|---|---|
vendor |
meta.vendor |
zscaler |
product |
meta.product |
lss |
You can use the labels as:
- Filter labels on the Analytics page,
- in the Filter By Label field during log tapping.
You can use the message fields
- in Flow Processing steps, for example, in the Query field of Select Messages steps,
- in AQL expressions in the search bars.
Sending data to Splunk
When sending the data collected from this source to Splunk, Axoflow uses the following sourcetype and index settings:
| sourcetype | index |
|---|---|
zscalerlss-zpa-app |
netproxy |
zscalerlss-zpa-audit |
netproxy |
zscalerlss-zpa-auth |
netproxy |
zscalerlss-zpa-bba |
netproxy |
zscalerlss-zpa-connector |
netproxy |
Tested with: Zscaler Technical Add-On for Splunk
Sending data to Google SecOps
When sending the data collected from this source to a dynamic Google SecOps destination, Axoflow sets the following log type: ZSCALER_ZPA, ZSCALER_ZPA_AUDIT.