Full Control Over Your Security Data Pipeline.
Security pipelines break quietly. Dropped packets, misconfigured sources, and silent failures go unnoticed until logs stop arriving at your SIEM. By then, the damage is done.
See everything. Know instantly.
Real-time flow analytics and a dynamic topology view give you a live map of your entire pipeline — throughput, health, and data issues visible at a glance, from edge to SIEM.
Catch problems before they catch you.
Proactive alerts for dropped packets, unavailable hosts, disk pressure, and unusual traffic patterns notify you and trigger IT workflows before failures reach your SOC.
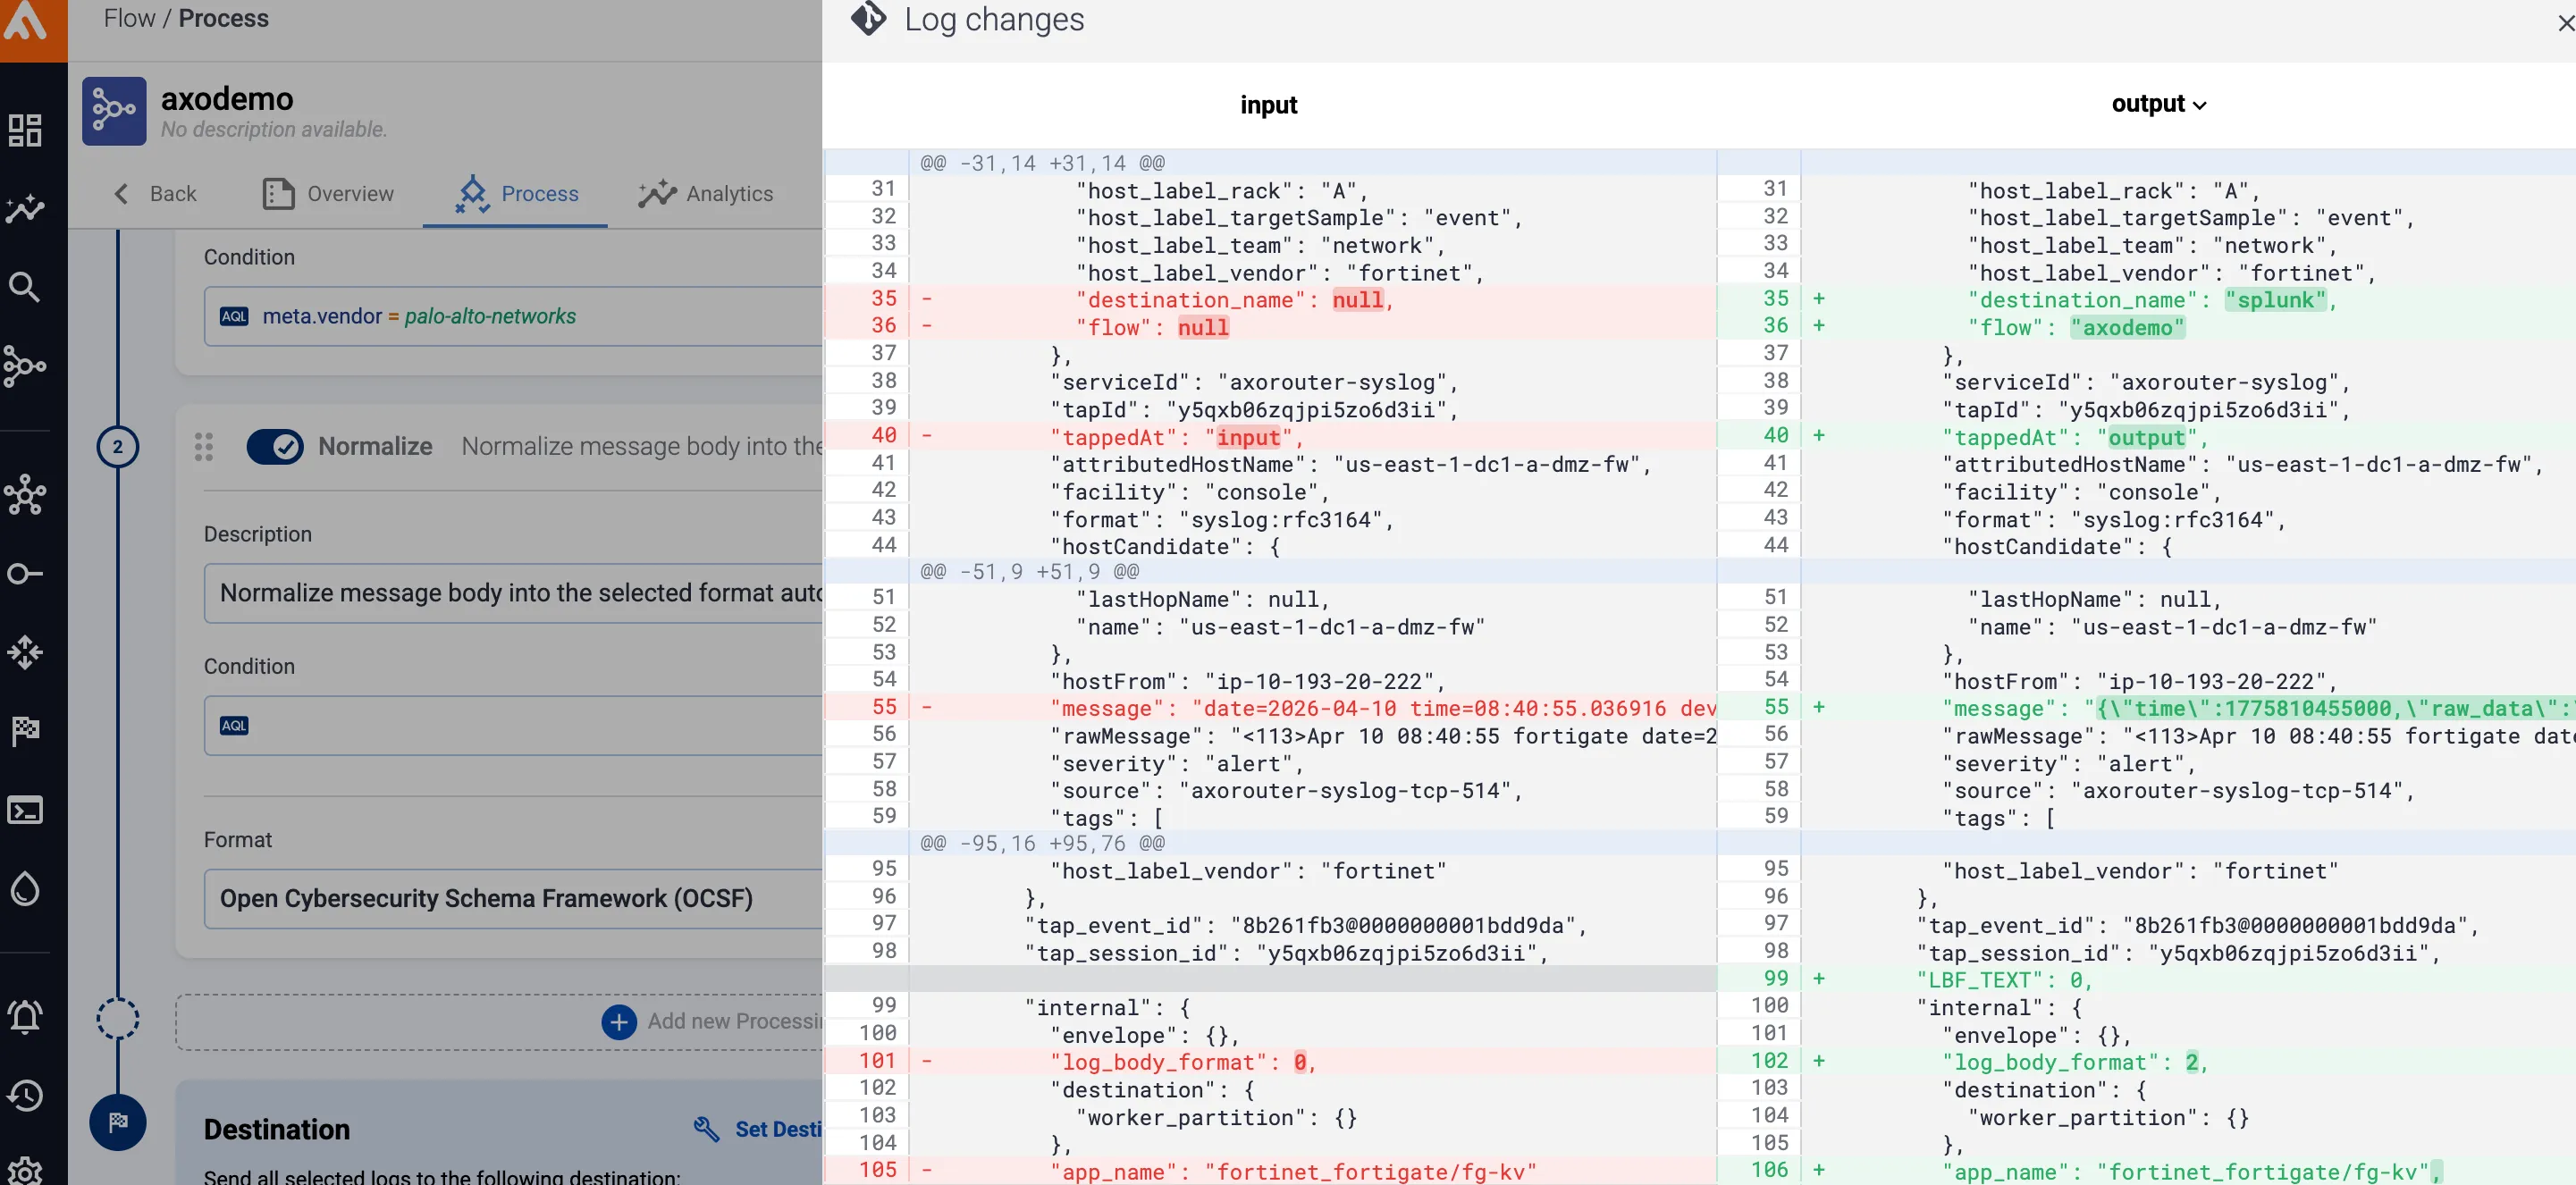
Manage everything from one place.
Configure, monitor, and troubleshoot your entire pipeline from a single web-based interface. No CLI expertise needed — any team member can operate it from day one.
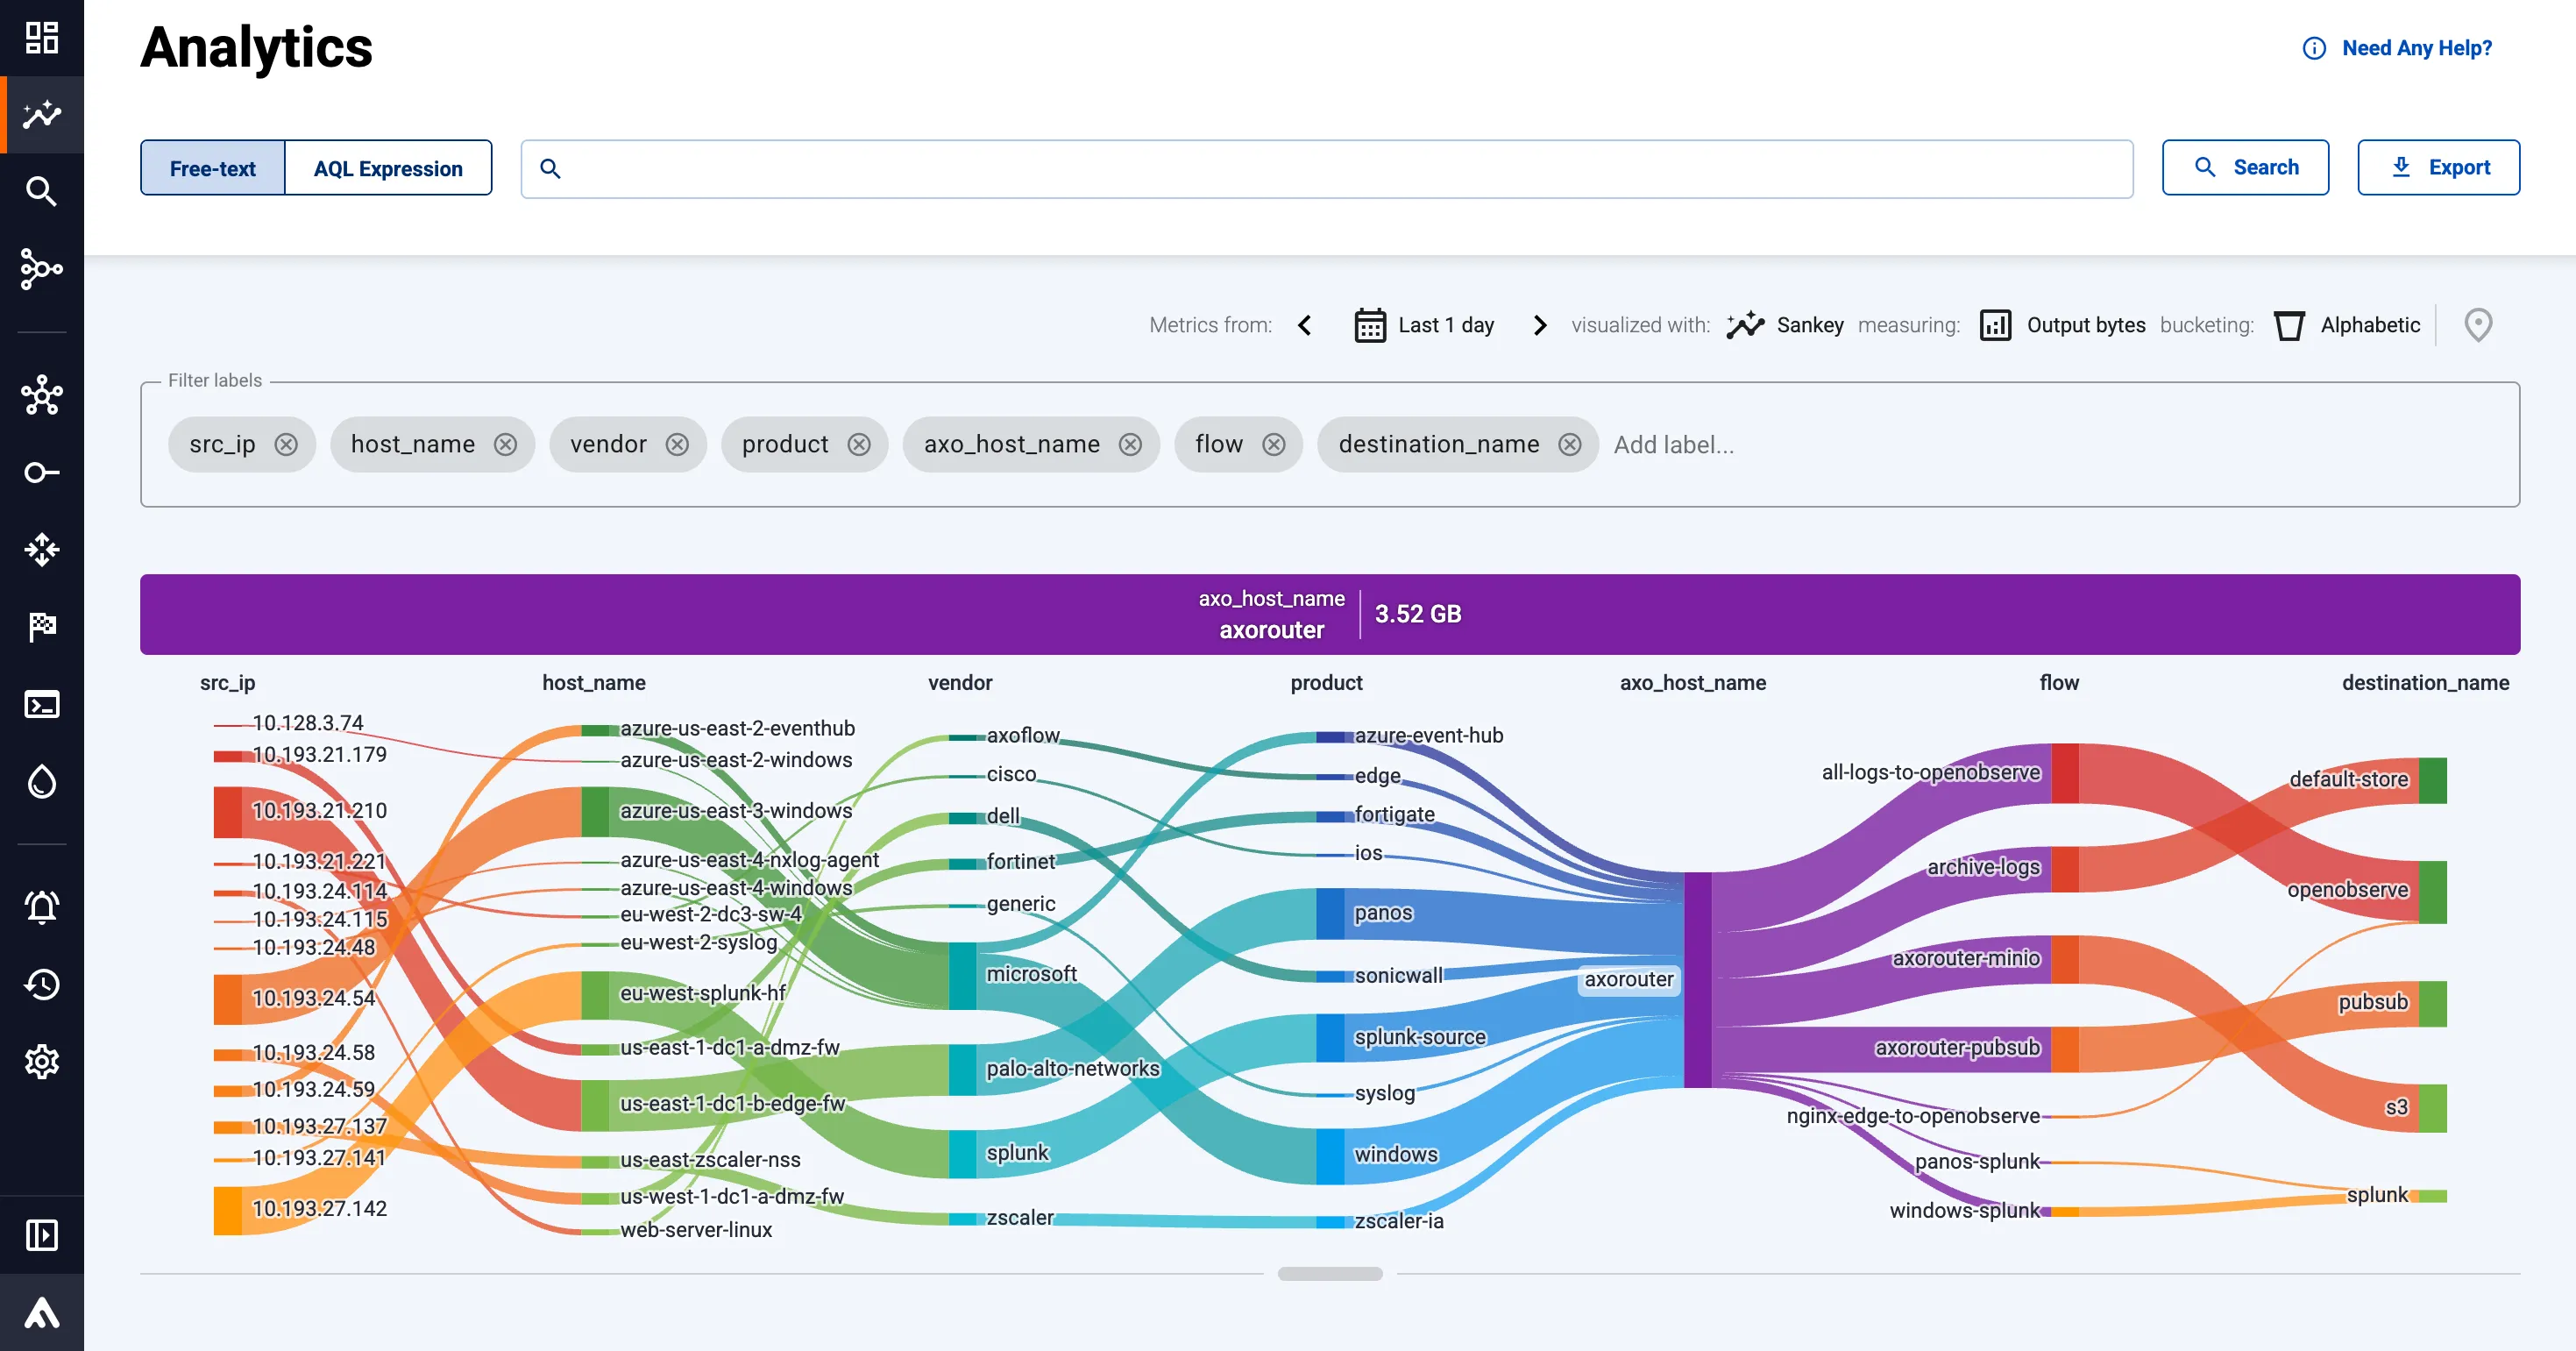
Flow Analytics
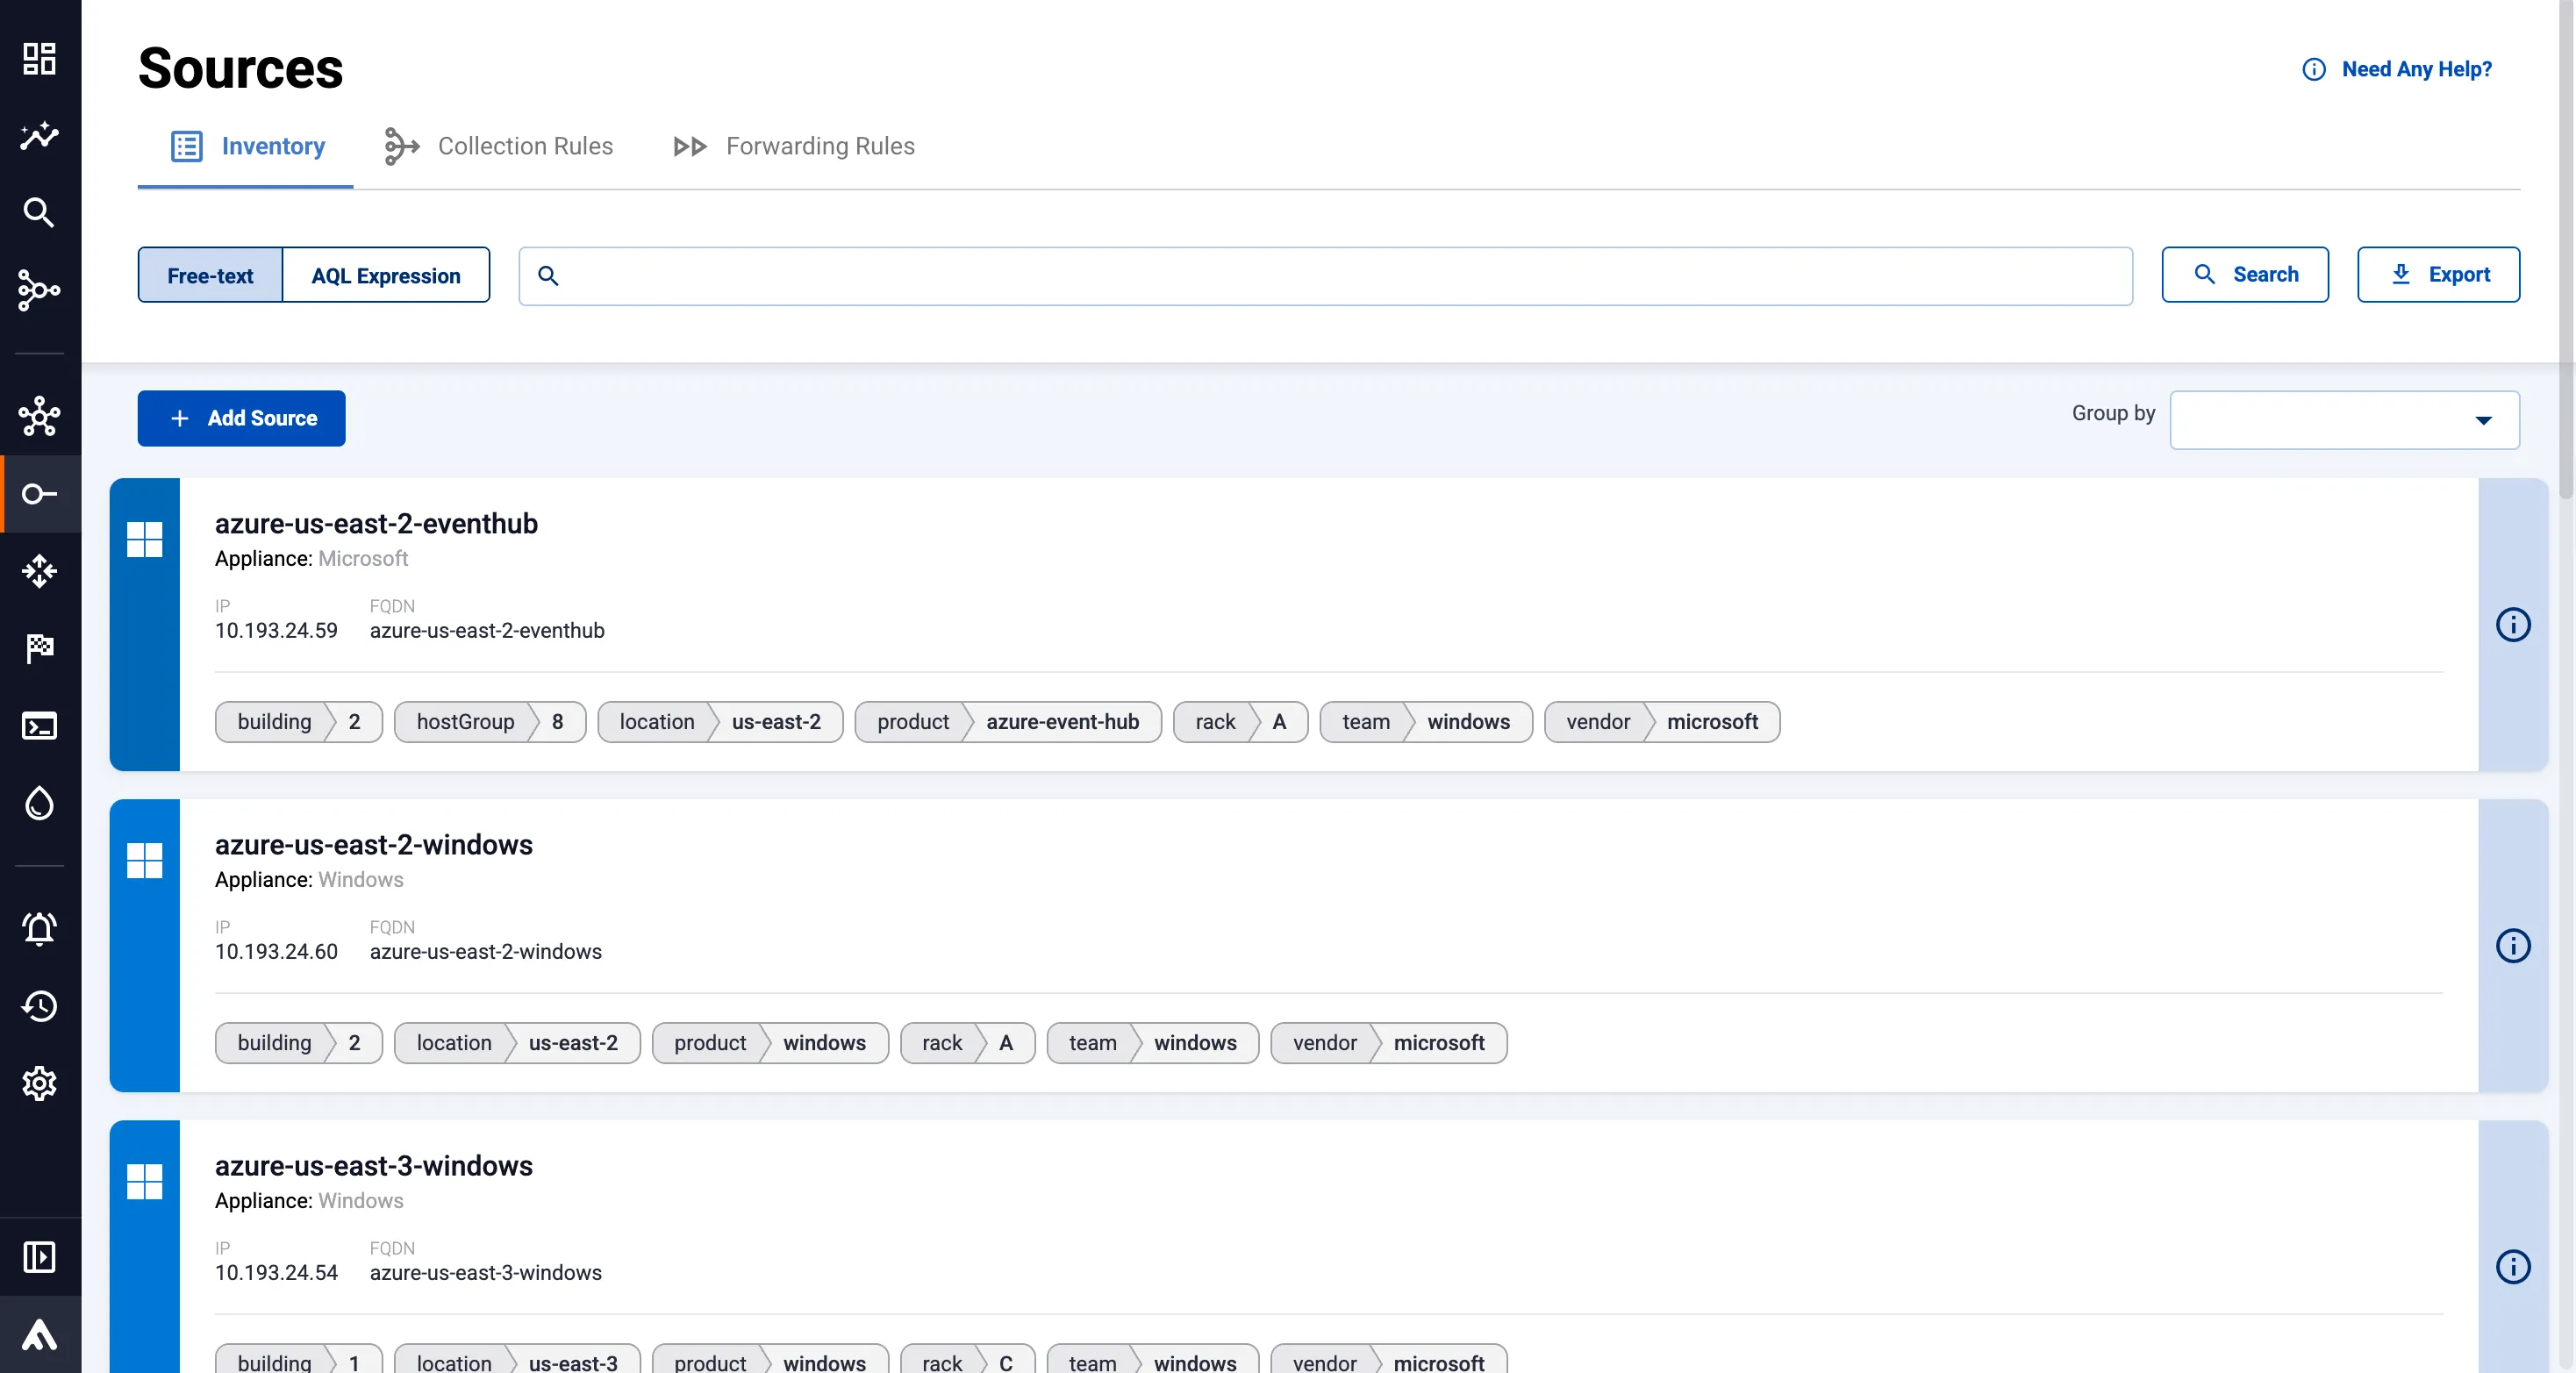
Instantly understand pipeline throughput with interactive analytics visualizations, helping you spot noisy sources, identify data issues, and access an inventory of all data as a single source of truth.
Dynamic Toplogy View
See your entire security data pipeline in one topology view. Drill into any component in near-real time to identify and resolve data transport issues before they impact operations.
Real-time Observability Metrics
Maintain full pipeline health visibility, even fully on-premises, so you can catch and resolve issues of the platform and its components.
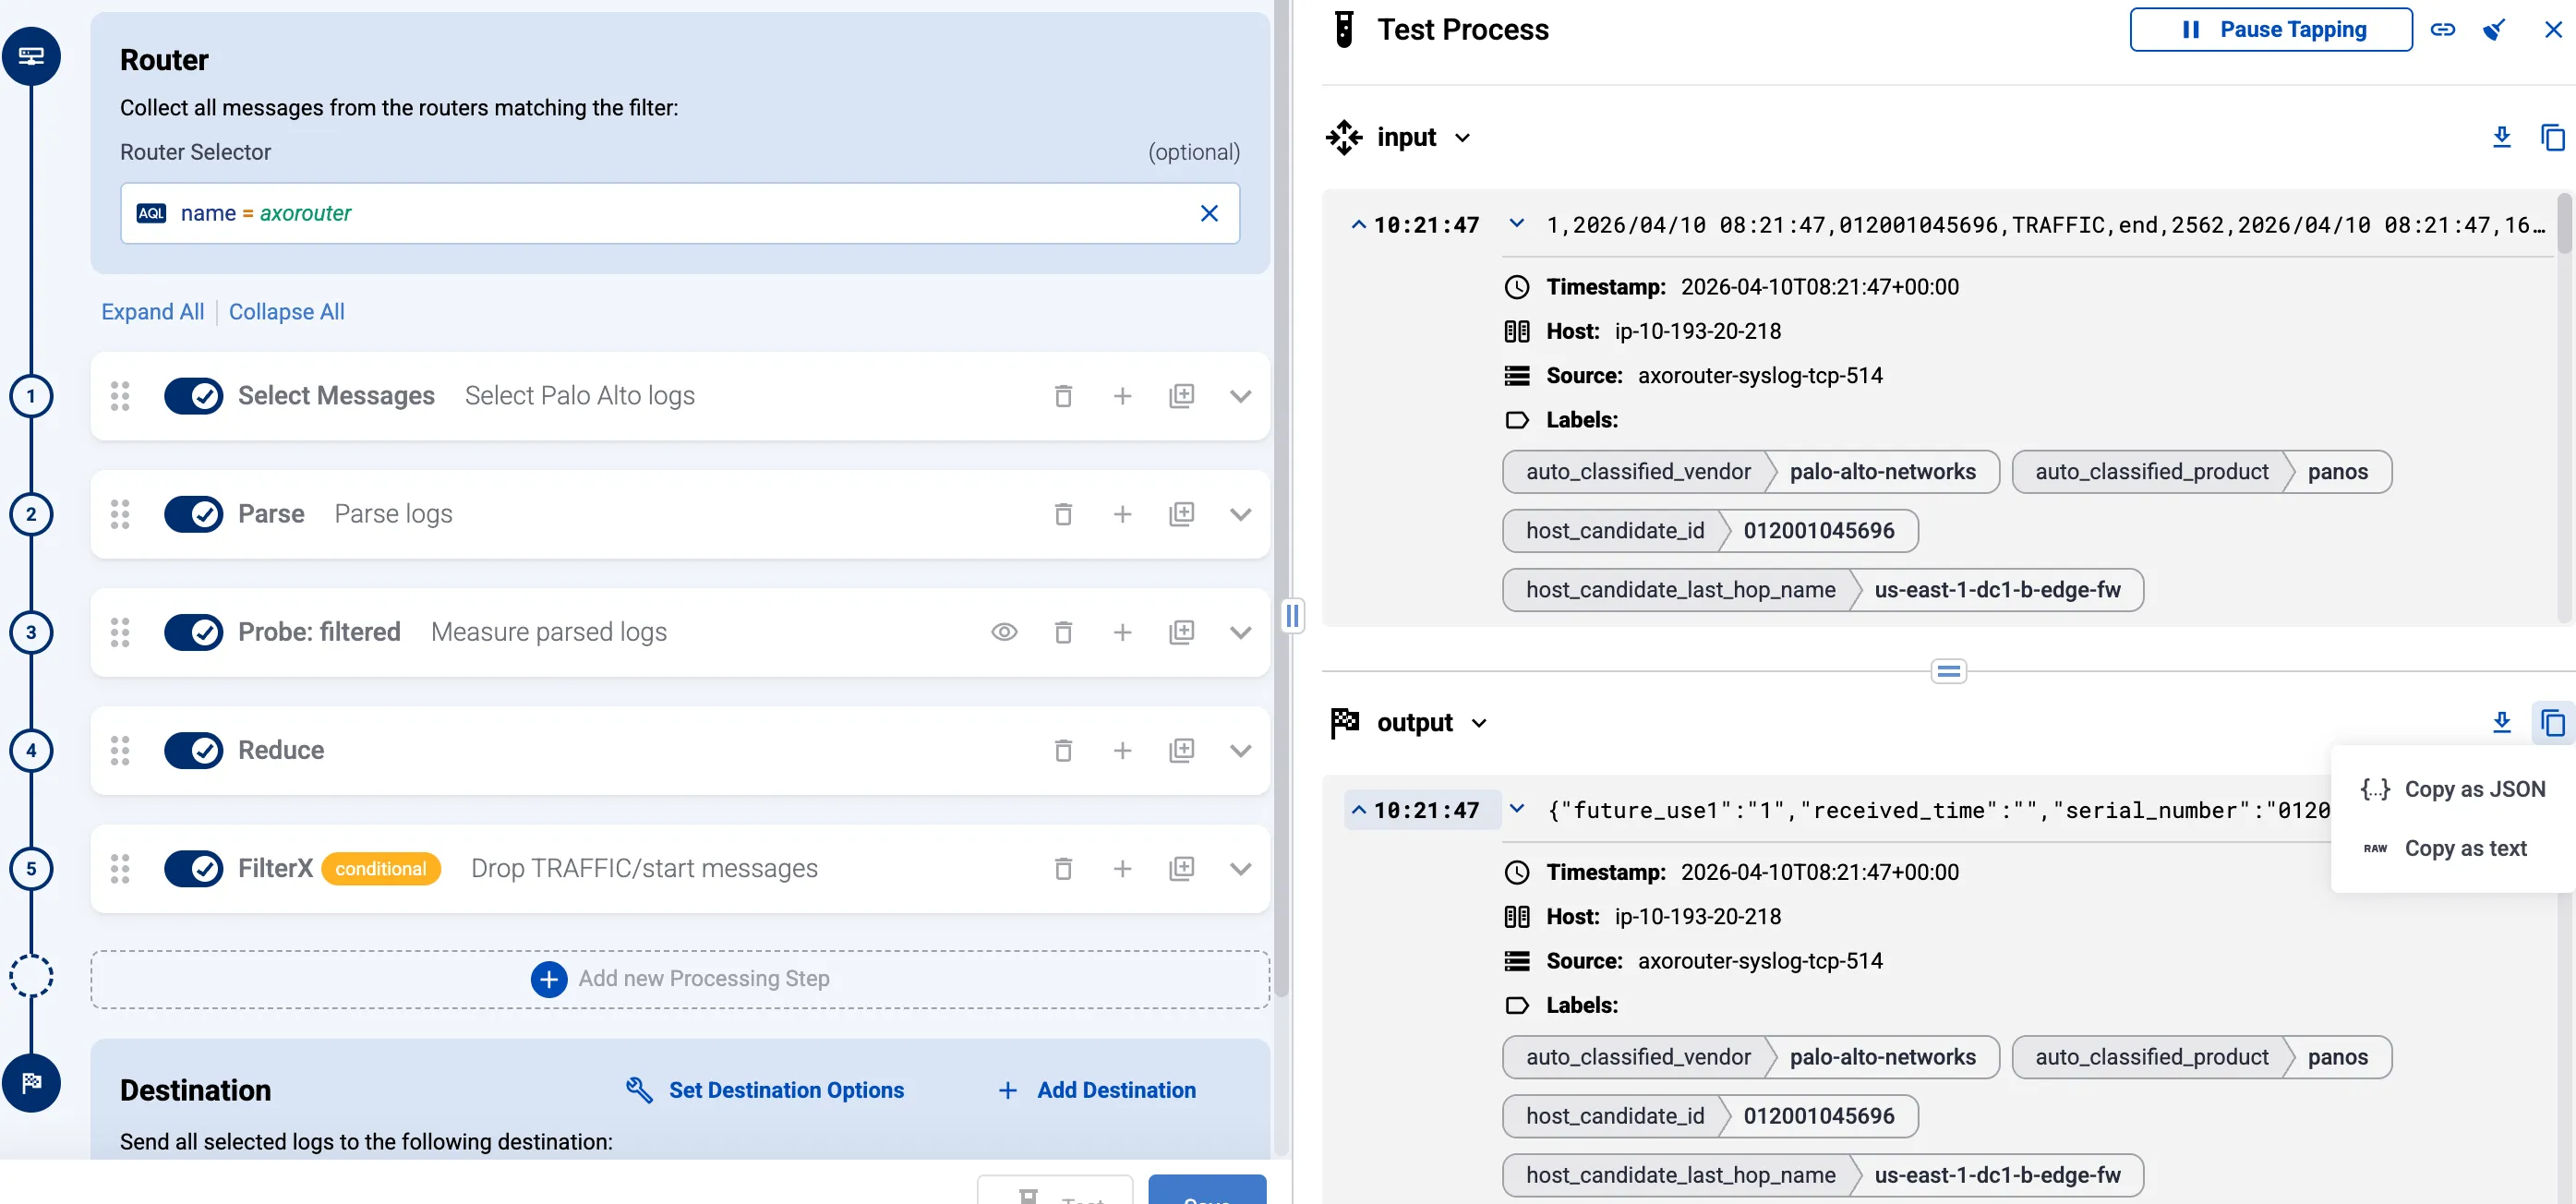
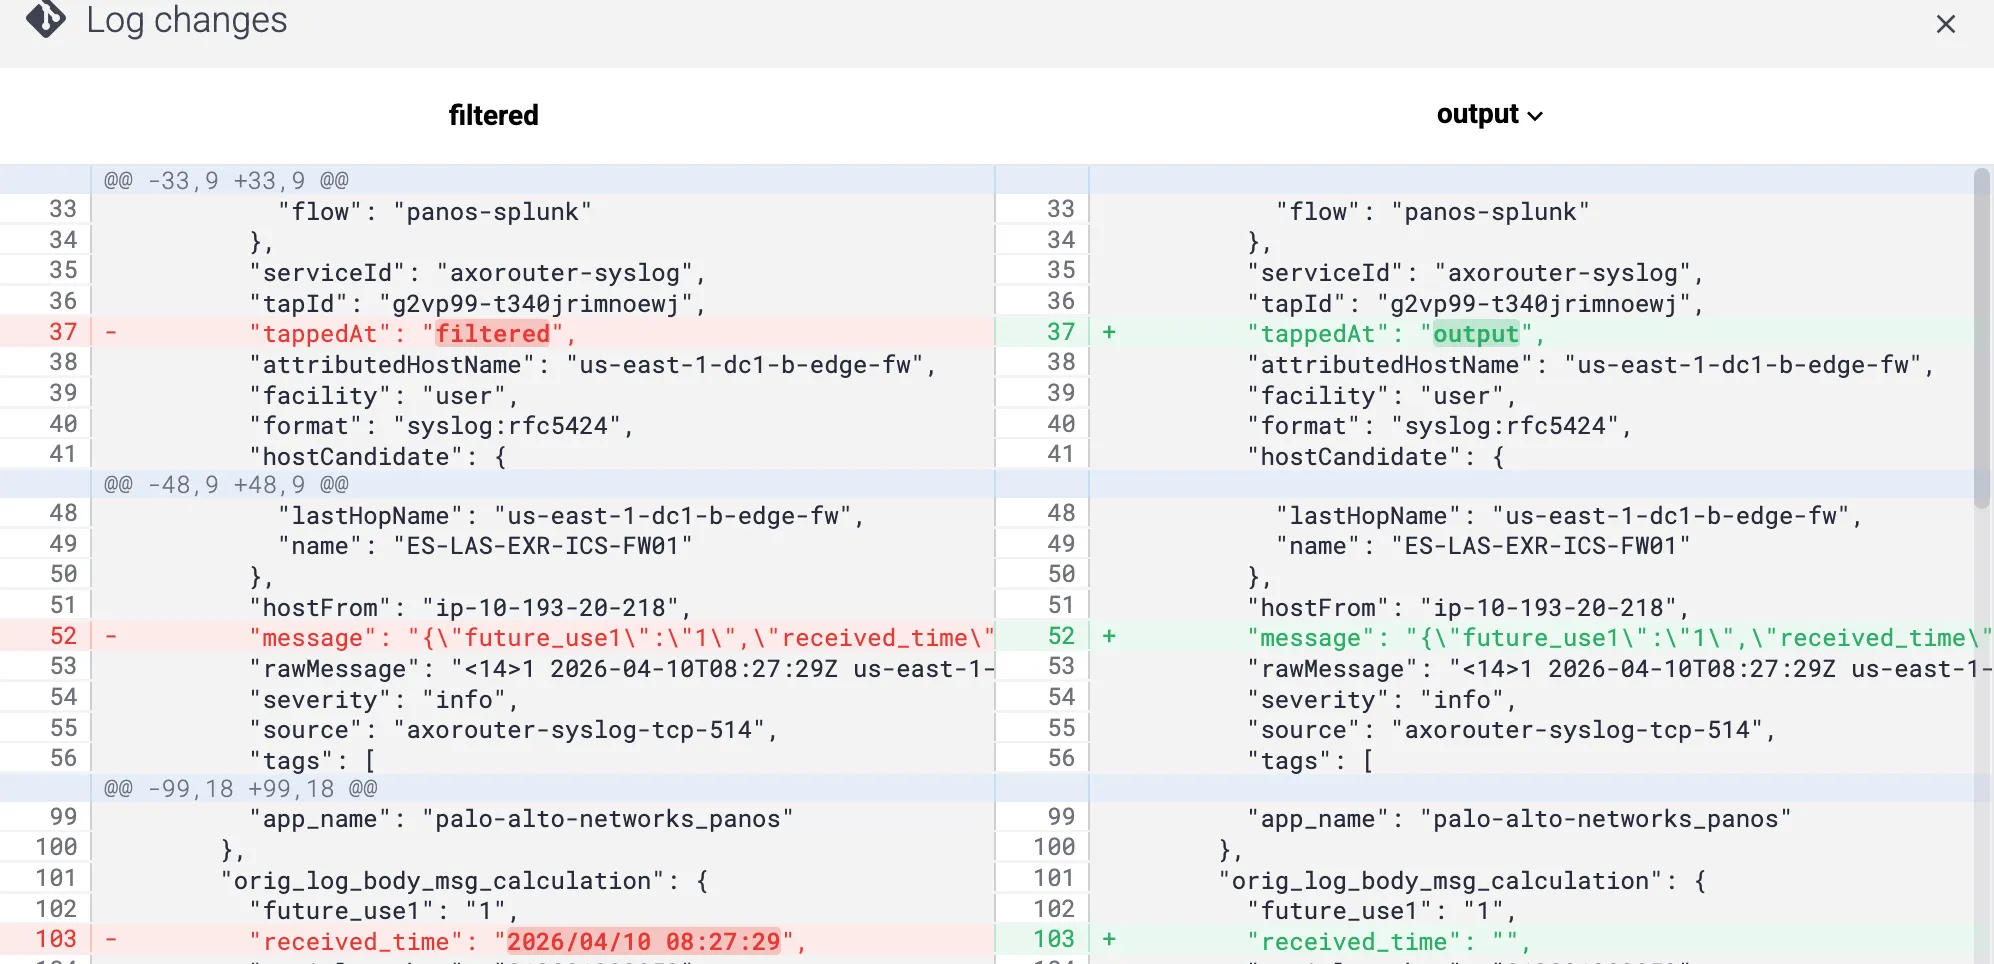
Log Tapping
Sample specific log flows using label-based filters, isolating parse errors or anomalies, without disrupting production pipelines or overwhelming analysts with noise.
Alerts
Stay ahead of pipeline failures with proactive alerts for dropped packets, unavailable hosts, disk issues, and unusual traffic patterns before they impact your security operations center. Integrate with ticketing systems to initiate IT workflows.
Easy-to-use GUI
Configure, manage, and monitor your entire data pipeline from a single web-based interface. No CLI expertise required, accelerating onboarding and reducing dependence on specialist engineers.