

Troubleshooting syslog errors with log tapping
Axoflow automatically identifies, parses, and formats the log messages of a wide range of off-the-shelf products. But if you have custom applications and are creating custom parsers, you’ll also need to debug and troubleshoot them. Axoflow has something that helps you with that – and in addition to AxoRouter and AxoSyslog, it works with syslog-ng and Splunk Connect for Syslog (SC4S) as well!
The two most common issues during log collection are handling parsing/curation errors and destination ingest (API) errors. Both of them boil down to:
- What was in the original message?
- What is sent in the final payload to the destination?
In a distributed log collection system, acquiring the raw message can be troublesome. You would start with the hosts and capture packets with tcpdump. And in those cases where you apply load balancing, you need to do that on multiple computers - simultaneously. If this wasn’t hard enough, those flows can aggregate millions of messages per second, of which you have to find the few you are looking for…
As highlighted above, inspecting the low-level details of the incoming messages, the parsing and transformations, and their delivery to the final destination in a telemetry pipeline has historically been a very tedious process. Let’s work through an example of how you can debug such errors without and with Axoflow:
Use Case 1: Parsing and Curation errors
One of the most error-prone processes is writing your own parsers and filters for custom log formats. And even if you nail the parser, there could be formatting errors on the application side as well. The question is how can you fine tune the process to catch “miss-parsed” messages and handle them in the configuration.
What would you do without Axoflow
The general approach here would be to acquire a message that gets malformed and then eliminate the parsing rules one-by-one. The problem is how you acquire that exact message! Typically, you either
- access the host where the parsing occurs and configure a filter and a temporary file destination for these messages, or
- run tcpdump or a similar tool on the host (or somewhere else in the pipeline) to capture the malformed messages “on the wire”.
Neither approach is especially convenient. When checking that specific log messages are properly parsed or routed, especially in a high-traffic production environment, you don’t need all the tens of thousands of messages that your aggregator node is processing every second – just samples of those that you’re trying to fine-tune. Similarly, when troubleshooting an issue, you usually don’t want to wade through the myriad of different kinds of incoming logs – again, we need just the relevant ones that come from the problematic host, application, or whatever combination of labels and metadata describes them.
How to solve it with Axoflow
Log tapping in Axoflow samples the log flow of your security data pipeline on demand, flagging any parsing failures in the data. You can use labels to filter for specific messages (like ones with parse errors) and tap only those messages. To not get overwhelmed with events, Axoflow automatically samples the output: if many messages match the selected filter, only a subset is shown (about 1 message per second). So with a few clicks you can investigate the problematic event.

Under the hood, Axoflow reconfigures the log collector and redirects a small portion of the actual log traffic to the Axoflow dashboard. This redirection is active only while log tapping is active on the dashboard; it has no effect on the original log stream, nor does Axoflow store the tapped messages in any way.

In addition to the raw data, you can also access the details and all the enriched and curated metadata of the message.
If you’re interested in using Axoflow log tapping with syslog-ng or SC4S, let us know!
Use Case 2: Destination errors
So you’ve handled all the parsing errors, yet the message doesn’t show up at the destination for some reason (like credential error, API mismatch, etc…). So you continue the investigation and start checking for potential errors, one by one: Does the destination receive and accept your payload?
Every destination is different but most protocols inform you about the result of an action. Let’s take the most common protocol, HTTP: If you have credential or API mismatch errors, the server will reject your request, usually with an error code. Axoflow exposes these responses as metrics, and fires alerts on unexpected responses.
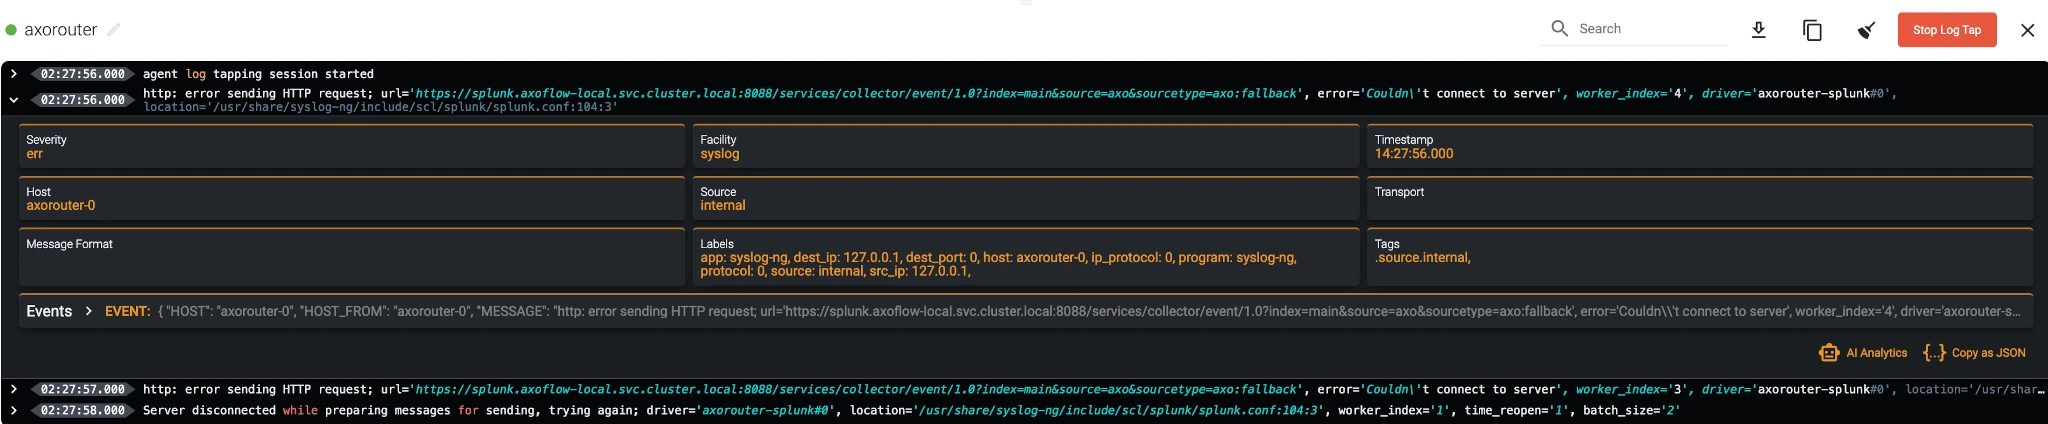
In addition, there can be sneaky errors that do not produce protocol level errors, but explain data formatting problems in the response. With Axoflow you can tap into the log messages of the log collector agent from the Axoflow Dashboard. Certain agents (for example, AxoSyslog) provide very detailed information about the exact payload and the response received during the error.
To better understand the particular log message, you can get the Axoflow AI Analytics Engine to assess and describe the meaning of the message:

Summary
Axoflow is a security data curation pipeline empowering hybrid enterprises to reduce complexity and costs by automatically curating their data in the pipeline. Log tapping helps your teams troubleshoot pipeline and data-related issues more efficiently, reducing MTTR, for example, in the following situations:
Granular Data Inspection: Your engineers and analytics teams can filter the flow of log data by source, application, transport, destination, namespace, and other metadata to quickly sample the specific logs in real time. This helps them identify patterns, anomalies, and potential issues more effectively without having to wade through an overwhelming amount of log entries. The ability to tap into both input and output streams allows you to debug and fine-tune any transformation or routing step in your pipeline.
Rapidly Fix Parsing Errors: Fast access to targeted logs means quicker identification of root causes for data pipeline related problems. This enhances your ability to respond to and resolve issues, minimizing downtime and impact on services. Quick access to the logs of the collector agent running on the hosts helps you find errors quickly.
To see log tapping in action, check out our Log tapping to find rogue devices and parsing errors video!
{{request-a-demo-button}}
Trademark attribution
syslog-ng™ is the trademark of One Identity LLC


Follow Our Progress!
We are excited to be realizing our vision above with a full Axoflow product suite.
Sign Me UpFighting data Loss?

Book a free 30-min consultation with syslog-ng creator Balázs Scheidler