
How to collect AxoSyslog metrics into Prometheus
Getting visibility into the performance and status of your data pipeline is essential for detecting and quickly solving issues in the pipeline. Collecting metrics about the pipeline is the best way to diagnose message drops and other problems.
In this post, you'll learn how to deploy a metrics exporter for your syslog-ng™ or AxoSyslog deployment and collect useful metrics into Prometheus.
With the method described in this blog, you can collect metrics from:
- syslog-ng and syslog-ng Premium Edition (PE). Both are supported by the metrics exporter, even in older versions. When used with these legacy versions, the exporter automatically switches to the older, non-Prometheus-style statistics interface. This means you’ll still receive metrics, though fewer, as the newer ones aren’t available.
- AxoSyslog (all versions). AxoSyslog is a binary-compatible drop-in replacement for syslog-ng. To upgrade an existing syslog-ng deployment, see How to upgrade syslog-ng to AxoSyslog.
The AxoSyslog metrics exporter
On the host where you're running syslog-ng/AxoSyslog, you'll need to run axosyslog-metrics-exporter. You can run axosyslog-metrics-exporter as a container using docker or podman, or directly from the source using git and go.
The axosyslog-metrics-exporter provides Prometheus-style metrics. Don't let the name confuse you, axosyslog-metrics-exporter supports syslog-ng as well.
Note: There is a Python-based exporter for syslog-ng, but that implementation has some limitations, for example, it misses the metrics introduced in newer AxoSyslog versions. Therefore, we recommend using axosyslog-metrics-exporter.
Deploy axosyslog-metrics-exporter
We assume that you already have a host where syslog-ng or AxoSyslog is running. If you don't, here's how you can install AxoSyslog. Also, set at least stats-level(2) in your syslog-ng configuration file to get detailed metrics.
Note: Once you start using Prometheus, you’ll likely no longer need periodic stat messages, so you might consider disabling them by setting stats-freq(0).
The metrics exporter needs file-level access to AxoSyslog's/syslog-ng™'s control socket, which is usually located at:
/var/lib/syslog-ng/syslog-ng.ctl, or/var/run/syslog-ng/syslog-ng.ctl.
In a container environment, you need to provide access to that UNIX domain socket via shared volumes, or some other means. For example, in my AlmaLinux 9 host, you can deploy axosyslog-metrics-exporter by running:
sudo podman run -d -p 9577:9577 -v $(echo /var/*lib/syslog-ng/syslog-ng.ctl):/syslog-ng.ctl \
ghcr.io/axoflow/axosyslog-metrics-exporter:latest --socket.path=/syslog-ng.ctl
After the container starts up, it serves Prometheus metrics over an HTTP interface. You can check that it's working by opening http://127.0.0.1:9577/metrics in your browser. You'll see the current metrics (of course, if there's no traffic, the metrics will be mostly 0):
# TYPE syslogng_output_events_total counter
syslogng_output_events_total{filename="/var/example.log",driver="file",id="output_file_example#0",result="dropped"} 0
syslogng_output_events_total{filename="/var/example.log",driver="file",id="output_file_example#0",result="queued"} 0
syslogng_output_events_total{filename="/var/example.log",driver="file",id="output_file_example#0",result="delivered"} 5098
syslogng_output_events_total{transport="tcp",address="server:601",driver="afsocket",id="output_example#0",result="dropped"} 0
syslogng_output_events_total{transport="tcp",address="server:601",driver="afsocket",id="output_example#0",result="queued"} 0
syslogng_output_events_total{transport="tcp",address="server:601",driver="afsocket",id="output_example#0",result="delivered"} 5098
# TYPE syslogng_last_config_file_modification_timestamp_seconds gauge
syslogng_last_config_file_modification_timestamp_seconds 1.745491336e+09
# TYPE syslogng_output_event_bytes_total gauge
syslogng_output_event_bytes_total{filename="/var/example.log",driver="file",id="output_file_example#0"} 4.063603e+06
syslogng_output_event_bytes_total{transport="tcp",address="server:601",driver="afsocket",id="output_example#0"} 4.185955e+06
# TYPE syslogng_output_unreachable gauge
syslogng_output_unreachable{id="output_example#0",driver="afsocket",transport="tcp",address="server:601"} 0
# TYPE syslogng_scratch_buffers_count gauge
syslogng_scratch_buffers_count 63
# TYPE syslogng_mainloop_io_worker_roundtrip_latency_seconds gauge
syslogng_mainloop_io_worker_roundtrip_latency_seconds 9.1663e-05
# TYPE syslogng_parsed_events_total counter
syslogng_parsed_events_total{id="#anon-parser2",result="processed"} 5098
syslogng_parsed_events_total{id="#anon-parser2",result="discarded"} 0
syslogng_parsed_events_total{id="#anon-parser0",result="processed"} 99478
syslogng_parsed_events_total{id="#anon-parser0",result="discarded"} 0
syslogng_parsed_events_total{id="#anon-parser1",result="processed"} 5098
syslogng_parsed_events_total{id="#anon-parser1",result="discarded"} 0
# TYPE syslogng_socket_rejected_connections_total gauge
syslogng_socket_rejected_connections_total{id="main_input#0",driver="afsocket",transport="stream",address="AF_INET(0.0.0.0:601)",direction="input"} 0
# TYPE syslogng_io_worker_latency_seconds gauge
syslogng_io_worker_latency_seconds 7.1855e-05
# TYPE syslogng_last_successful_config_reload_timestamp_seconds gauge
syslogng_last_successful_config_reload_timestamp_seconds 1.745491343e+09
# TYPE syslogng_output_event_delay_sample_age_seconds gauge
syslogng_output_event_delay_sample_age_seconds{filename="/var/example.log",driver="file",id="output_file_example#0"} 6
syslogng_output_event_delay_sample_age_seconds{transport="tcp",address="server:601",driver="afsocket",id="output_example#0"} 6
# TYPE syslogng_events_allocated_bytes gauge
syslogng_events_allocated_bytes 0
# TYPE syslogng_socket_connections gauge
syslogng_socket_connections{id="main_input#0",driver="afsocket",transport="stream",address="AF_INET(0.0.0.0:601)",direction="input"} 14
# TYPE syslogng_last_config_reload_timestamp_seconds gauge
syslogng_last_config_reload_timestamp_seconds 1.745491343e+09
# TYPE syslogng_socket_max_connections gauge
syslogng_socket_max_connections{id="main_input#0",driver="afsocket",transport="stream",address="AF_INET(0.0.0.0:601)",direction="input"} 100
# TYPE syslogng_input_events_total counter
syslogng_input_events_total{transport="tcp",address="10.244.5.148",driver="afsocket",id="main_input#0"} 49739
# TYPE syslogng_filtered_events_total counter
syslogng_filtered_events_total{id="example_ns_filter",result="matched"} 49739
syslogng_filtered_events_total{id="example_ns_filter",result="not_matched"} 0
syslogng_filtered_events_total{id="example_match",result="matched"} 5098
syslogng_filtered_events_total{id="example_match",result="not_matched"} 44641
# TYPE syslogng_memory_queue_events gauge
syslogng_memory_queue_events{filename="/var/example.log",driver="file",id="output_file_example#0"} 0
syslogng_memory_queue_events{transport="tcp",address="server:601",driver="afsocket",id="output_example#0"} 0
# TYPE syslogng_scratch_buffers_bytes gauge
syslogng_scratch_buffers_bytes 10240
# TYPE syslogng_input_event_bytes_total gauge
syslogng_input_event_bytes_total{transport="tcp",address="10.244.5.148",driver="afsocket",id="main_input#0"} 4.8347571e+07
# TYPE syslogng_memory_queue_capacity gauge
syslogng_memory_queue_capacity{filename="/var/example.log",driver="file",id="output_file_example#0"} 10000
syslogng_memory_queue_capacity{transport="tcp",address="server:601",driver="afsocket",id="output_example#0"} 10000
# TYPE syslogng_stats_level gauge
syslogng_stats_level 2
# TYPE syslogng_memory_queue_memory_usage_bytes gauge
syslogng_memory_queue_memory_usage_bytes{filename="/var/example.log",driver="file",id="output_file_example#0"} 0
syslogng_memory_queue_memory_usage_bytes{transport="tcp",address="server:601",driver="afsocket",id="output_example#0"} 0
Now you can set up your Prometheus deployment to scrape these metrics. In AxoSyslog 4.24 and later, run syslog-ng --metrics-registry to list the available metrics. See the AxoSyslog documentation for the reference of the metrics.
Run Prometheus
We'll show you how to deploy Prometheus in a container. If you already have one, you can skip to the next step.
First, create a prometheus.yml file with a job to scrape AxoSyslog metrics. Change the IP address in the targets field to the actual IP address of your host. Don't use localhost or 127.0.0.1, because AxoSyslog is not running in the Prometheus container.
- job_name: axosyslog
  static_configs:
  - targets:
    - 198.19.249.131:9577
    labels:
      app: axosyslog
Run Prometheus using the configuration file you've prepared:
sudo podman run \
    -p 9090:9090 \
    -v ./prometheus.yml:/etc/prometheus/prometheus.yml \
    prom/prometheus
After the Prometheus container starts up, you can check the live Prometheus configuration by opening: http://127.0.0.1:9090/config. You’ll see the AxoSyslog job at the end of the file, under the scrape_configs section.
Check the http://127.0.0.1:9090/targets page to see if Prometheus has successfully scraped the metrics from the axosyslog target.

Open the Query page and start typing syslogng into the Query field. The list of metrics collected from AxoSyslog shows up.

Select a metric and click Execute.
If you have some actual numbers, you can check the Graph view to see the trend of the historical data.

Some of the metrics to keep an eye on include:
syslogng_output_unreachable: shows when a destination is down or inaccessible, andsyslogng_socket_receive_dropped_packets_total, which signals message drops on the source side.syslogng_output_events_total{result="dropped"}- messages dropped on not flow controlled pathssyslogng_socket_rejected_connections_total- number of rejected connectionssyslogng_memory_queue_events, syslogng_disk_queue_events- metrics on buffer usage, similar metrics are available in bytes as wellsyslogng_io_worker_latency_secondsandsyslogng_mainloop_io_worker_roundtrip_latency_seconds- shows the latency of workers; high values may indicate overload or other types of functional malfunction
Also, if you do not want to complicate your work, these are the core metrics - together with their labels you can easily understand and monitor how logs flow:
syslogng_input_events_totalsyslogng_output_events_totalsyslogng_filtered_events_totalsyslogng_parsed_events_total
AxoSyslog Metrics in Axoflow
Axoflow can collect metadata from syslog-ng-based collection infrastructures already in production. Apart from AxoRouter, Axoflow’s own data aggregator and curation engine, you can easily integrate your existing AxoSyslog, syslog-ng, syslog-ng PE nodes (or even SC4S) into Axoflow.
After registering such nodes with the Axoflow Console, these nodes will appear on the Topology page, showing you an overview of the pipeline and information about the traffic, such as events per second or bytes per second.

Axoflow automatically monitors the collected metrics, and raises alerts in case there are problems, helping you quickly locate and troubleshoot your pipeline issues, for example, message drops.

For detailed metrics that include generic metrics like CPU and memory usage, and also syslog-ng-specific information, like the disk buffer status, check the Metrics & Health page of the host.

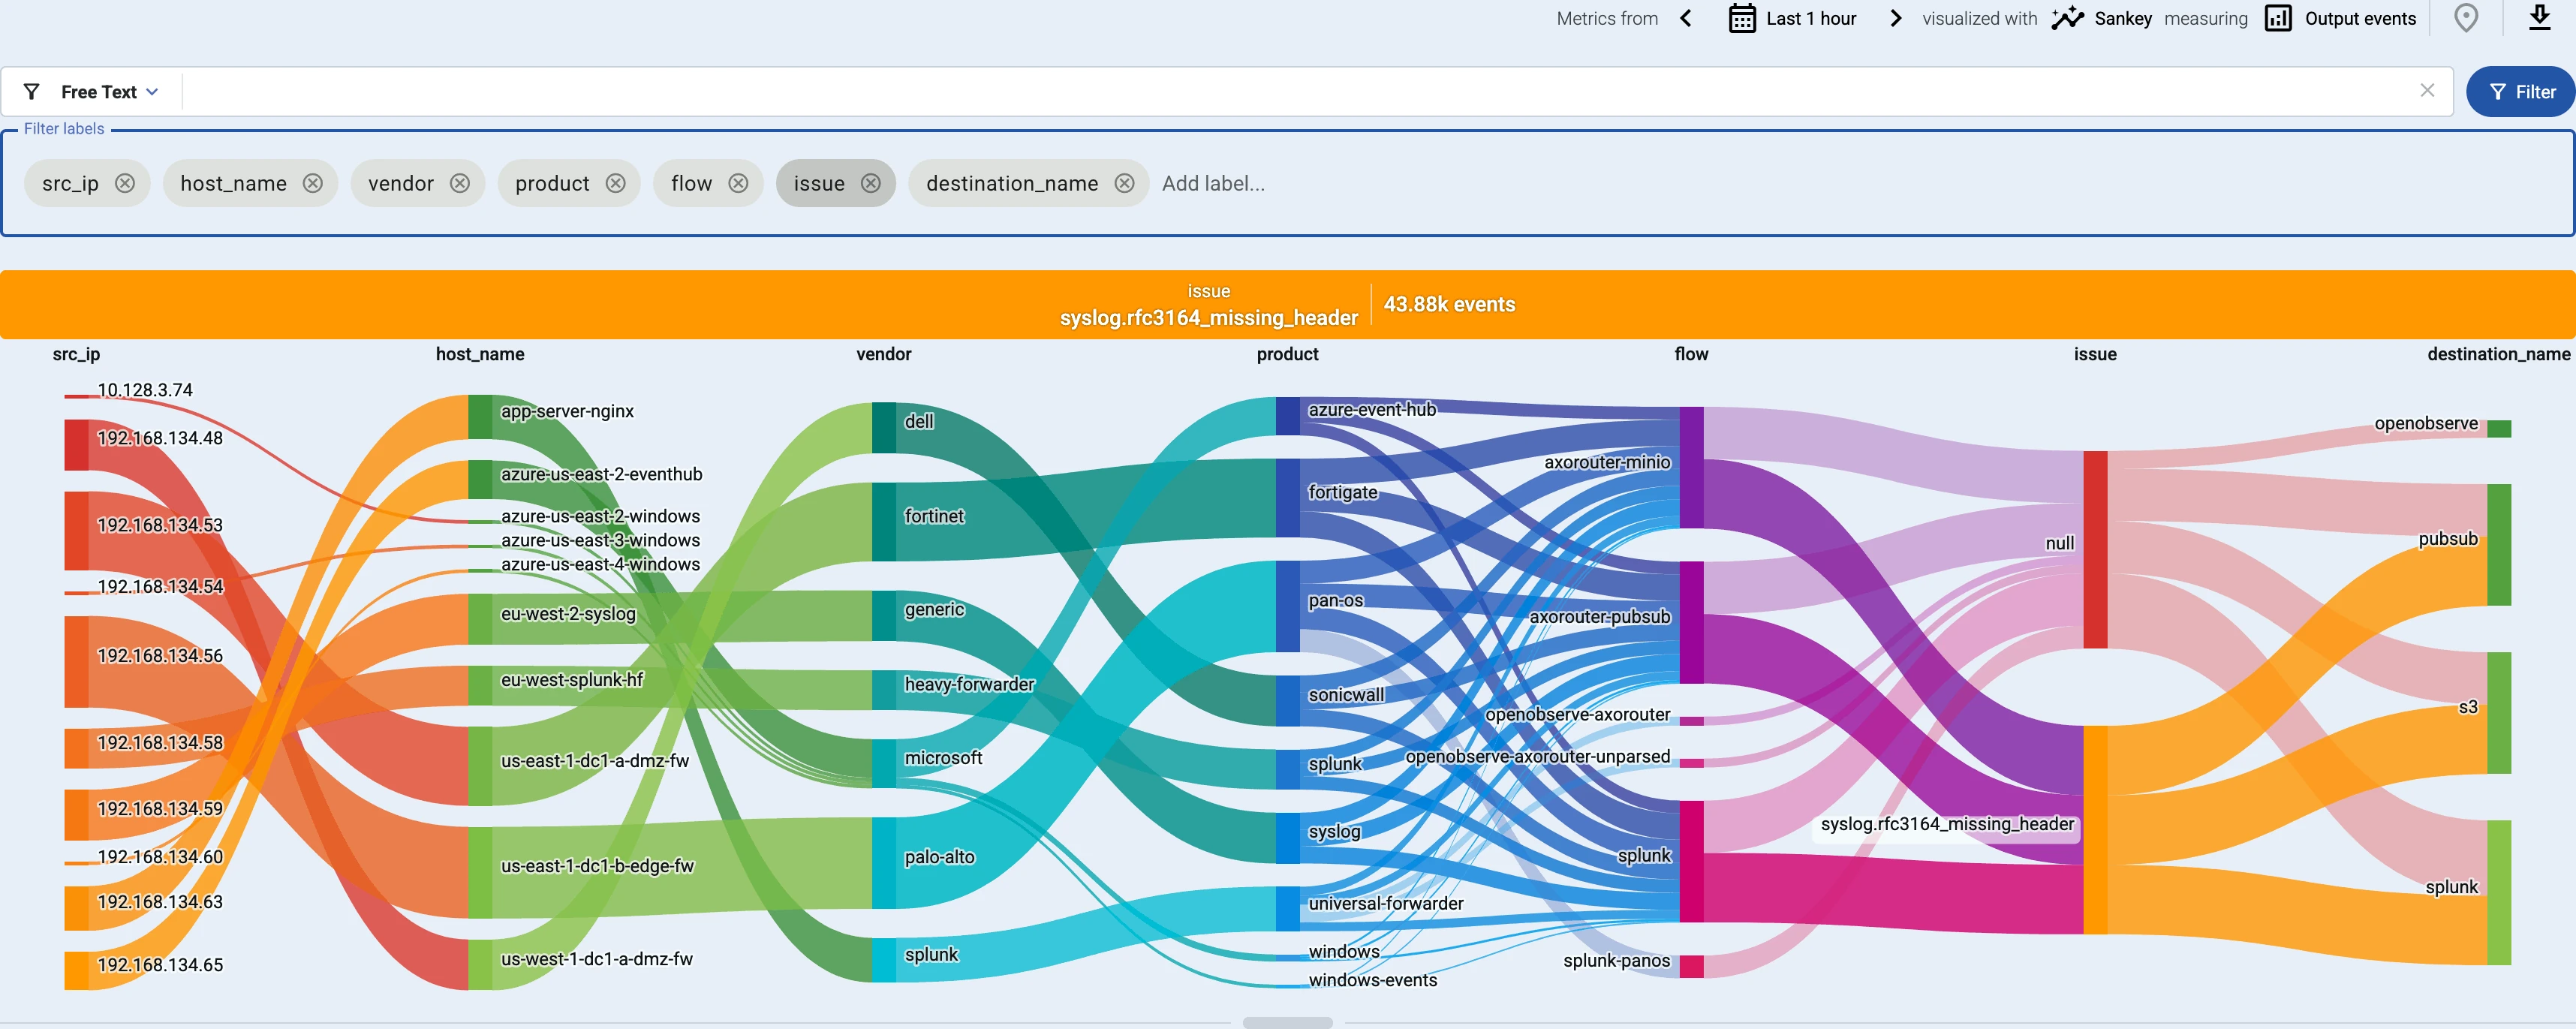
You can also delve into the Analytics of your pipeline throughput using labels. For example, you can quickly identify hosts that send malformed log messages by visualizing the issue label (commercial products that send malformed syslog messages are far more common than you'd think). Of course, Axoflow can automatically handle and fix such issues for hundreds of products.
To try these features and more with your own environment, request a free Axoflow sandbox.
Conclusion
Getting visibility into your data pipeline is a must for proactive monitoring and troubleshooting. With the axosyslog-metrics-exporter and Prometheus setup, you can track essential syslog-ng™ and AxoSyslog metrics in real time. This integration helps you detect issues like message drops or unreachable outputs before they become critical problems. Whether you're running a legacy syslog-ng™ version or the newer AxoSyslog, this approach ensures better observability and understanding. For commercial use-cases, Axoflow provides out-of-the-box pipeline monitoring and management tools to streamline operations and boost reliability at scale.
If you're looking for alerting capabilities, volume reduction, and a UI-based centralized management experience, give it a try in our sandbox—or request a demo for a guided tour. A free 30-day trial option is available, so you could try it without any obligations.
Trademark attribution
syslog-ng™ is the trademark of One Identity LLC


Follow Our Progress!
We are excited to be realizing our vision above with a full Axoflow product suite.
Sign Me UpFighting data Loss?

Book a free 30-min consultation with syslog-ng creator Balázs Scheidler