

Axoflow metrics for syslog-ng Premium Edition
The Axoflow Platform is an end-to-end observability pipeline solution that automates and simplifies the control of your telemetry infrastructure with a platform agnostic approach. It already works together with your syslog-ng™ based deployments to provide metrics, visualizations, and alerts for your logging infrastructure and turn it into a modern telemetry pipeline - see our blog posts about using Axoflow with syslog-ng Open Source Edition and Splunk Connect for Syslog (SC4S).
This post shows you how this works if you’re using syslog-ng™ Premium Edition.
Metrics in syslog-ng™ Premium Edition
Older versions of syslog-ng™ Premium Edition can get statistics on its operation and send them out as syslog messages, which are often helpful in debugging configuration errors and basic operations issues. However, these are mostly built-in global statistics; you couldn’t get metrics based on the processed data.
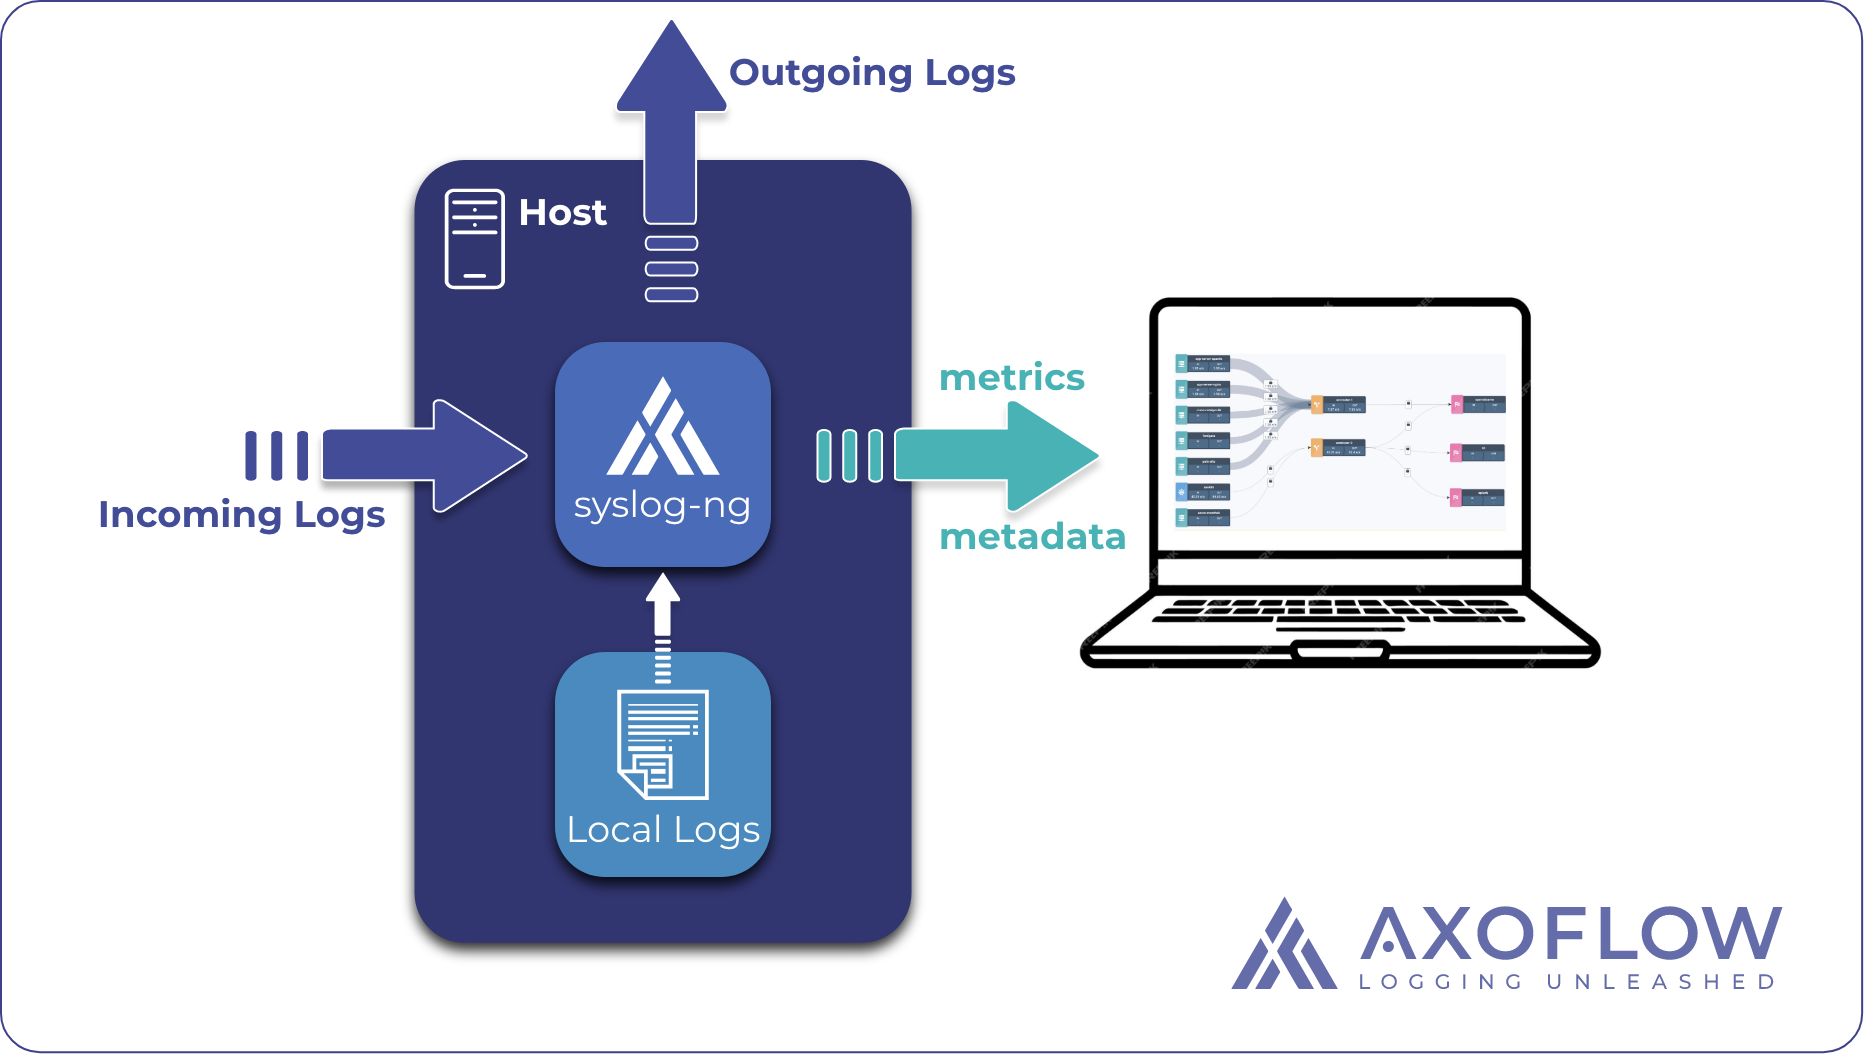
Using recent syslog-ng versions (syslog-ng™ Premium Edition 7.0.34+), you can create labeled metrics and counters based on the fields of the messages that are processed in a syslog-ng log path. The custom metrics that result provide metadata that is much more pertinent to your specific use cases, and go significantly beyond the standard “state of health” metrics of the server itself.
Once you onboard an existing syslog-ng deployment to Axoflow, it starts periodically sending metrics back to the Axoflow Management Plane for visualization and alerting. These visualizations help answer pipeline-related questions at a glance.
You can read more about how a syslog-ng instance is instrumented in our whitepaper.
Pipeline-related incidents often manifest themselves in:
- excessive volumes (a run-away sender generating a huge amount of logs),
- increased delays (due to network or CPU bottlenecks), or
- data format errors.
Metrics are an effective means to find the root cause for these incidents, thereby they are important tools to reduce the MTTR. The Axoflow Management Console can visualize and alert on the collected metrics about your telemetry pipeline.
Topology of the telemetry pipeline
In a typical enterprise environment, the telemetry pipeline can become a complex beast. Different classes of devices, using different collection strategies, agents, and protocols are part and parcel of large installations. By analyzing the metrics, Axoflow can reconstruct the delivery paths and visualize the global topology of your telemetry pipeline from edge to edge, including source hosts/applications, forwarders, syslog relays, and destinations.
Sources include appliances and other devices that cannot be onboarded to Axoflow directly but send their logs to such hosts. The metrics also allow you to show information about the traffic, such as events per second or bytes per second, as well as the type of protocol used and whether the channel is encrypted or not. Note that Axoflow collects detailed, real-time metrics about the data-flows – giving you observability over the health of the security data pipeline and its components. Your security data remains in your self-managed cloud or in your on-prem instance where your sources and destinations are running, only metrics are forwarded to the Axoflow Console.

Syslog-ng host metrics
Sometimes, a telemetry-related bottleneck is caused by the limited resources of the hosts running the infrastructure. To remediate these issues, information about the host is crucial. For this reason, Axoflow collects host metrics so you can get up-to-date status and health information. In addition to generic metrics like CPU and memory usage, you also get syslog-ng-specific information, like the status of the disk buffer or the version of syslog-ng.

Alerting and Reporting
Metrics and visualization is a great tool to diagnose an incident once you are already aware that the incident is happening. Based on the collected metrics, you can create alerts for system health, data volume, data dropouts, data bursts, and critically, transport costs.

Enterprise features of AxoSyslog
We started to develop syslog-ng™ Premium Edition about 15 years ago, back in the BalaBit days, to provide a syslog tool based on syslog-ng™ Open Source Edition that is tailored for enterprise use cases and has commercial support. The logging landscape has changed a lot since then, observability has emerged, and thanks to our continued development, it has received several enterprise features.
The logging requirements of organizations typically include the following main reasons and use cases. While this might look like a long list, typically only 2-3 of these use cases apply to a single organization. As you’ll see in the subsequent sections, AxoSyslog, our syslog-ng fork is suitable for all of these. For a deep-dive into metrics, see How to collect AxoSyslog metrics into Prometheus.
Commercial support
For many organizations, having 7x24 commercial support for their logging infrastructure is a must. Syslog-ng Open Source Edition has community support (mainly provided by us, Axoflow), and for the Axoflow Platform we provide enterprise-grade commercial support, which covers syslog-ng Open Source Edition and AxoSyslog as well.
Development of new features
The features we've added to AxoSyslog allow you to modernize your logging infrastructure, and integrate it to modern observability and telemetry solutions, like:
- Grafana Loki destination
- Amazon S3 destination
- OpenSearch destination
- Falcon LogScale destination
- OpenTelemetry support
- Kubernetes support
Windows support
The Axoflow Platform provides an agentless mode to retrieve Windows event logs. If you need an agent based solution, for example, to read logs from local files, Axoflow supports using OpenTelemetry Collector (a modern, industry-standard, open-source log collector agent) on Windows. Syslog-ng Open Source Edition doesn't have Windows support.
Advanced protocol support
Advanced protocols improve the reliability of log transport by supporting batched message transfer, application level acknowledgement, and on-the-wire compression. AxoSyslog supports the OpenTelemetry-based syslog-ng-otlp() drivers, which provide the same features, plus:
- it uses an open protocol (no vendor lock-in)
- better scaling
- out-of-the-box support for load-balancing.
UDP balancer
AxoSyslog provides UDP parallelization features and eBPF support.
Cloud support
AxoSyslog supports Google Pub/Sub and the BigQuery destinations, while the Axoflow Platform provides integration support for other destinations as well.
As you can see, with Axoflow you can modernize and improve your syslog-ng Premium Edition based logging infrastructure. Using the Axoflow Platform in your syslog-ng based logging infrastructure gives you:
- Metrics to know exactly what is happening in your logging pipeline, receive alerts for issues in your telemetry pipeline (such as outages or bottlenecks), and reduce the MTTR of such issues.
- Recognize and diagnose pipeline issues that you didn't even know about, like packet and message drops, messages formatting issues. (See our video about detecting data loss for details.)
- Tools and support to upgrade your logging pipeline to a future-proof telemetry pipeline.
- If you’re using AxoSyslog, you also get:
- Modern container-based deployment (but we do have RPM/DEB packages if needed),
- new drivers and other features we've added (and keep adding) to AxoSyslog.
Axoflow is not a syslog tool, it's a security data pipeline that allows you to observe, manage, and improve your logging pipeline and turn it into a future-proof telemetry pipeline, regardless of the underlying protocols and agents.
Why Axoflow?
Our founders include the original creators of syslog-ng and the Logging Operator for Kubernetes, and other main contributors to these projects, with vast knowledge and hands-on experience in observability, log management, and how to apply these technologies in the enterprise security context.
Axoflow is the biggest contributor to both syslog-ng Open Source Edition and the Logging Operator (now a CNCF sandbox project). We also maintain an up-to-date version of the syslog-ng documentation.
Where are we going?
Axoflow’s flexible architecture future-proofs the telemetry pipeline and keeps it agnostic. This means that the Management Plane will continue to work for you as new destinations and technologies are built. Automation of pipelines and the use of AI to automatically classify logs and send them to the proper destinations are coming. The Management Plane will enable teams to validate service uptimes, loss, and other variables related to the data-feeding critical backend systems like the SIEM. Teams will spend less time building difficult log collection environments and spend more time on business-related tasks.
For more details on how we can help your logging and security teams, read the AxoRouter, the security data curation pipeline engine blog post.
Trademark attribution
syslog-ng™ is the trademark of One Identity LLC


Follow Our Progress!
We are excited to be realizing our vision above with a full Axoflow product suite.
Sign Me UpFighting data Loss?

Book a free 30-min consultation with syslog-ng creator Balázs Scheidler