

Send logs to Grafana Loki with syslog-ng and Logging operator
We are pleased to announce that the Logging operator now has support to forward logs to Grafana Loki using the syslog-ng based aggregator as well. This is good news for those using syslog-ng, but also for those who are still hesitating to do so. But why would you use the Logging operator to send and collect logs to Loki when it has its own agent already? You may want to send some of your application logs to Loki for your developers to facilitate troubleshooting but the security team requires all logs to be sent to an archive destination at the same time. This is exactly the type of problem the Logging operator is designed for.
Note: If you're not working with Kubernetes and would like to send data from syslog-ng to Grafana Loki, see the Send syslog data to Grafana Loki with syslog-ng blog post.
Why syslog-ng
The next question is: why syslog-ng? Traditionally the Logging operator supported Fluentd only as an aggregator, but from version 4.0 syslog-ng is an option as well. Fluentd is widely popular and has support for a vast number of outputs, but in our experience it had issues handling a large number of Flow configurations. Syslog-ng is flexible, highly performant, handles large configurations, and has a low resource footprint compared to Fluentd. In addition to that, in this blog post we are going to demonstrate how to use syslog-ng as the collector to replace Fluent Bit using the AxoSyslog Helm chart. In both cases we use AxoSyslog, which is a cloud-native distribution of the upstream, open-source syslog-ng project by Axoflow. We do this because we want to favor consistency over throughput in this case, which is not possible with Fluent Bit at the moment. Note that there is a workaround in Loki, but again the solution is suboptimal as the Loki queries can show inconsistent results, which we want to avoid.In this tutorial we’ll walk you through the following processes:
- Deploy Grafana Loki, and Grafana to store and query logs
- Deploy Log generator to generate sample log messages
- Deploy Logging operator to manage the log pipeline
- Deploy the components necessary to configure the log pipeline along with AxoSyslog to collect Kubernetes logs from the cluster
- Query the forwarded log messages
Prerequisites
- A Kubernetes cluster
- Helm installed
- Kubectl installed
Install Grafana Loki
Let’s install Loki and Grafana, using the official Helm charts. For demonstration purposes, we use the following Helm values for the Loki deployment to avoid the overhead of a production setup on a local machine.Save the following YAML file as loki_values.yaml:
loki:
  auth_enabled: false
  commonConfig:
    replication_factor: 1
    storage:
      type: 'filesystem'
monitoring:
  enabled: false
  rules:
    enabled: false
  selfMonitoring:
    enabled: false
    grafanaAgent:
      installOperator: false
  lokiCanary:
    enabled: false
singleBinary:
  replicas: 1
test:
  enabled: false
Run the following commands to install Grafana and Loki:
helm upgrade --install --namespace loki --create-namespace loki --repo https://grafana.github.io/helm-charts loki --values loki_values.yaml --version 5.38.0
helm upgrade --install --namespace=loki --repo https://grafana.github.io/helm-charts loki-grafana grafana --version 7.0.8
Check if both charts are installed:
helm ls -n lokiExpected output:
NAME        	NAMESPACE	REVISION	UPDATED                             	STATUS  	CHART        	APP VERSION
loki        	loki     	1       	2023-11-24 11:19:52.658491 +0100 CET	deployed	loki-5.38.0  	2.9.2
loki-grafana	loki     	1       	2023-11-24 11:17:48.63104 +0100 CET 	deployed	grafana-7.0.8	10.1.5
And that all pods were deployed successfully:
kubectl -n loki get podsExpected output:
NAME                            READY   STATUS    RESTARTS   AGE
loki-0                          1/1     Running   0          37s
loki-gateway-559b9784f-lfn2q    1/1     Running   0          37s
loki-grafana-7446b95448-259dp   1/1     Running   0          30s
Install the Log generator
Install the log generator application to generate some logs that can be collected and sent to our Loki instance.
helm install --generate-name --wait --namespace generator --create-namespace oci://ghcr.io/kube-logging/helm-charts/log-generator --version 0.7.0Check if everything is deployed properly, by checking the generator namespace.
kubectl -n generator get podThe output should be similar to:
NAME                                        READY   STATUS    RESTARTS   AGE
log-generator-1700579080-7f759b5c88-fknvl   1/1     Running   0          2m3s
Install the Logging operator
Install the Logging operator Helm chart with at least version 4.5.0.
helm upgrade --install logging-operator --namespace logging-operator --create-namespace oci://ghcr.io/kube-logging/helm-charts/logging-operator --version 4.5.0We can check if everything is deployed properly, by checking the Helm release and the pods
helm ls -n logging-operatorExpected output:
NAME            	NAMESPACE       	REVISION	UPDATED                             	STATUS  	CHART                 	APP VERSION
logging-operator	logging-operator	1       	2023-11-24 11:34:08.703734 +0100 CET	deployed	logging-operator-4.5.0	4.5.0
kubectl -n logging-operator get podExpected output:
NAME                                READY   STATUS    RESTARTS   AGE
logging-operator-5f94b87759-st9gb   1/1     Running   0          7m32s
If everything is in its place, it’s time to define the log pipeline.
Define the log pipeline
To move pod logs to Loki, we have to deploy infrastructure to
- Collect pod logs from nodes and forward to the aggregator
- Create an aggregator
- Parse, aggregate, and filter messages
- Send them to an external log sink
Set up the logging resource to deploy the syslog-ng aggregator:
The Logging custom resource will define the parameters of the aggregator, which is going to be syslog-ng.
apiVersion: v1
kind: Namespace
metadata:
  name: logging
---
kind: Logging
apiVersion: logging.banzaicloud.io/v1beta1
metadata:
  name: logging
spec:
  controlNamespace: logging
  syslogNG:
    jsonKeyDelim: '#'
    sourceDateParser: {}
In this case, we will set the json key delimiter character to ‘#’. This is needed, otherwise json structured log messages with keys including ‘.’ characters will be parsed incorrectly.
Define the flow to select logs of the previously deployed log-generator
Let’s specify a filter to select logs from pods with the matching labels for log-generator, and select the output where these messages will be forwarded.
kind: SyslogNGClusterFlow
apiVersion: logging.banzaicloud.io/v1beta1
metadata:
  name: log-generator
  namespace: logging
spec:
  match:
    regexp:
      value: json#kubernetes#labels#app.kubernetes.io/name
      pattern: log-generator
      type: string
  globalOutputRefs:
  - loki-output
Define the output to handle sending logs to the previously deployed loki instance:
In the current scenario, we will use the gRPC endpoint, which will be served by our Loki instance. To be able to query log messages effectively, we have to set up a mapping between Loki labels and the values of JSON fields in the log message. On Kubernetes, it’s usual to select the most common pod labels, the namespace and the name of the pod.The timestamp field is used to set the timestamp that will be applied to the outgoing log events. Loki traditionally does not accept events, in which the timestamp is not monotonically increasing only if it is configured to receive out-of-order writes within a specific time window. We are using syslog-ng through the whole pipeline, so enabling this in Loki is optional and we can use the original log message timestamps with timestamp: "msg". The template field will be used to format the message body.
apiVersion: logging.banzaicloud.io/v1beta1
kind: SyslogNGClusterOutput
metadata:
 name: loki-output
 namespace: logging
spec:
  loki:
    url: loki.loki.svc.cluster.local:9095
    labels:
      "app_kubernetes_io_name": "${json#kubernetes#labels#app.kubernetes.io/name}"
      "app_kubernetes_io_instance": "${json#kubernetes#labels#app.kubernetes.io/instance}"
      "app_kubernetes_io_component": "${json#kubernetes#labels#app.kubernetes.io/component}"
      "namespace_name": ${json#kubernetes#namespace_name}
      "pod_name": ${json#kubernetes#pod_name}
    timestamp: "msg"
    template: "$ISODATE $HOST $MSGHDR$MSG"
    auth:
      insecure: {}
Deploy the log pipeline
Save all the snippets above to a file, separated with YAML document separators (---) and let’s apply all pipeline components to the cluster.
kubectl -n logging apply -f loki_logging.yamlExpected output:
namespace/logging created
logging.logging.banzaicloud.io/logging created
syslogngclusteroutput.logging.banzaicloud.io/loki-output created
syslogngclusterflow.logging.banzaicloud.io/log-generator created
After deploying a pipeline, we should see the syslog-ng pods coming up after a successful configuration check.
kubectl -n logging get podExpected output:
NAME                                     READY   STATUS      RESTARTS   AGE
logging-syslog-ng-0                      2/2     Running     0          26s
logging-syslog-ng-configcheck-2d99ce9c   0/1     Completed   0          34s
We can also see if all resources are active and have no issues
kubectl get logging-all -n loggingExpected output:
NAME                                     LOGGINGREF   CONTROLNAMESPACE   WATCHNAMESPACES   PROBLEMS
logging.logging.banzaicloud.io/logging                logging

NAME                                                       ACTIVE   PROBLEMS
syslogngclusterflow.logging.banzaicloud.io/log-generator   true

NAME                                                       ACTIVE   PROBLEMS
syslogngclusteroutput.logging.banzaicloud.io/loki-output   true
Also we can see which service the syslog-ng pods are listening on. The ClusterIP type service will be the one that we will use to configure the collector in the next step.
kubectl get svc -n loggingExpected output:
NAME                         TYPE        CLUSTER-IP      EXTERNAL-IP   PORT(S)           AGE
logging-syslog-ng            ClusterIP   10.111.137.92           601/TCP,514/UDP   84s
logging-syslog-ng-headless   ClusterIP   None                    601/TCP,514/UDP   84s
Set up the AxoSyslog collector, to collect logs, from all nodes:
To collect logs, and forward them to the aggregator, we use the Axosyslog Collector. This can be set up by deploying the Axosyslog Collector Helm chart, and configuring the collector to forward logs to the syslog-ng aggregator managed by the Logging operator. The configuration can be done using Helm values. The endpoint where the collector should forward logs to should be the service created by the Logging operator as we saw in the previous step.Saved the following YAML snippet as axosyslog_values.yaml:
daemonset:
  enabled: true
config:
  sources:
    kubernetes:
      enabled: true
      prefix: "kubernetes#"
      keyDelimiter: "#"
  rewrites:
    set:
      time: "${kubernetes#time}"
  destinations:
    network:
    - transport: tcp
      address: logging-syslog-ng.logging.svc.cluster.local
      port: 601
      template: "$(format-json --key-delimiter # --scope all-nv-pairs)∖n"
      extraOptionsRaw: "time-reopen(10)"
And use it when installing the AxoSyslog collector:
helm upgrade --install axosyslog-collector -n axosyslog-collector --create-namespace -f axosyslog_values.yaml --repo https://axoflow.github.io/axosyslog-charts axosyslog-collector --version 0.8.0Check that the collector has been installed and is running:
helm ls -n axosyslog-collectorExpected output:
NAME               	NAMESPACE          	REVISION	UPDATED                             	STATUS  	CHART                    	APP VERSION
axosyslog-collector	axosyslog-collector	1       	2023-11-24 13:52:49.984856 +0100 CET	deployed	axosyslog-collector-0.6.0	4.4.0
And:
kubectl get po -n axosyslog-collectorExpected output:
NAME                        READY   STATUS    RESTARTS   AGE
axosyslog-collector-dws58   1/1     Running   0          20s
Query logs using Grafana
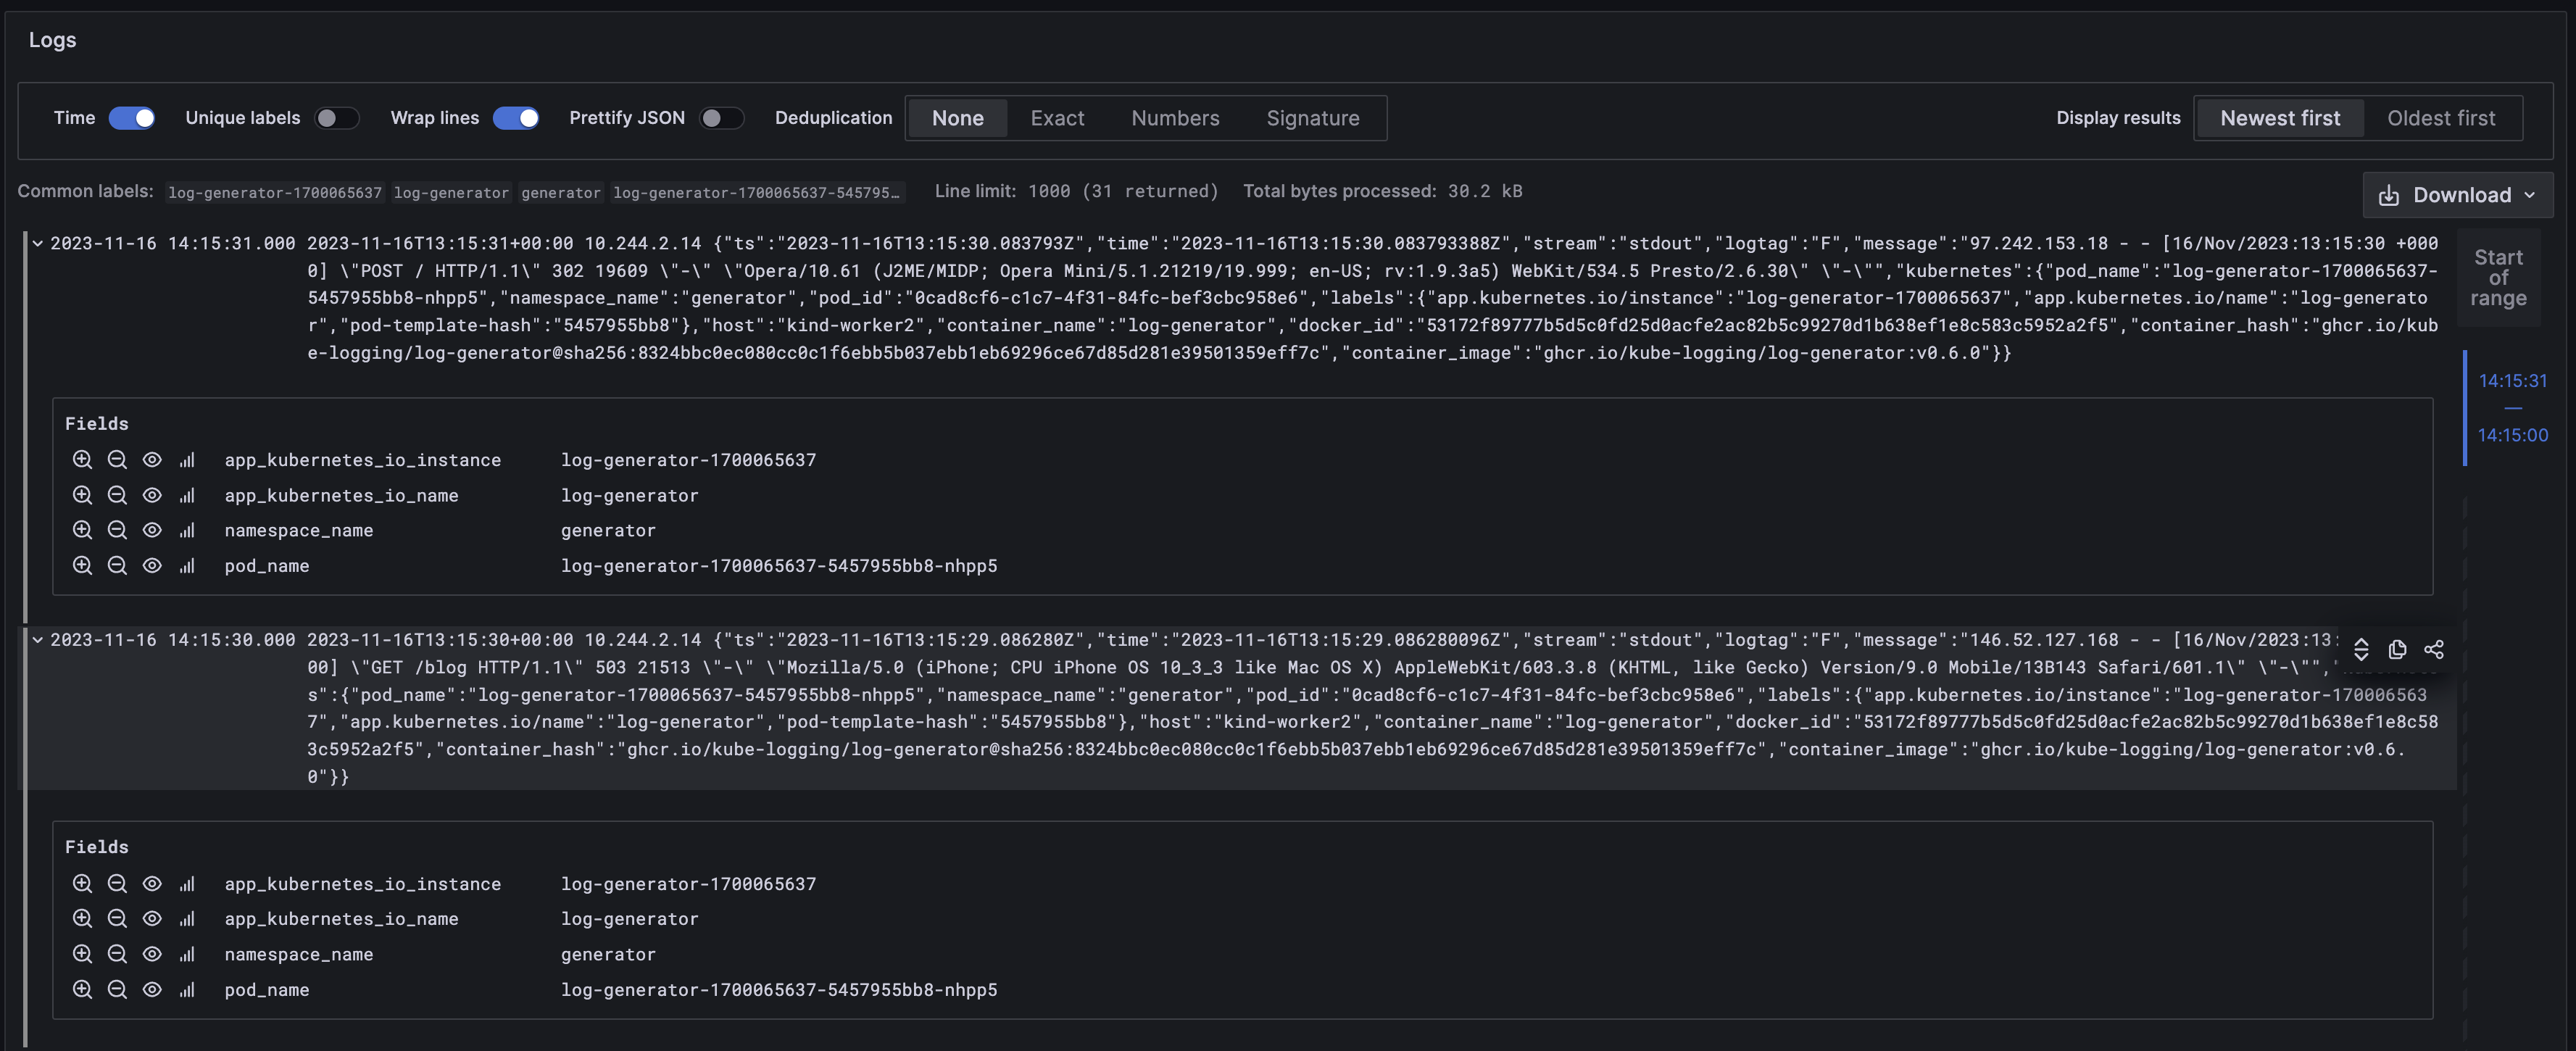
Log entries are now flowing from the log generator to the loki instance, let’s query them. To access the Grafana web UI, we need to use the “admin” user and the generated random password.
kubectl get secret -n loki loki-grafana -o jsonpath="{.data.admin-password}" | base64 --decode ; echoExpose the web UI can using kubectl port-forwarding.
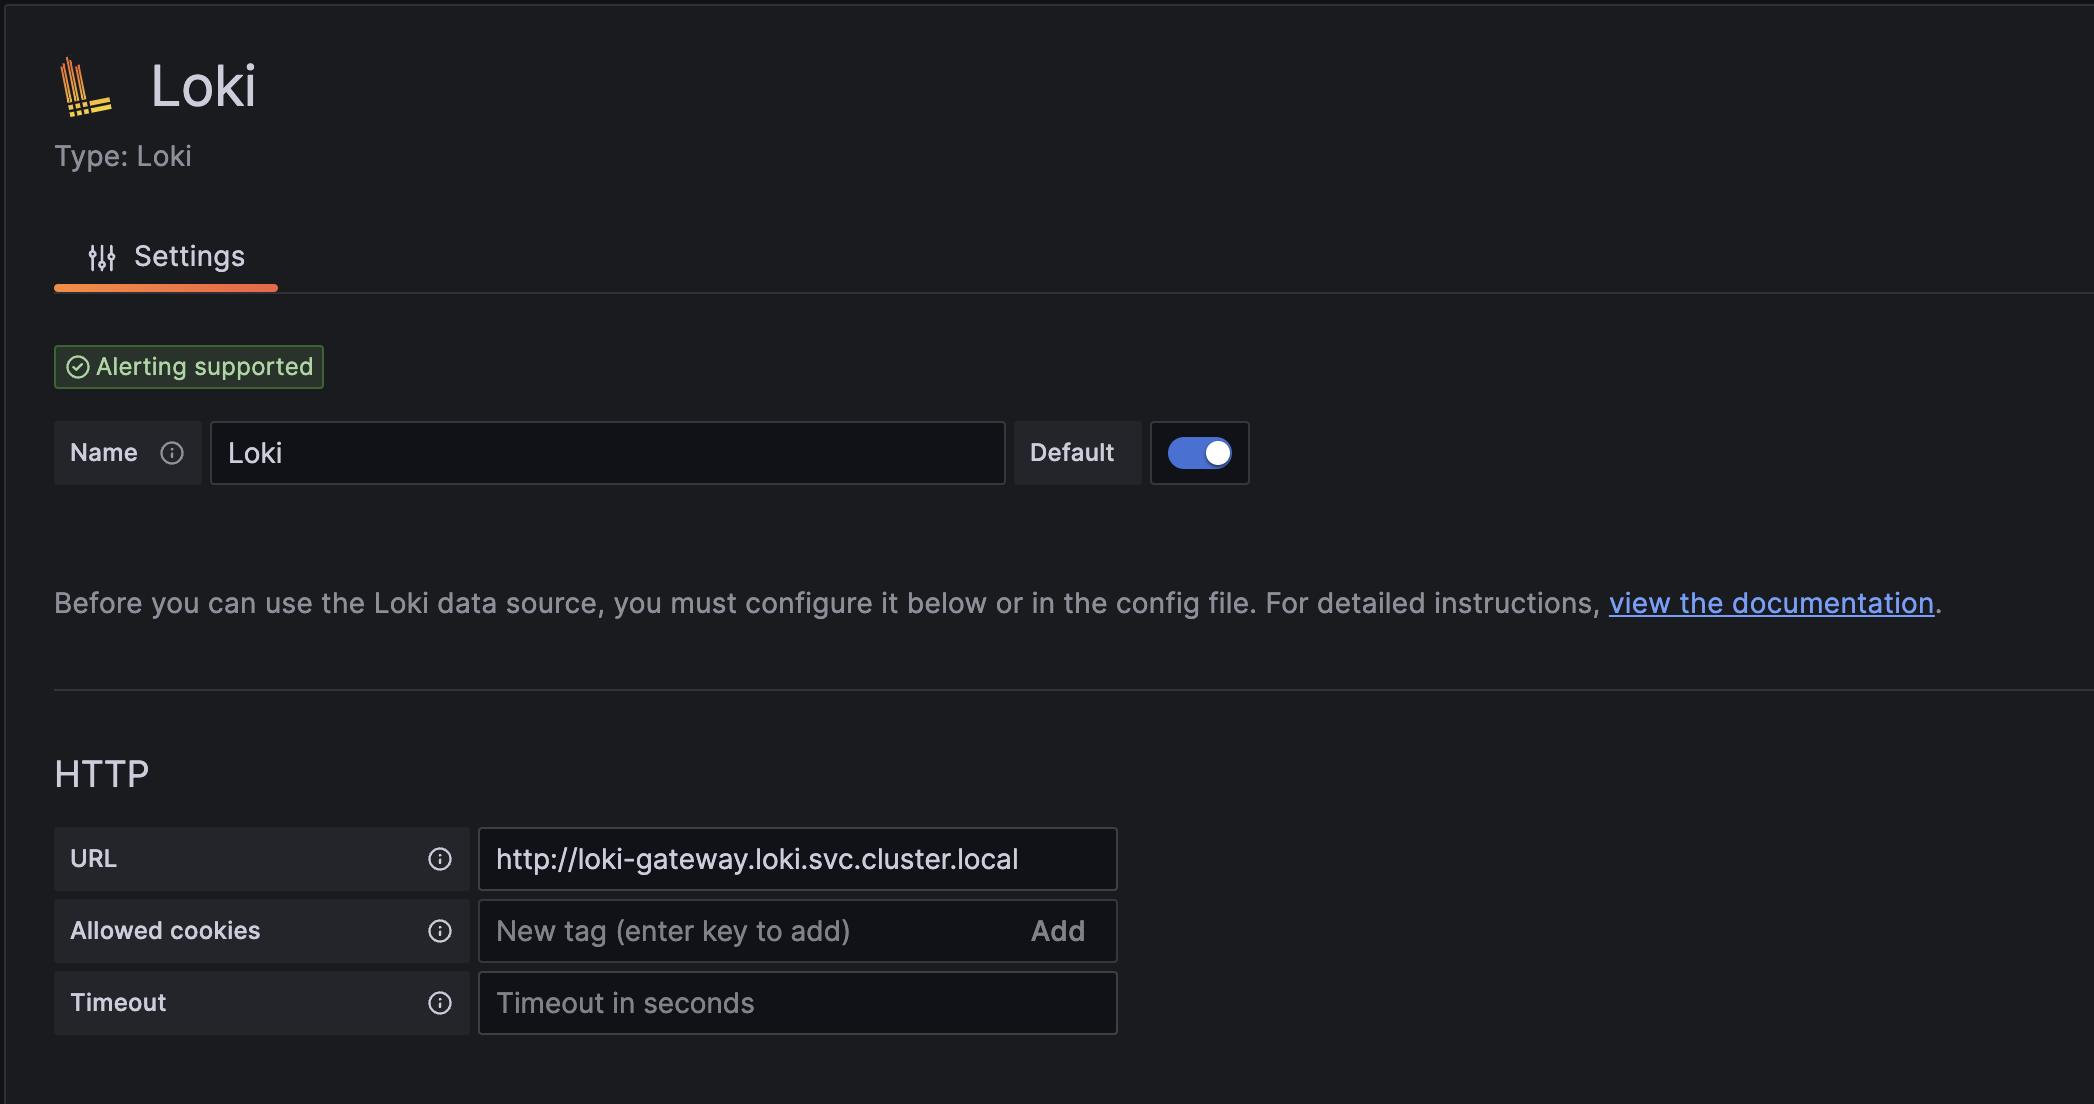
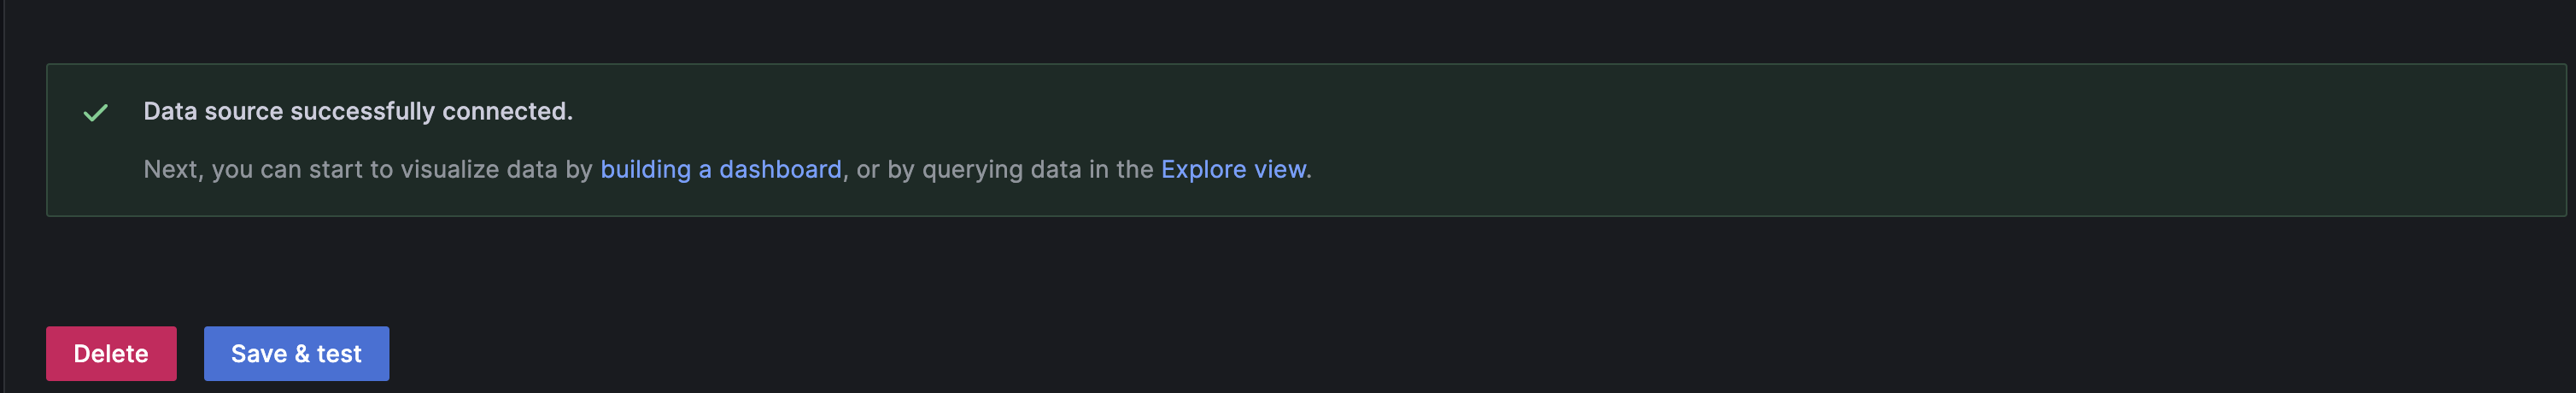
kubectl port-forward -n loki service/loki-grafana 3000:80After logging in, we have to add the Loki instance, as a datasource for Grafana. In this example case, the HTTP URL for the Loki instance is http://loki-gateway.loki.svc.cluster.local. All other fields can be left blank. The endpoint is tested when we save the settings. If it’s successful, we can start querying log entries.
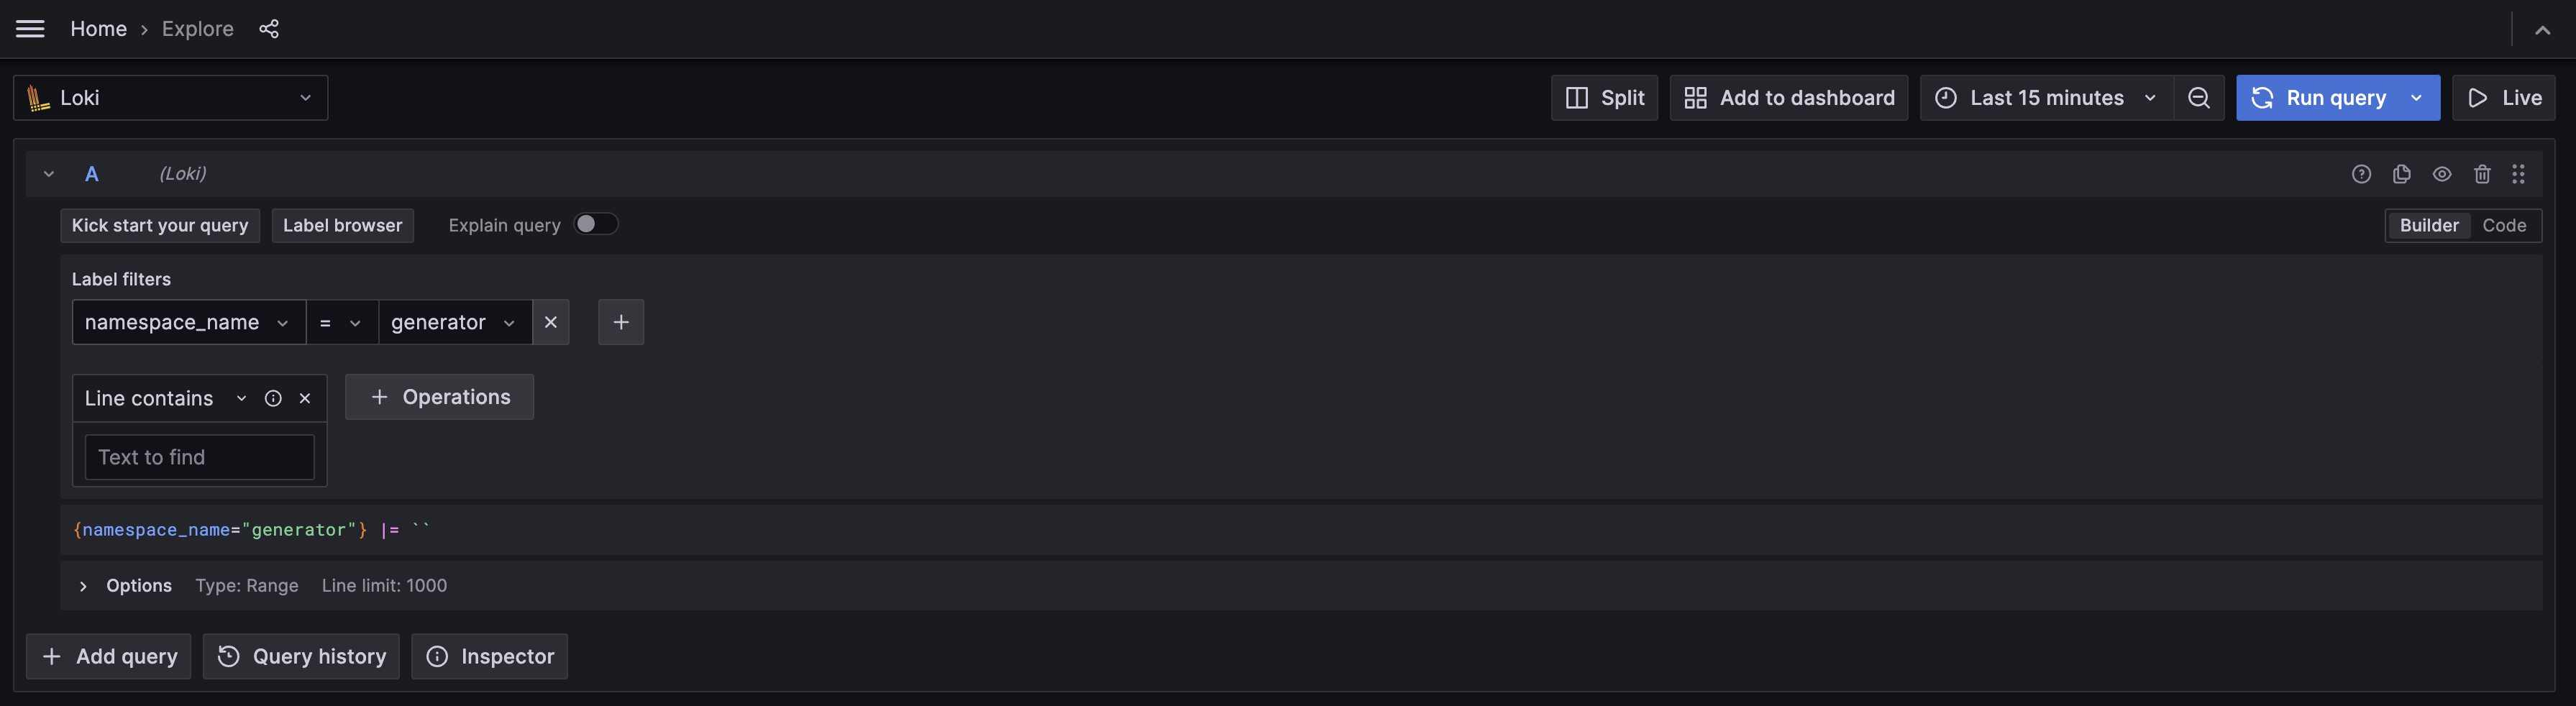
We can use the previously configured labels to select a specific group of logs. Let’s select all log entries from the generator namespace.
Final thoughts
We demonstrated how to send logs to Loki from Kubernetes. To achieve that, we used the Logging operator with syslog-ng as both the collector and the aggregator. That way you can use Logging operator’s flexibility and multi-tenancy capabilities. Stay tuned to learn what comes in the next Logging operator next release!
Follow Our Progress!
We are excited to be realizing our vision above with a full Axoflow product suite.
Sign Me UpFighting data Loss?

Book a free 30-min consultation with syslog-ng creator Balázs Scheidler