We had a blast in Paris at KubeCon2024, and we thought it’d be useful to give you an overview of our experiences:
- the questions, use cases, and problems you’ve asked us at our booths,
- how our projects and products relate to these questions
Day Zero: multi-tenancy and observability
From the numerous co-located events, Multi-TenancyCon and Observability Day were the most relevant to our work.
We are already supporting and are still working on several multi-tenant use cases in the Logging operator and the Telemetry Controller, and as we’ve learned from the Logging operator users we’ve met, this is becoming an increasingly common problem for them.
Observability Day was dominated by OpenTelemetry, which is getting into the mainstream of observability, and not only for metrics. Many of you didn’t know it yet, but the OpenTelemetry Collector can already collect logs as well: the Logs data model is stable. Admittedly, the implementation has some bugs, but we are working on thoroughly testing it and helping fix the issues we find. Many thanks to the maintainers for the great discussions: we’ve received useful feedback and validation on our approach of implementing multi-tenant telemetry collection on Kubernetes. We’ve also learned that some features that we are solving at a higher level in Axoflow already have proposals in the collector, which is great, because it will allow us to switch to a more efficient implementation.
Policy-based routing at the Axoflow booth
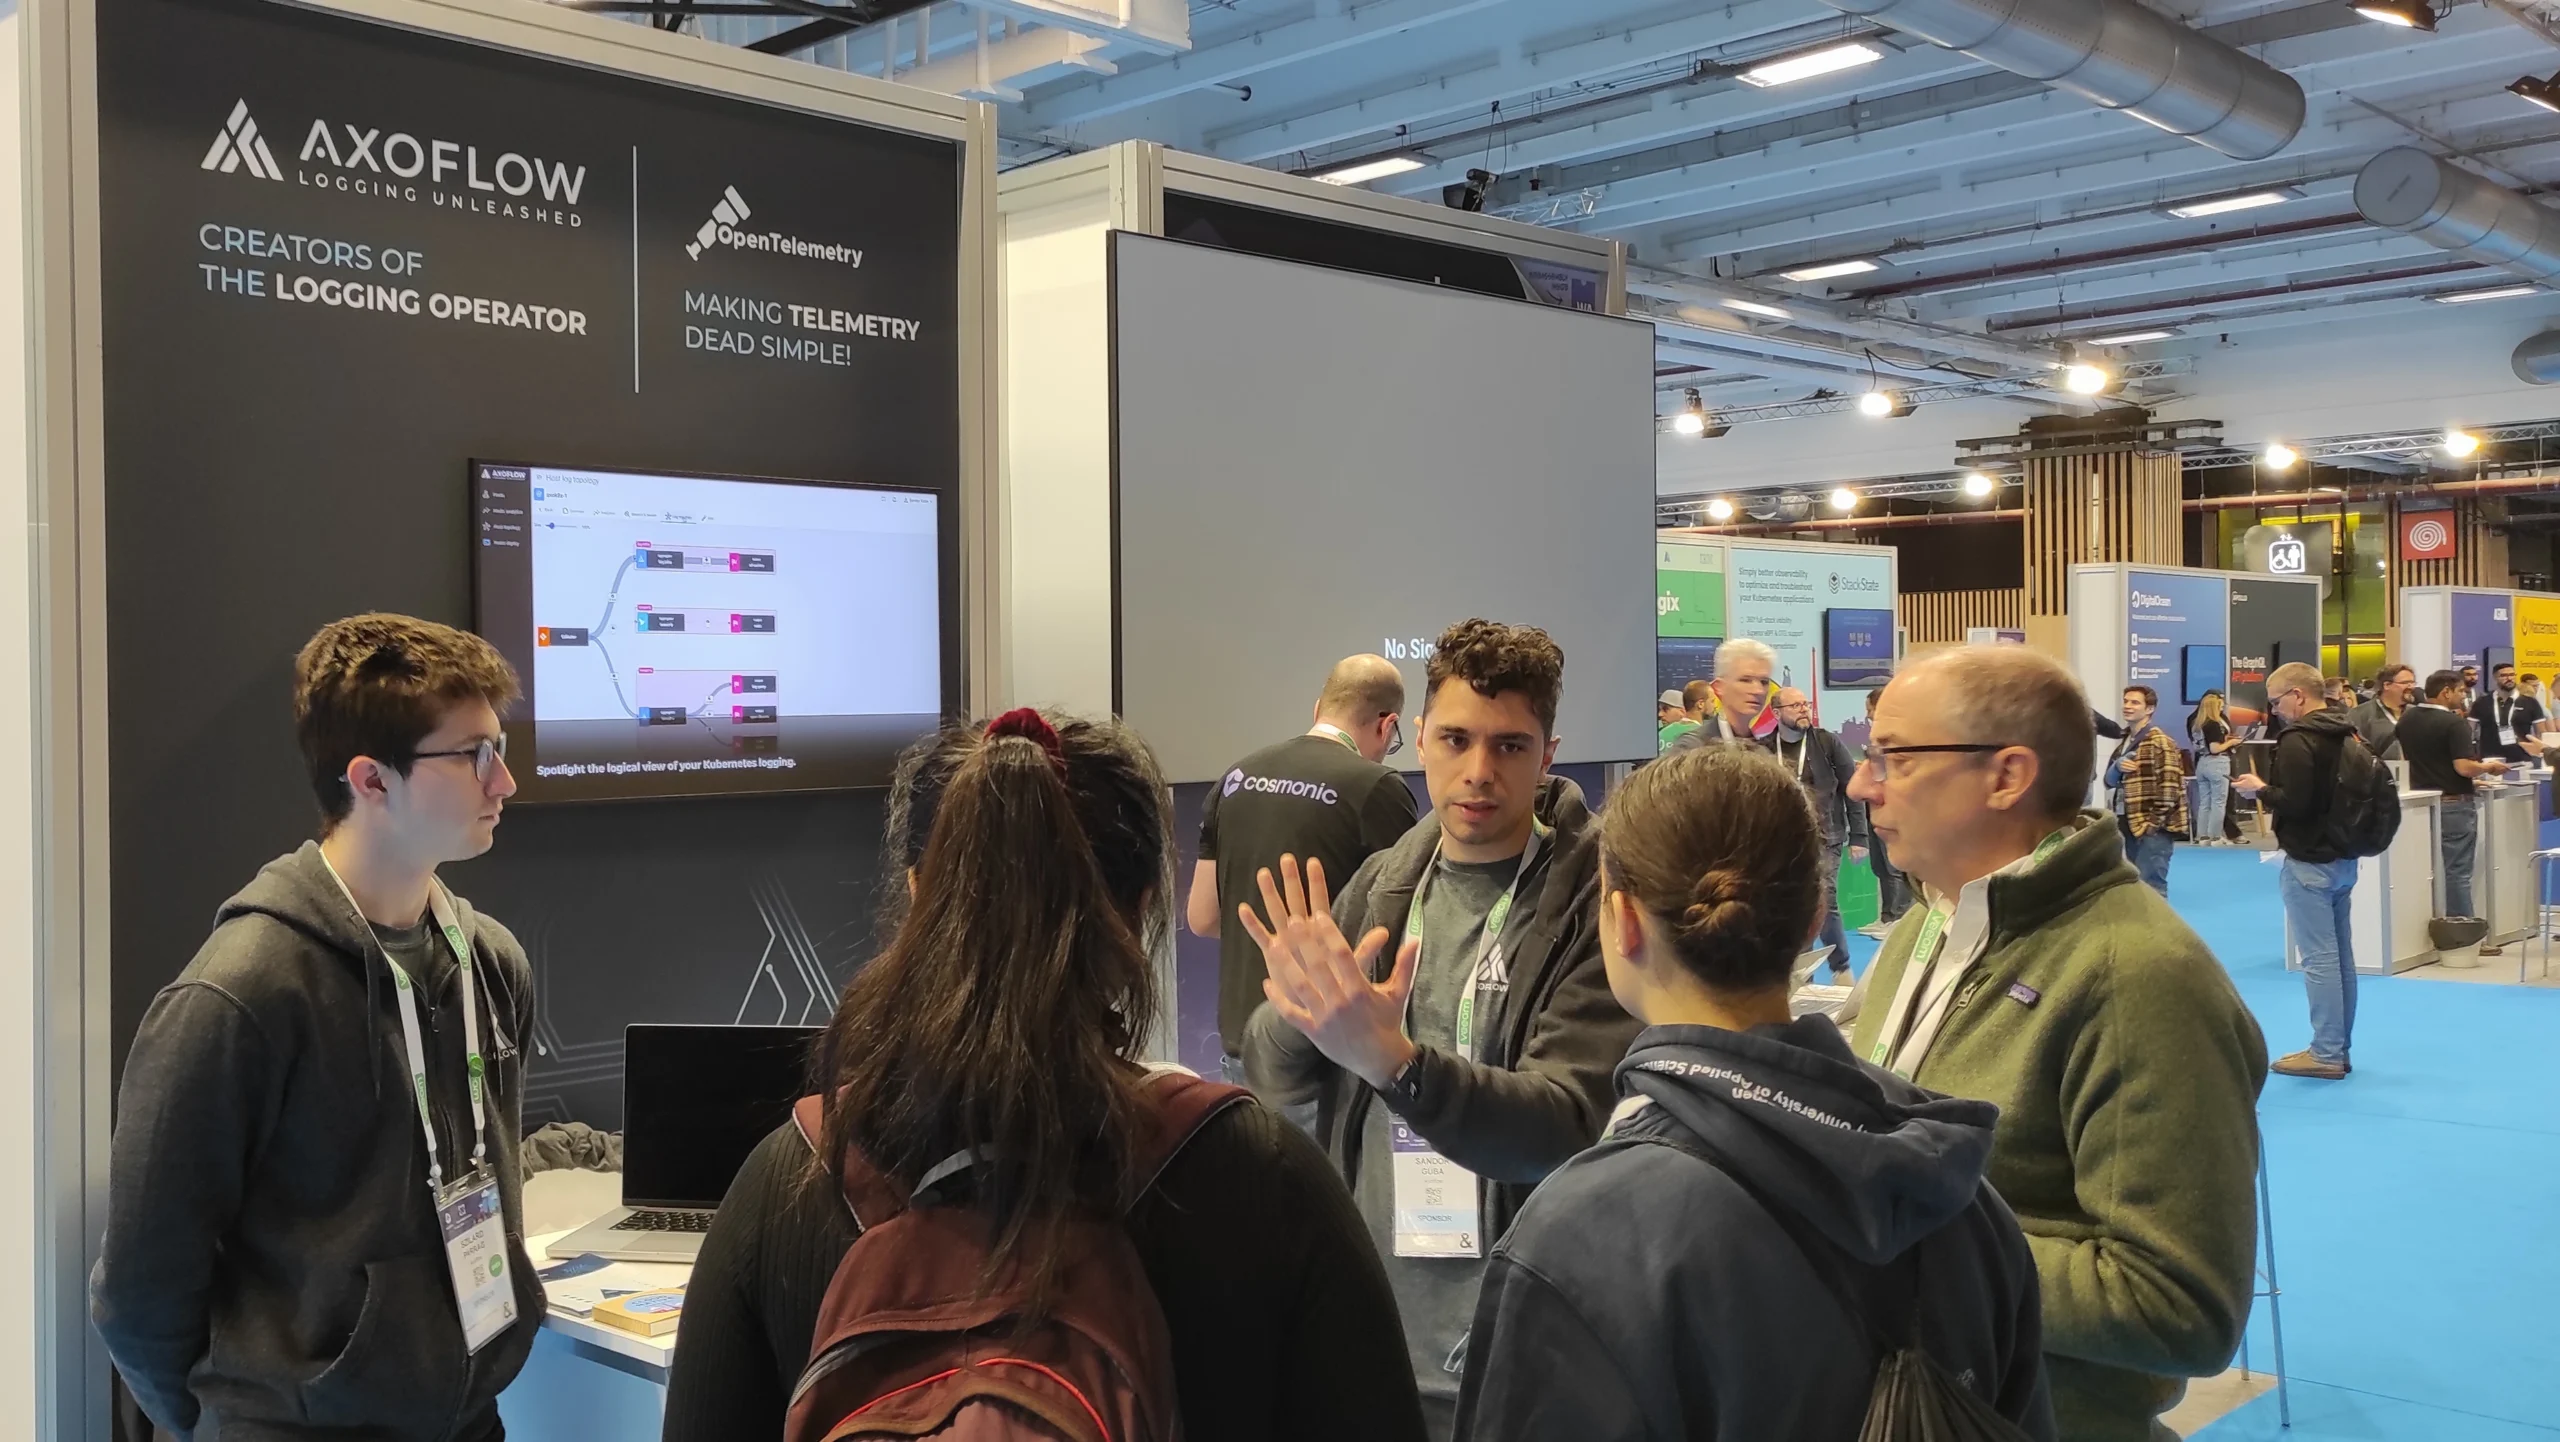
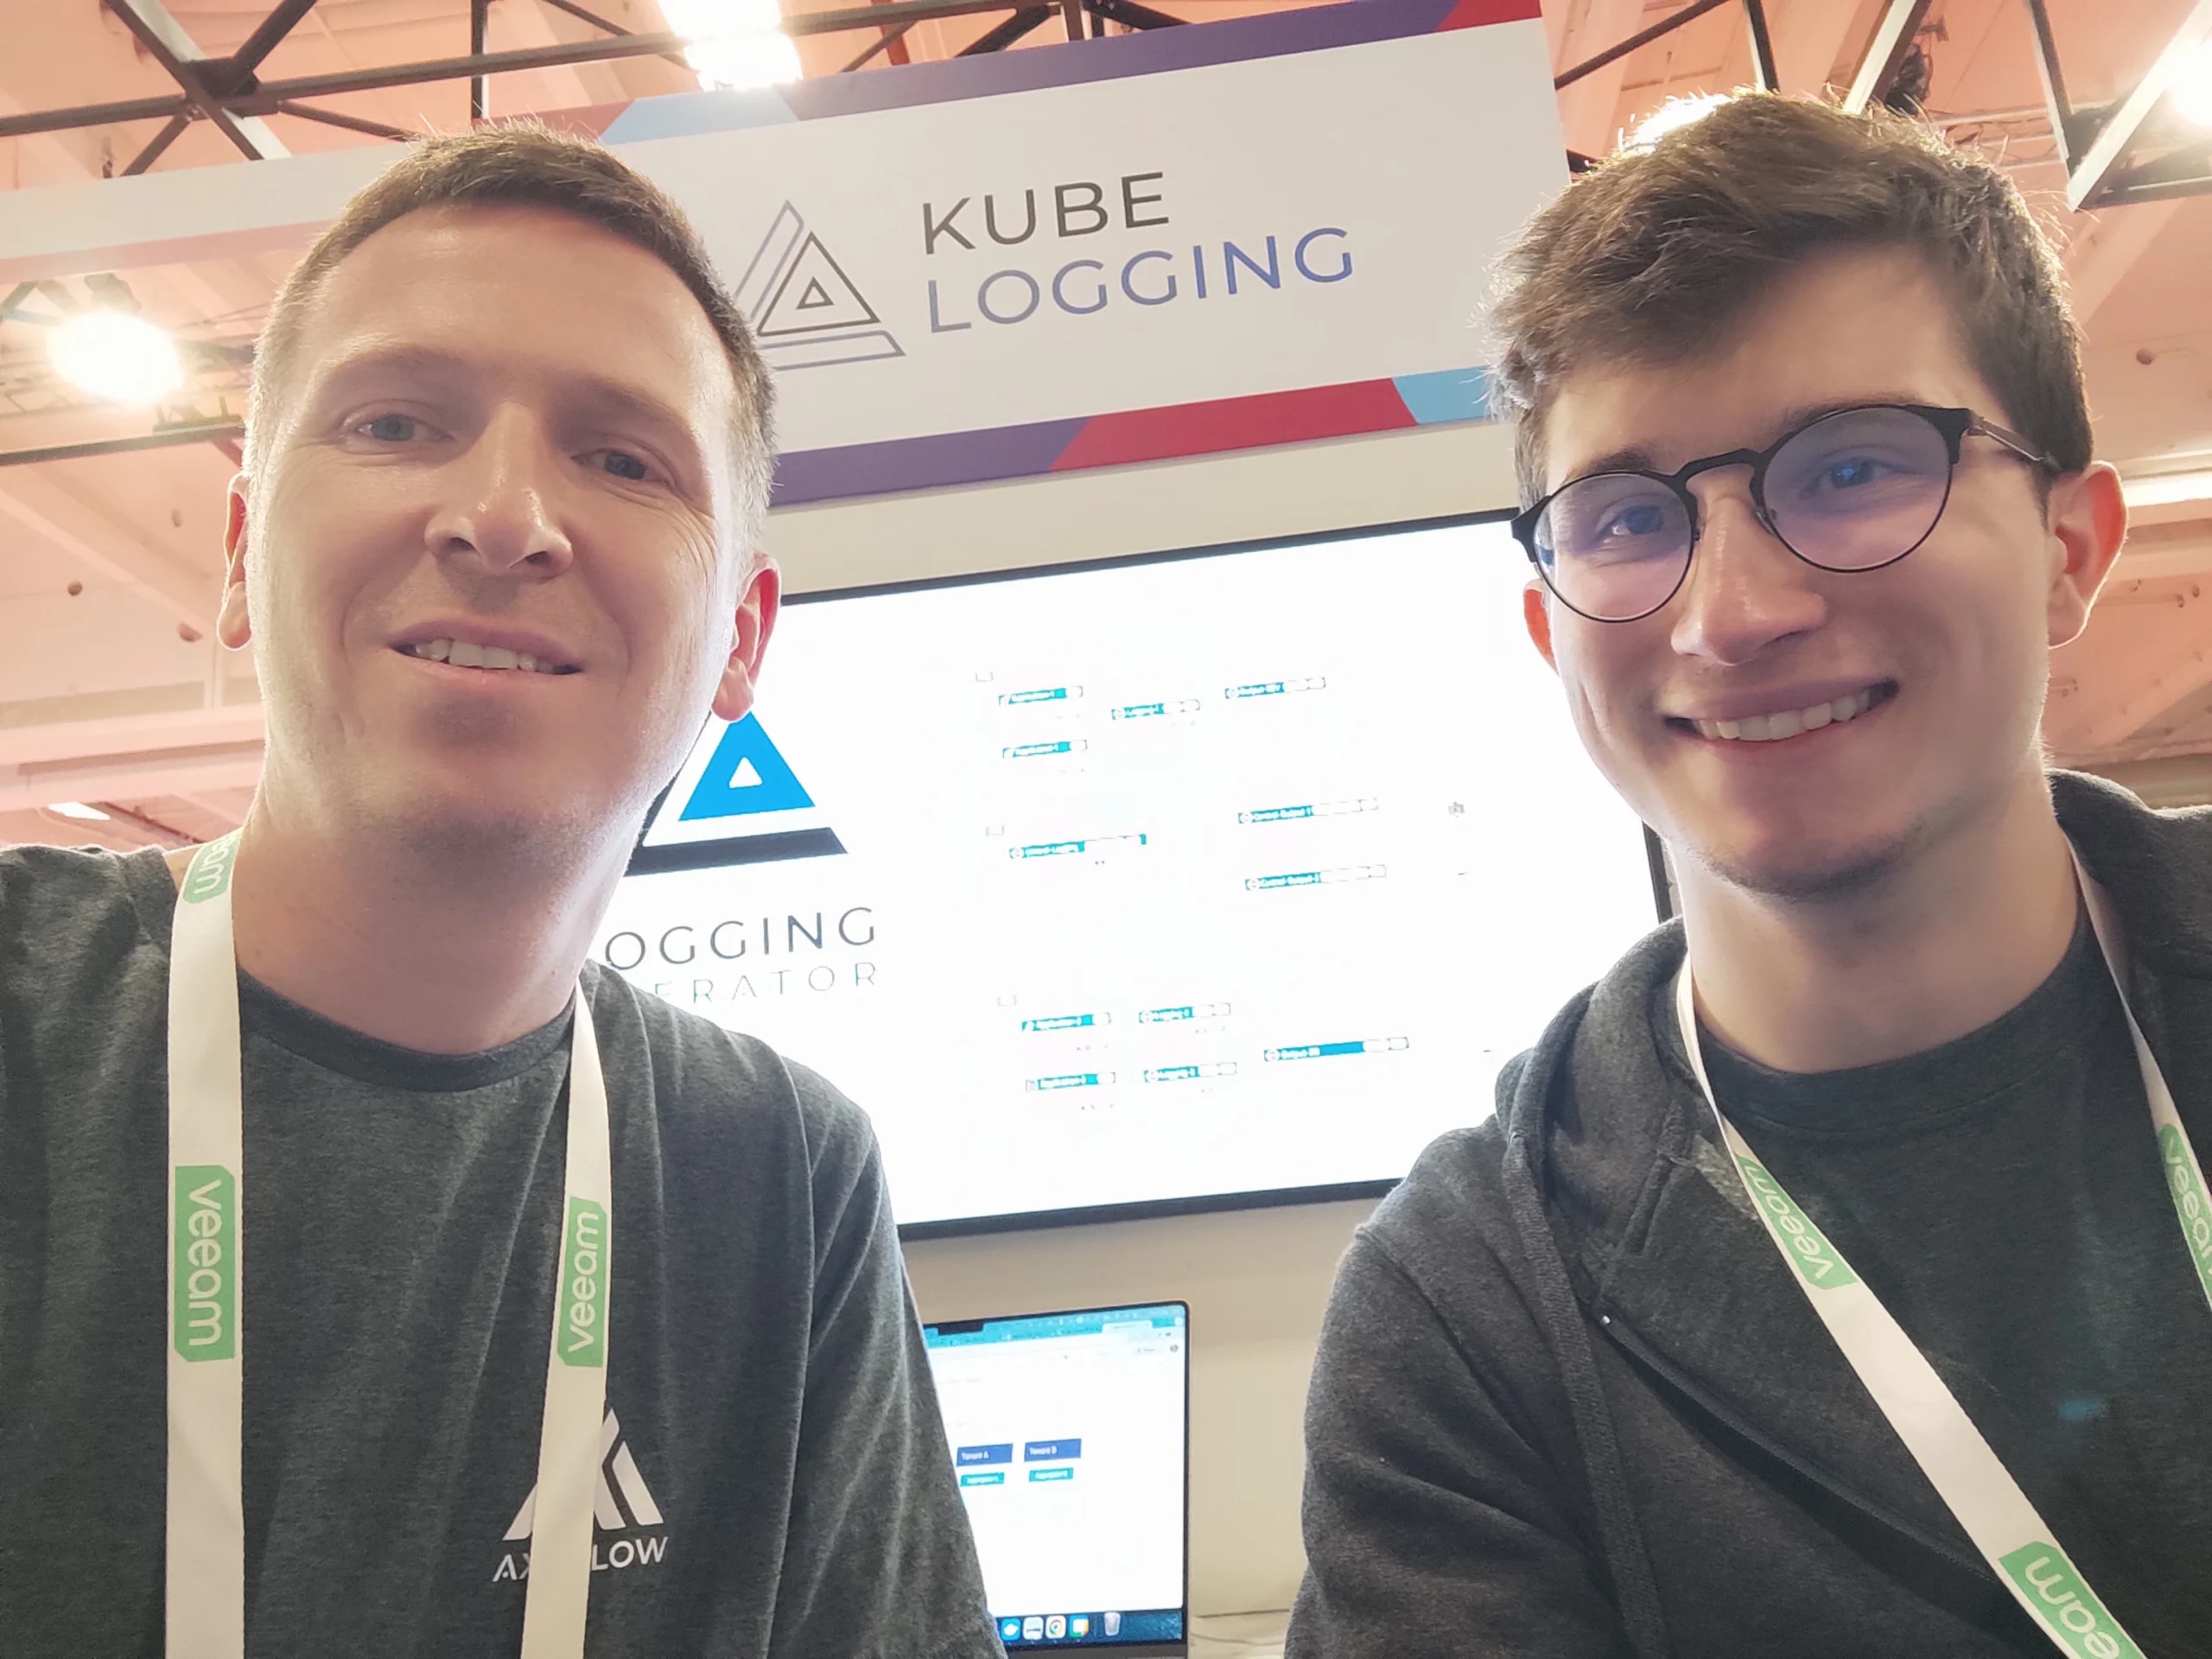
The conference days were amazing – even surpassing our Chicago experience – as we were constantly busy and had lots of interested visitors, and had exciting conversations about the Logging operator, the Telemetry Controller, and of course Axoflow at our booth.
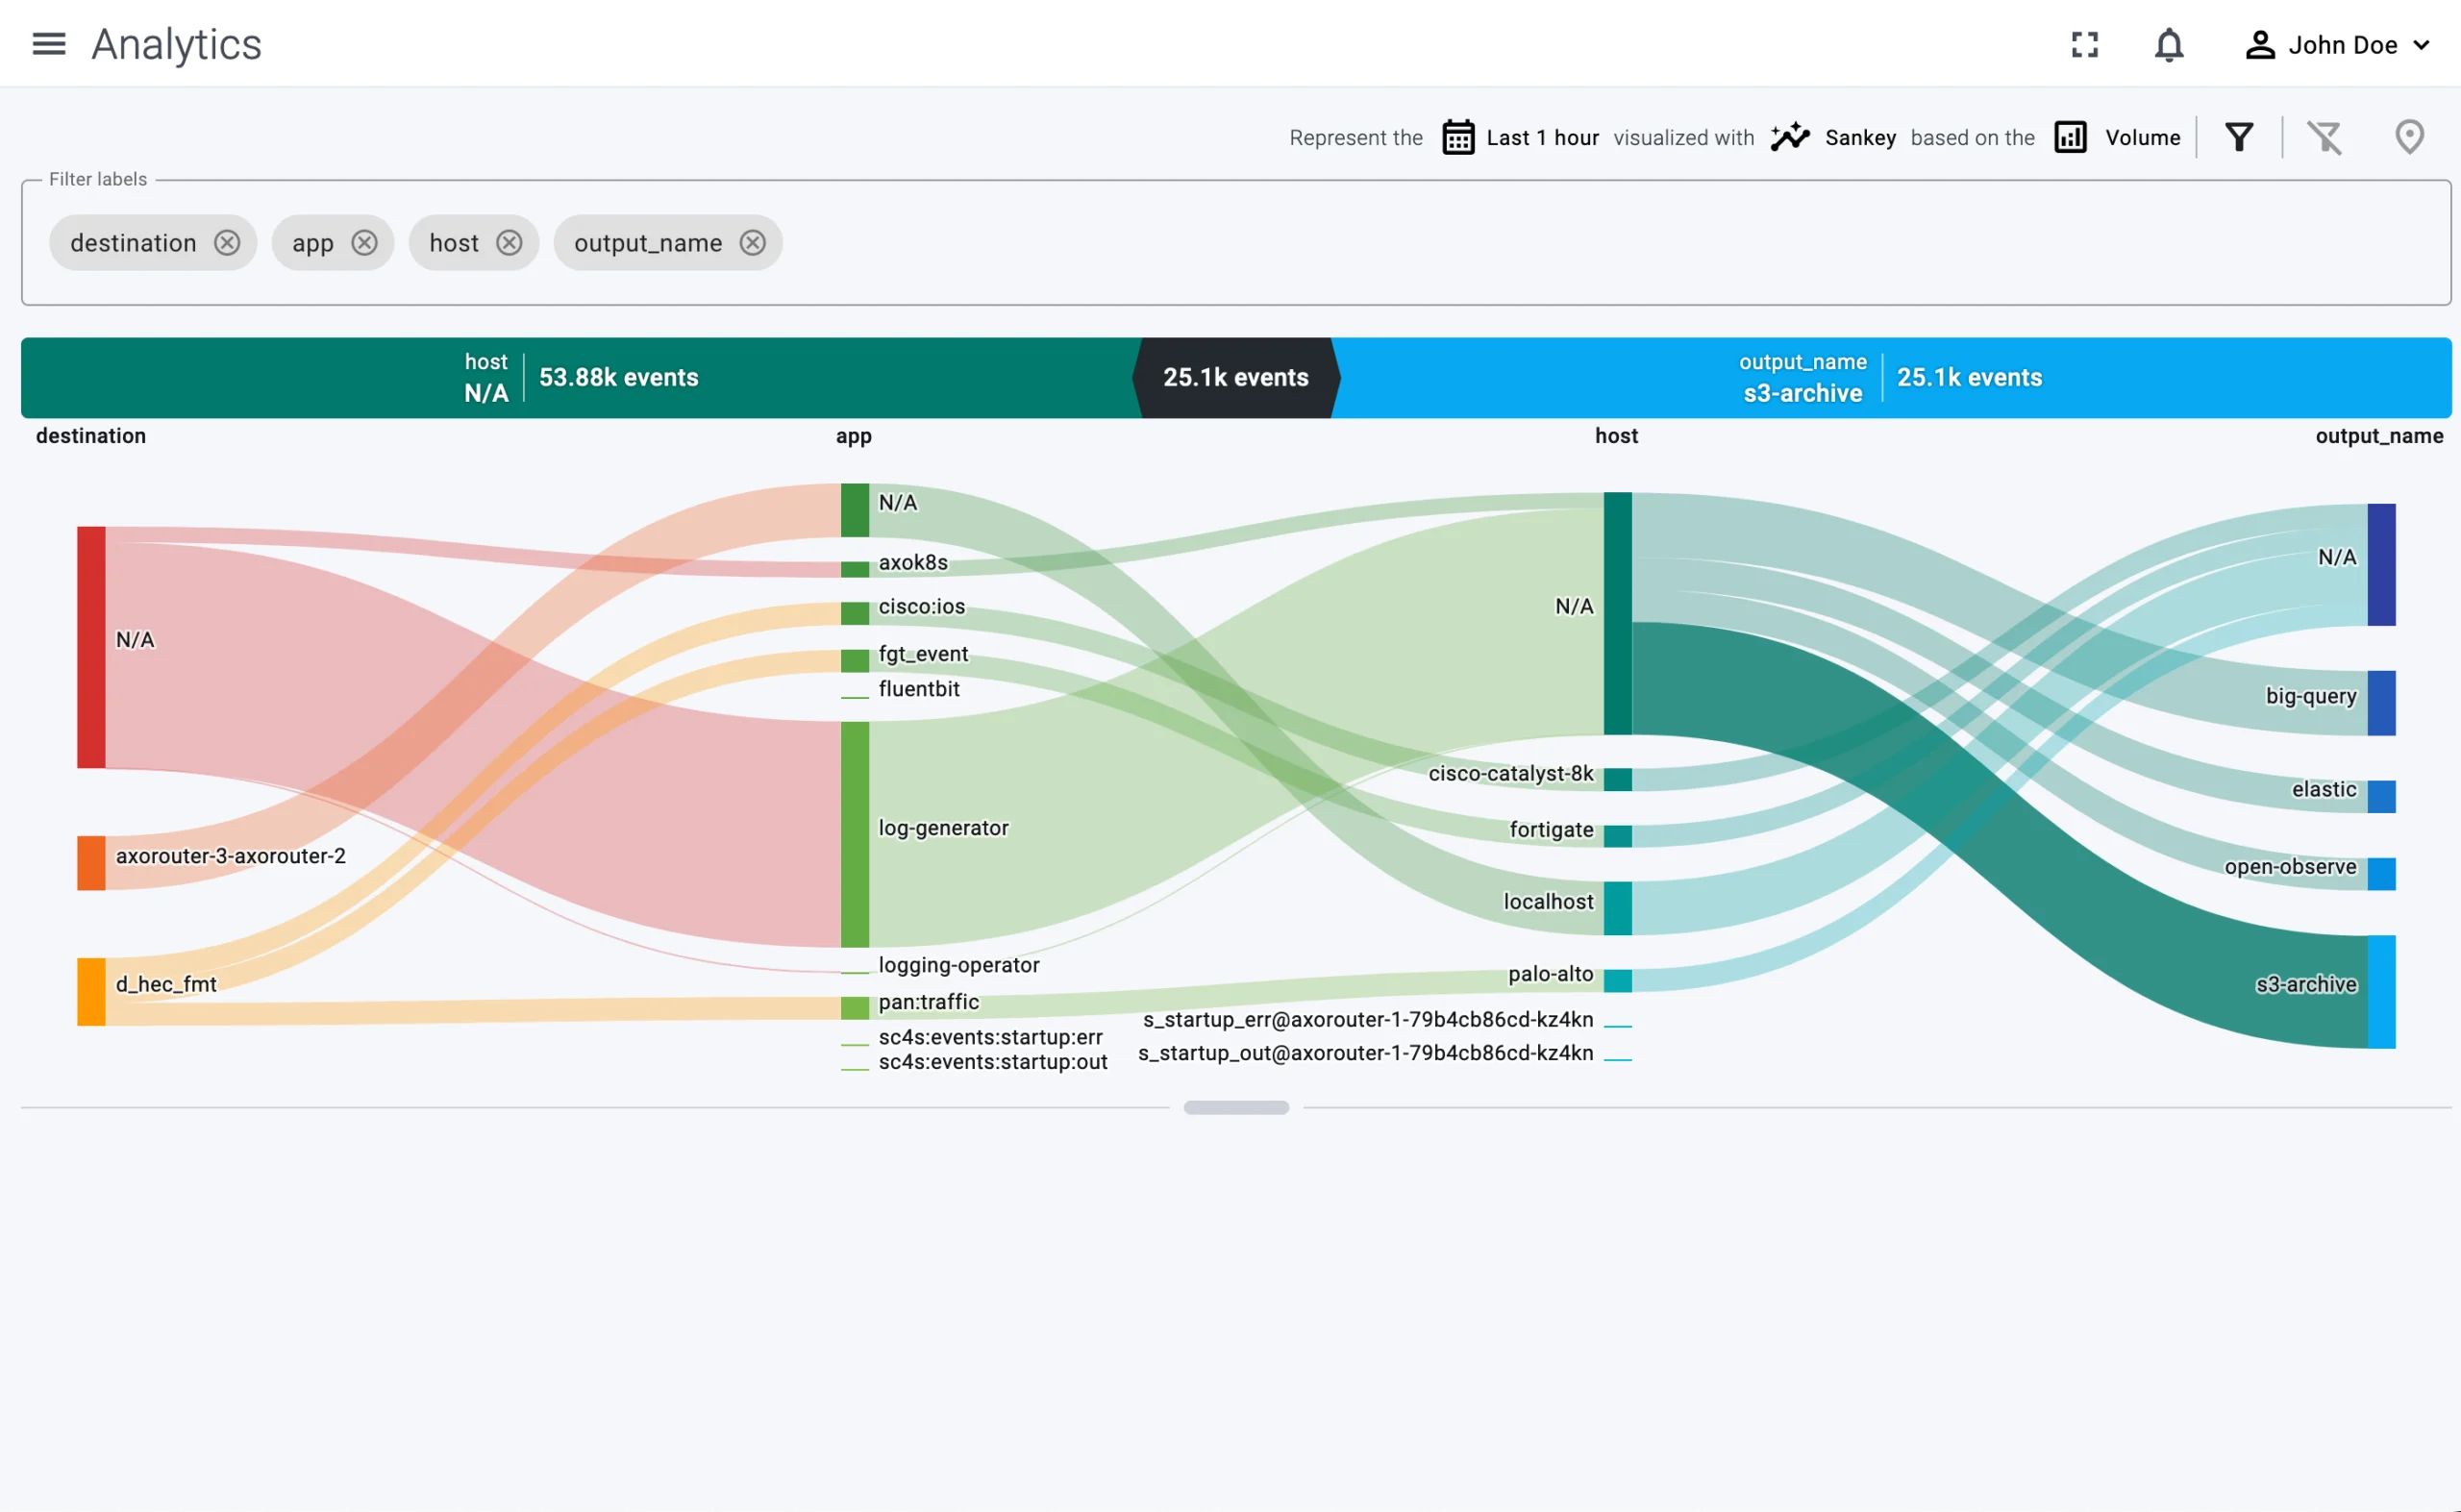
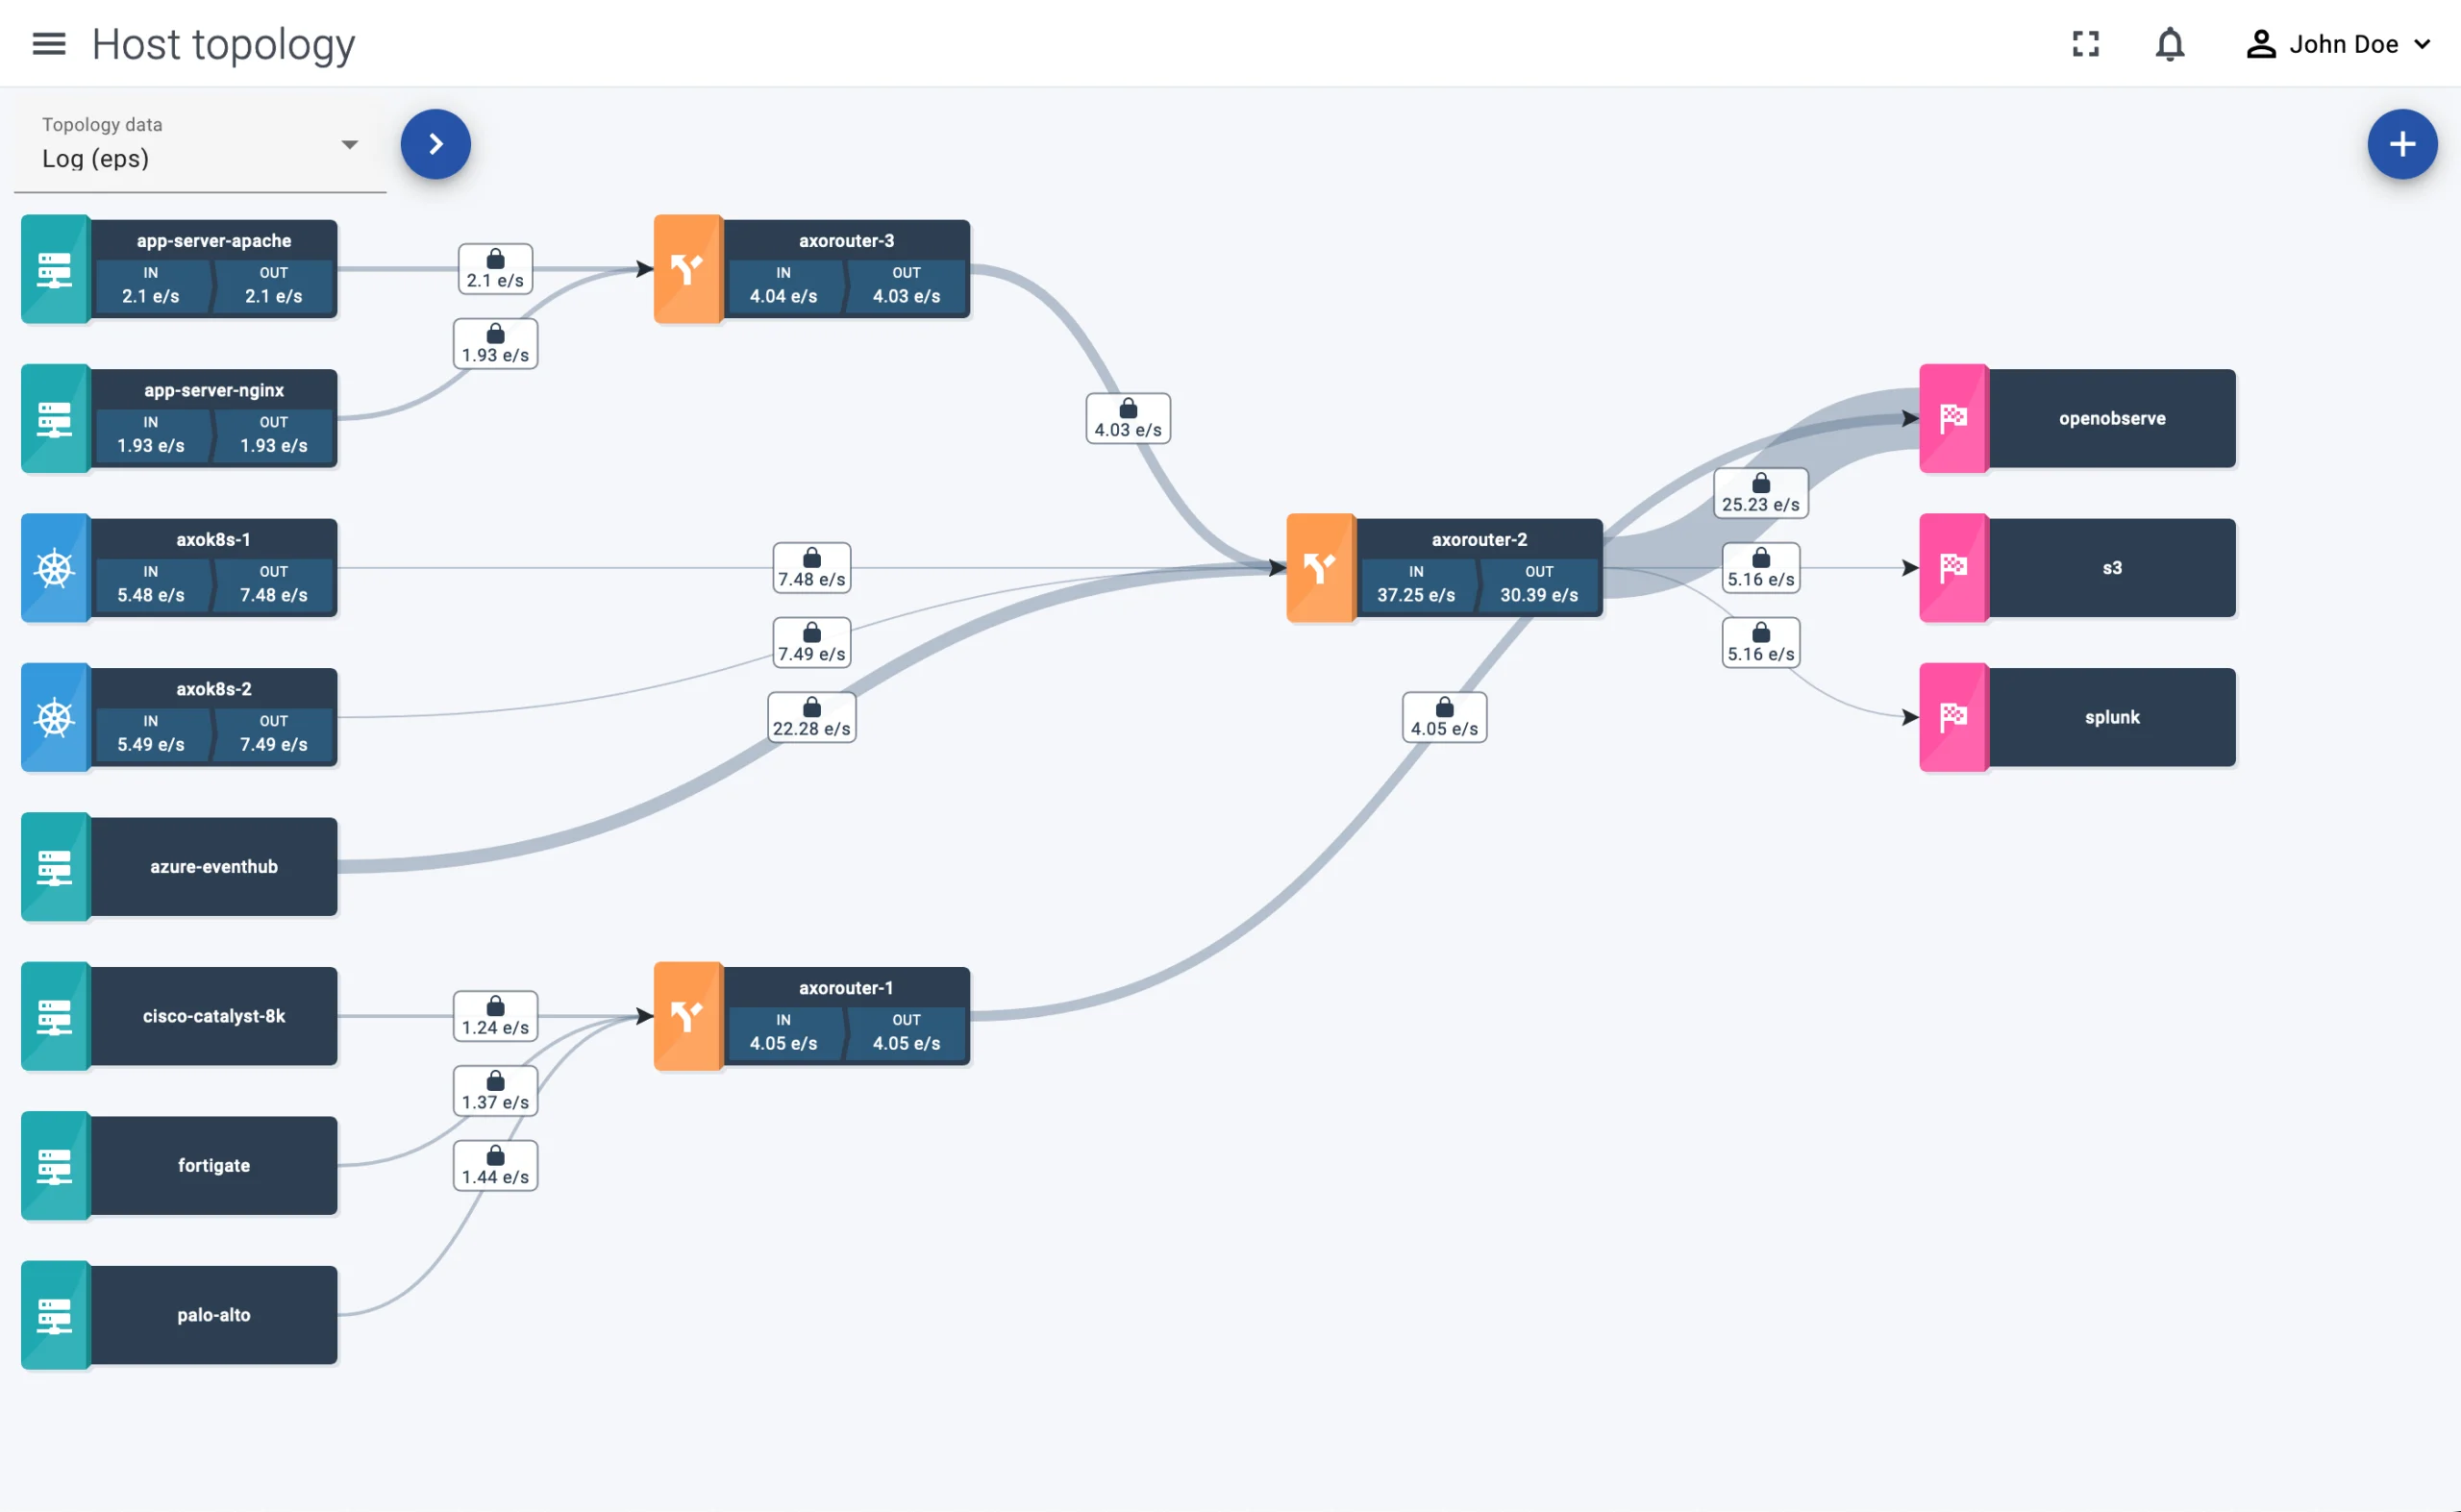
In addition to the metrics and visualization features that are already available in our closed beta environment, we’ve showcased some upcoming features that we are working on, to validate their usefulness and gather your feedback.
Policy-based log routing
Policy-based routing combined with automatic classification was exciting for many users. Policy-based routing is a concept where instead of crafting thousands of custom rules, regular expressions, and complex filters, you describe the different types of logs and where you want to route them. What’s more, you can also describe why you are doing that, so you get a record of the reason you are collecting those logs in the first place. That’s immensely useful because at most enterprises after a source gets added to the telemetry pipeline it is almost impossible to find out why it has been added, and whether every log actually needs to be stored.
Policy-based log routing and storage allows you to describe that, and to use this information to optimize both your telemetry pipeline and processing, making it possible to answer questions like:
- Do you really have to send debug logs from this host to your SIEM?
- How long should the retention period be for these logs?
- Are these logs used often, or can you store them in a slow-access, but cheaper storage?
Combined with automatic classification of log messages makes it possible to create and apply policies efficiently.
Policy-based log tracking
Tracking log types and their volumes based on metrics and metadata gives your platform engineers a holistic view of what is happening in your telemetry pipeline, and helps you spot problems like large amounts of debug logs, sources sending messages with formatting errors, and so on. That way you can not only resolve problems in the pipeline faster, but also gives you a way to improve the quality of your telemetry data.
Transformation and filtering
Transforming log messages to fix formatting errors and optimize their format to specific consumers is not new, neither is filtering the messages based on their payload content. But these features pave the way for effectively deduplicating repeated messages, which is becoming increasingly important as enterprises collect – and store – more and more data, since efficient data reduction can result in significant cost savings.
If you are interested in any of these features, request a demo. Note that we don’t offer self-service access to the Axoflow platform (yet), but we do give private beta access to seriously interested users and design partners. Contact us if you’d like to learn more!
Frequent questions and use cases
Apart from the awesome feedback we’ve received about our work on Axoflow, there were some recurring questions and use cases that our visitors were interested in.
Self-service logging configuration
This problem often comes up in multi-tenant Kubernetes environments: platform engineers would like to provide teams with the ability to configure logging on their own. That is, the platform team provides the backbone of the telemetry pipeline with a predefined set of outputs, and the teams can configure which logs and metrics to collect and where to send them.
The trick here is to provide all that and avoid the possibility of a team disrupting the logging of other teams because of a misconfiguration or a chatty host. If you need a solution for this problem, check out our Telemetry Controller project, which is designed exactly for this use case.
What are we doing with OpenTelemetry?
With OpenTelemetry being at the top of observability news and the rising number of organizations using and building on top of OpenTelemetry Collector, it’s no surprise that many of you want to know our stance on OpenTelemetry.
Well, we are actively working on:
- our own OpenTelemetry Collector distribution that we already use in the Telemetry Controller, and
- on OpenTelemetry edge (or agent) support, for example, to have Windows support out of the box, which is essential for on-prem and hybrid environments.
- In addition, we consider OTLP to be an essential transport protocol that will become increasingly widespread in the future. AxoSyslog, our cloud-ready syslog-ng distribution can already send and receive data via the OpenTelemetry Protocol. OTLP is also an effective way to transport data between AxoSyslog nodes.
Axoflow, the Logging operator, and Telemetry Controller
How are Axoflow, the Logging operator, and the Telemetry Controller related?
The Logging operator is a Kubernetes operator that manages the log pipeline and the log aggregator of a Kubernetes cluster. It’s flexible and highly configurable, but you must actively manage it, and over time its configuration can become rather complex.
The Telemetry Controller is a new project under the Logging operator, and provides an endpoint agent with routing capabilities, based on the OpenTelemetry Collector.
Both the Logging operator and the Telemetry Controller are open source projects that solve the log collection problem, mainly in Kubernetes environments.
The Axoflow platform is our commercial solution that provides observability for your telemetry pipeline, based on metadata and metrics, so your payload stays securely within your environment. Axoflow supports both Kubernetes and on-prem telemetry pipelines, and can work together with a number of existing deployments, including Logging operator, Telemetry Controller, syslog-ng (both Premium and Open Source Edition), Axosyslog, Splunk Connect for Syslog (SC4S) deployments. This means that you can begin using Axoflow right away without disrupting your existing deployment, and gain insights into your data pipeline.
Axoflow is mainly a SaaS solution, but can be deployed on-prem if requested. Our aim with the Axoflow platform is to make the telemetry pipeline more effective via data transformation, cost reduction, and routing optimization.
Logging Operator Project Highlights at KubeCon
As core maintainers of the Logging operator, a CNCF sandbox project, the Axoflow team promoted the Logging operator project at the CNCF project booth. We extend our heartfelt gratitude to CNCF for providing us with the opportunity to showcase our project at the booth. It was an invaluable experience, and we look forward to continuing our collaborative journey with the community.
We were thrilled to interact with a myriad of visitors, both seasoned users and newcomers, who dropped by to express their appreciation for the project, and share their experiences with us. It’s always encouraging to receive such positive feedback, and get confirmation that we really bring value to the community.
Multi-tenancy, OpenTelemetry, and the Logging operator
One prominent topic was the integration of OpenTelemetry with the Logging Operator. As we have already mentioned in this post, the Telemetry Controller builds on OpenTelemetry Collector to be an easy-to-use log and metrics collector for the edge.
Another recurring question was about multi-tenancy support within the Logging Operator. As we have been actively working on this feature, your overwhelming interest has validated that this is a valuable feature for many of you. For details, check our related blog posts: Log Isolation on Shared Kubernetes Infrastructure, Multi-tenancy using Logging operator, and subscribe to our newsletter, or follow us on LinkedIn to get updates. Also, we’ll add more details about such use cases to the Logging operator documentation.
Additional discussions gravitated towards using GitOps workflows for log management with the Logging operator. We’re delighted to confirm that the Logging operator fully supports this approach, enabling users to streamline their operations and maintain consistency across environments.
Summary
KubeCon was once again an intensive experience well worth the effort. It was truly amazing to meet so many of you to discuss your observability needs. We’ve learned a lot about what concerns and issues you are facing, and hope that we’ve managed to show you possible solutions at least for some of them. If you couldn’t attend KubeCon and have any questions about Logging operator, the Telemetry Controller, or Axoflow, contact us!

Follow Our Progress!
We are excited to be realizing our vision above with a full Axoflow product suite.
