Select in which scenario you want to start using Axoflow:
- Deploy an AxoRouter and send data into a local AxoStore: see Getting started using AxoStore.
- Deploy an AxoRouter and send data to Splunk or a similar SIEM: see Getting started using a SIEM.
This is the multi-page printable view of this section. Click here to print.
Select in which scenario you want to start using Axoflow:
This guide shows you how to get started with Axoflow, and use the built-in AxoStore for destination. You’re going to install AxoRouter, and configure or create a source to send data to AxoRouter. You’ll also configure AxoRouter to forward the received data to AxoStore, a temporary storage solution available on the AxoRouter host. The resulting topology will look something like this:

Using the Axoflow security data pipeline automatically corrects and augments the security data you collect, resulting in high-quality, curated, SIEM-optimized data. It also removes redundant data to reduce storage and SIEM costs. In addition, it allows automates pipeline configuration and provides metrics and alerts for your telemetry data flows.
You’ll need:
An Axoflow subscription, access to a free evaluation version, or an on-premise deployment.
A data source. This can be any host that you can configure to send syslog or OpenTelemetry data to your AxoRouter instance that you’ll install.
A host that you’ll install AxoRouter on. This can be a separate Linux host, or a virtual machine running on your local computer.
AxoRouter should work on most Red Hat and Debian compatible Linux distributions. For production environments, we recommend using Red Hat 9.
The hosts must be able to access the following domains related to the AxoConsole:
When using AxoConsole SaaS:
<your-tenant-id>.cloud.axoflow.io: HTTPS traffic on TCP port 443, needed to download the binaries for Axoflow software (like Axolet and AxoRouter).kcp.<your-tenant-id>.cloud.axoflow.io: HTTPS (mutual TLS) traffic on TCP port 443 for management traffic.telemetry.<your-tenant-id>.cloud.axoflow.io: HTTPS (mutual TLS) traffic on TCP port 443, where Axolet sends the metrics of the host.us-docker.pkg.dev: HTTPS traffic on TCP port 443, for pulling container images (AxoRouter only).When using an on-premise AxoConsole:
The following domains should point to AxoConsole IP address to access Axoflow from your desktop and AxoRouter hosts:
your-host.your-domain: The main domain of your AxoConsole deployment.authenticate.your-host.your-domain: A subdomain used for authentication.idp.your-host.your-domain: A subdomain for the identity provider.The AxoConsole host must have the following Open Ports:
When installing Axoflow agent for Windows or Linux:
github.com: HTTPS traffic on TCP port 443, for downloading installer packages.Verify that you have access to the AxoConsole.
https://<your-tenant-id>.axoflow.io/ in your browser.Deploy an AxoRouter instance that will route, curate, and enrich your log data.
Select Routers > Add Router.
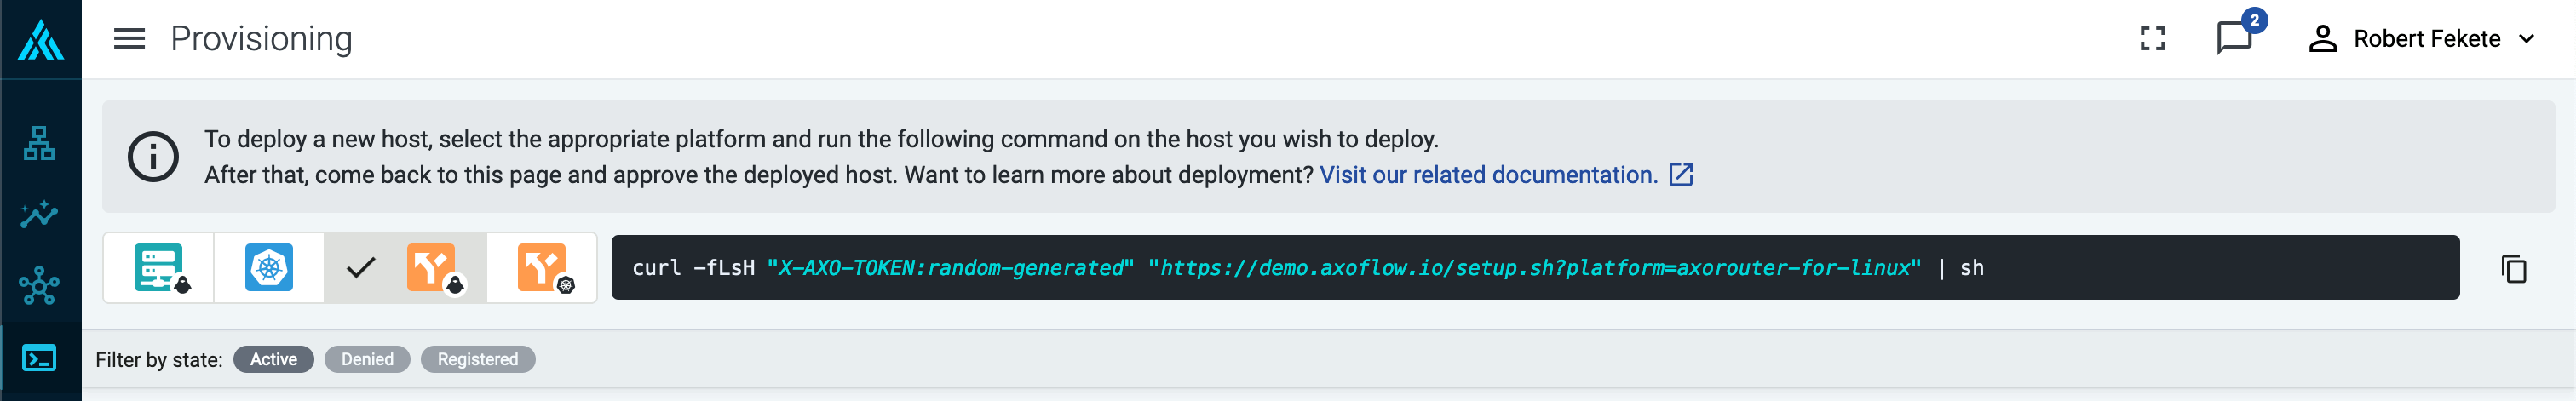
Select the platform (Linux). The one-liner installation command is displayed.
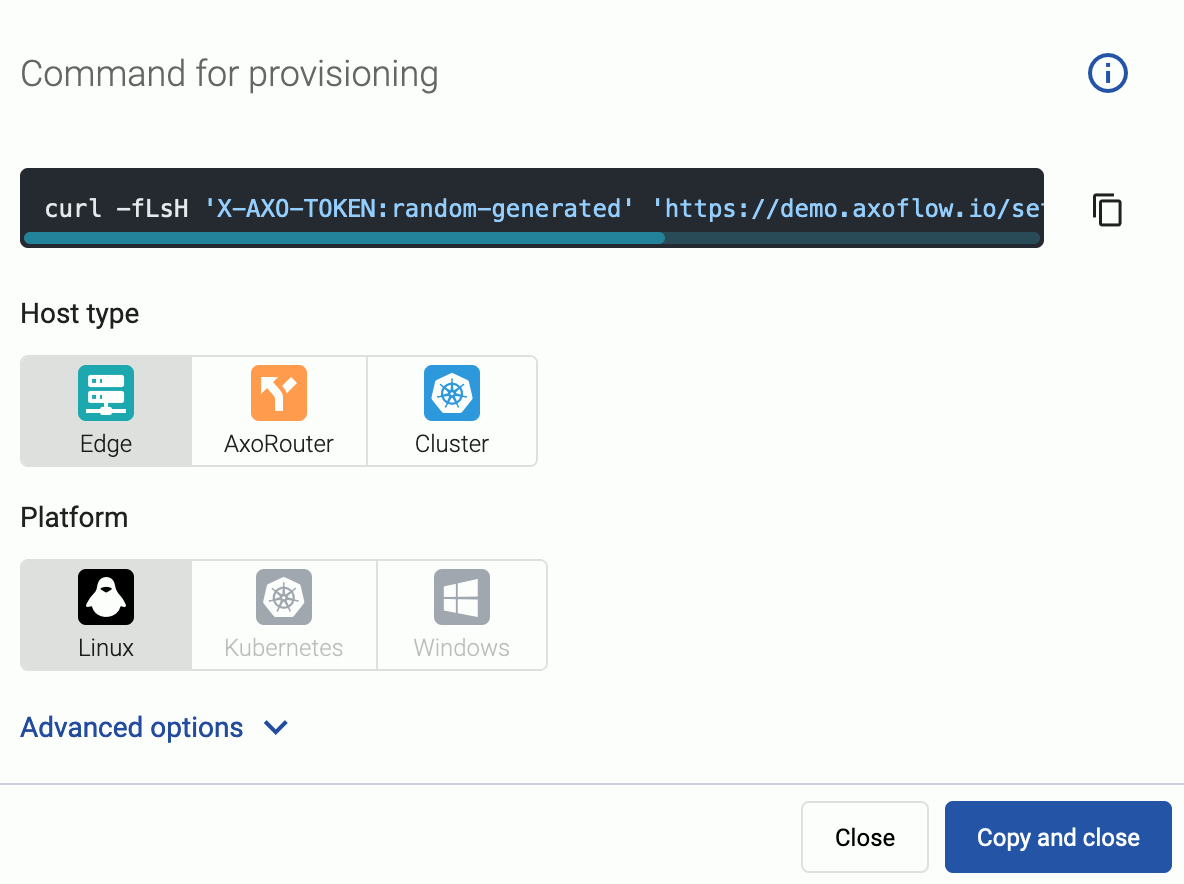
(Optional) If you don’t want to store any logs locally on AxoRouter, disable AxoStore, select Advanced options, scroll down, and deselect Enable AxoStore.
(Optional)
If needed, set the Advanced options (for example, proxy settings) to modify the installation parameters. Usually, you don’t have to use advanced options unless the Axoflow support team instructs you to do so.
Open a terminal on the host where you want to install AxoRouter.
Run the one-liner, then follow the on-screen instructions.
sudo would mask environment variables of the calling shell. Either start the whole procedure from a root shell, or let the install script call sudo when it needs to. In other words: don’t add the sudo command to the provisioning command.
Example output:
Do you want to install AxoRouter now? [Y]

% Total    % Received % Xferd  Average Speed   Time    Time     Time  Current
                                Dload  Upload   Total   Spent    Left  Speed
100  5480  100  5480    0     0  32076      0 --:--:-- --:--:-- --:--:-- 33414
Selecting previously unselected package axorouter.
(Reading database ... 17697 files and directories currently installed.)
Preparing to unpack axorouter.deb ...
Unpacking axorouter (0.66.0) ...
Setting up axorouter (0.66.0) ...
Low maximum socket receive buffer size value detected: 7500000 bytes (7.2MB).
Do you you want to permanently set the net.core.rmem_max sysctl value to 33554432 bytes (32MB) on this system? [Y]

net.core.rmem_max = 33554432
Created symlink '/etc/systemd/system/multi-user.target.wants/axostore.path' → '/etc/systemd/system/axostore.path'.
Created symlink '/etc/systemd/system/multi-user.target.wants/axorouter-wec.path' → '/etc/systemd/system/axorouter-wec.path'.
% Total    % Received % Xferd  Average Speed   Time    Time     Time  Current
                                Dload  Upload   Total   Spent    Left  Speed
100 42.9M  100 42.9M    0     0  28.1M      0  0:00:01  0:00:01 --:--:-- 28.2M
Selecting previously unselected package axolet.
(Reading database ... 17707 files and directories currently installed.)
Preparing to unpack axolet.deb ...
Unpacking axolet (0.66.0) ...
Setting up axolet (0.66.0) ...
Created symlink '/etc/systemd/system/multi-user.target.wants/axolet.service' → '/usr/lib/systemd/system/axolet.service'.
Now continue with onboarding the host on the Axoflow web UI.
Register the host.
Reload the Provisioning page. There should be a registration request for the new AxoRouter deployment. Select ✓.
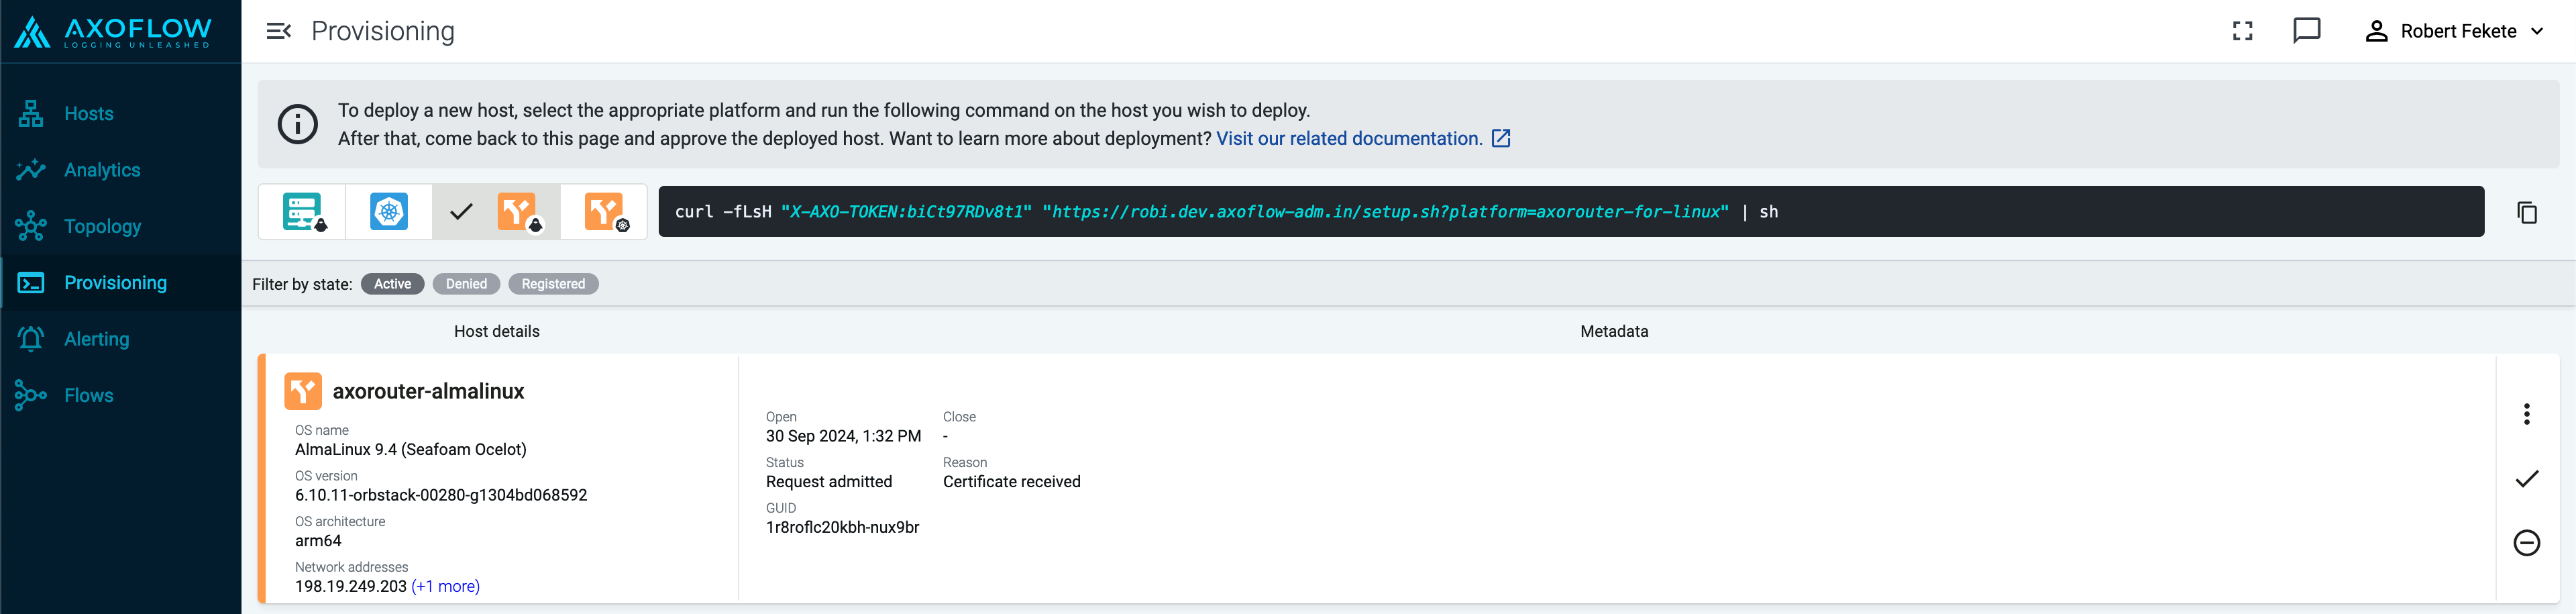
Select Register to register the host. You can add a description and labels (in label:value format) to the host.
If the primary IP address (the first IP address shown in the Network addresses section on the Routers page for each AxoRouter) is not accessible from your edge hosts, set a Network address override (IP address or an FQDN) that’s accessible. Otherwise, data forwarding from edge hosts will fail.
Select the Topology page. The new AxoRouter instance is displayed.
Configure a host to send data to AxoRouter.
Log in to your device. You need administrator privileges to perform the configuration.
If needed, enable syslog forwarding on the device.
Set AxoRouter as the syslog server. Typically, you can configure the following parameters:
Name or IP Address of the syslog server: Set the address of your AxoRouter.
Protocol: If possible, set TCP or TLS.
Syslog Format: If possible, set RFC5424 (or equivalent), otherwise leave the default.
Port: Set a port appropriate for the protocol and syslog format you have configured.
By default, AxoRouter accepts data on the following ports (unless you’ve modified the default connector rules):
To receive data on other ports or other protocols, configure other connector rules for the AxoRouter host.
For TLS-encrypted syslog connections, create a new connector rule or edit an existing one, and configure the keys and certificates needed to encrypt the connections. For details, see Syslog.
Add the source to AxoConsole.
Open the AxoConsole and select Topology.
Select Add Item > Source.
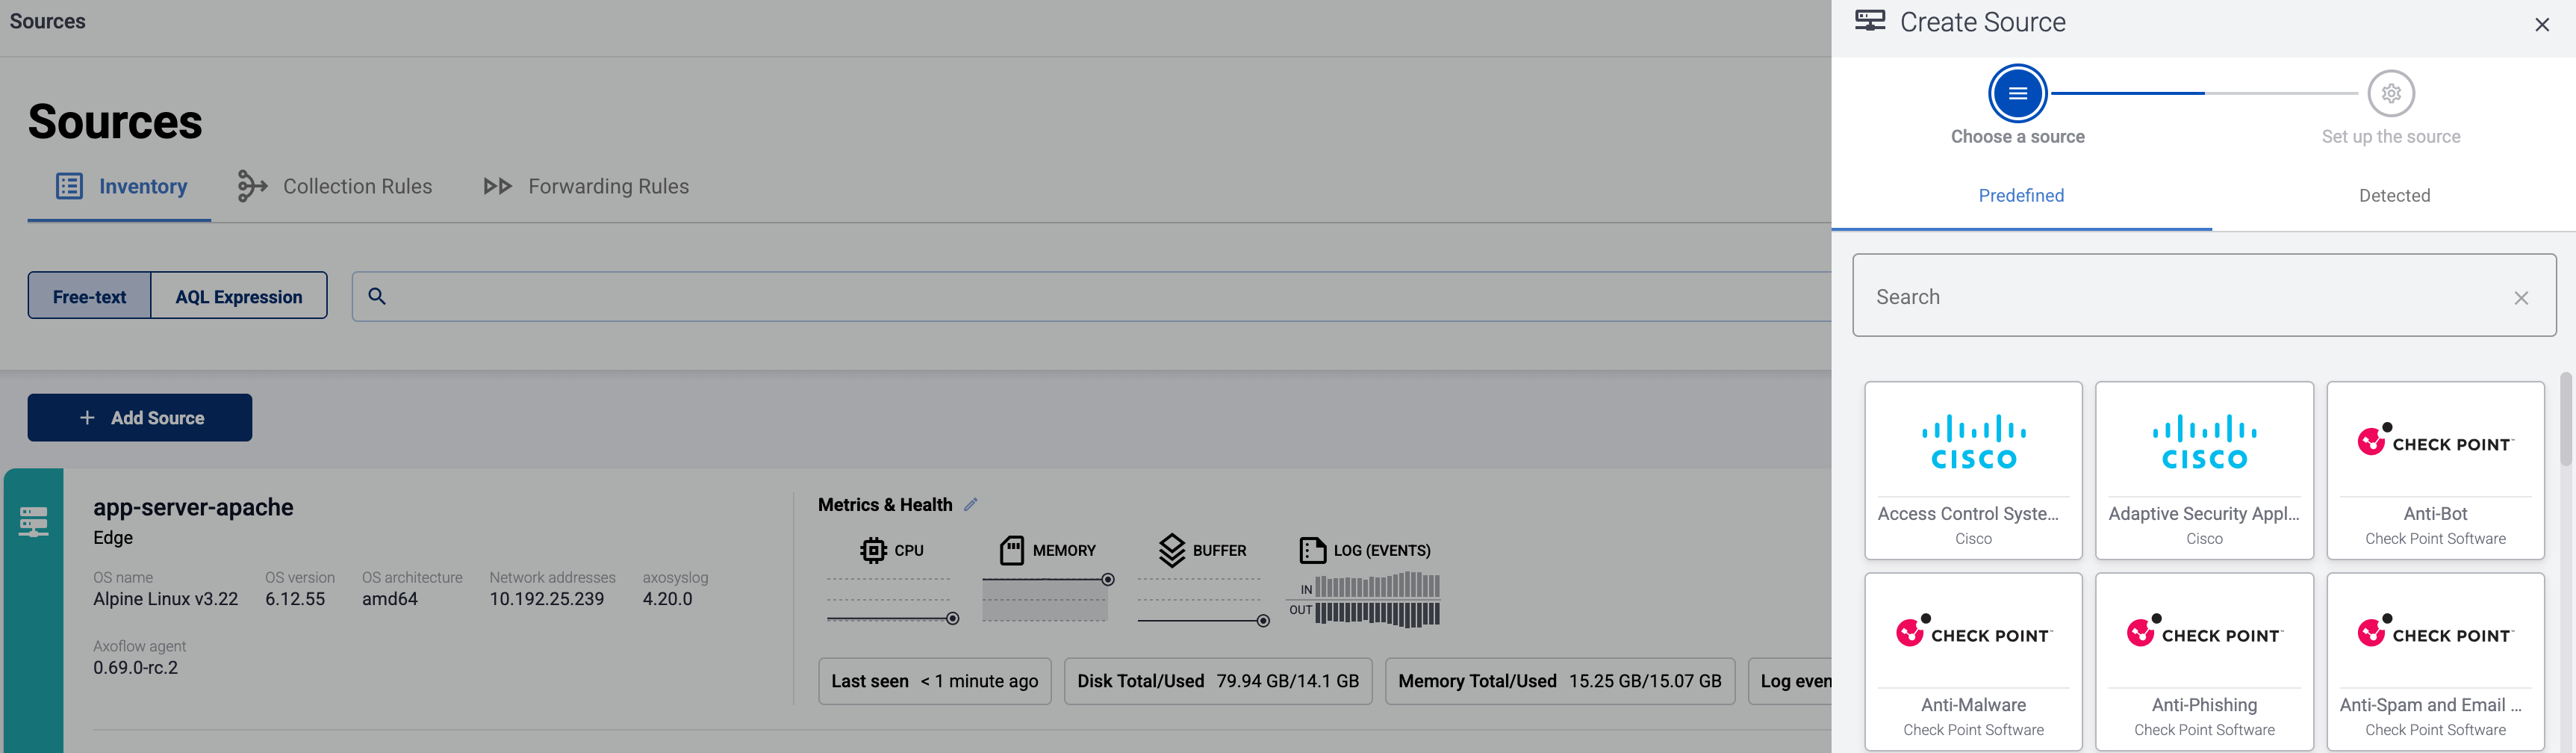
If the source is actively sending data to an AxoRouter instance, select Detected, then select your source.
Otherwise, select the vendor and product corresponding to your source from the Predefined sources, then enter the parameters of the source, like IP address and FQDN.
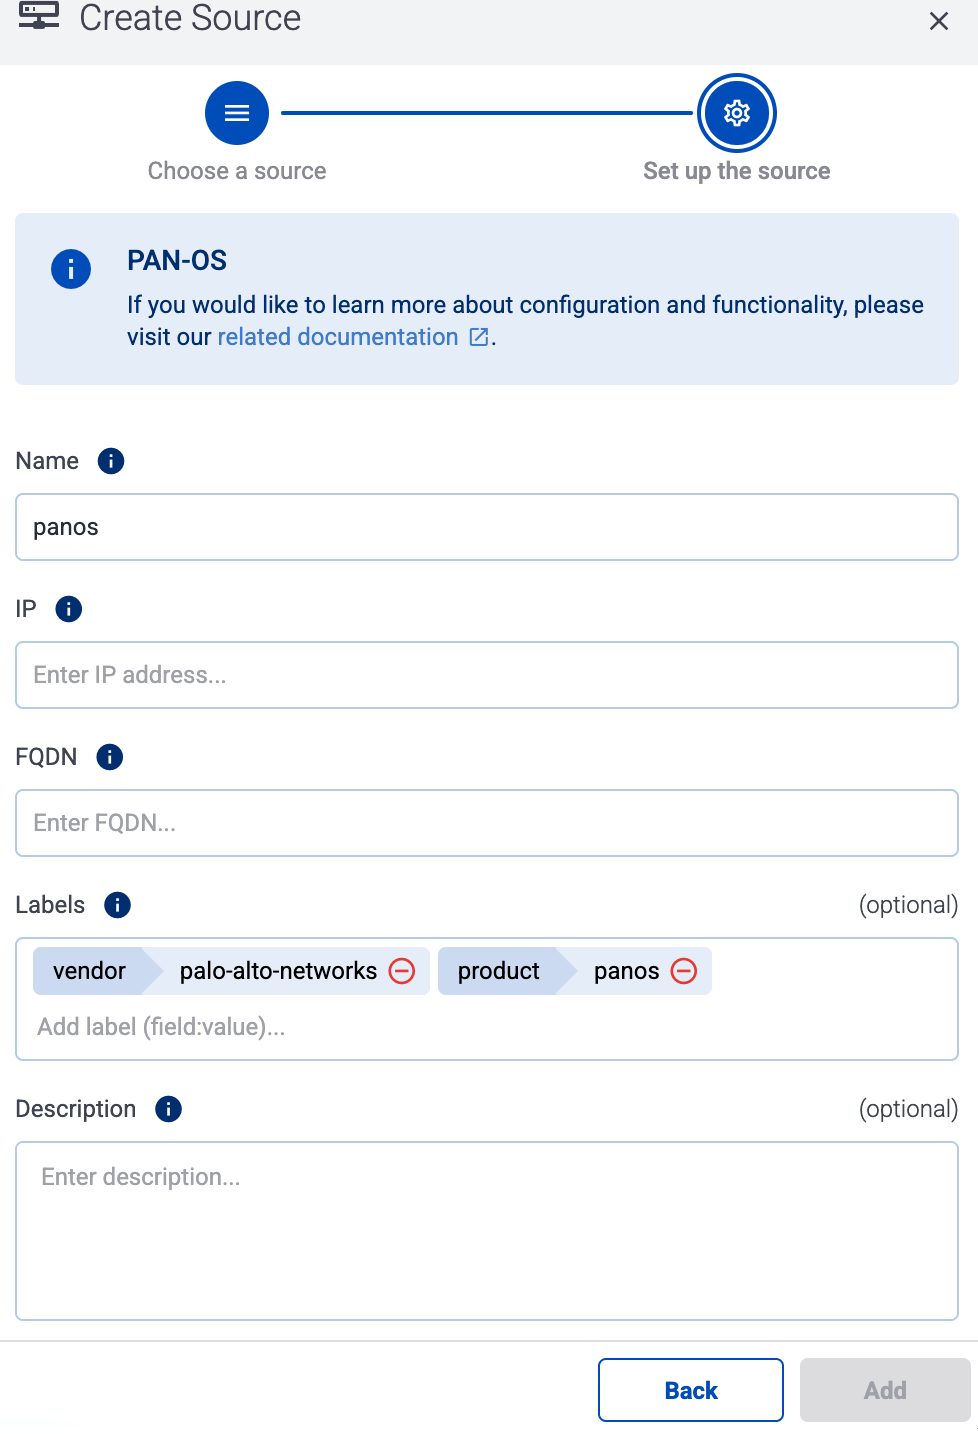
(Optional) Add custom labels as needed.
Select Add.
Select Topology > Add Item > Path.
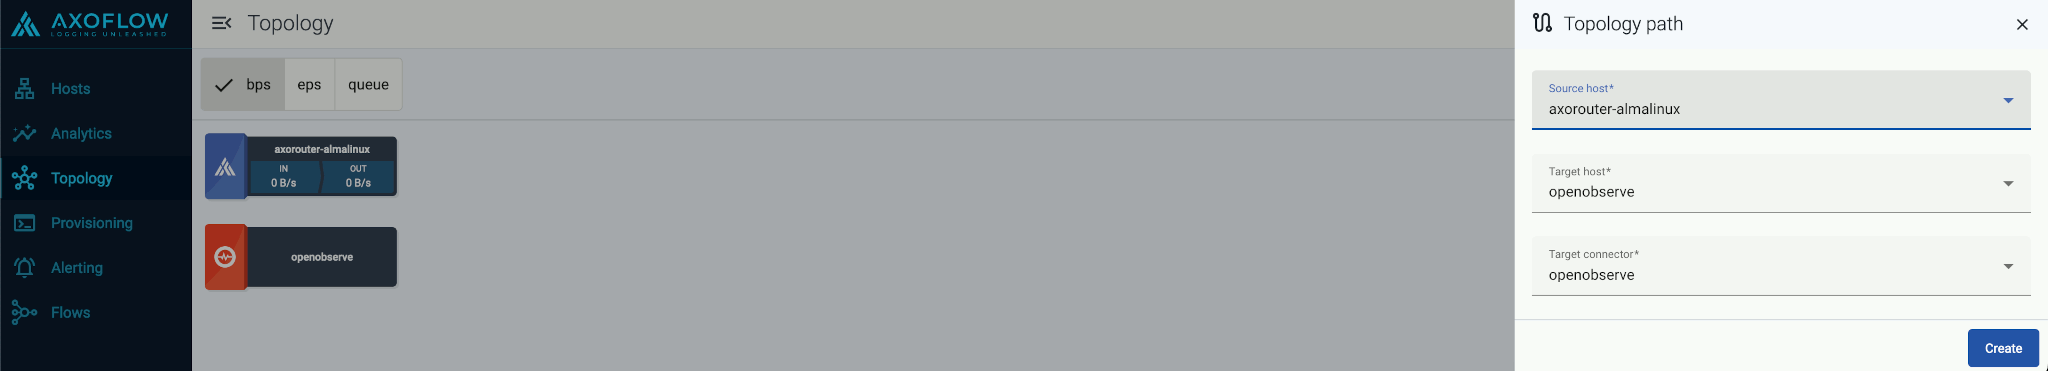
Select your data source in the Source host field.
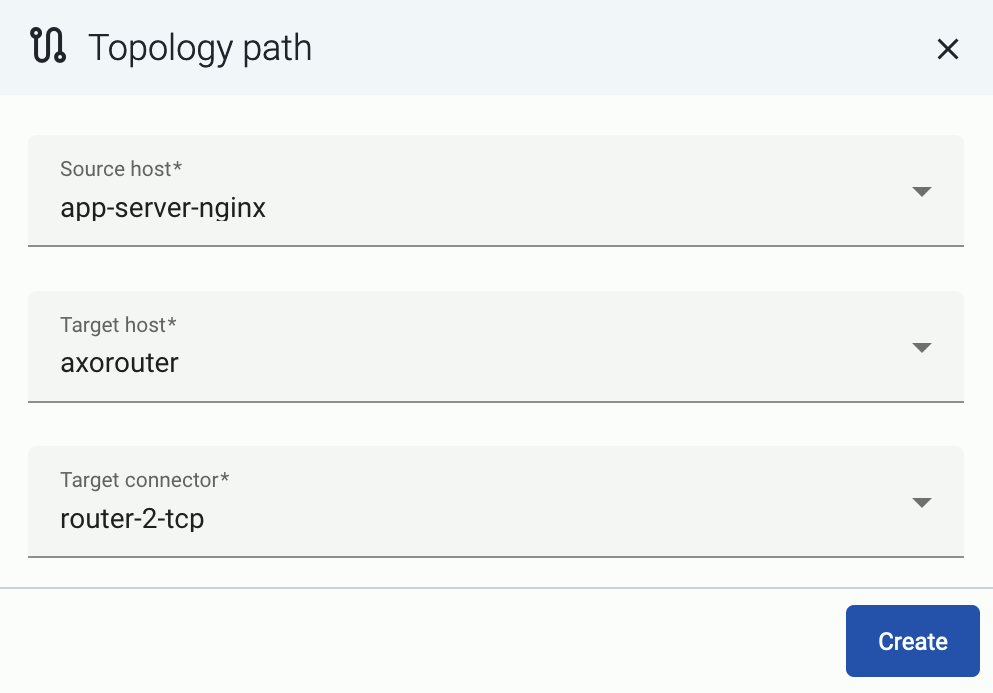
Select the target router or aggregator this source is sending its data to in the Target host field, for example, axorouter.
Select the Target connector. The connector determines how the destination receives the data (for example, using which protocol or port).
Select Add. The new path appears on the Topology page.
syslog-ng, Splunk Connect for Syslog (SC4S), or AxoSyslog as its log forwarder agent, consider installing Axolet on the host and instrumenting the configuration of the log forwarder to receive detailed metrics about the host and the processed data. For details, see Manage and monitor the pipeline.
default to store the incoming messages.Navigate to Routers > Stores > Add Store.
Enter default as the Name of the store. This name will appear in the list of destinations (with the -store suffix) when setting the destination of a Flow. You cannot modify the name of the store later.
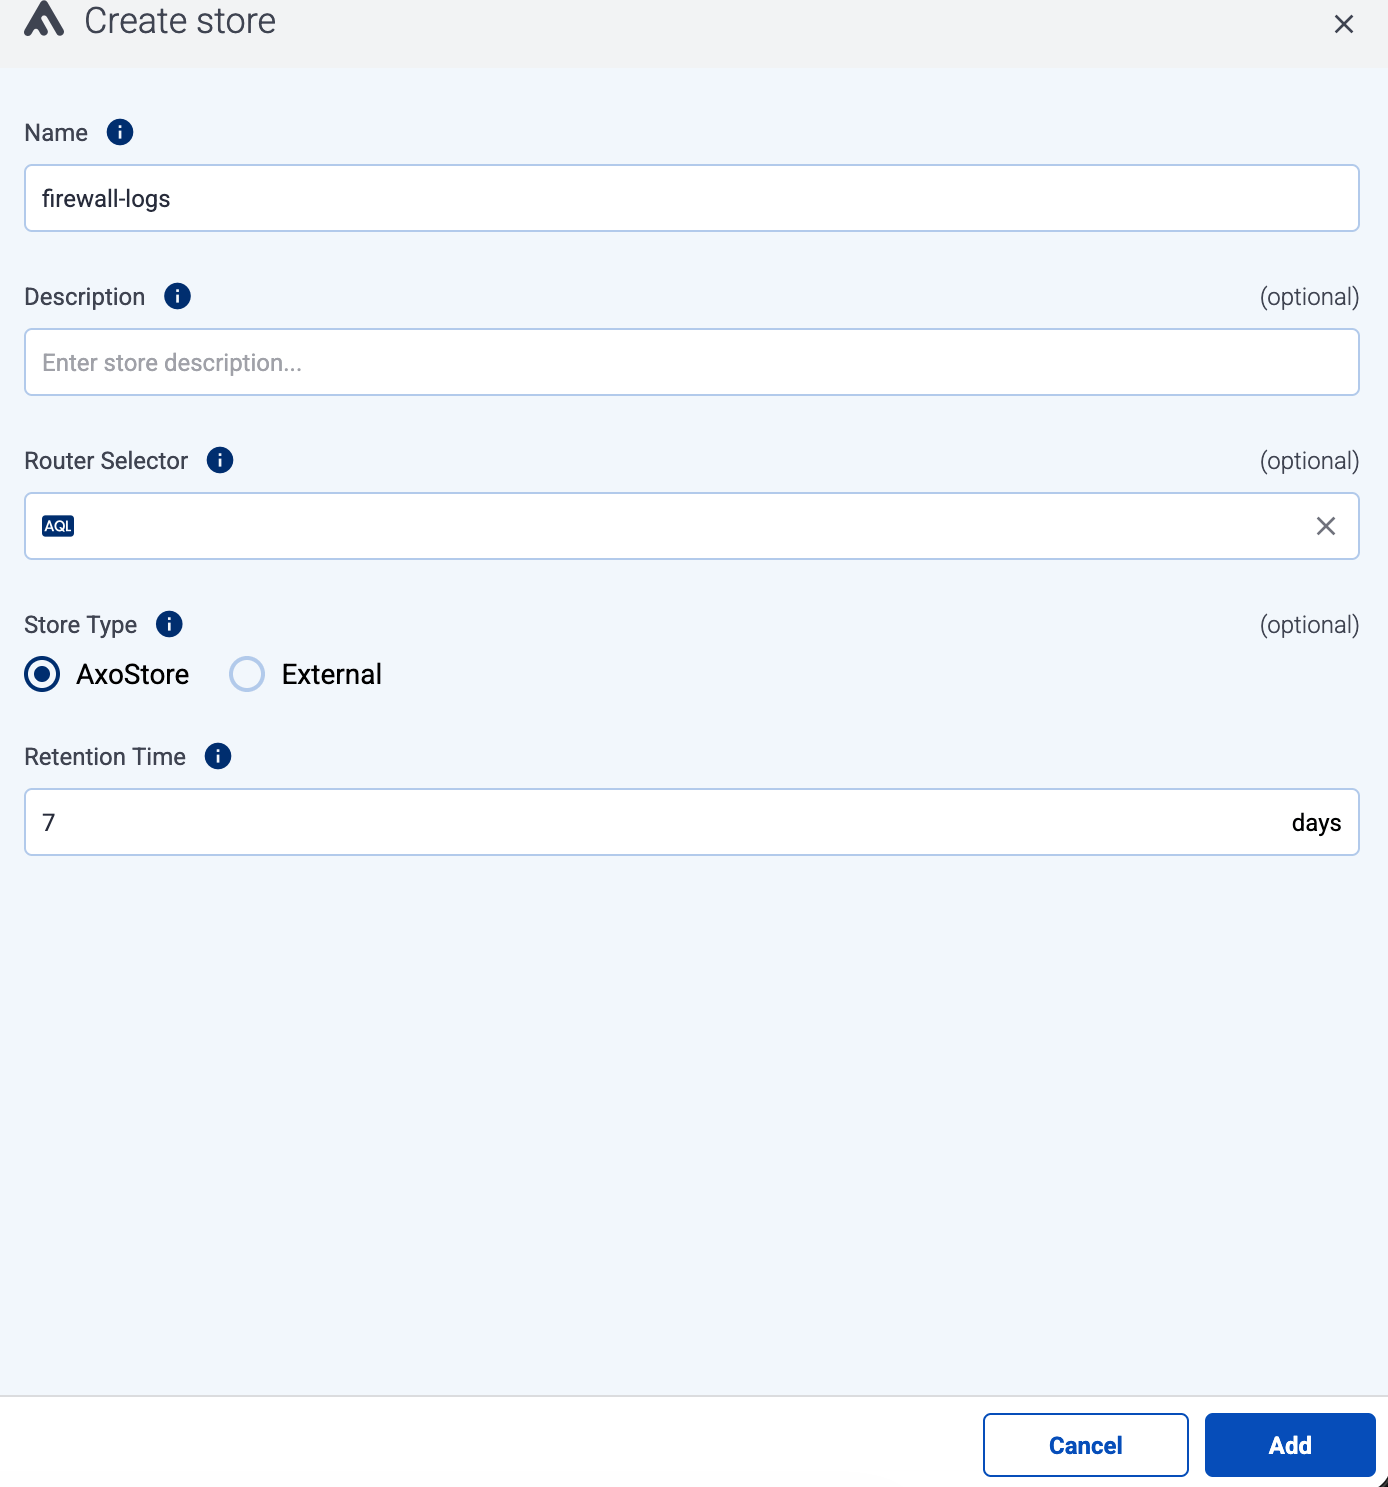
Set Store type to AxoStore.
Set the Router Selector so it matches the AxoRouter instances where you want to create this store.
You can use any labels and metadata of the AxoRouter hosts in the Router selectors, for example, the hostname of the AxoRouter, or any custom labels.
name field to the name of the instance as selector. For example, name = my-axorouter.Set the Retention Time (in days) so older data is automatically deleted from the store. You cannot modify this parameter later.
Select Add.
Select Flows.
Select Add Flow.
Enter a name for the flow, for example, my-test-flow.
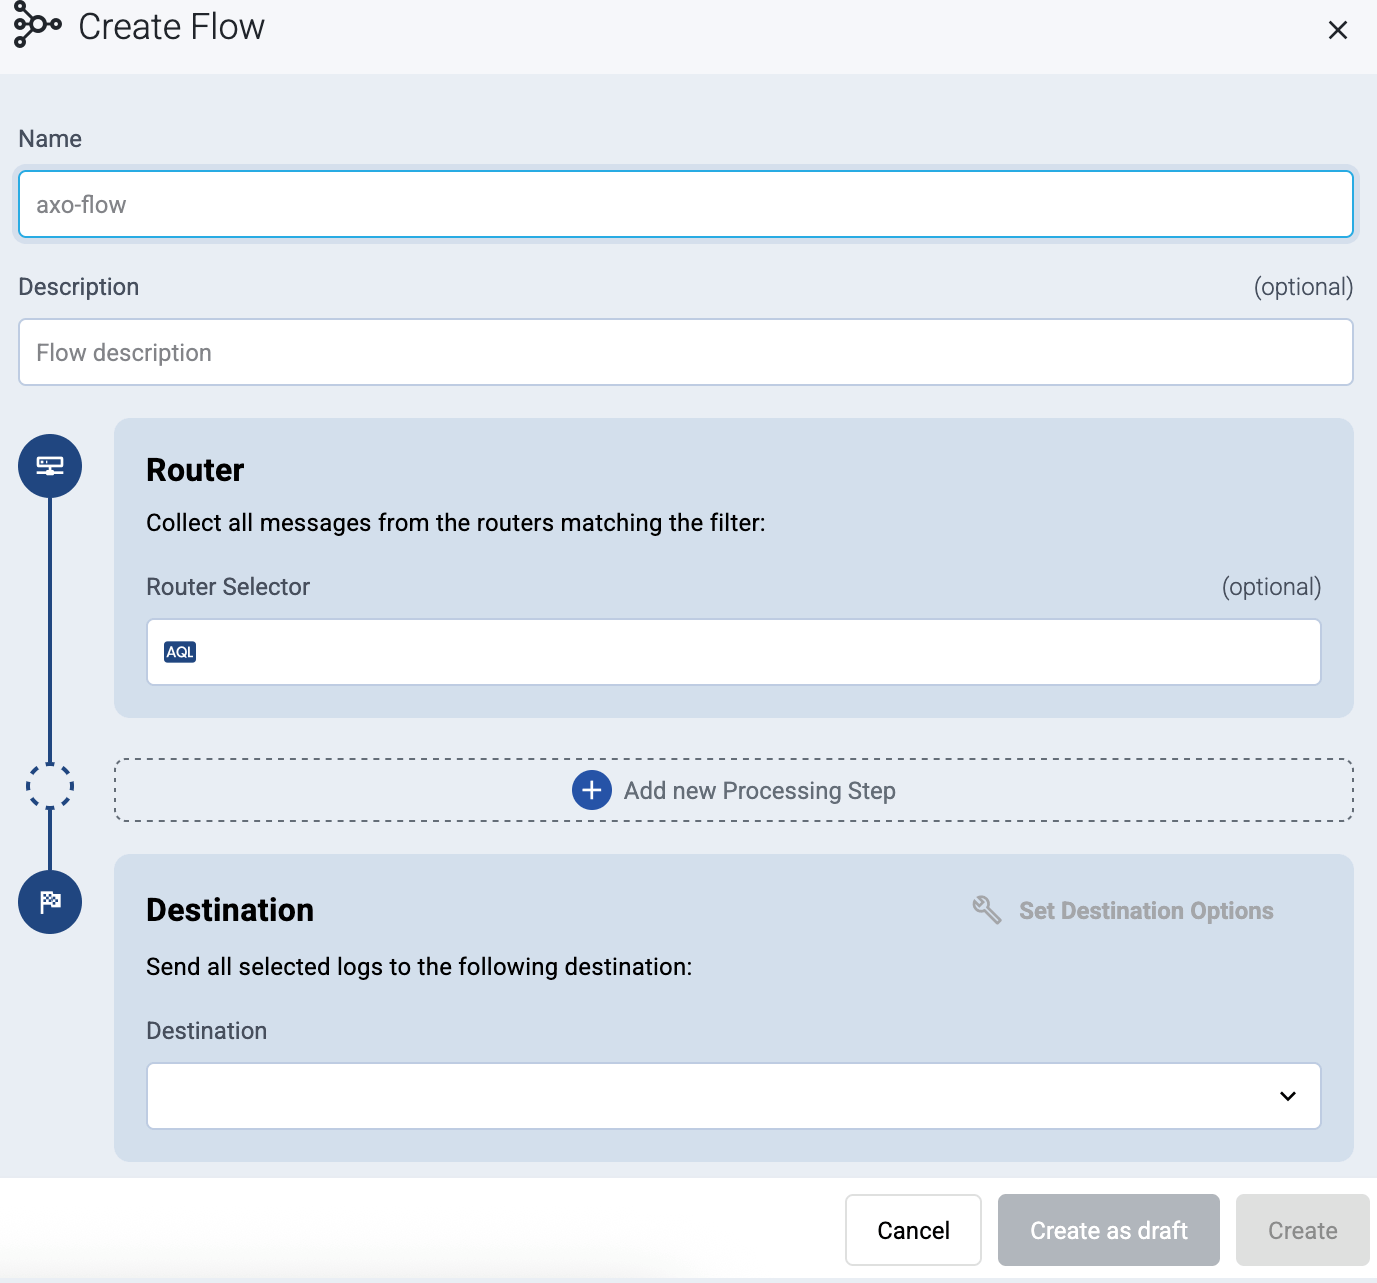
In the Router Selector field, enter an expression that matches the router(s) you want to apply the flow. To select a specific router, use a name selector, for example, name = my-axorouter-hostname.
You can use any labels and metadata of the AxoRouter hosts in the Router selectors, for example, the hostname of the AxoRouter, or any custom labels.
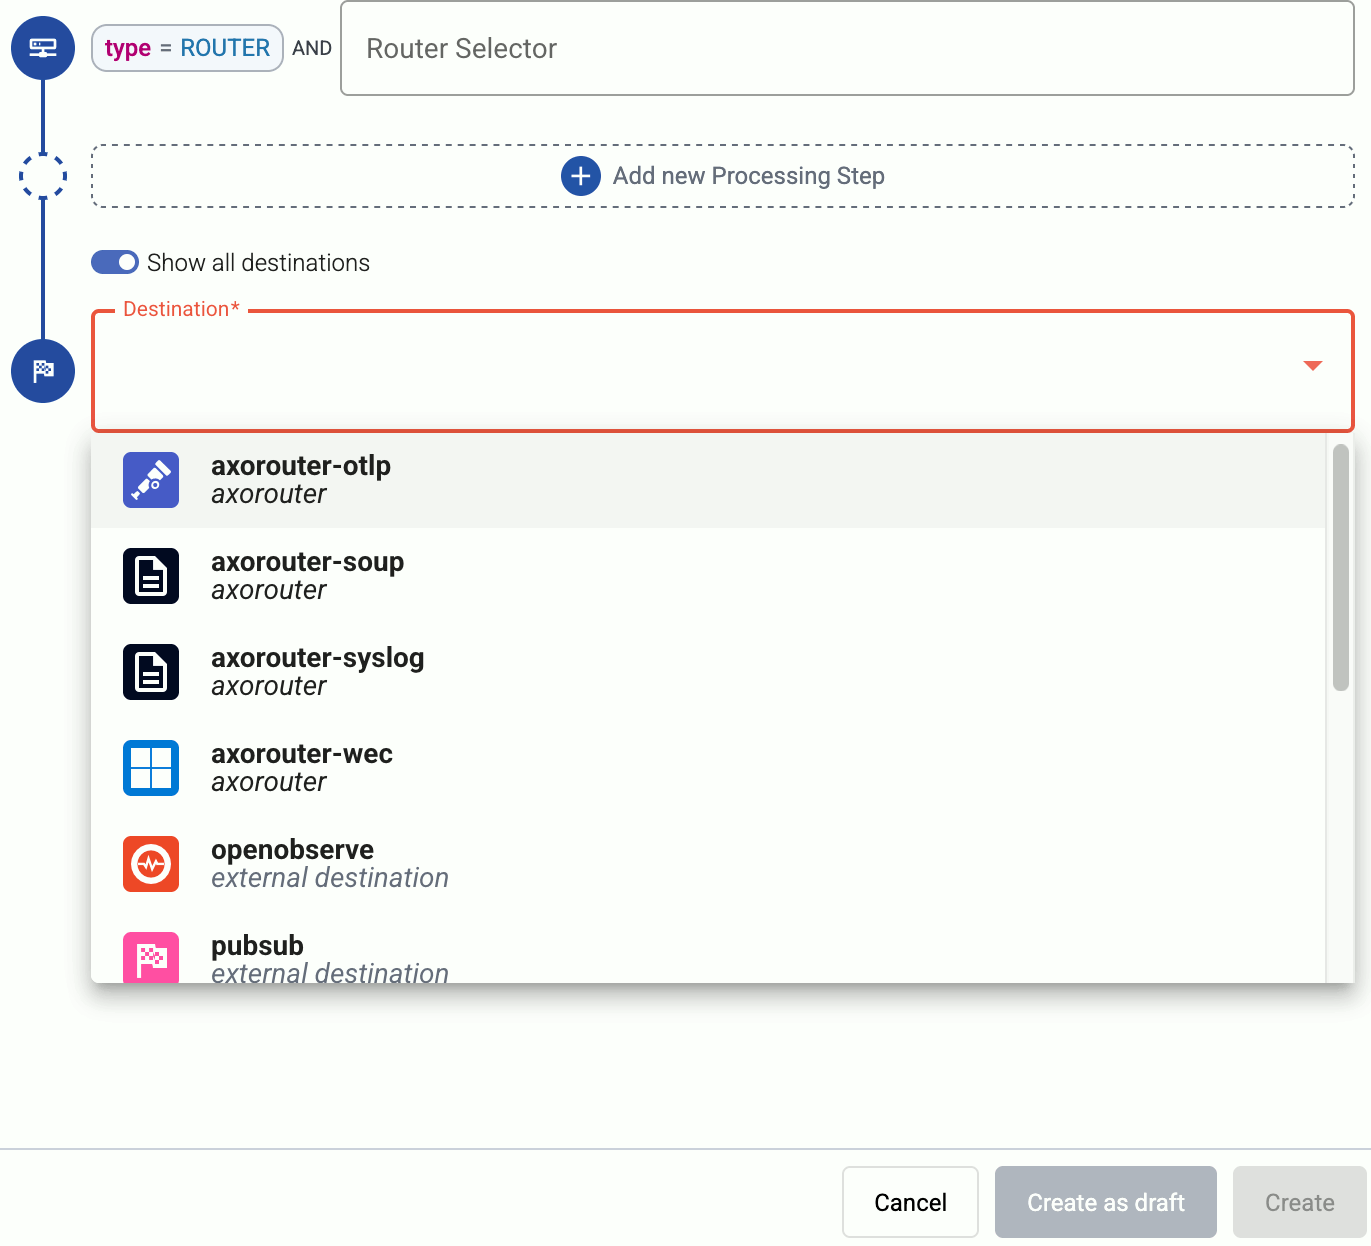
name field to the name of the instance as selector. For example, name = my-axorouter.Set the Destination where you want to send your data. Select default-store. For details on the different destinations, see Destinations.
(Optional) To process the data transferred in the flow, select Add New Processing Step. For details, see Processing steps. For example:
meta.vendor = fortinet AND meta.product = fortigate query.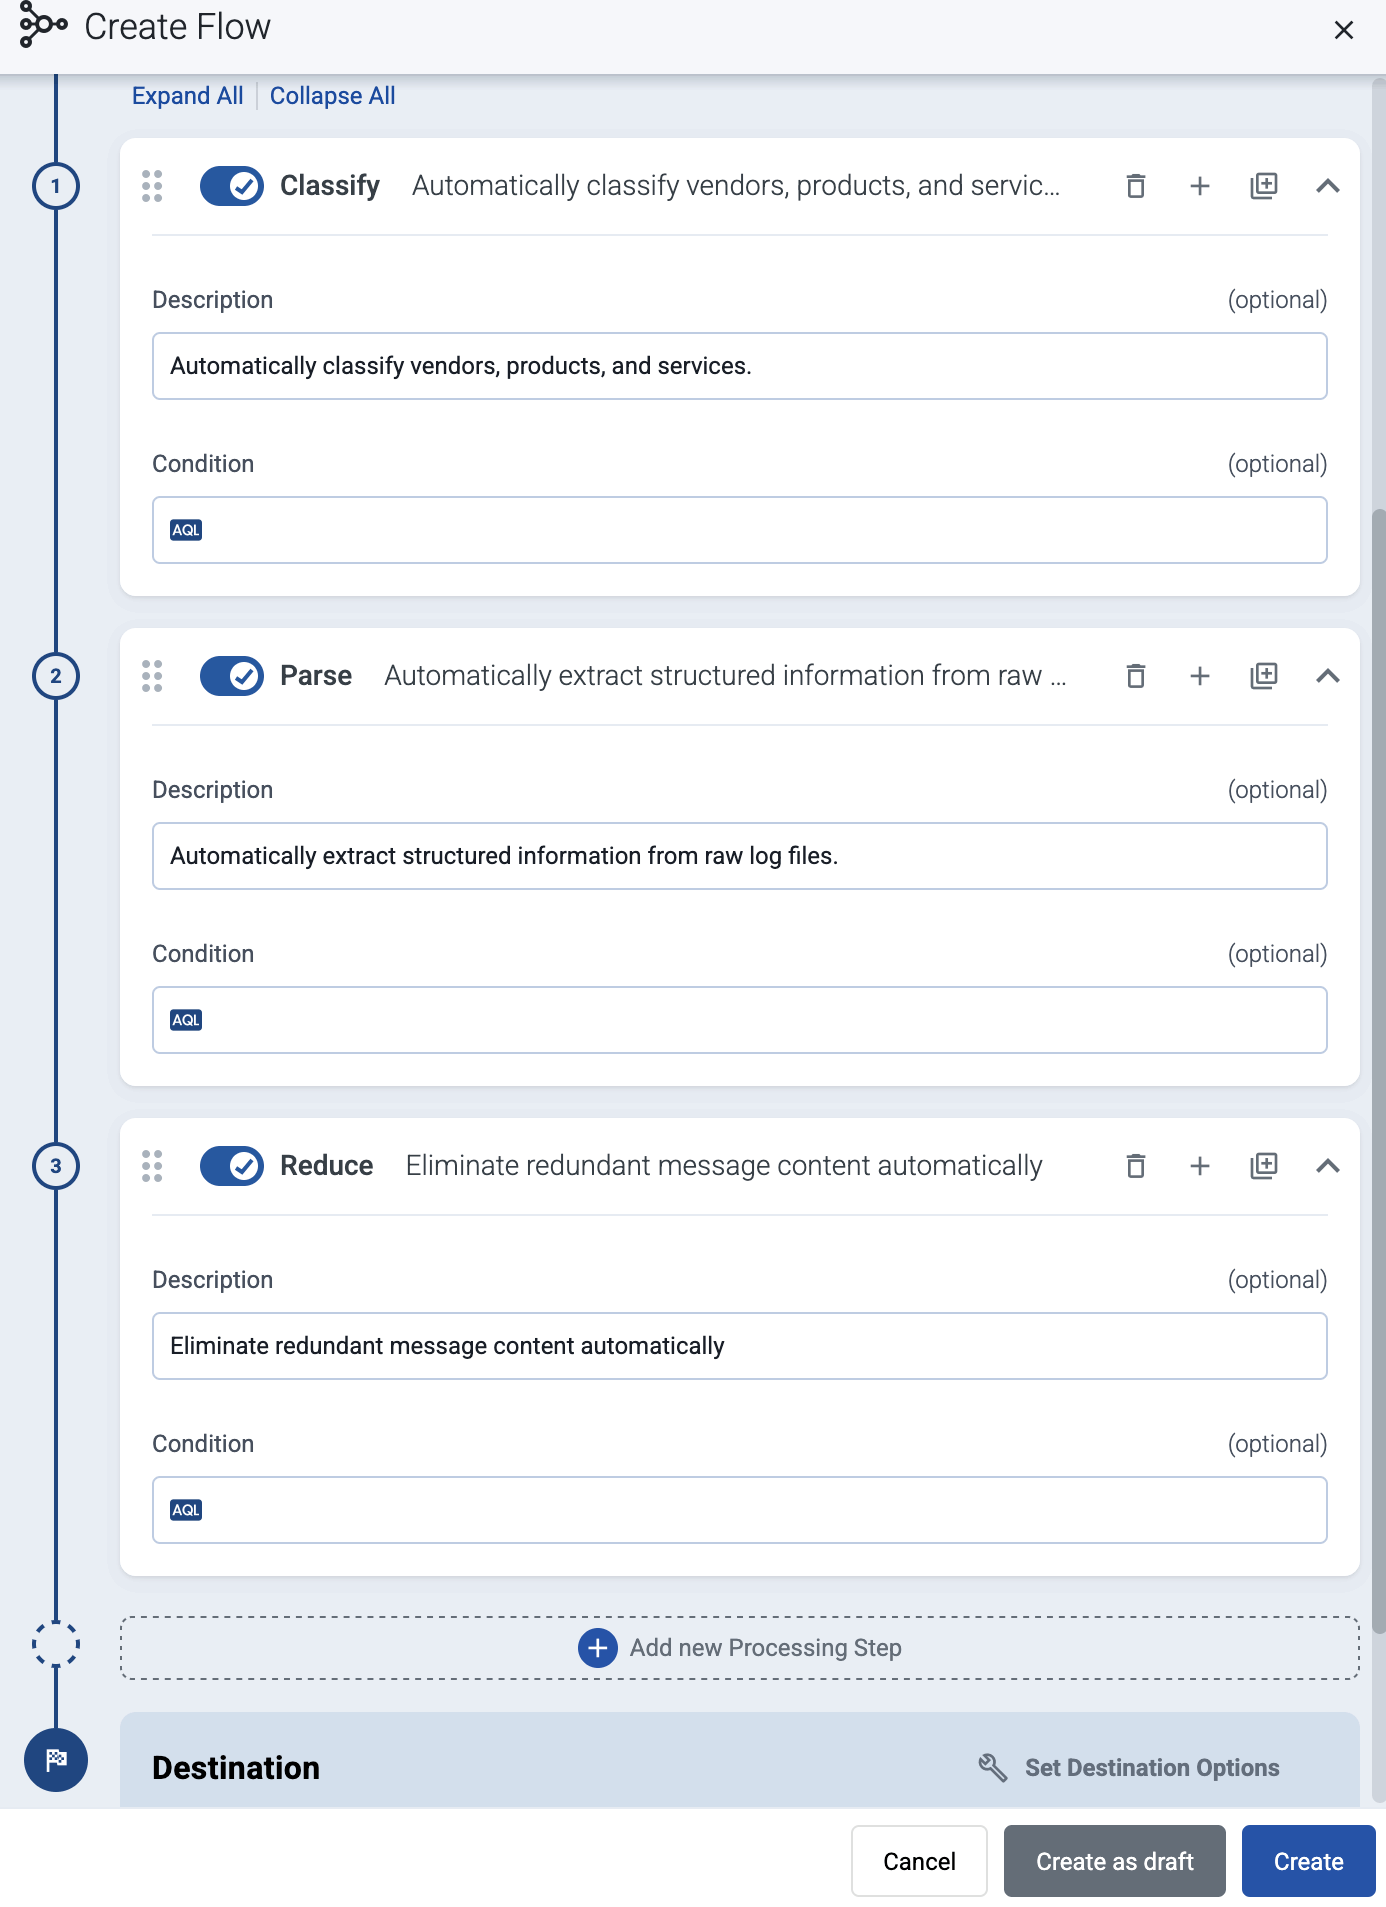
Select Add.
The new flow appears in the Flows list.
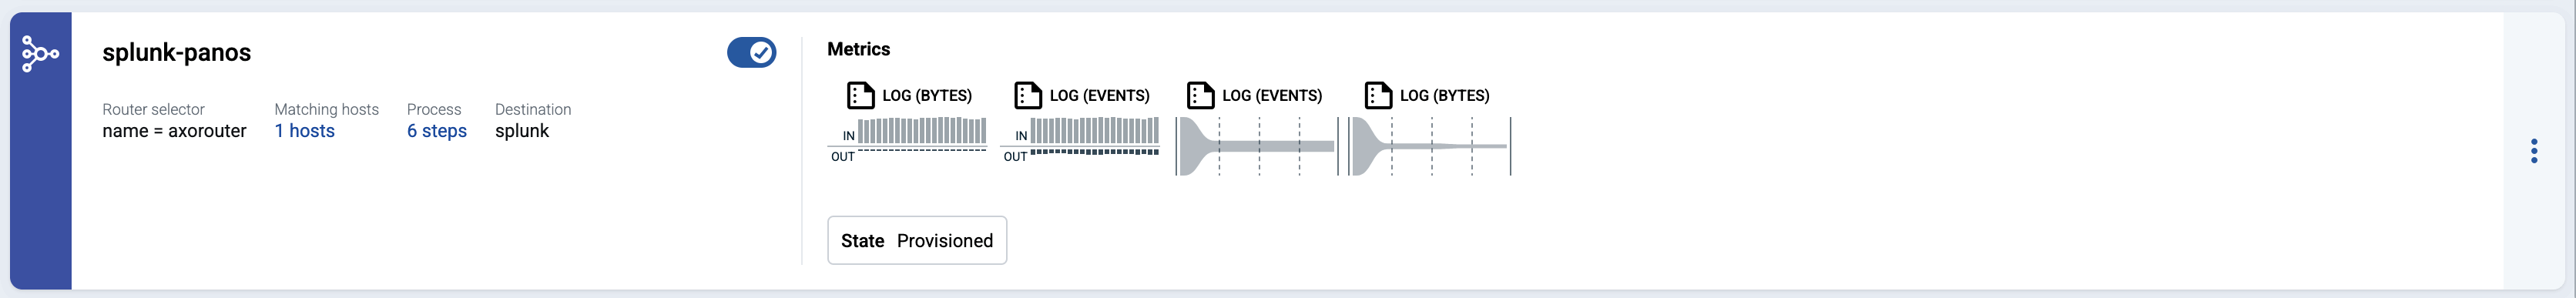
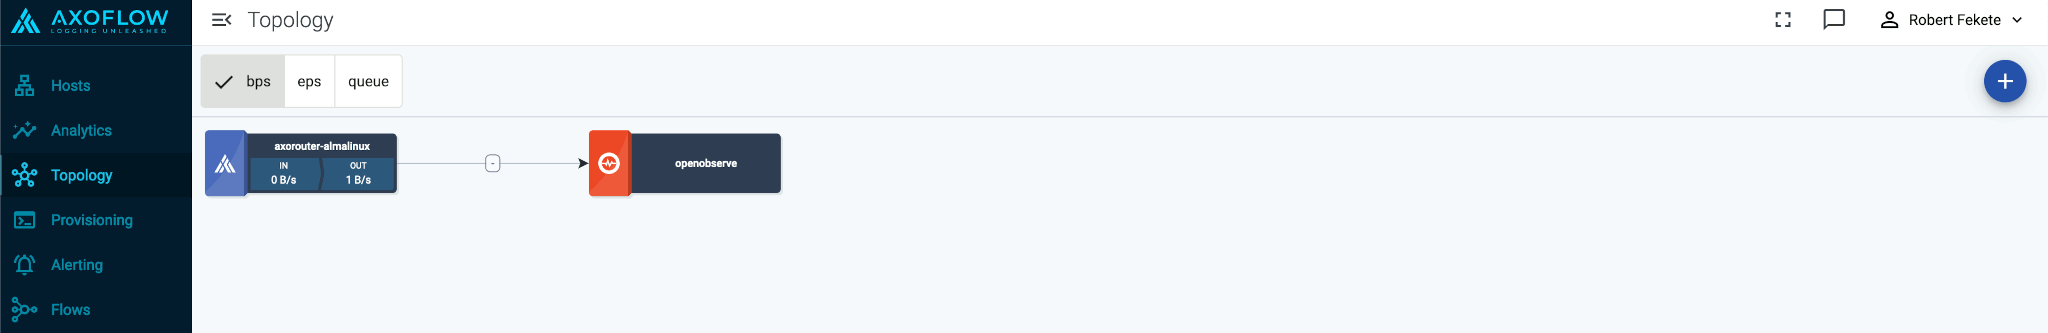
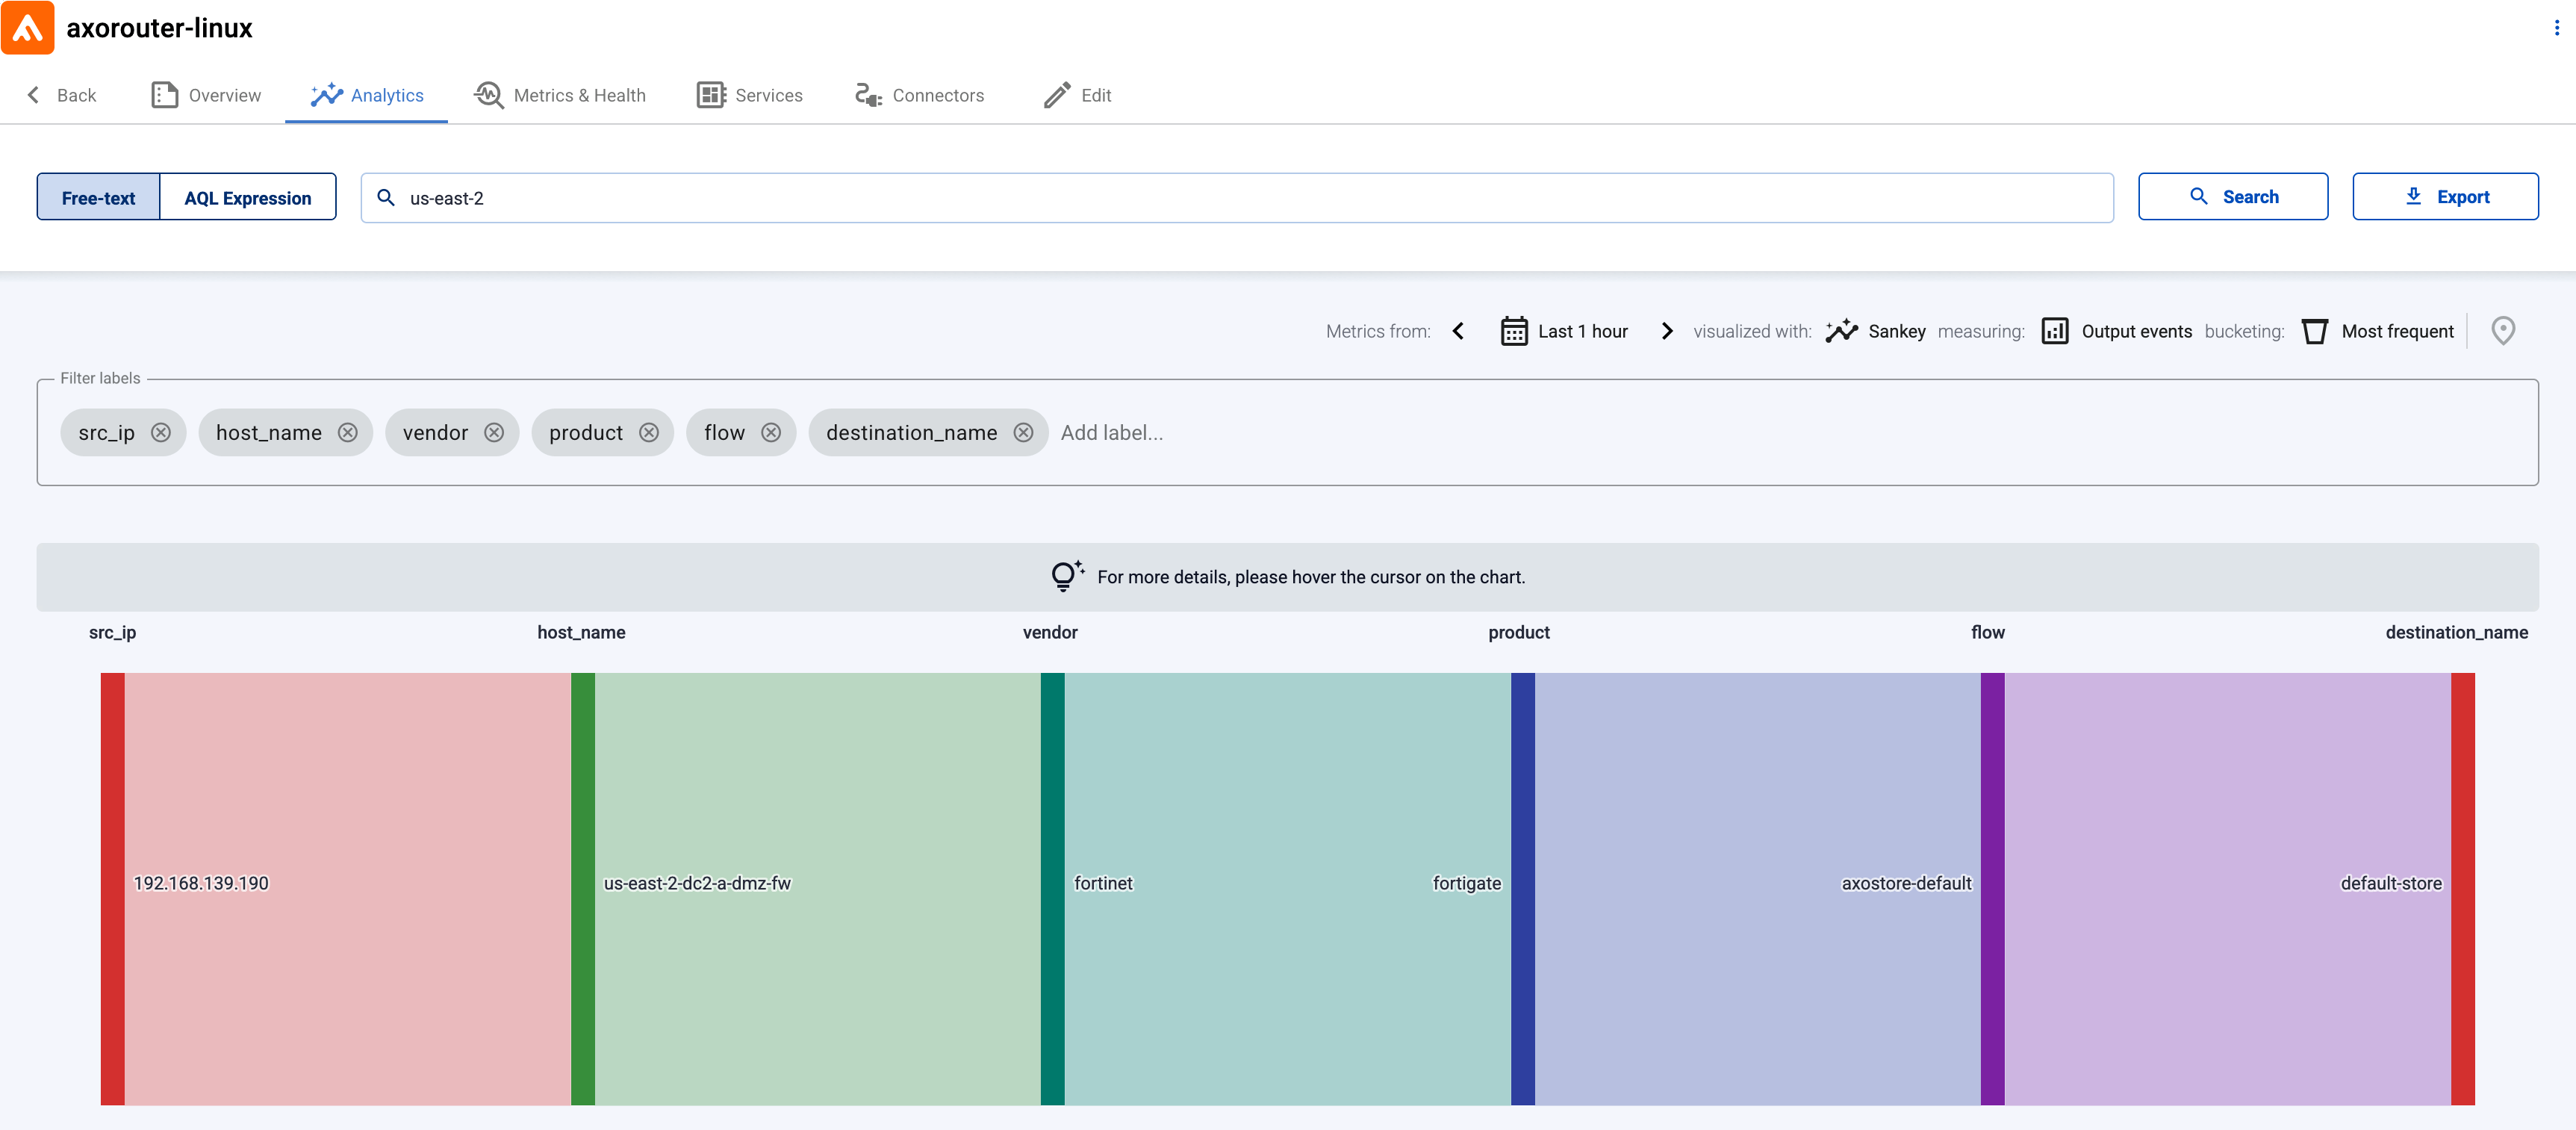
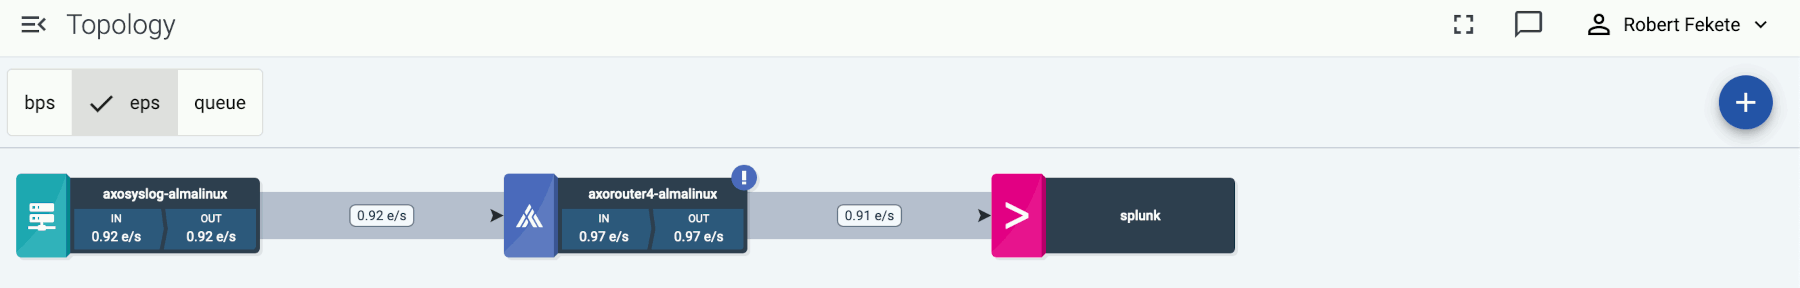
Open the Topology page and verify that your AxoRouter instance is connected both to the source and the destination.
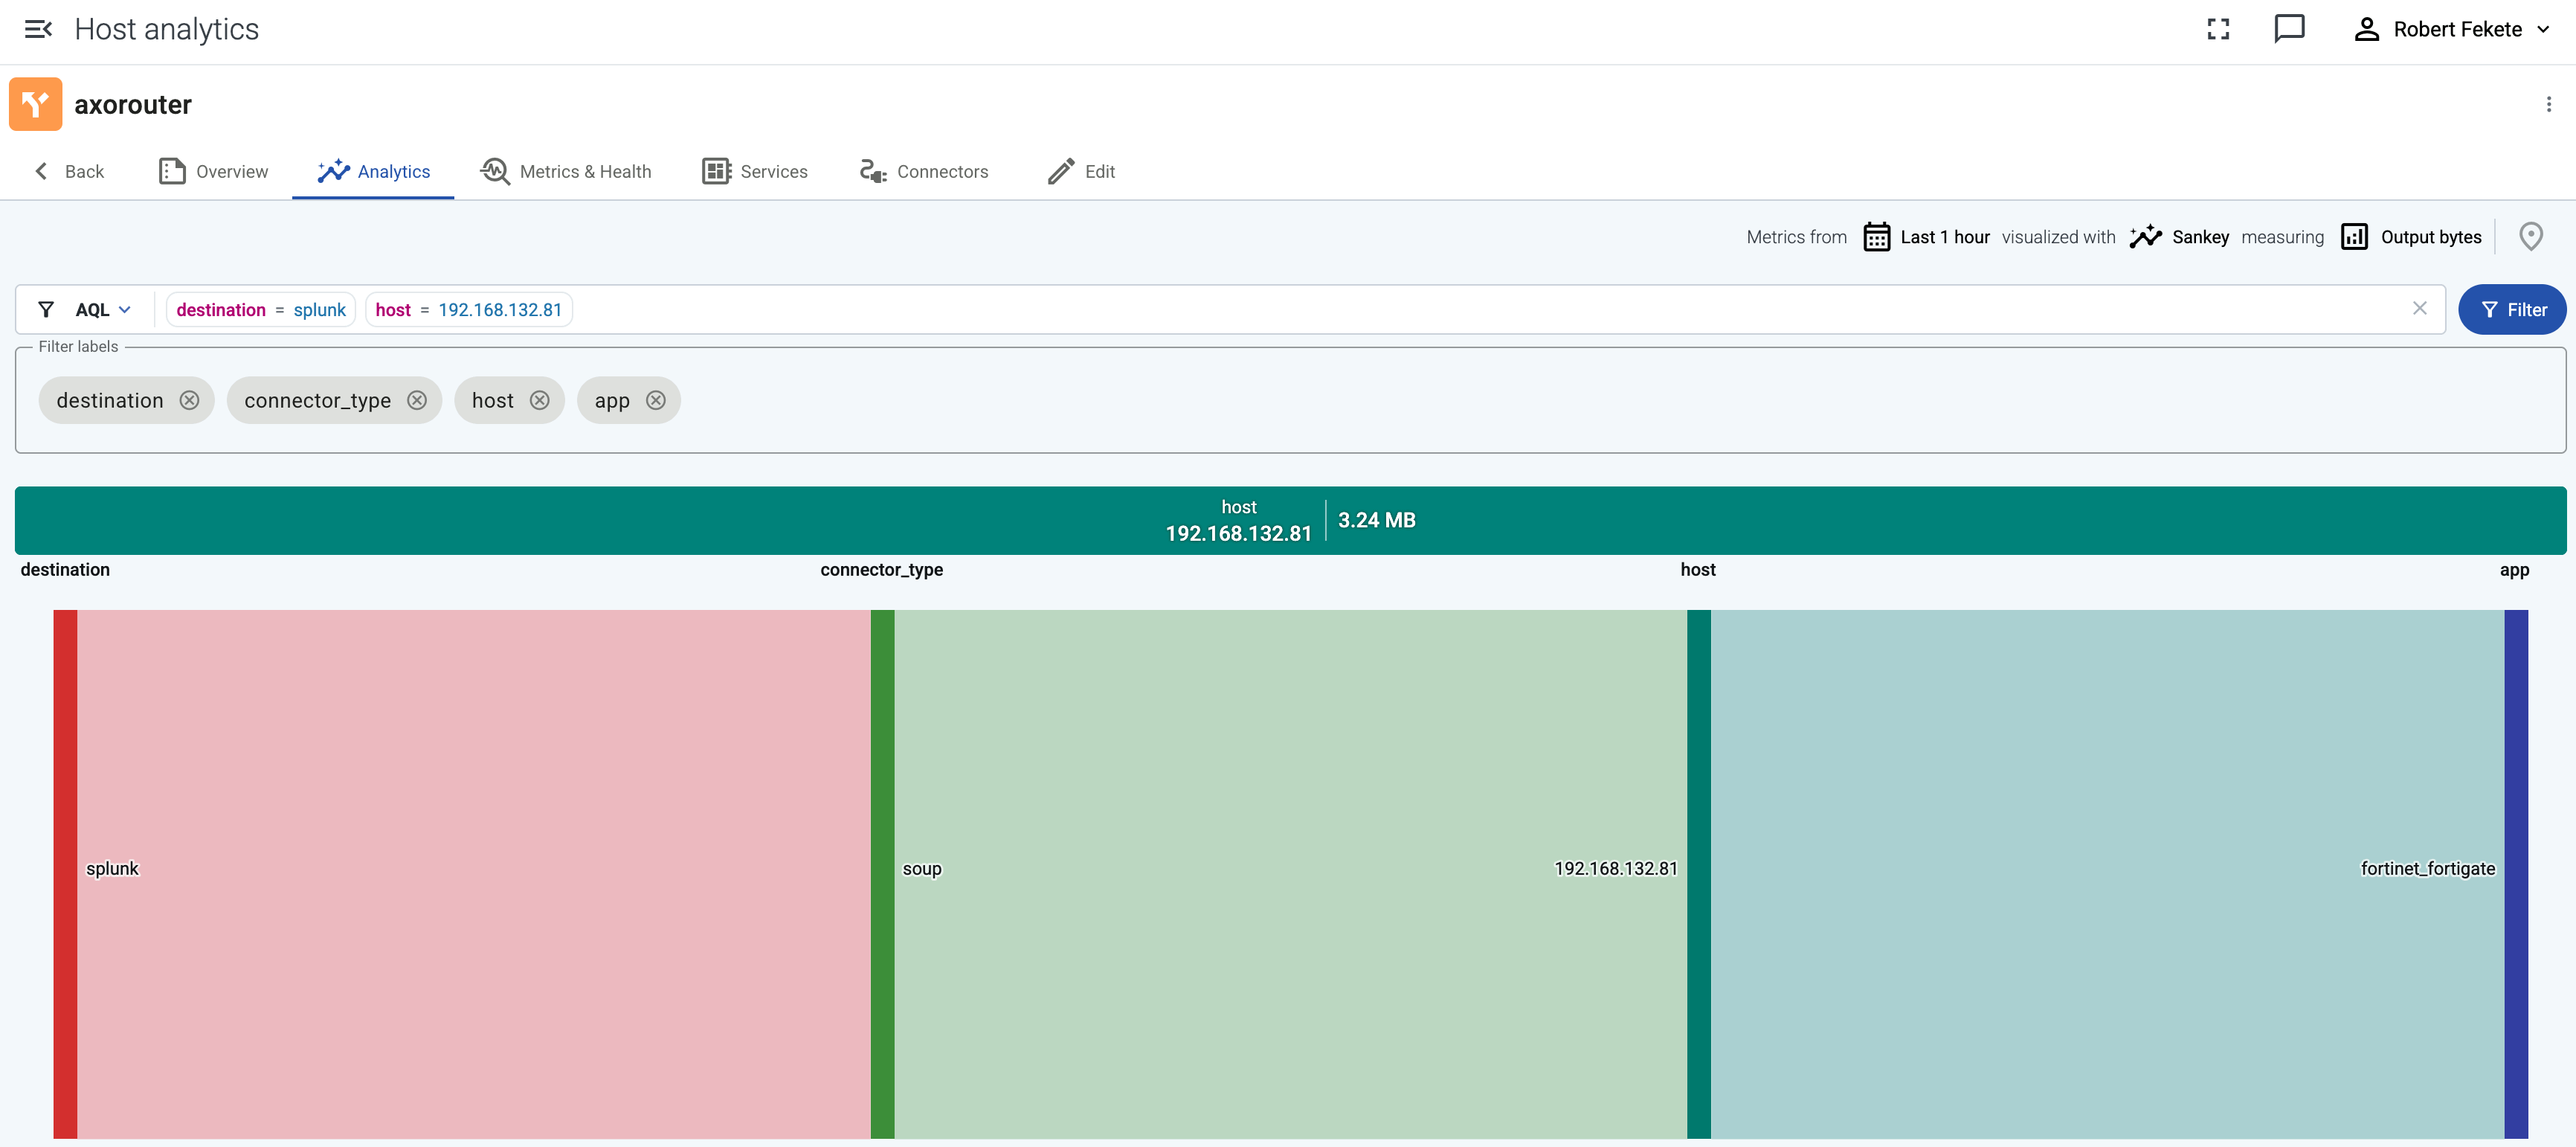
If you have traffic flowing from the source to your AxoRouter instance, the Topology page shows the amount of data flowing on the path. Click the AxoRouter instance, then select Analytics to visualize the data flow.
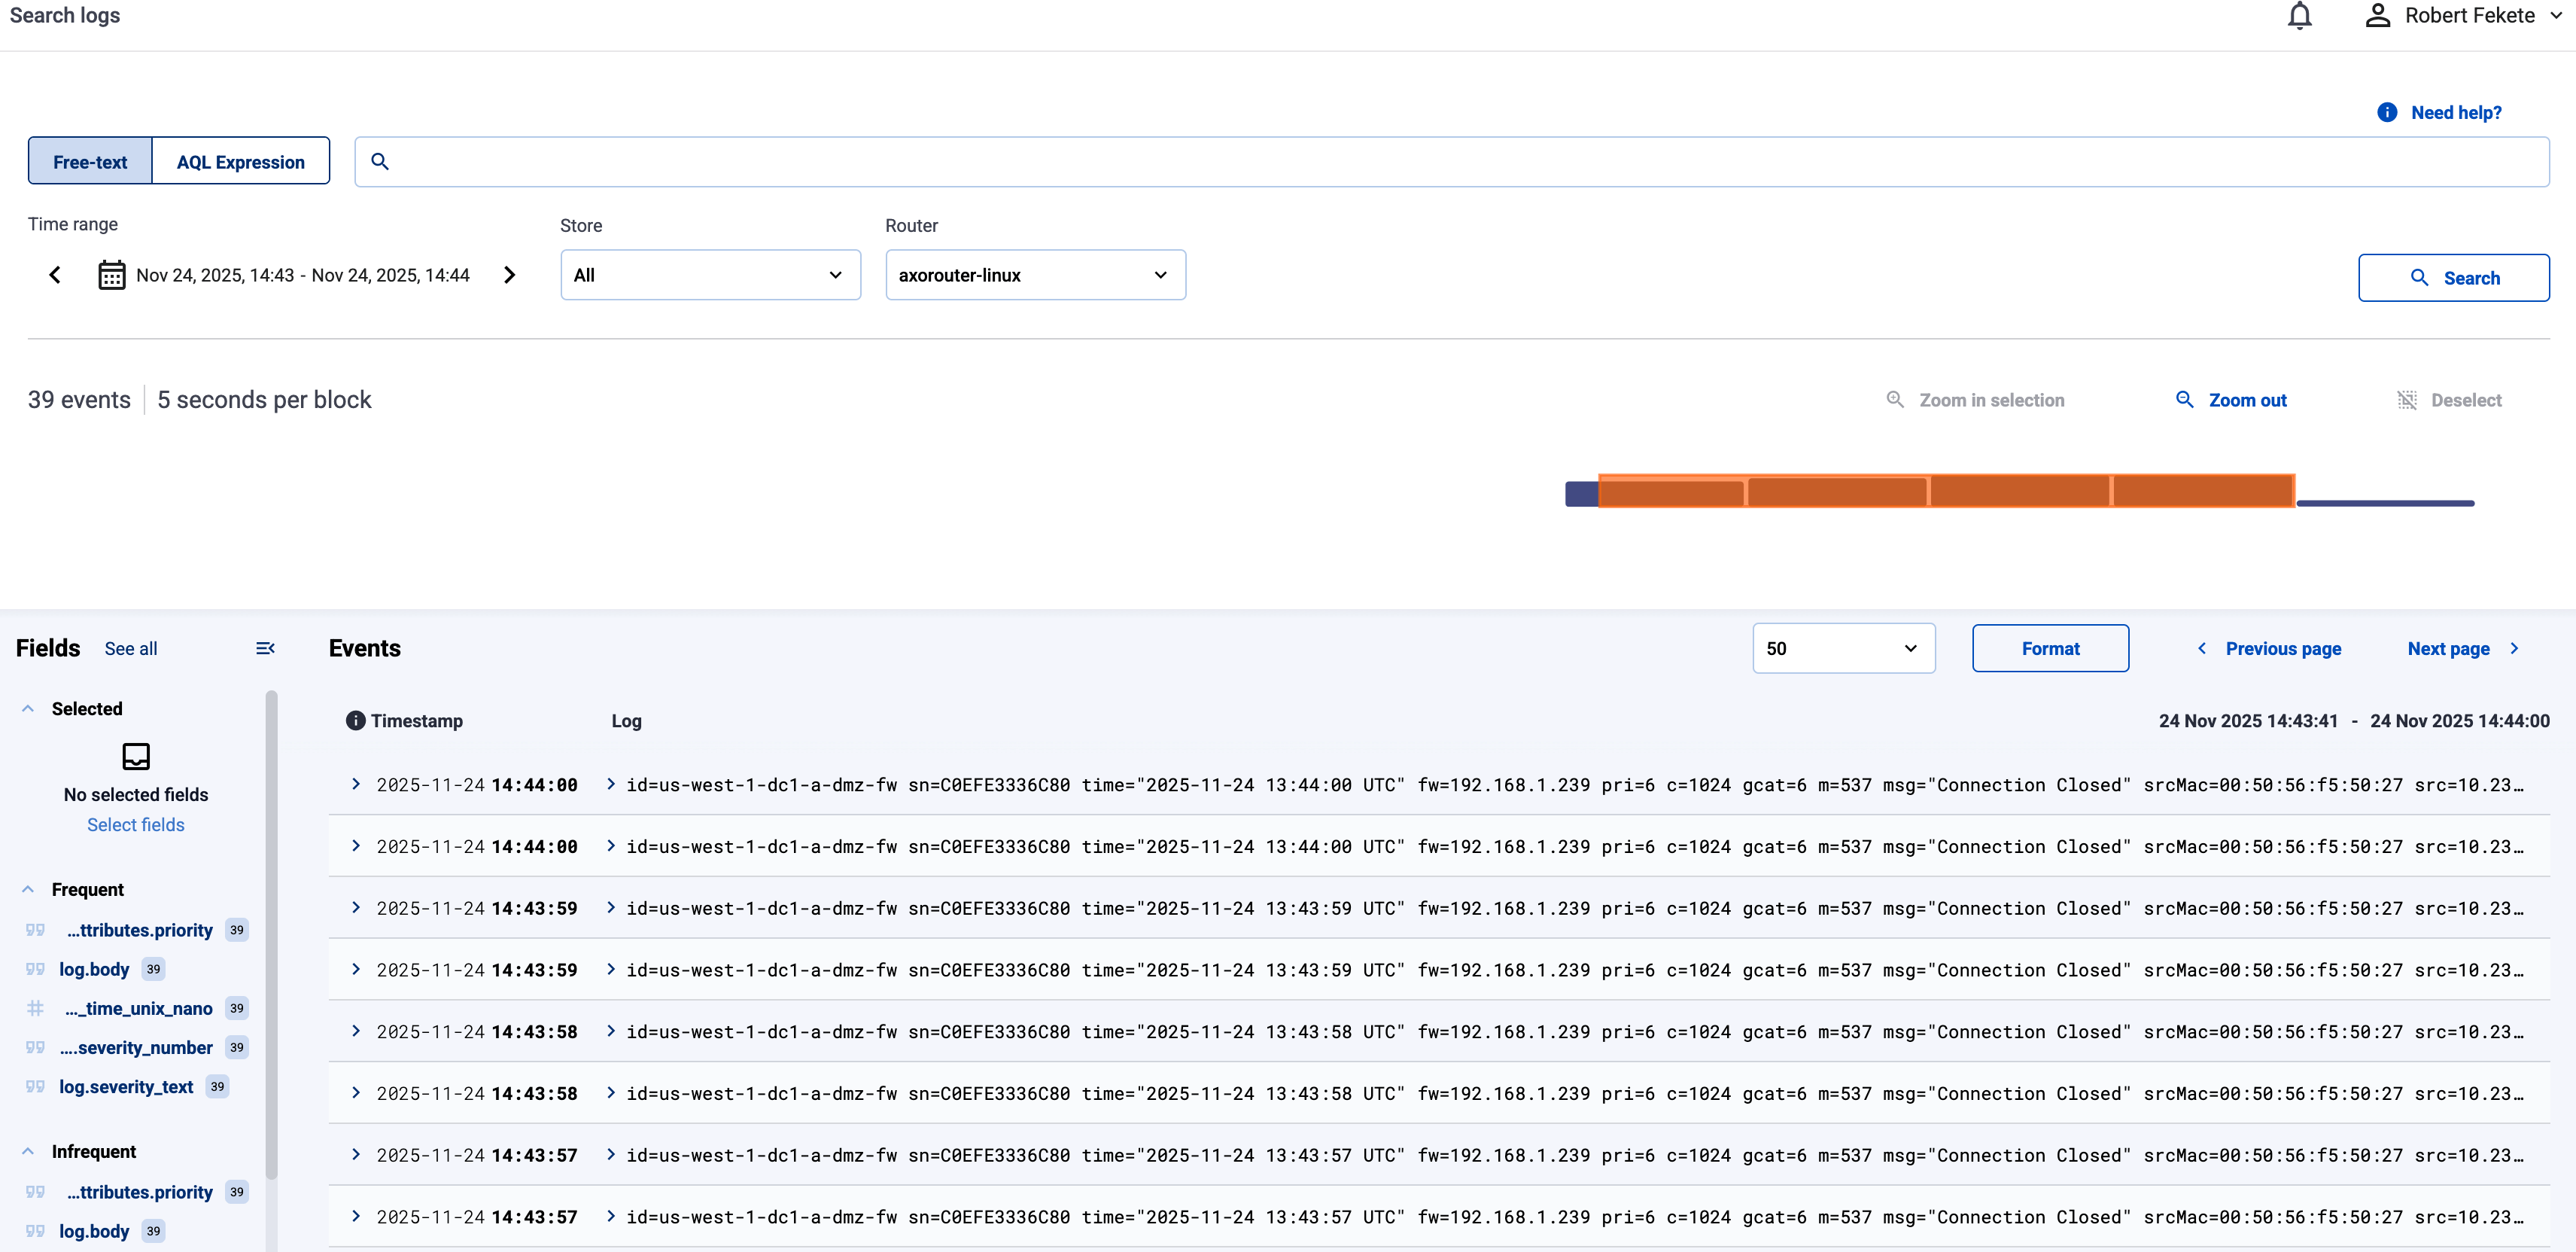
Open the Search logs page, then select Search. The recently received logs in AxoStore will be displayed.
Log tapping in Axoflow samples the log flow. You can use labels to filter for specific messages (like ones with parse errors) and tap only those messages. To not get overwhelmed with events, Axoflow automatically samples the output: if many messages match the selected filter, only a subset is shown (about 1 message per second). Using log tapping, you can quickly troubleshoot both parsing/curation errors and destination ingest (API) errors, and check:
Click your AxoRouter instance on the Topology page, then select ⋮ > Tap log flow.
Tap into the log flow.
You can use labels to filter the messages and sample only the matching ones.
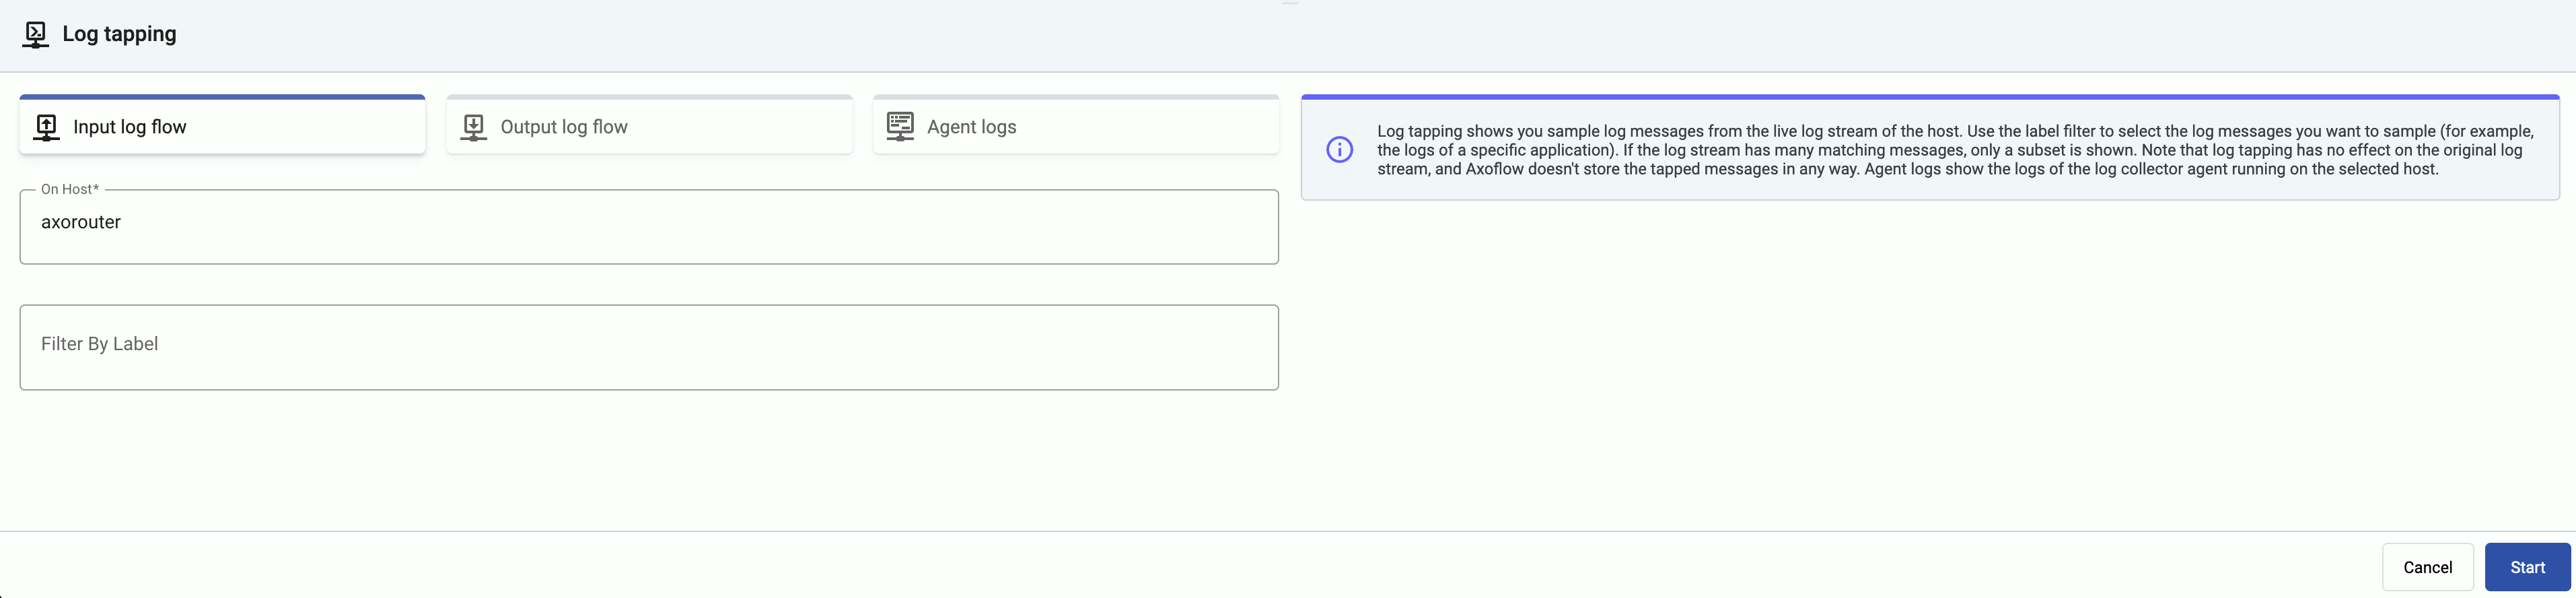
When the logs you’re interested in show up, click Stop Log Tap, then click a log message to see its details.
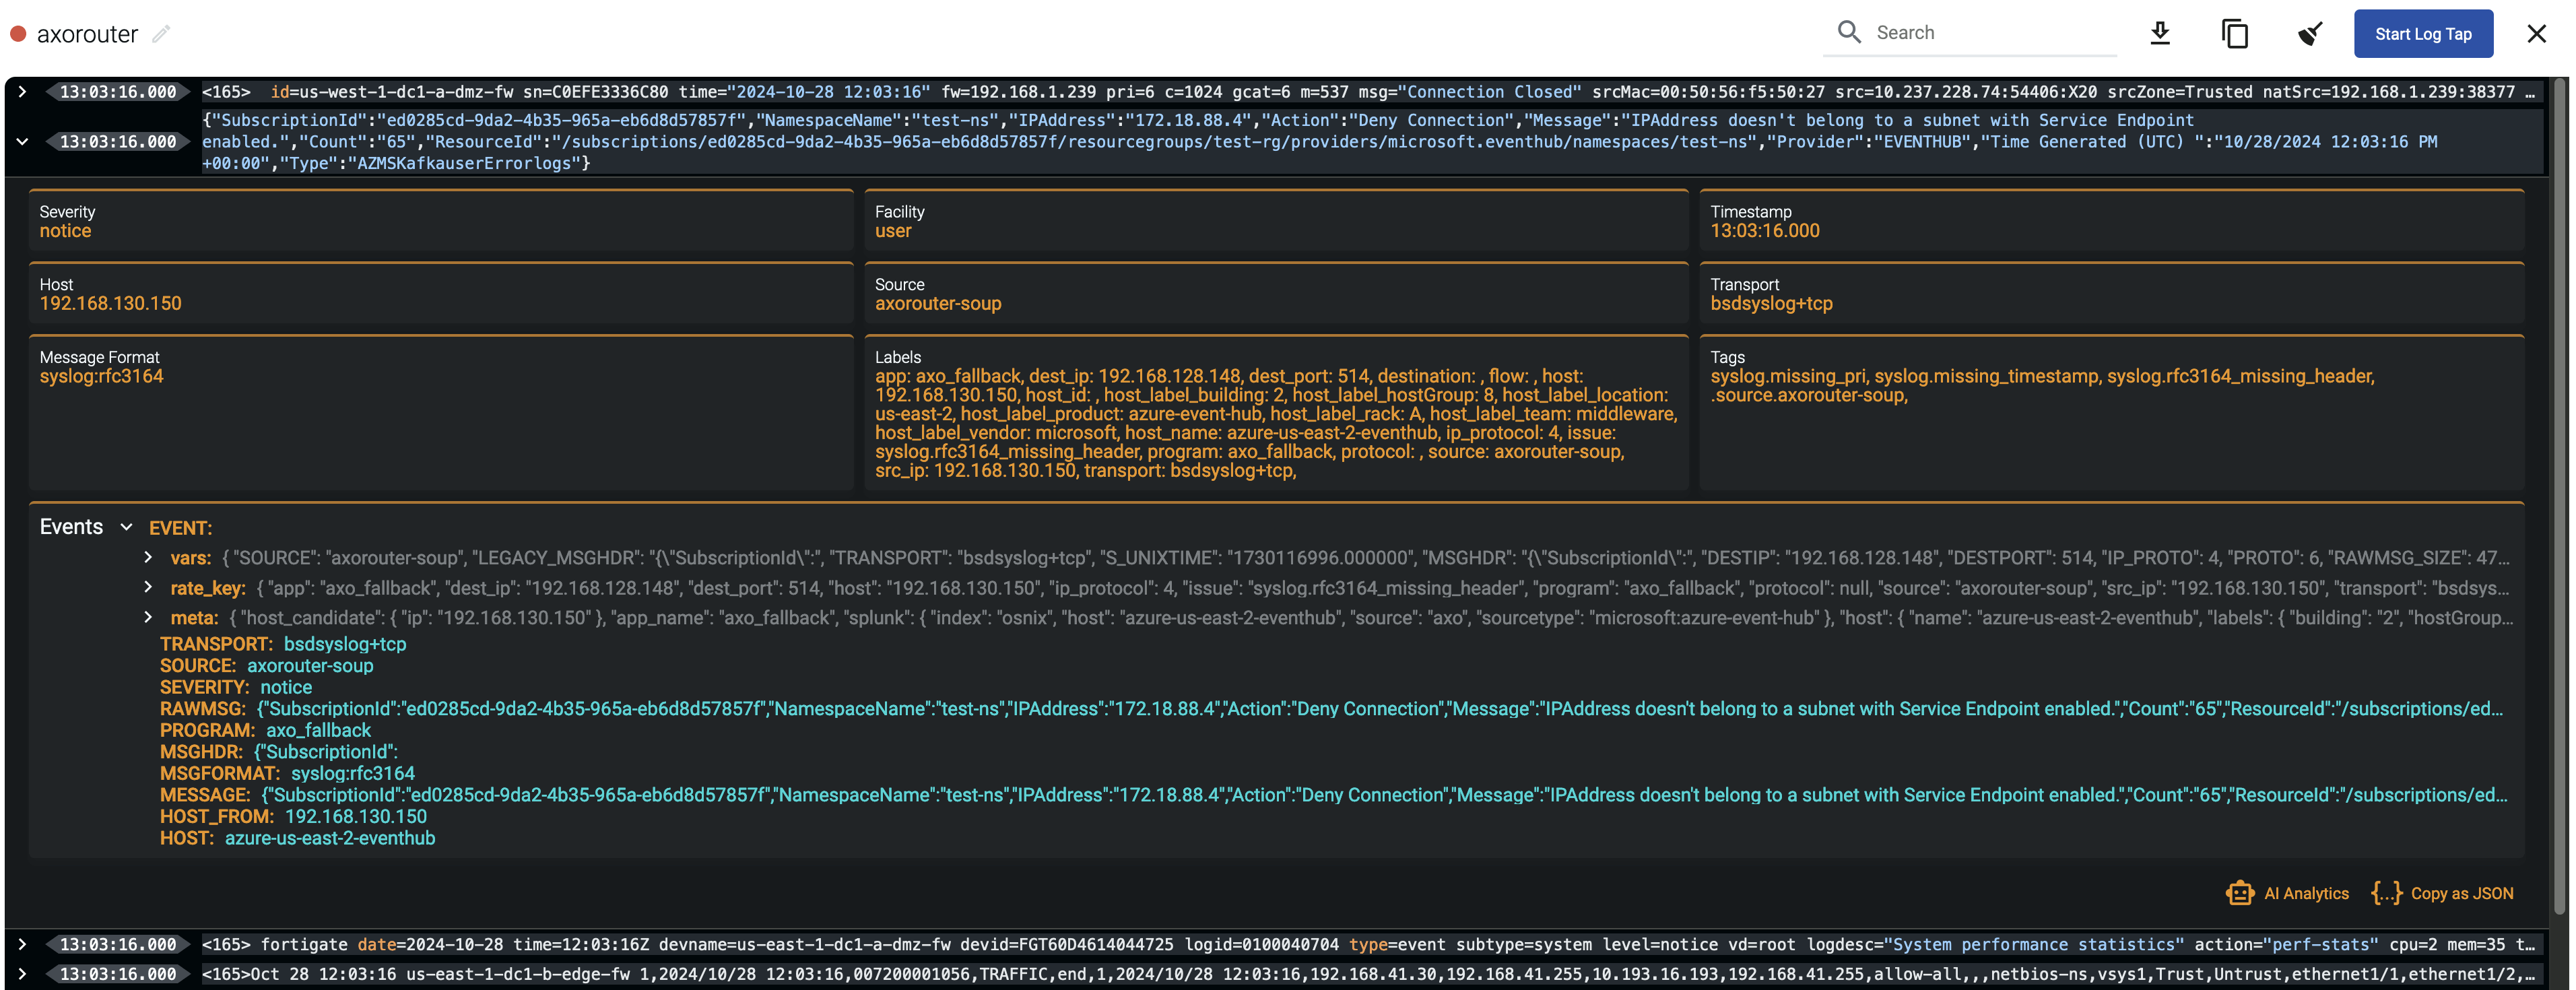
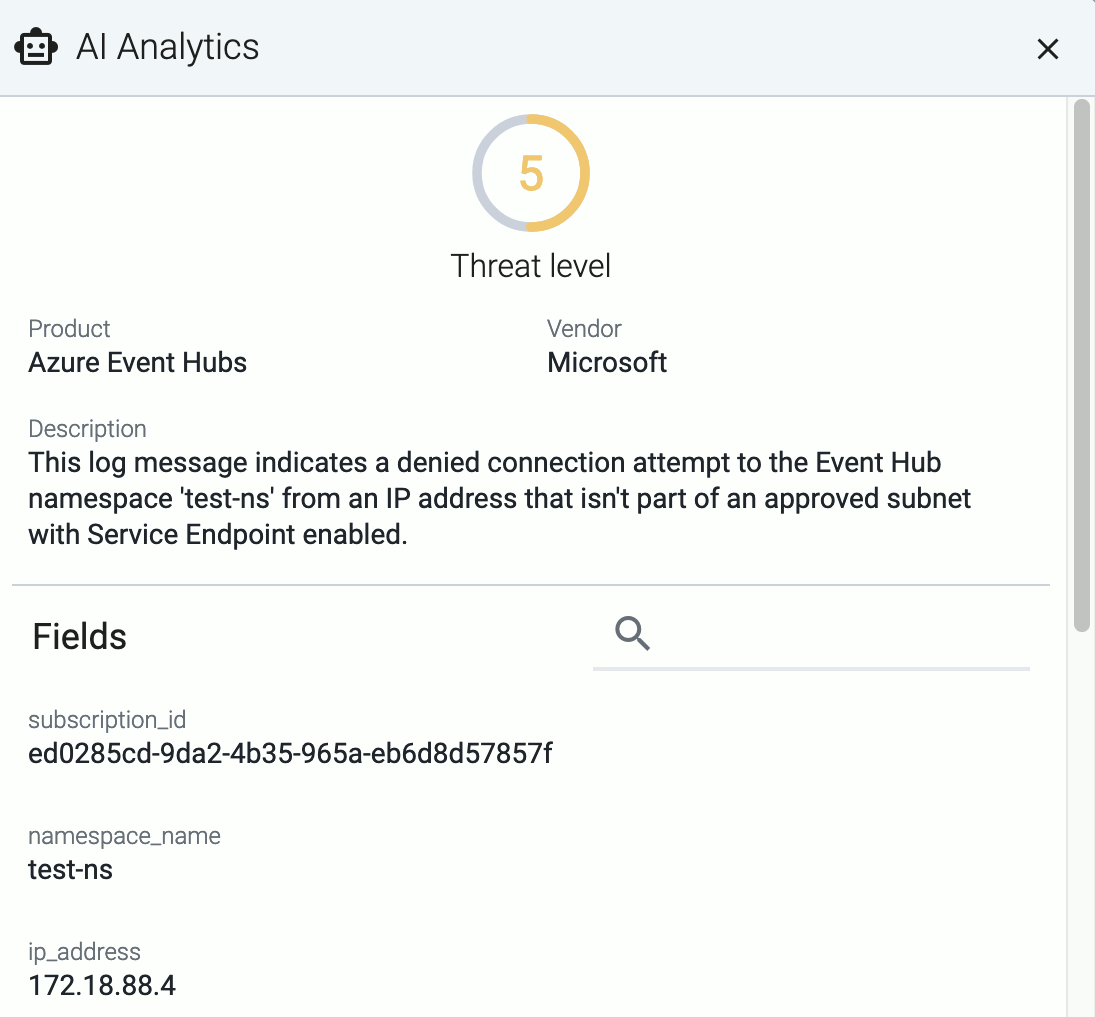
If you don’t know what the message means, select AI Analytics to ask our AI to interpret it.
In case you run into problems, or you’re not getting any data in AxoStore, check the logs of your AxoRouter instance:
This guide shows you how to get started with Axoflow. You’re going to install AxoRouter, and configure or create a source to send data to AxoRouter. You’ll also configure AxoRouter to forward the received data to your destination SIEM or storage provider. The resulting topology will look something like this:
Using the Axoflow security data pipeline automatically corrects and augments the security data you collect, resulting in high-quality, curated, SIEM-optimized data. It also removes redundant data to reduce storage and SIEM costs. In addition, it allows automates pipeline configuration and provides metrics and alerts for your telemetry data flows.
You’ll need:
An Axoflow subscription, access to a free evaluation version, or an on-premise deployment.
A data source. This can be any host that you can configure to send syslog or OpenTelemetry data to your AxoRouter instance that you’ll install. If you don’t want to change the configuration of an existing device, you can use a virtual machine or a docker container on your local computer.
A host that you’ll install AxoRouter on. This can be a separate Linux host, or a virtual machine running on your local computer.
AxoRouter should work on most Red Hat and Debian compatible Linux distributions. For production environments, we recommend using Red Hat 9.
A destination where AxoRouter will send the received data. This can be a supported SIEM or storage provider, like Splunk or Amazon S3 that you have access to. For a quick test of Axoflow, you can use a free Splunk or OpenObserve account as well. See our list of supported Destinations.
The hosts must be able to access the following domains related to the AxoConsole:
When using AxoConsole SaaS:
<your-tenant-id>.cloud.axoflow.io: HTTPS traffic on TCP port 443, needed to download the binaries for Axoflow software (like Axolet and AxoRouter).kcp.<your-tenant-id>.cloud.axoflow.io: HTTPS (mutual TLS) traffic on TCP port 443 for management traffic.telemetry.<your-tenant-id>.cloud.axoflow.io: HTTPS (mutual TLS) traffic on TCP port 443, where Axolet sends the metrics of the host.us-docker.pkg.dev: HTTPS traffic on TCP port 443, for pulling container images (AxoRouter only).When using an on-premise AxoConsole:
The following domains should point to AxoConsole IP address to access Axoflow from your desktop and AxoRouter hosts:
your-host.your-domain: The main domain of your AxoConsole deployment.authenticate.your-host.your-domain: A subdomain used for authentication.idp.your-host.your-domain: A subdomain for the identity provider.The AxoConsole host must have the following Open Ports:
When installing Axoflow agent for Windows or Linux:
github.com: HTTPS traffic on TCP port 443, for downloading installer packages.Verify that you have access to the AxoConsole.
https://<your-tenant-id>.axoflow.io/ in your browser.Deploy an AxoRouter instance that will route, curate, and enrich your log data.
Select Routers > Add Router.
Select the platform (Linux). The one-liner installation command is displayed.
(Optional) If you don’t want to store any logs locally on AxoRouter, disable AxoStore, select Advanced options, scroll down, and deselect Enable AxoStore.
(Optional)
If needed, set the Advanced options (for example, proxy settings) to modify the installation parameters. Usually, you don’t have to use advanced options unless the Axoflow support team instructs you to do so.
Open a terminal on the host where you want to install AxoRouter.
Run the one-liner, then follow the on-screen instructions.
sudo would mask environment variables of the calling shell. Either start the whole procedure from a root shell, or let the install script call sudo when it needs to. In other words: don’t add the sudo command to the provisioning command.
Example output:
Do you want to install AxoRouter now? [Y]

% Total    % Received % Xferd  Average Speed   Time    Time     Time  Current
                                Dload  Upload   Total   Spent    Left  Speed
100  5480  100  5480    0     0  32076      0 --:--:-- --:--:-- --:--:-- 33414
Selecting previously unselected package axorouter.
(Reading database ... 17697 files and directories currently installed.)
Preparing to unpack axorouter.deb ...
Unpacking axorouter (0.66.0) ...
Setting up axorouter (0.66.0) ...
Low maximum socket receive buffer size value detected: 7500000 bytes (7.2MB).
Do you you want to permanently set the net.core.rmem_max sysctl value to 33554432 bytes (32MB) on this system? [Y]

net.core.rmem_max = 33554432
Created symlink '/etc/systemd/system/multi-user.target.wants/axostore.path' → '/etc/systemd/system/axostore.path'.
Created symlink '/etc/systemd/system/multi-user.target.wants/axorouter-wec.path' → '/etc/systemd/system/axorouter-wec.path'.
% Total    % Received % Xferd  Average Speed   Time    Time     Time  Current
                                Dload  Upload   Total   Spent    Left  Speed
100 42.9M  100 42.9M    0     0  28.1M      0  0:00:01  0:00:01 --:--:-- 28.2M
Selecting previously unselected package axolet.
(Reading database ... 17707 files and directories currently installed.)
Preparing to unpack axolet.deb ...
Unpacking axolet (0.66.0) ...
Setting up axolet (0.66.0) ...
Created symlink '/etc/systemd/system/multi-user.target.wants/axolet.service' → '/usr/lib/systemd/system/axolet.service'.
Now continue with onboarding the host on the Axoflow web UI.
Register the host.
Reload the Provisioning page. There should be a registration request for the new AxoRouter deployment. Select ✓.
Select Register to register the host. You can add a description and labels (in label:value format) to the host.
If the primary IP address (the first IP address shown in the Network addresses section on the Routers page for each AxoRouter) is not accessible from your edge hosts, set a Network address override (IP address or an FQDN) that’s accessible. Otherwise, data forwarding from edge hosts will fail.
Select the Topology page. The new AxoRouter instance is displayed.
Configure a host to send data to AxoRouter.
Log in to your device. You need administrator privileges to perform the configuration.
If needed, enable syslog forwarding on the device.
Set AxoRouter as the syslog server. Typically, you can configure the following parameters:
Name or IP Address of the syslog server: Set the address of your AxoRouter.
Protocol: If possible, set TCP or TLS.
Syslog Format: If possible, set RFC5424 (or equivalent), otherwise leave the default.
Port: Set a port appropriate for the protocol and syslog format you have configured.
By default, AxoRouter accepts data on the following ports (unless you’ve modified the default connector rules):
To receive data on other ports or other protocols, configure other connector rules for the AxoRouter host.
For TLS-encrypted syslog connections, create a new connector rule or edit an existing one, and configure the keys and certificates needed to encrypt the connections. For details, see Syslog.
Add the source to AxoConsole.
Open the AxoConsole and select Topology.
Select Add Item > Source.
If the source is actively sending data to an AxoRouter instance, select Detected, then select your source.
Otherwise, select the vendor and product corresponding to your source from the Predefined sources, then enter the parameters of the source, like IP address and FQDN.
(Optional) Add custom labels as needed.
Select Add.
Select Topology > Add Item > Path.
Select your data source in the Source host field.
Select the target router or aggregator this source is sending its data to in the Target host field, for example, axorouter.
Select the Target connector. The connector determines how the destination receives the data (for example, using which protocol or port).
Select Add. The new path appears on the Topology page.
syslog-ng, Splunk Connect for Syslog (SC4S), or AxoSyslog as its log forwarder agent, consider installing Axolet on the host and instrumenting the configuration of the log forwarder to receive detailed metrics about the host and the processed data. For details, see Manage and monitor the pipeline.
Add the destination where you’re sending your data. For a quick test, you can use a free Splunk or OpenObserve account.
Enable the HTTP Event Collector (HEC) on your Splunk deployment if needed. On Splunk Cloud Platform deployments, HEC is enabled by default.
Create a token for Axoflow to use in the destination. When creating the token, use the syslog source type.
For details, see Set up and use HTTP Event Collector in Splunk Web.
If you’re using AxoRouter, create the indexes where Axoflow sends the log data. Which index is needed depends on the sources you have, but create at least the following event indices: axoflow, infraops, netops, netfw, osnix (for unclassified messages). Check your sources in the Sources section for a detailed lists on which indices their data is sent.
If you’ve created any new indexes, make sure to add those indexes to the token’s Allowed Indexes.
Create a new destination.
Select Splunk.
Select Dynamic. This will allow you to set a default index, source, and source type for messages that aren’t automatically identified.
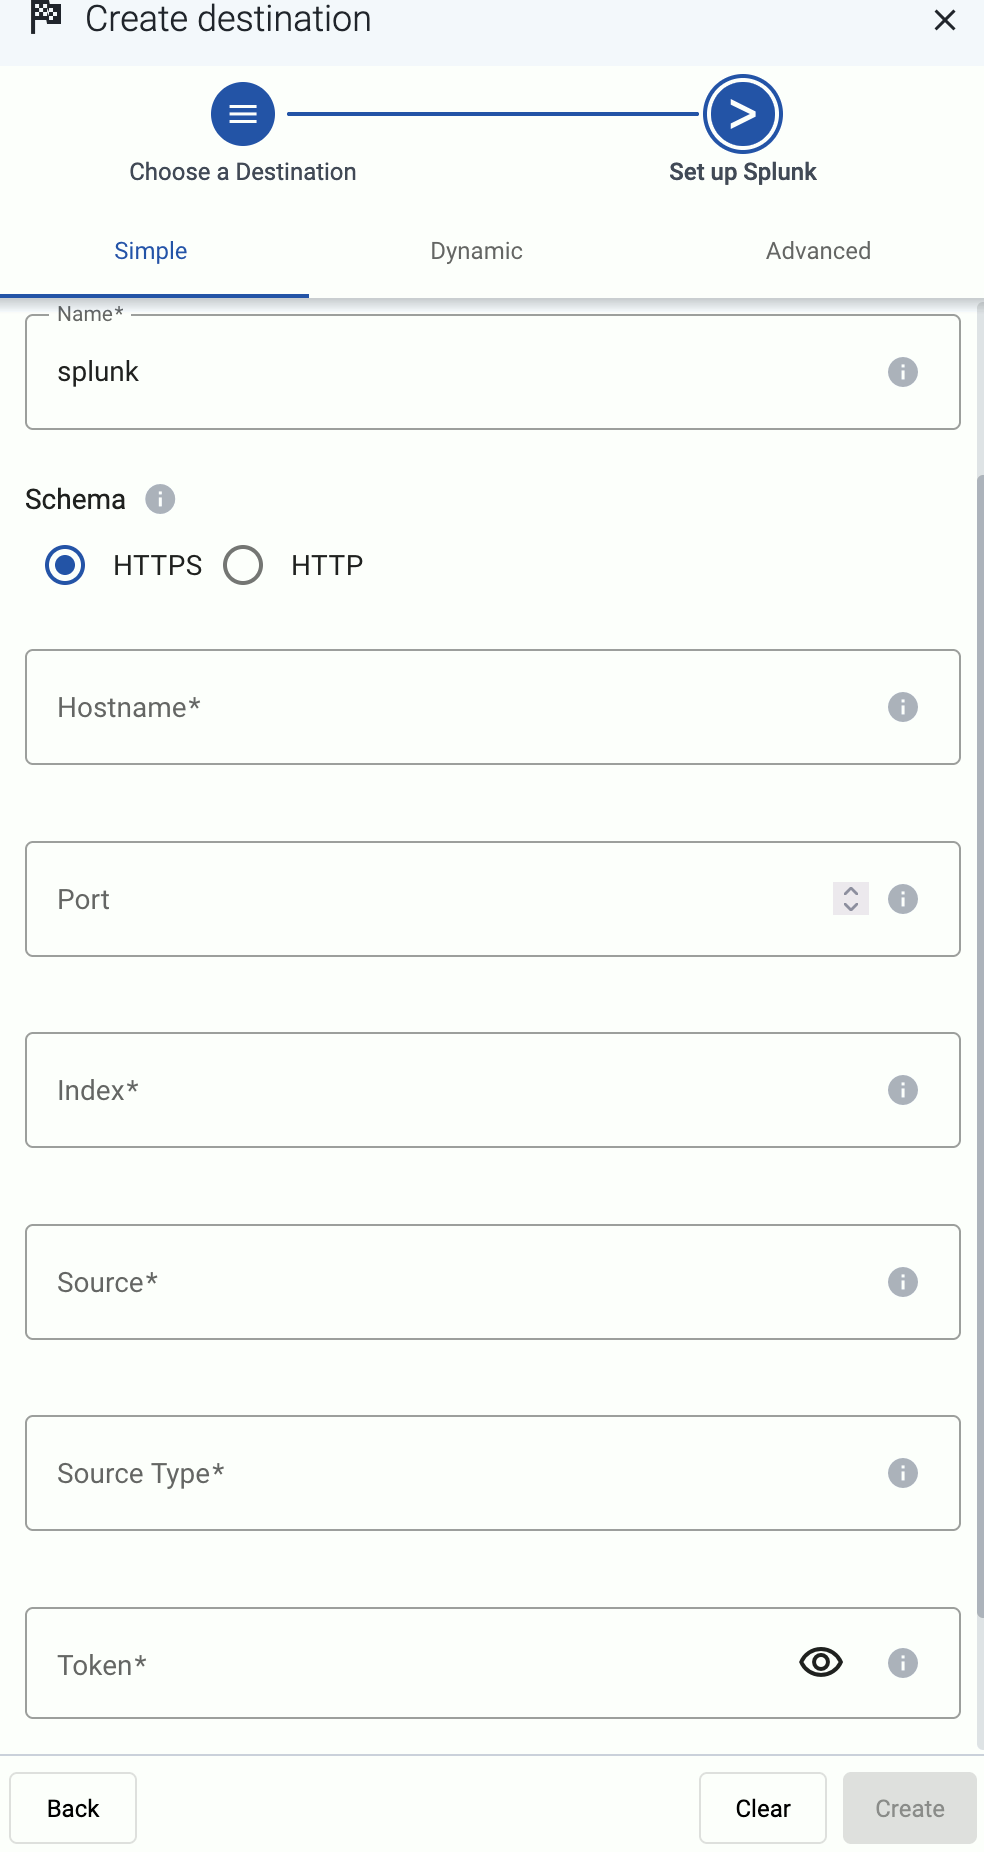
Enter your Splunk URL into the Hostname field, for example, <your-splunk-tenant-id>.splunkcloud.com for Splunk Cloud Platform free trials, or <your-splunk-tenant-id>.splunkcloud.com for Splunk Cloud Platform instances.
Enter the name of the Default Index. The data will be sent into this index if no other index is set during the processing of the message (based on automatic classification, or by the processing steps of the Flow). Make sure that the index exists in Splunk.
Enter the Default Source and Default Source Type. These will be assigned to the messages that have no source or source type set during the processing of the message (based on automatic classification, or by the processing steps of the Flow).
Enter the token you’ve created into the Token field.
Disable the Verify server certificate option unless your deployment has a valid, non-self-signed certificate. Free Splunk Cloud accounts have self-signed certificates.
(Optional) You can set other options as needed for your environment. For details, see Splunk.
Select Add.
Select Flows.
Select Add Flow.
Enter a name for the flow, for example, my-test-flow.
In the Router Selector field, enter an expression that matches the router(s) you want to apply the flow. To select a specific router, use a name selector, for example, name = my-axorouter-hostname.
You can use any labels and metadata of the AxoRouter hosts in the Router selectors, for example, the hostname of the AxoRouter, or any custom labels.
name field to the name of the instance as selector. For example, name = my-axorouter.Select the Destination where you want to send your data. If you don’t have any destination configured, you can select + Add in the destination section to create a new destination now. For details on the different destinations, see Destinations.
(Optional) To process the data transferred in the flow, select Add New Processing Step. For details, see Processing steps. For example:
meta.vendor = fortinet AND meta.product = fortigate query.
Select Add.
The new flow appears in the Flows list.
Open the Topology page and verify that your AxoRouter instance is connected both to the source and the destination.
If you have traffic flowing from the source to your AxoRouter instance, the Topology page shows the amount of data flowing on the path. Click the AxoRouter instance, then select Analytics to visualize the data flow.
Log tapping in Axoflow samples the log flow. You can use labels to filter for specific messages (like ones with parse errors) and tap only those messages. To not get overwhelmed with events, Axoflow automatically samples the output: if many messages match the selected filter, only a subset is shown (about 1 message per second). Using log tapping, you can quickly troubleshoot both parsing/curation errors and destination ingest (API) errors, and check:
Click your AxoRouter instance on the Topology page, then select ⋮ > Tap log flow.
Tap into the log flow.
You can use labels to filter the messages and sample only the matching ones.
When the logs you’re interested in show up, click Stop Log Tap, then click a log message to see its details.
If you don’t know what the message means, select AI Analytics to ask our AI to interpret it.
In case you run into problems, or you’re not getting any data in Splunk, check the logs of your AxoRouter instance:
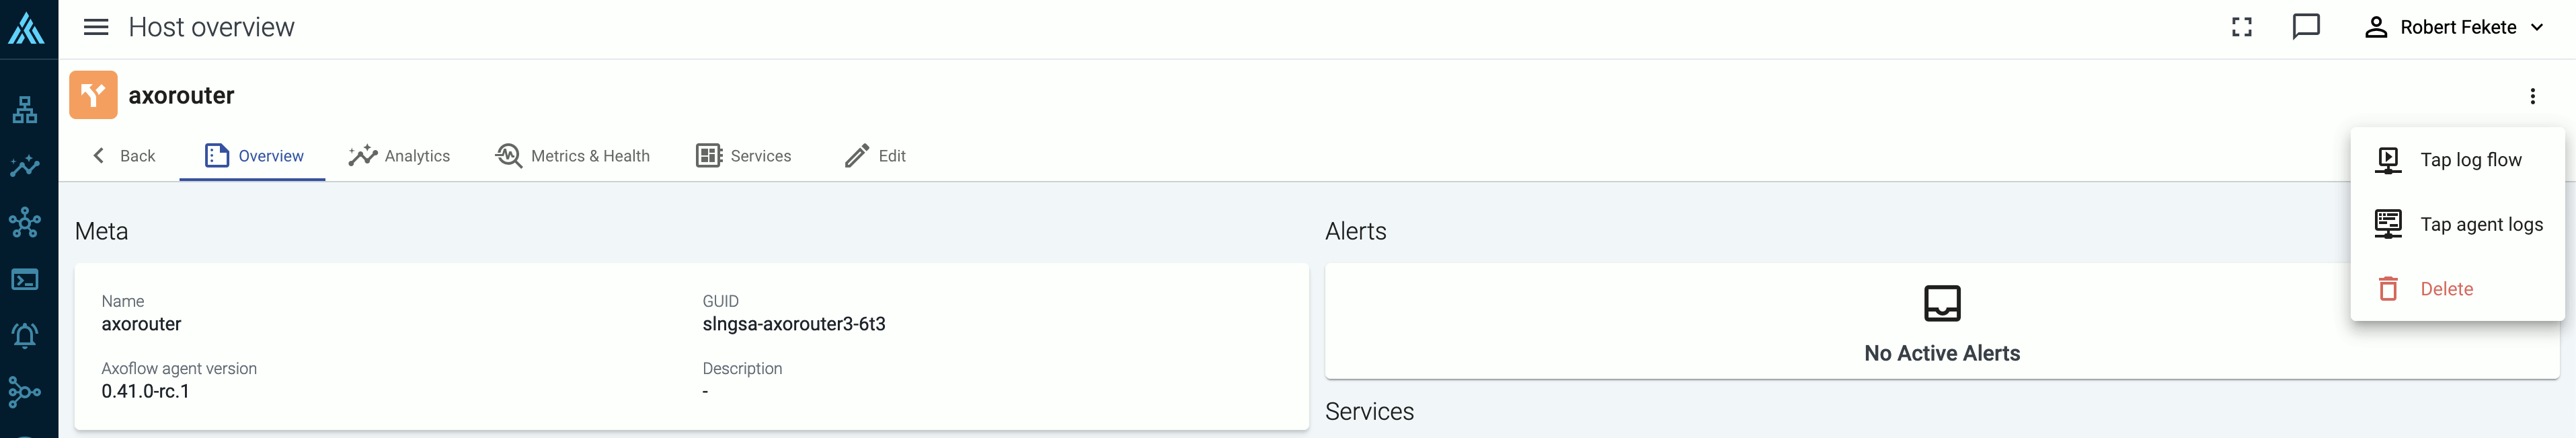
Select Topology, then select your AxoRouter instance.
Select ⋮ > Tap agent logs > Start. Axoflow displays the log messages of AxoRouter. Check the logs for error messages. Some common errors include:
Redirected event for unconfigured/disabled/deleted index=netops with source="source::axo" host="host::axosyslog-almalinux" sourcetype="sourcetype::fortigate_event" into the LastChanceIndex. So far received events from 1 missing index(es).: The Splunk index where AxoRouter is trying to send data doesn’t exist. Check which index is missing in the error message and create it in Splunk. (For a list of recommended indices, see the Splunk destination prerequisites.)http: error sending HTTP request; url='https://prd-p-sp2id.splunkcloud.com:8088/services/collector/event/1.0?index=&source=&sourcetype=', error='SSL peer certificate or SSH remote key was not OK', worker_index='0', driver='splunk--flow-axorouter4-almalinux#0', location='/usr/share/syslog-ng/include/scl/splunk/splunk.conf:104:3': Your Splunk deployment uses an invalid or self-signed certificate, and the Verify server certificate option is enabled in the Splunk destination of Axoflow. Either fix the certificate in Splunk, or: select Topology > <your-splunk-destination>, disable Verify server certificate, then select Update.