Collect logs from Event Tracing for Windows (ETW).
Prerequisites
This collector can be deployed to edge hosts running Axoflow agent for Windows.
Add new ETW Collector
To create a new Collection Rule that collects Event Tracing data from on edge hosts, complete the following steps:
-
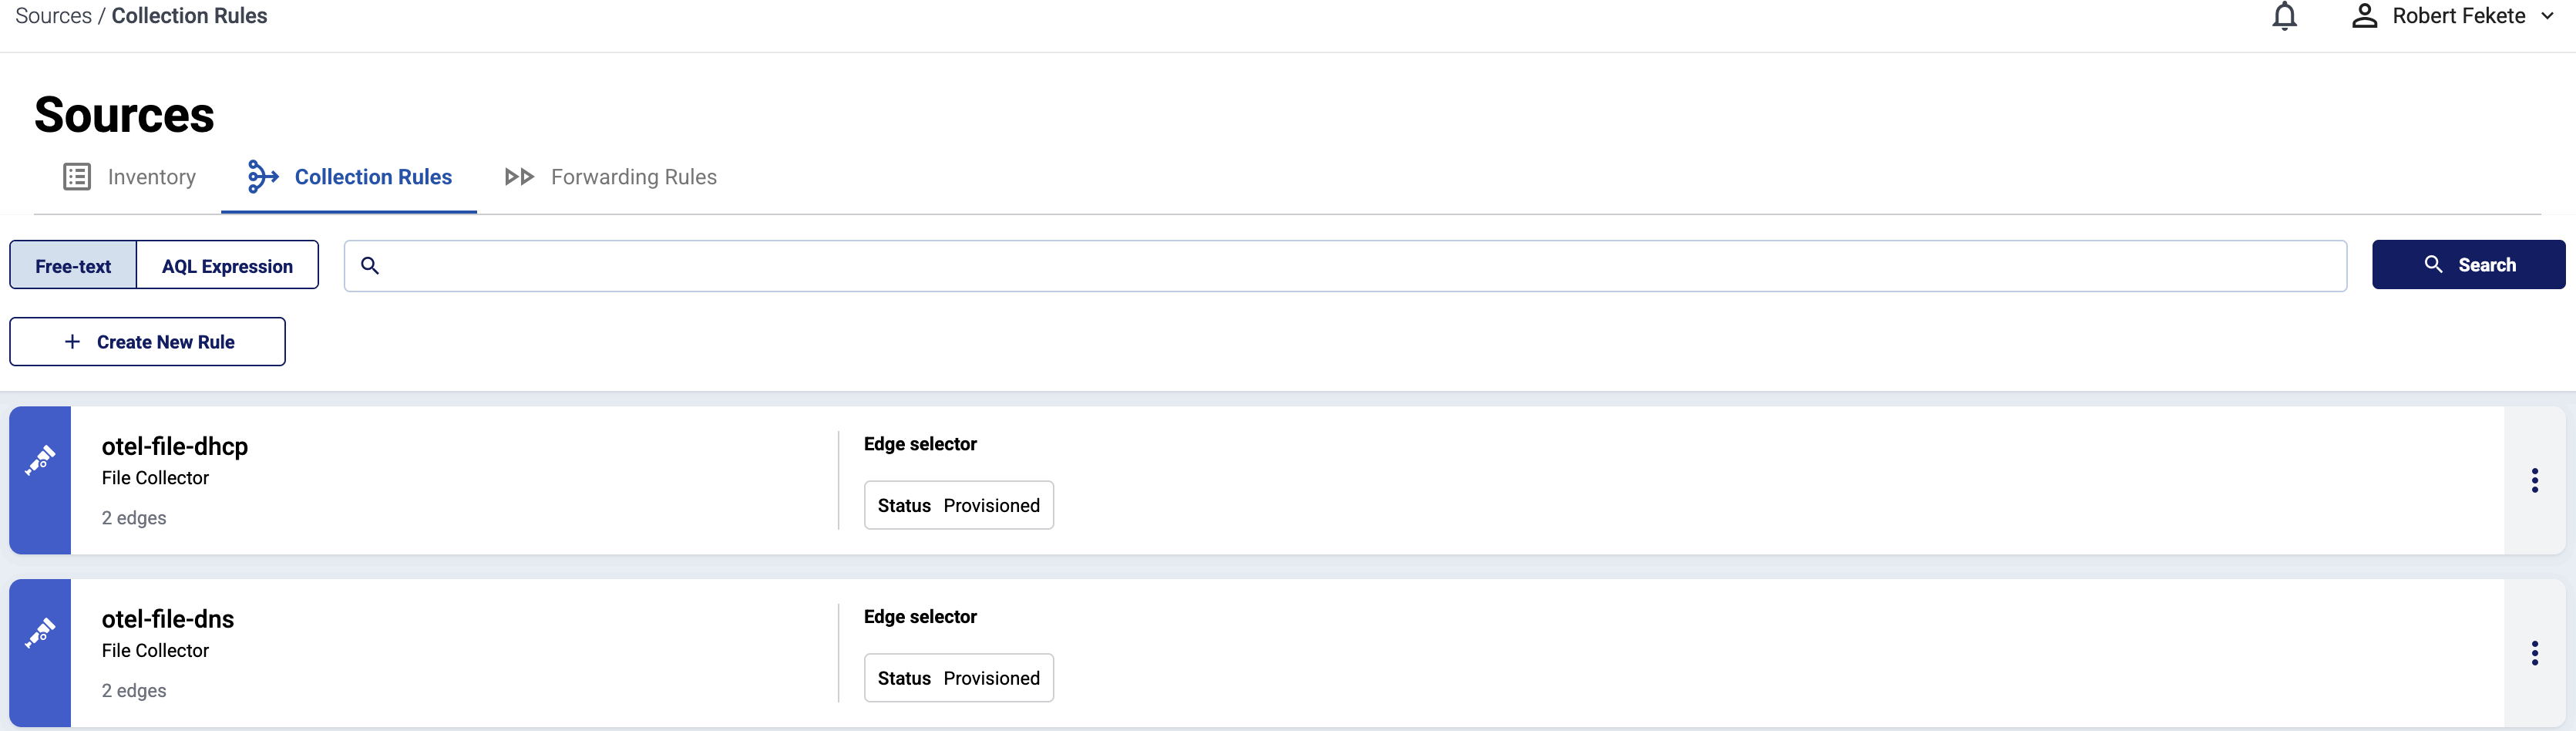
Select Sources > Collection Rules > Add Rule. (Alternatively, you can select Add Collector > Create a collection rule on the Collectors page of an edge host.)
-
Select Windows Event Tracing.
-
Configure the connector rule.
-
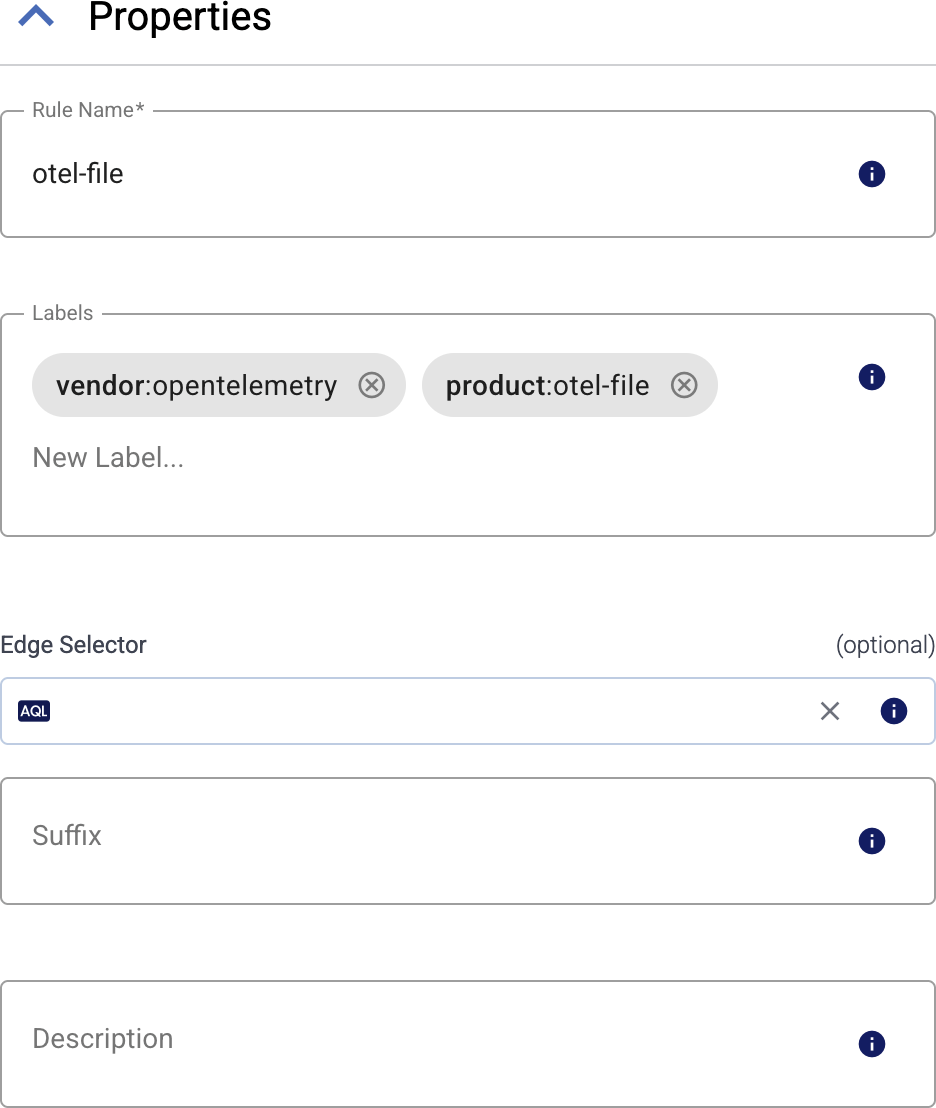
Enter a name for the collection rule into the Rule Name field.
-
(Optional) Add labels to the collection rule.
You can use these metrics labels as:
- Filter labels on the Analytics page
- in the Filter By Label field during log tapping
- in Flow Processing steps, for example, in the Query field of Select Messages steps.
-
Set the Edge Selector for the collection rule. The selector determines which edge hosts will have an edge connector based on this collection rule.
- Only edge hosts will match the rule.
- If you leave the Edge Selector field empty, the rule will match every edge host.
- To select only a specific host, set the
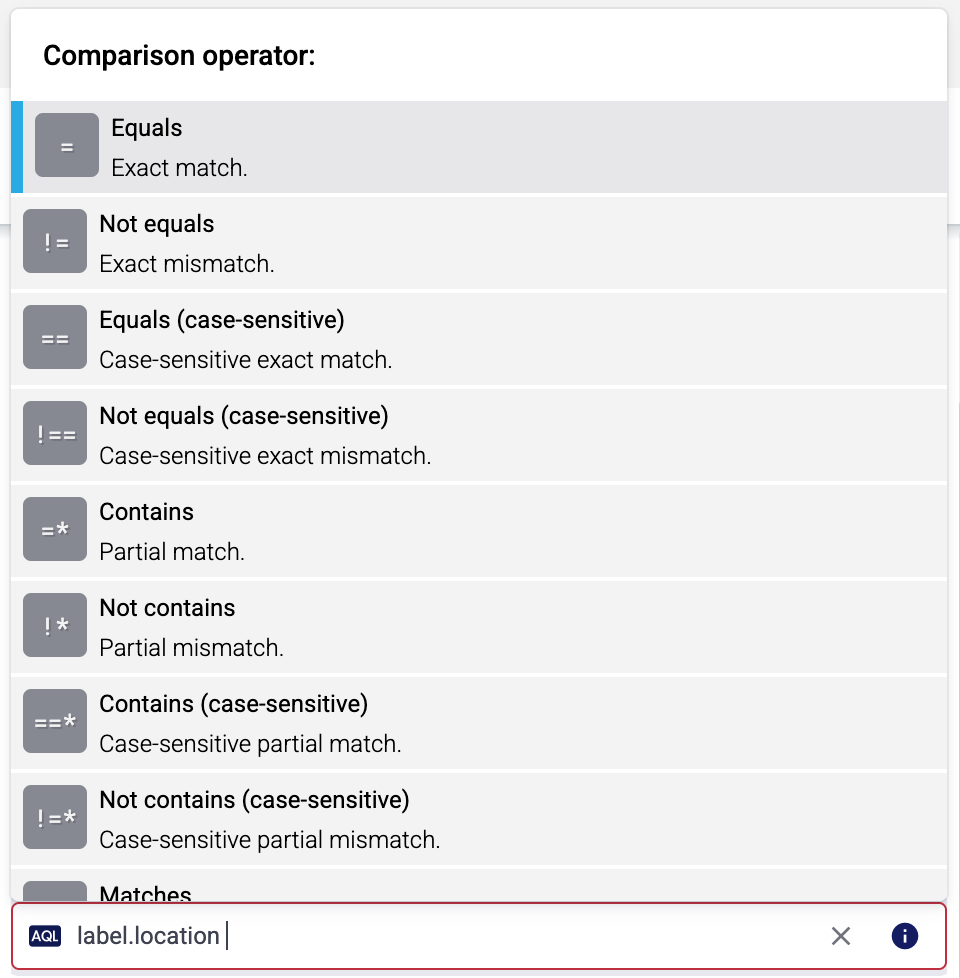
namefield to the name of the host as selector. - If you set multiple fields in the selector, the collection rule will apply only to edge hosts that match all elements of the selector. (There in an AND relationship between the fields.) For example,
label.location = us-east-1 AND label.product = windows
-
(Optional) Enter a Suffix for the collection rule. This suffix will be used in the name of the edge connector instances created on the edge hosts. For example, if the name of a matching edge host is “my-edge”, and the suffix of the rule is “otel-file-collector”, the edge connector created for the edge will be named “my-edge-otel-file-collector”.
If the Suffix field is empty, the name of the collection rule is used instead.
-
(Optional) Enter a description for the rule.
-
-
Select the configuration profile to use. The following profiles are available:
- DNS server (full trace): A pre-defined profile for collecting every available DNS server traces.
- DNS server (queries only): A pre-defined profile for collecting only DNS queries.
- Custom: Use a fully-customized configuration.
-
(Optional) If needed, set advanced options under More options.
Note that if you set an advanced option when using a pre-defined profile, your changes override the related default setting of the pre-defined profile.
-
Select Add. Based on the collection rule, Axoflow automatically creates edge connectors on the edge hosts that match the Edge Selector.
CAUTION:
Make sure to configure Data Forwarding Rules for your edge hosts to transfer the collected data to the OpenTelemetry connector of an AxoRouter.Note When using Log tapping, ETW events look a bit weird: the body of these events is empty. That’s normal, the reason for that is that everything is sent as metadata.
Related metrics
You can use these metrics labels as:
- Filter labels on the Analytics page
- in the Filter By Label field during log tapping
- in Flow Processing steps, for example, in the Query field of Select Messages steps.
| label | value |
|---|---|
| edge_connector_name | The name of the edge connector that collected the message |
| edge_connector_type | windowsEventTracing |
| edge_connector_label_ | Labels set on the edge connector. By default: vendor:microsoft, product:windows-event-tracing |
| edge_connector_rule_id | The ID of the owner ConnectorRule resource in Axoflow that created the edge connector. |
| edge_flow_name | The name of the edge forwarding rule that sent the message. |
Advanced options
Note that if you set an advanced option when using a pre-defined profile, your changes override the related default setting of the pre-defined profile.
-
Provider: The provider to subscribe to, for example,
Microsoft-Windows-DNSServerfor DNS logs. For a complete list, open a command prompt on the edge host and runlogman query providers.Note that provider name is case sensitive. Alternatively, you can use the GUID of the provider as well, in the following format:
{9e814aad-3204-11d2-9a82-006008a86939}. If you’re manually setting the provider, consider enabling the Ignore missing provider option as well. -
Level: Log level of trace events to be included. Specifying a log level means that all higher priority log levels will be collected as well. Possible values are (starting with the highest priority):
critical,error,warning,information,verbose. -
Ignore missing provider: Continue working if the specified provider is missing from the host.
CAUTION:
If this option is disabled and the provider is missing, the all other connectors of the agent can stop, not just the ETW connectors. -
Match any keywords: Collect only traces that match at least one of the specified keywords of the provider. Note that these keywords are not literal strings, but bitmasks that correspond to the specific provider. To match on multiple keywords, you have to add the bitmasks of the corresponding keywords.
-
Match all keywords: Collect only traces that match all of the specified keywords of the provider. Note that these keywords are not literal strings, but bitmasks that correspond to the specific provider. To match on multiple keywords, you have to add the bitmasks of the corresponding keywords.
-
Buffer size: Buffer size allocated for each ETW trace session, in kilobytes. Minimum is 4, maximum is 16384.
-
Minimum buffers: Minimum number of buffers allocated for each ETW trace session. Note that the minimum and maximum buffers behave like hints to the ETW subsystem and aren’t guaranteed to be allocated as specified.
-
Maximum buffers: Maximum number of buffers allocated for each ETW trace session. Note that the minimum and maximum buffers behave like hints to the ETW subsystem and aren’t guaranteed to be allocated as specified.
-
Flush time: How often, in seconds, any non-empty trace buffers are flushed.
0will enable a default timeout of1second. -
Event buffer size: Number of ETW events the ETW receiver stores in memory for processing.
-
Number of workers: Number of workers that process ETW events.