This section describes how data Axoflow processes your security data, and how to configure and monitor your data flows in Axoflow.
This is the multi-page printable view of this section. Click here to print.
Data management
- 1: Flow overview
- 2: Manage flows
- 3: Processing steps
- 4: Flow metrics
- 5: Flow analytics
- 6: Paths
- 7: Flow tapping
1 - Flow overview
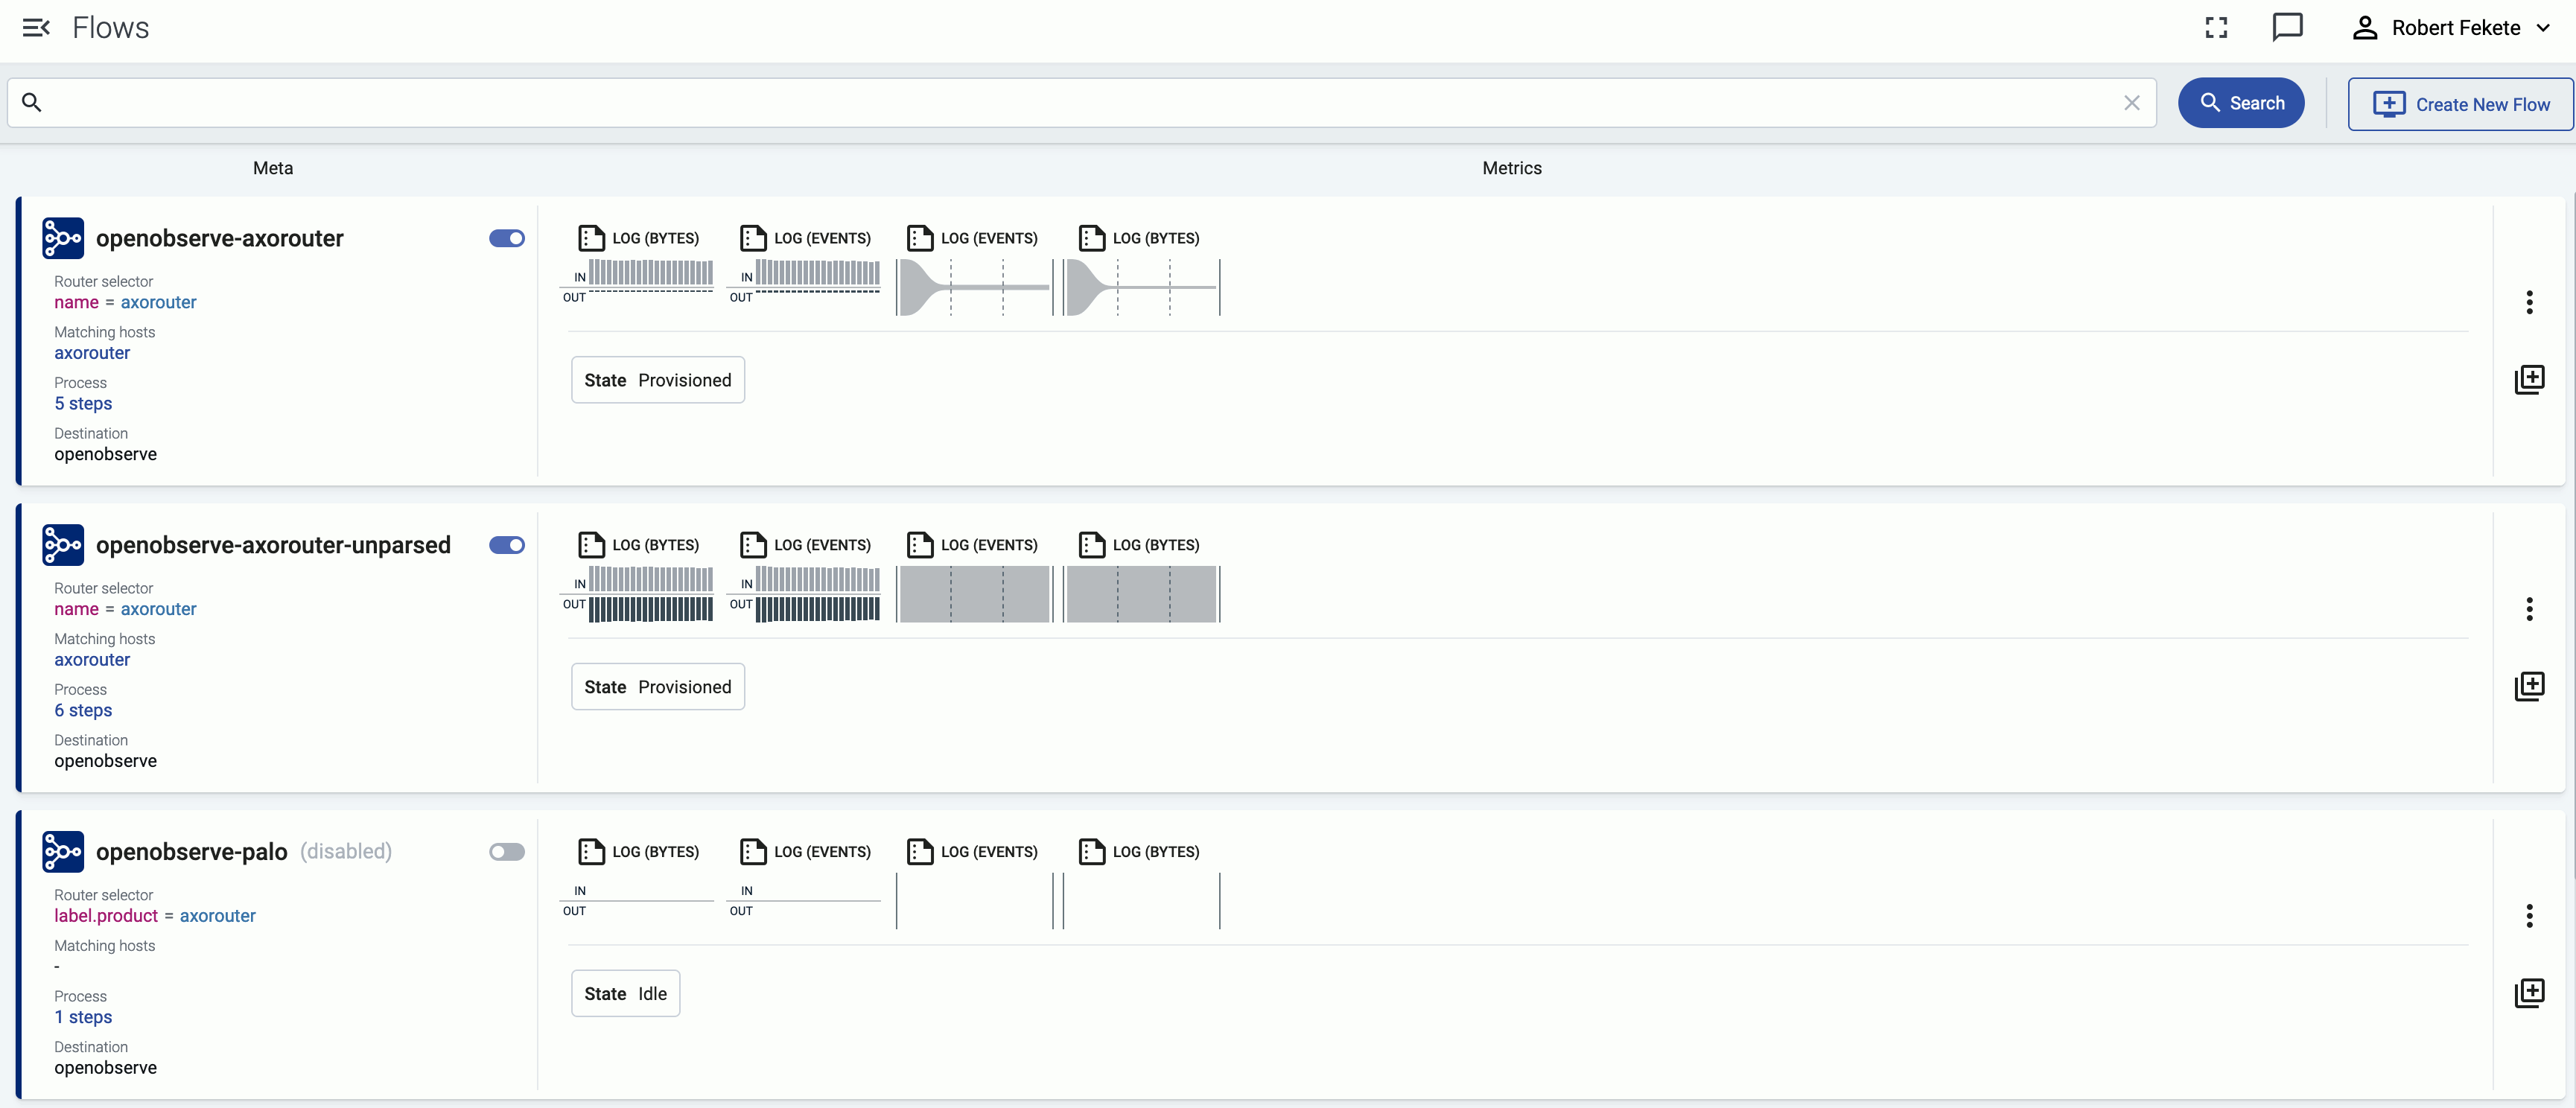
Axoflow uses flows to manage the routing and processing of security data. A flow applies to one or more AxoRouter instances. The Flows page lists the configured flows, and also highlights if any alerts apply to a flow.
Each flow consists of the following main elements:
- A Router selector that specifies the AxoRouter instances the flow applies to. Multiple flows can apply to a single AxoRouter instance.
- Processing steps that filter and select the messages to process, set/unset message fields, and perform different data transformation and data reduction.
- A Destination where the AxoRouter instances of the flow deliver the data. Destinations can be external destinations (for example, a SIEM), stores or external stores, or other AxoRouter instances.
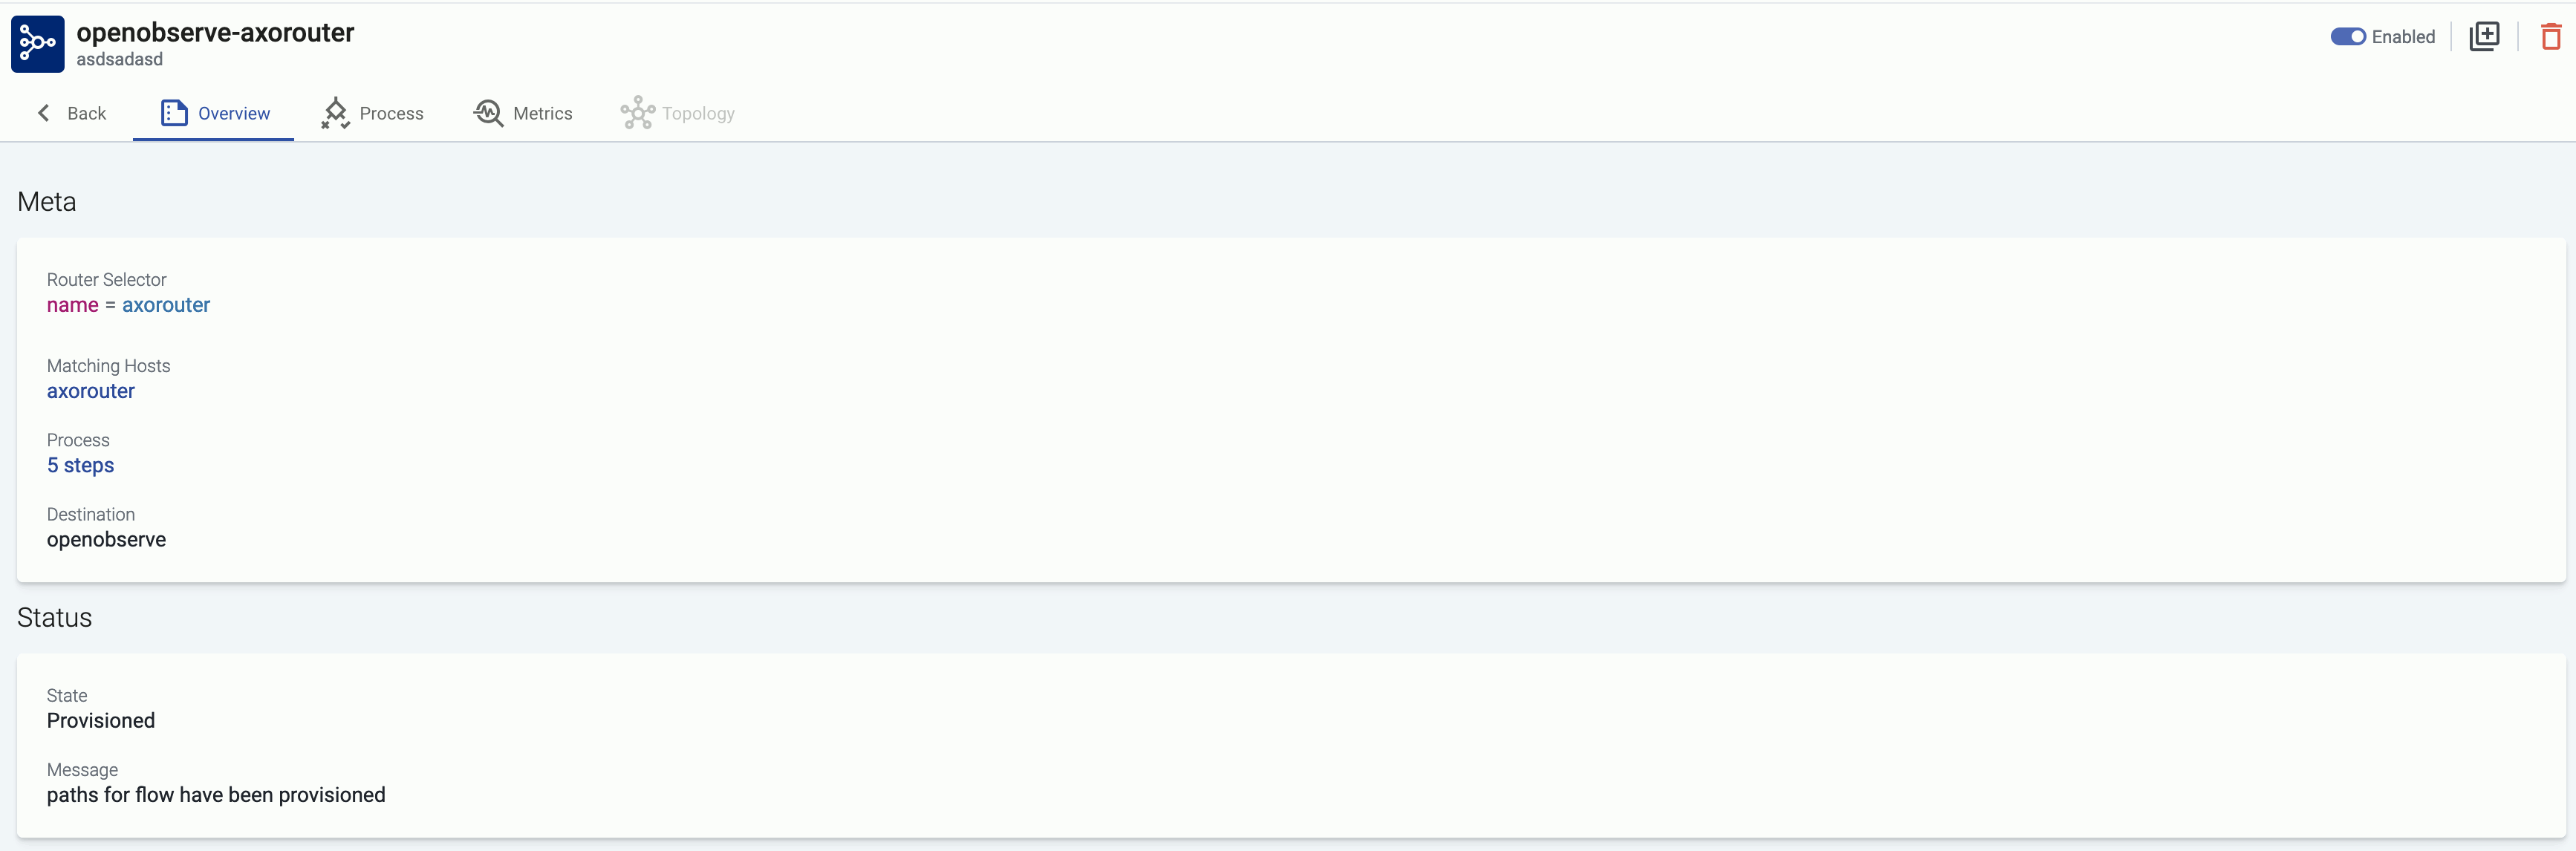
Based on the flows, AxoConsole automatically generates and deploys the configuration of the AxoRouter instances. Click ⋮ or the name of the flow to display the details of the flow.
Filter flows
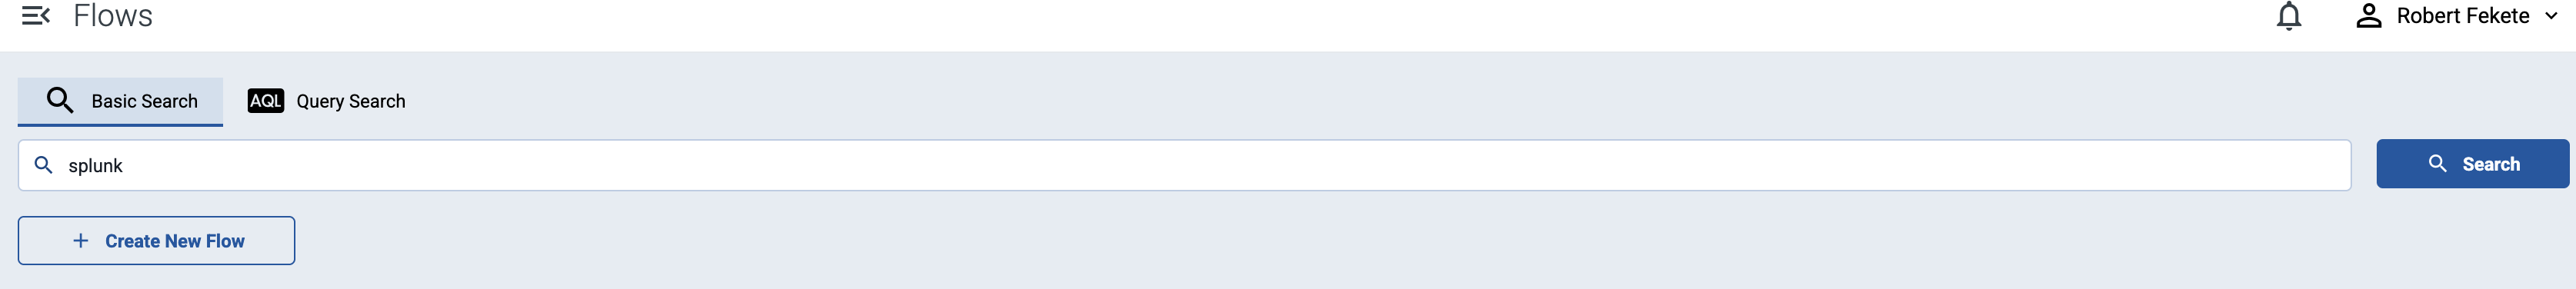
To find or display only specific flows, you can use the filter bar.
-
Free-text mode searches in the following fields of the flow: Name, Destination, Description.
Basic Search is case insensitive. Adding multiple keywords searches for matches in any of the previous fields. This is equivalent to the
@ANY =* keyword1 AND @ANY =* keyword2AQL query. -
AQL Expression mode allows you to search in specific fields of the flows.
It also makes more complex filtering possible, using the Equals, Contains (partial match), and Match (regular expression match) operators. Note that:
- To execute the search, click Search, or hit ESC then ENTER.
- AxoConsole autocompletes the built-in and custom labels and field names, as well as their most frequent values, but doesn’t autocomplete labels and variables created by data parsing and processing steps.
- You can use the AND and OR operators to combine expressions, and also parenthesis if needed. For details on AQL, see AQL operator reference.
- The precedence of the operators is the following: parentheses, AND, OR, comparison operators.
- Use the usual keyboard shortcuts to undo (⌘/Ctrl + Z) or redo (⌘/Ctrl + Shift + Z) your edits.
2 - Manage flows
Create flow
To create a new flow, open the AxoConsole, then complete the following steps:
-
Select Flows.
-
Select Add Flow.
-
Enter a name for the flow, for example,
my-test-flow.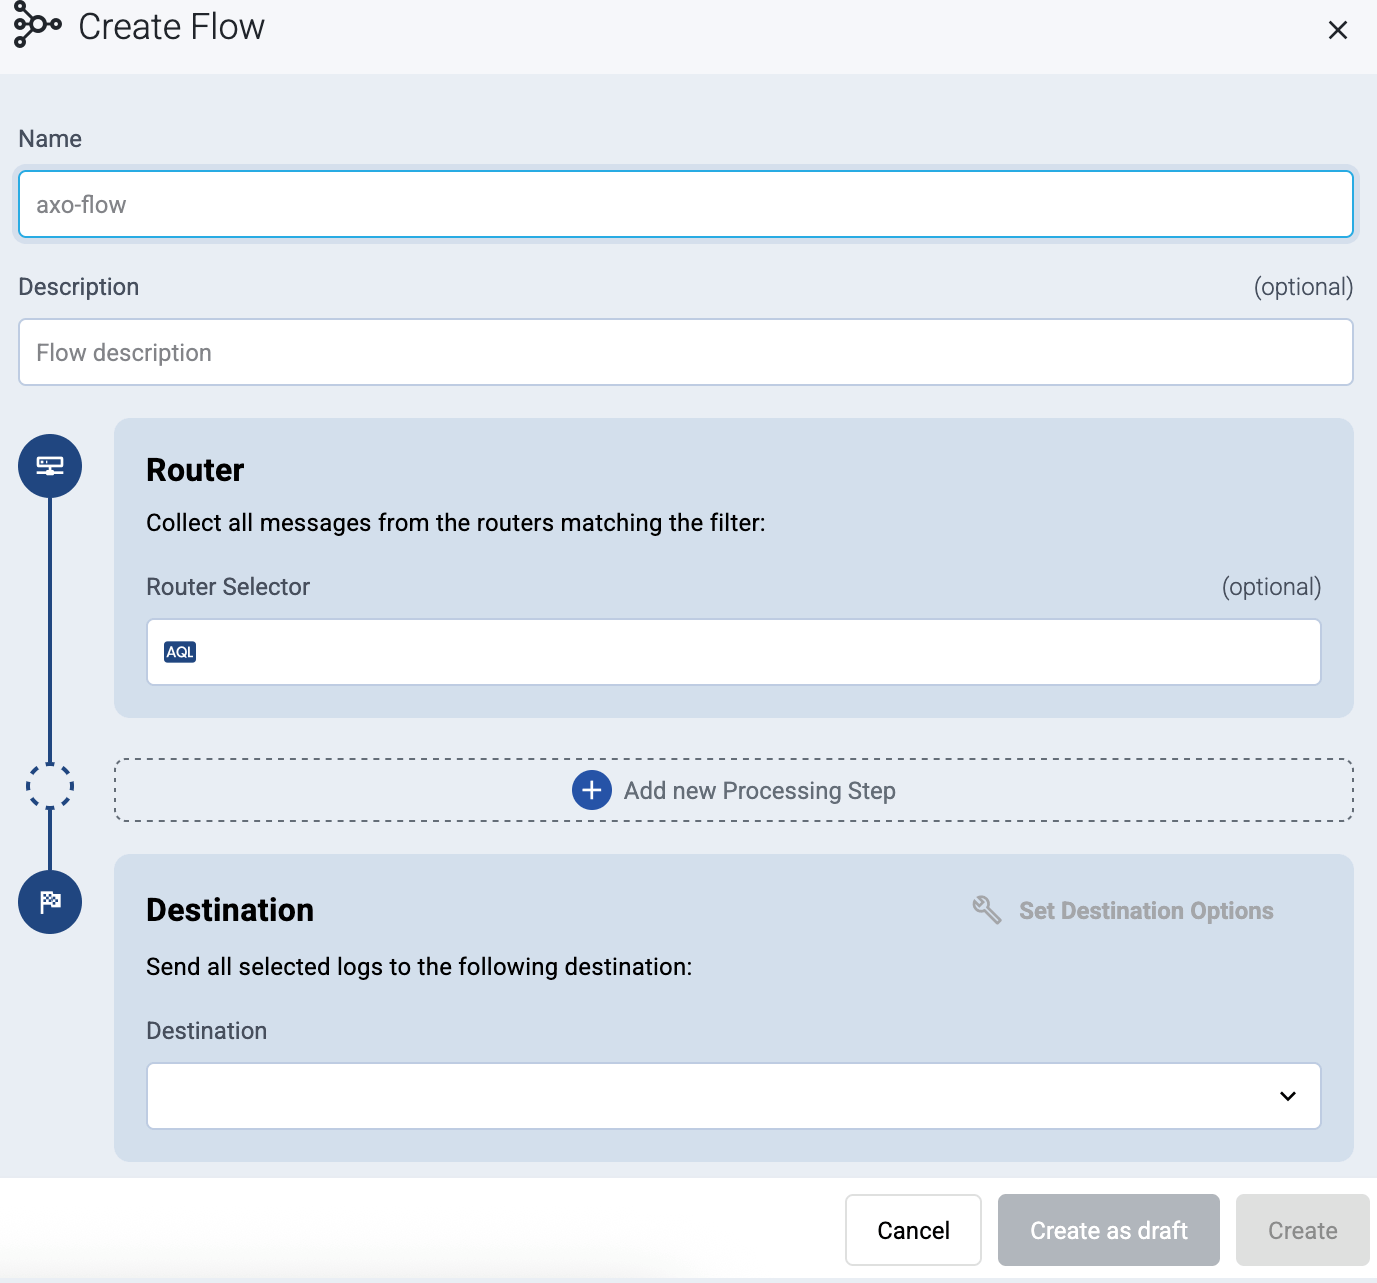
-
In the Router Selector field, enter an expression that matches the router(s) you want to apply the flow. To select a specific router, use a name selector, for example,
name = my-axorouter-hostname.You can use any labels and metadata of the AxoRouter hosts in the Router selectors, for example, the hostname of the AxoRouter, or any custom labels.
- If you leave the Router Selector field empty, the selector will match every AxoRouter instance.
- To select only a specific AxoRouter instance, set the
namefield to the name of the instance as selector. For example,name = my-axorouter. - If you set multiple fields in the selector, the selector will match only AxoRouter instances that match all elements of the selector. (There in an AND relationship between the fields.)
-
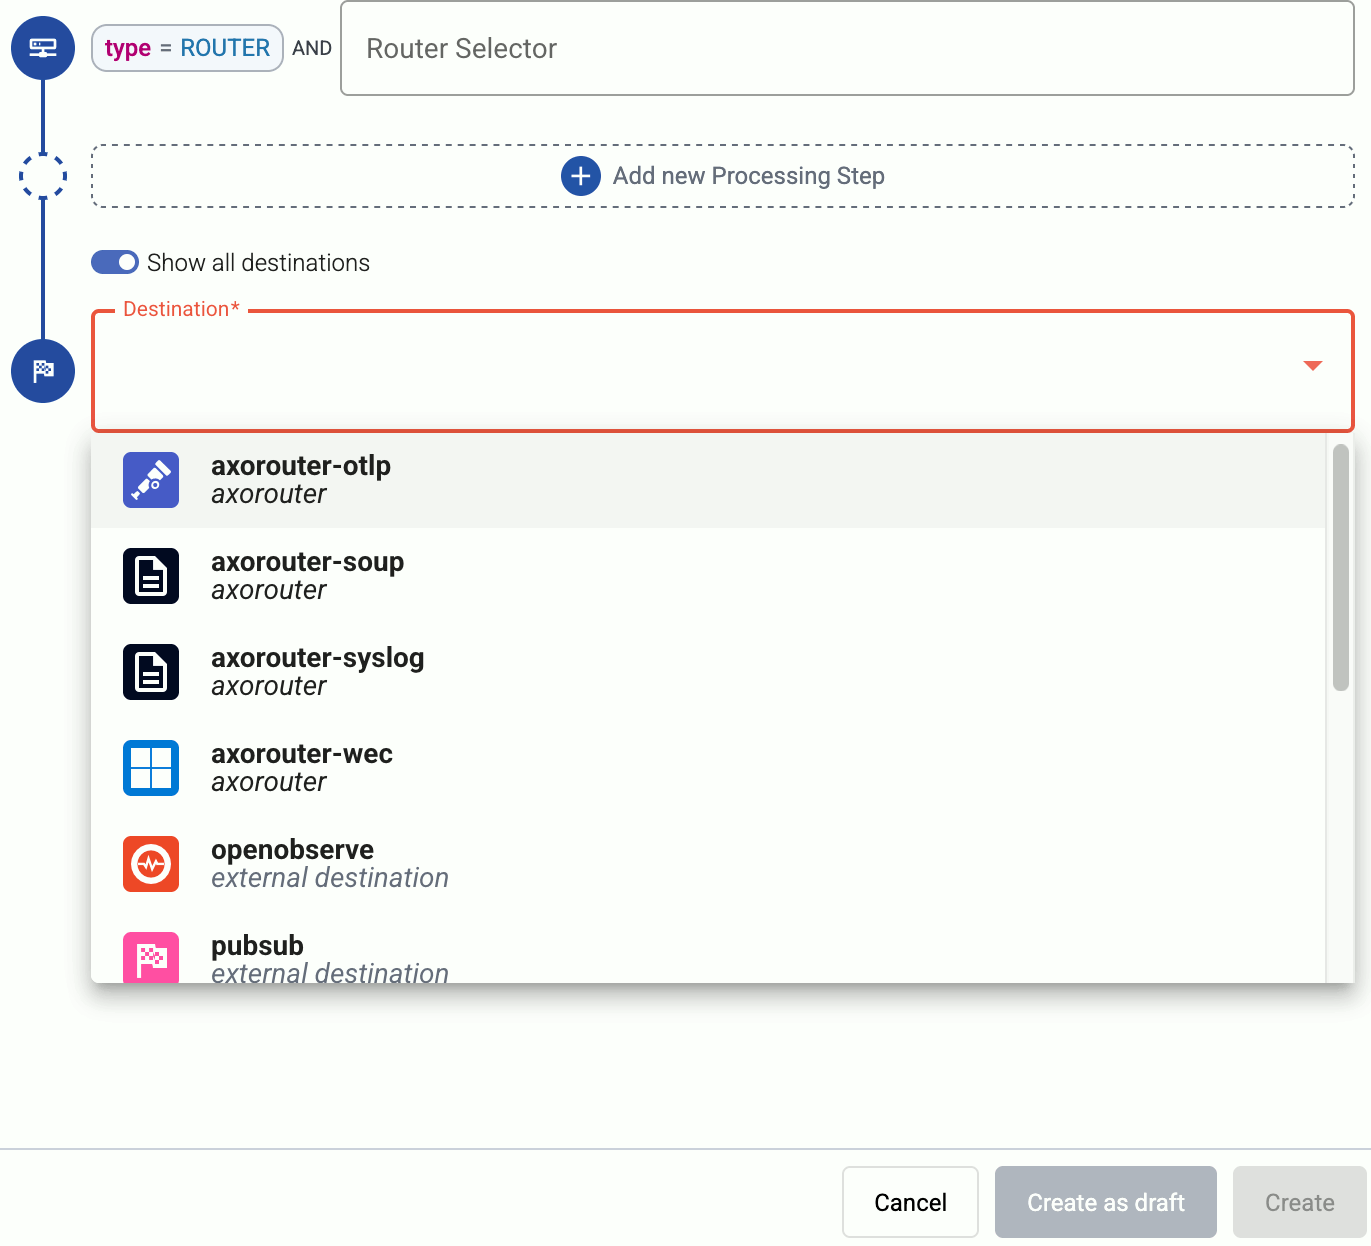
Select the Destination where you want to send your data. If you don’t have any destination configured, you can select + Add in the destination section to create a new destination now. For details on the different destinations, see Destinations.
- If you don’t have any destination configured, see Destinations.
- If you’ve already created a store, it automatically available as a destination. Note that the Router Selector of the flow must match only AxoRouters that have the selected store available, otherwise you’ll get an error message.
- If you want to send data to another AxoRouter, enable the Show all destinations option, and select the connector of the AxoRouter where you want to send the data.
-
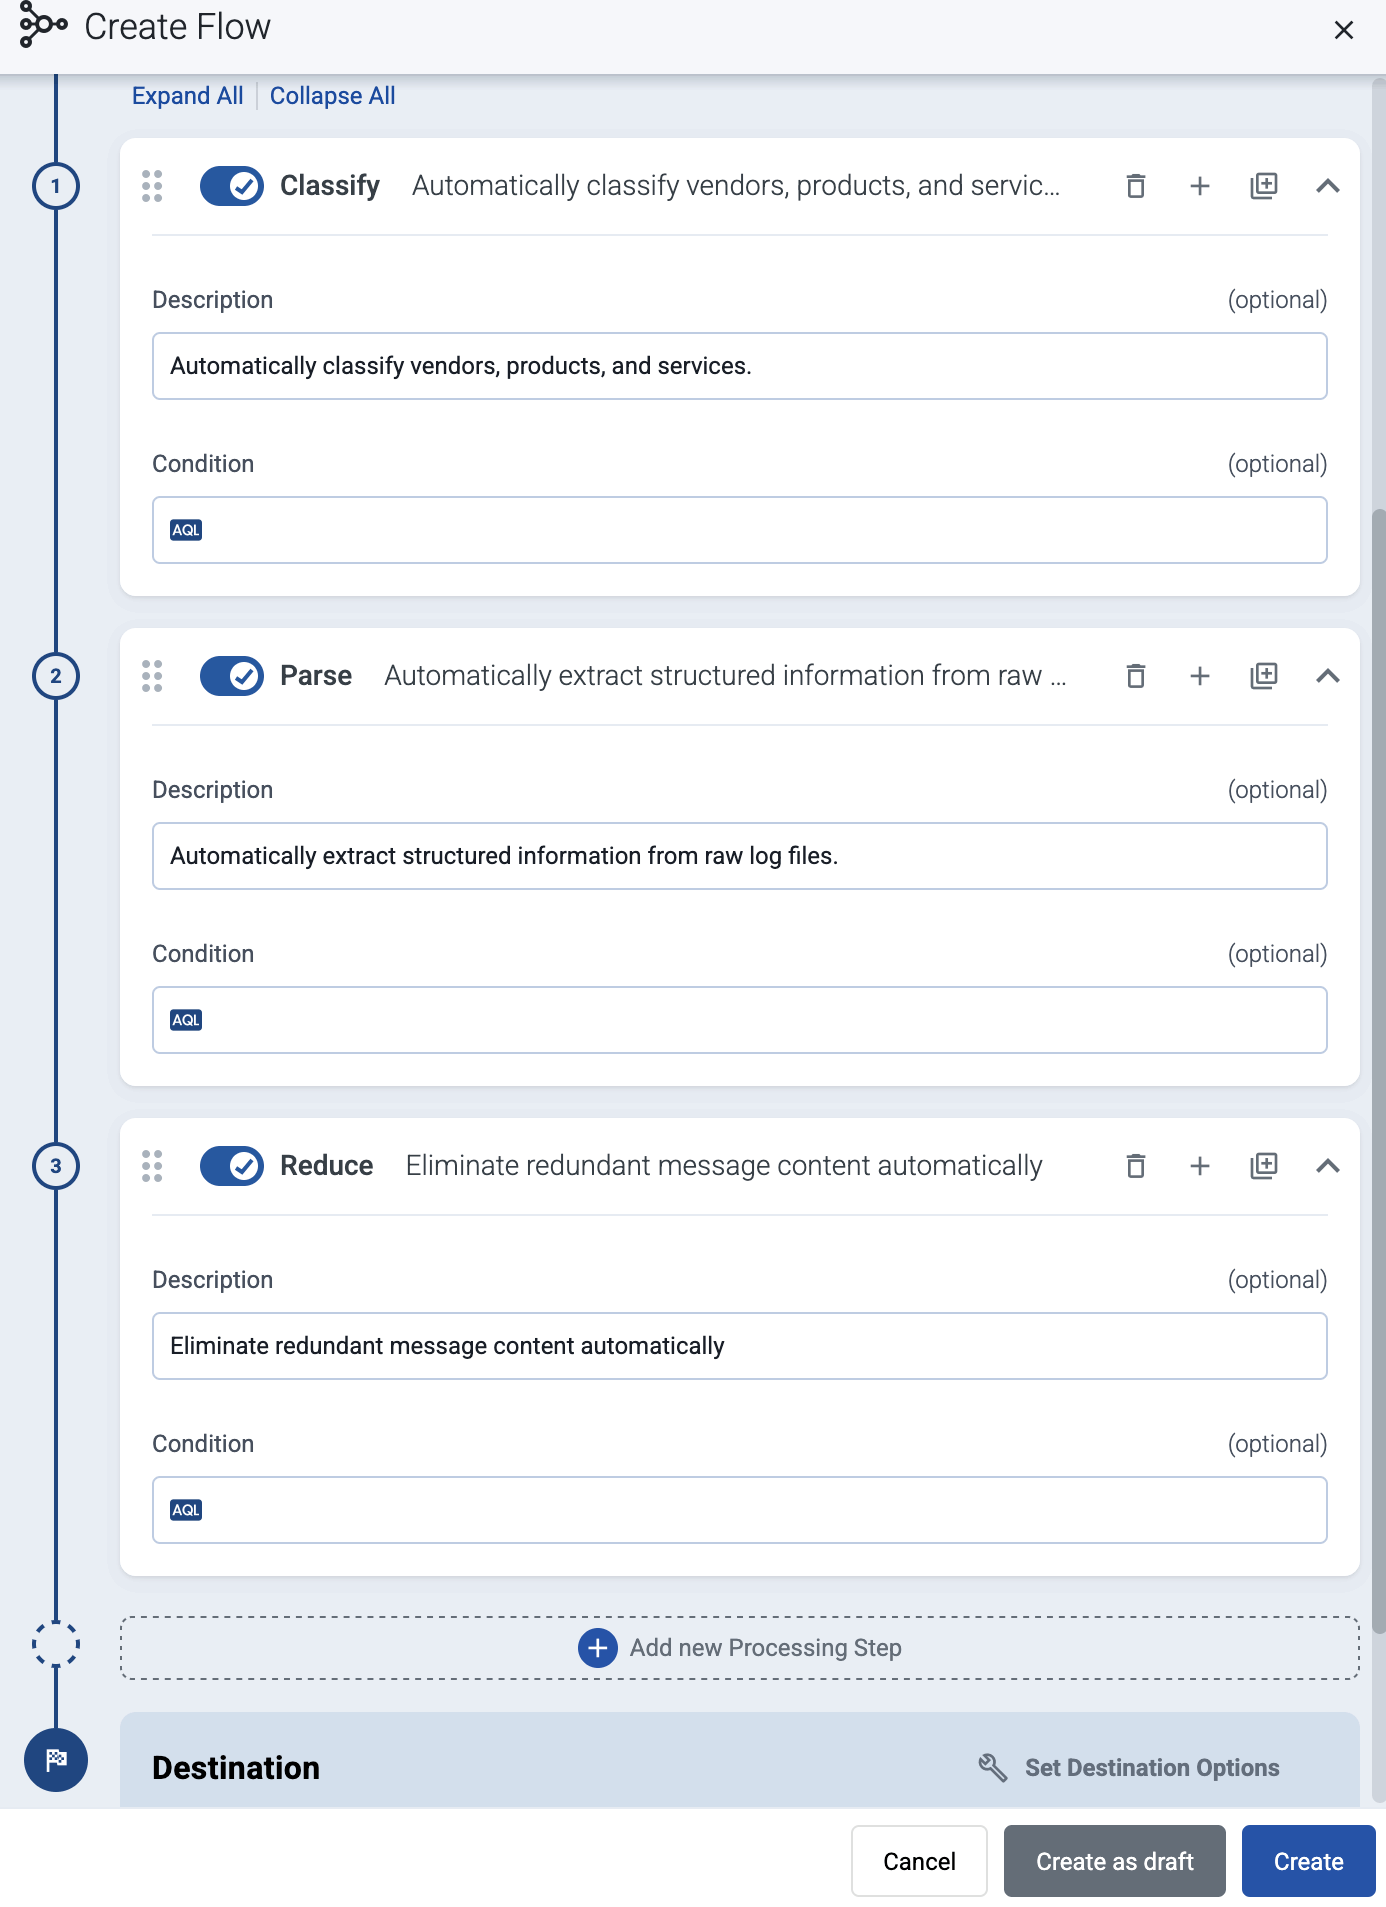
(Optional) To process the data transferred in the flow, select Add New Processing Step. For details, see Processing steps. For example:
- Add a Classify, a Parse, and a Reduce step, in that order, to automatically remove redundant and empty fields from your data.
- To select which messages are processed by the flow, add a Select Messages step, and enter a filter into the AQL Expression field. For example, to select only the messages received from Fortinet FortiGate firewalls, use the
meta.vendor = fortinet AND meta.product = fortigatequery. - Save the processing steps.
-
Select Add.
-
The new flow appears in the Flows list.
Disable flow
You can disable a flow without deleting it if needed by clicking the toggle on the right of the flow name.
CAUTION:
Disabling a flow immediately stops log forwarding for the flow. Any data that’s not forwarded using another flow can be irrevocably lost.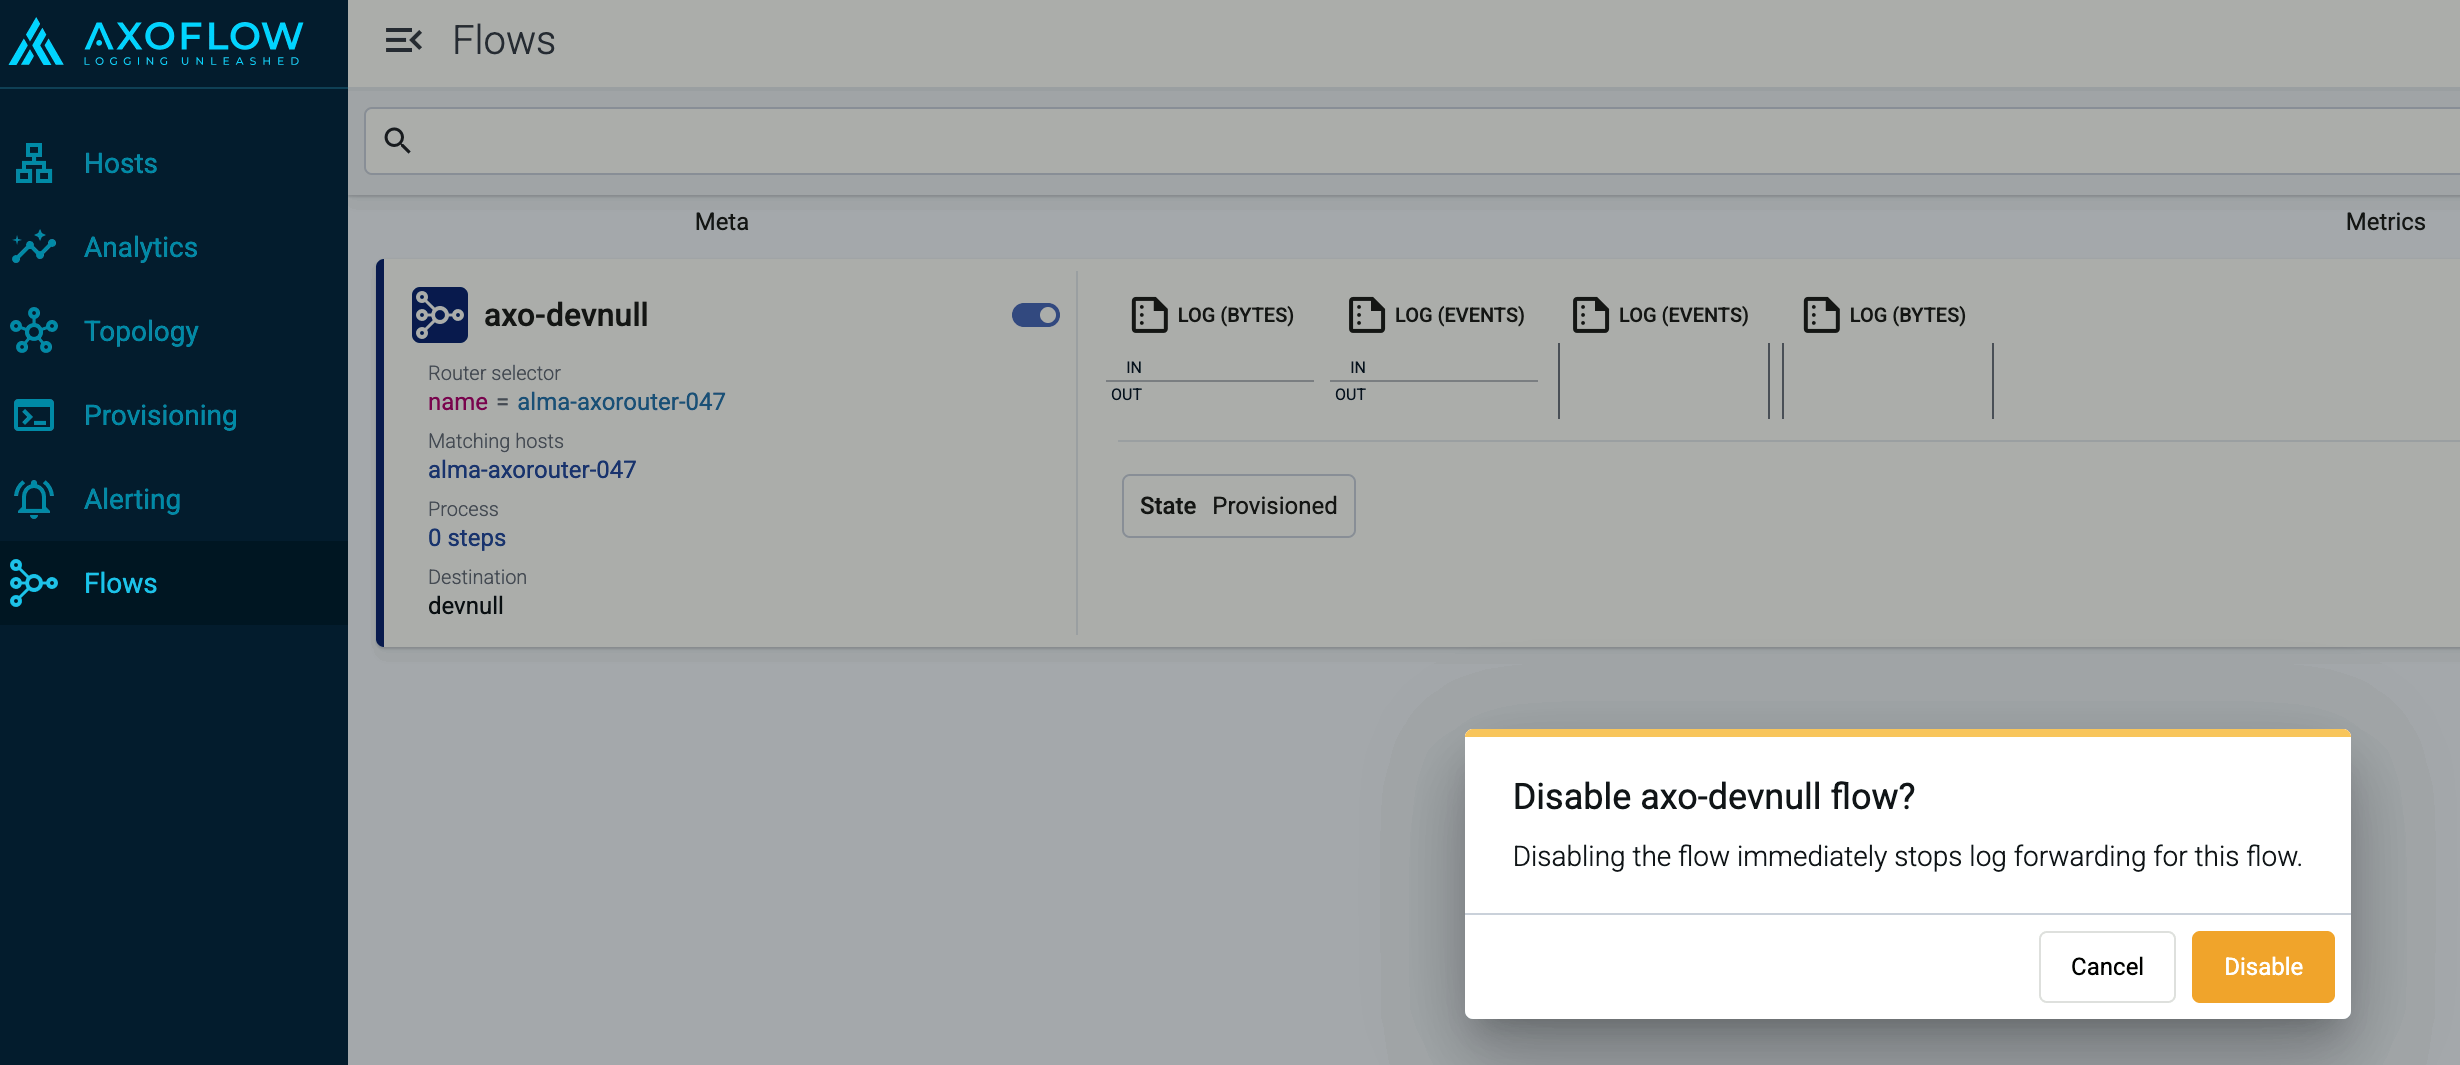
3 - Processing steps
Flows can include a list of processing steps to select and transform the messages. All log messages received by the routers of the flow are fed into the pipeline constructed from the processing steps, then the filtered and processed messages are forwarded to the specified destination.
CAUTION:
Processing steps are executed in the order they appear in the flow. Make sure to arrange the steps in the proper order to avoid problems.To add processing steps to an existing flow, complete the following steps.
-
Open the Flows page and select the flow you want to modify.
-
Select Process > Add new Processing Step.
-
Select the type of the processing step to add.
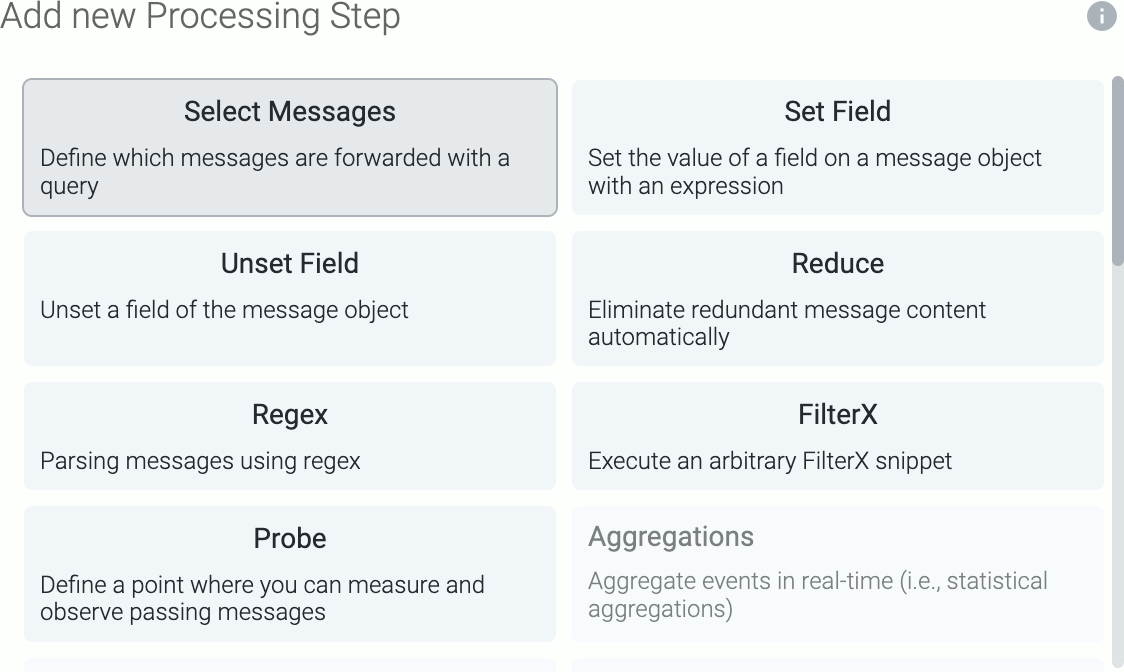
The following types of processing steps are available:
- Classify: Automatically classify the data and assign vendor, product, and service labels. This step (or its equivalent in the Connector rule) is required for the Parse and Reduce steps to work.
- FilterX: Execute an arbitrary Filterx snippet.
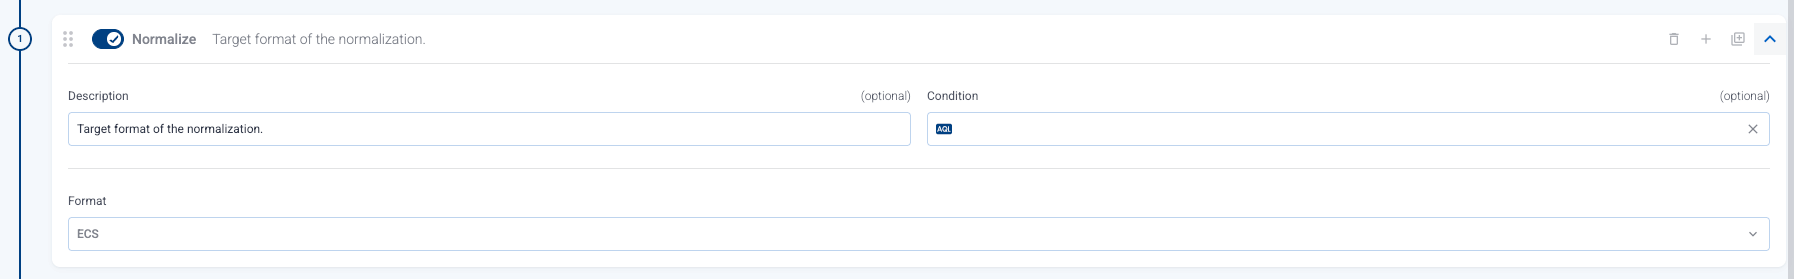
- Normalize: Normalize the data according to the specified standard: Dynatrace, Elastic Common Schema (ECS), or Open Cybersecurity Schema Framework (OCSF).
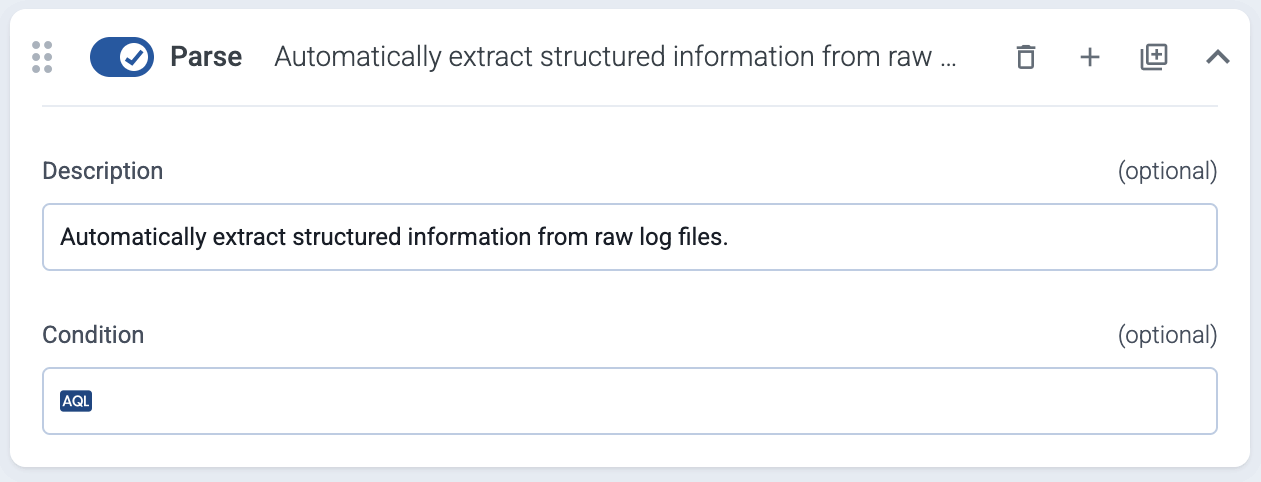
- Parse: Automatically parse the data to extract structured information from the content of the message. The Classify step (or its equivalent in the Connector rule) is required for the Parse step to work.
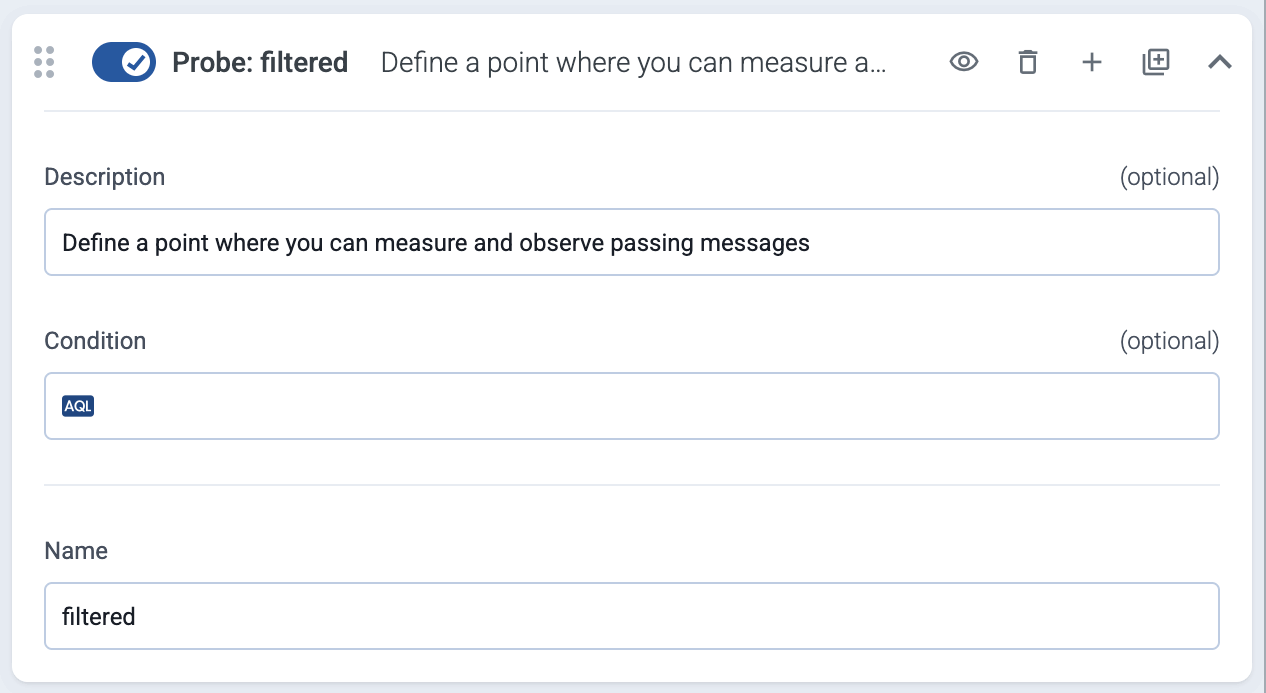
- Probe: A measurement point that provides metrics about the throughput of the flow.
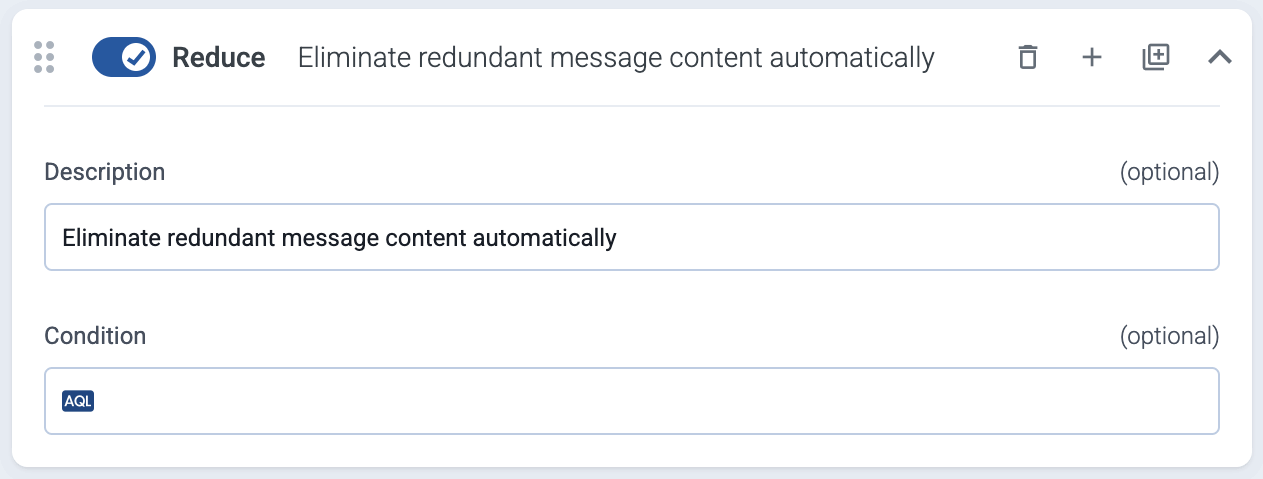
- Reduce: Automatically remove redundant content from the messages. The Classify and Parse steps (or their equivalent in the Connector rule) are required for the Reduce step to work.
- Regex: Execute a regular expression on the message.
- Select Messages: Filter the messages using a query. Only the matching messages will be processed in subsequent steps.
- Set Fields: Set the value of one or more fields on the message object.
- Unset Field: Unset the specified field of the message object.
-
Configure the processing step as needed for your environment.
-
(Optional) To apply the processing step only to specific messages from the flow, set the Condition field of the step. Conditions act as filters, but apply only to this step. Messages that don’t match the condition will be processed by the subsequent steps. For details about the message schema and the available fields, see Message schema reference.
Conditions use AQL queries, making complex filtering possible, using the Equals, Contains (partial match), and Match (regular expression match) operators. Note that:
- AxoConsole autocompletes the built-in and custom labels and field names, as well as their most frequent values, but doesn’t autocomplete labels and variables created by data parsing and processing steps. See the Message schema for details.
- You can use the AND and OR operators to combine expressions, and also parenthesis if needed.
-
(Optional) If needed, drag-and-drop the step to change its location in the flow.
-
Select Save.
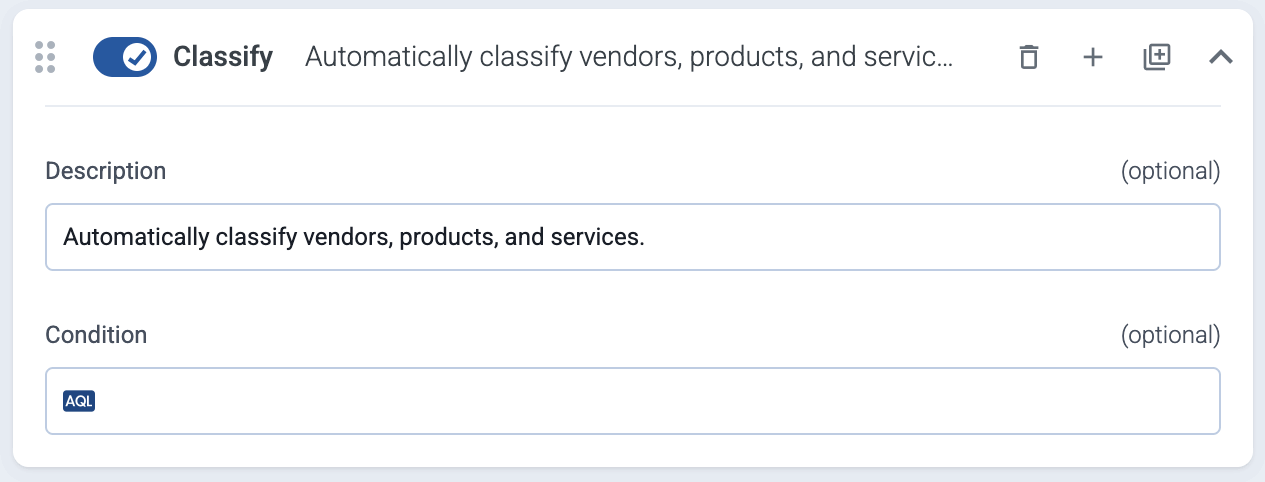
Classify
Automatically classify the data and assign vendor, product, and service labels. This step (or its equivalent in the Connector rule) is a prerequisite for the Parse and Reduce steps, and must be executed before them. AxoRouter can parse data from the supported data sources. If your source is not listed, contact us.
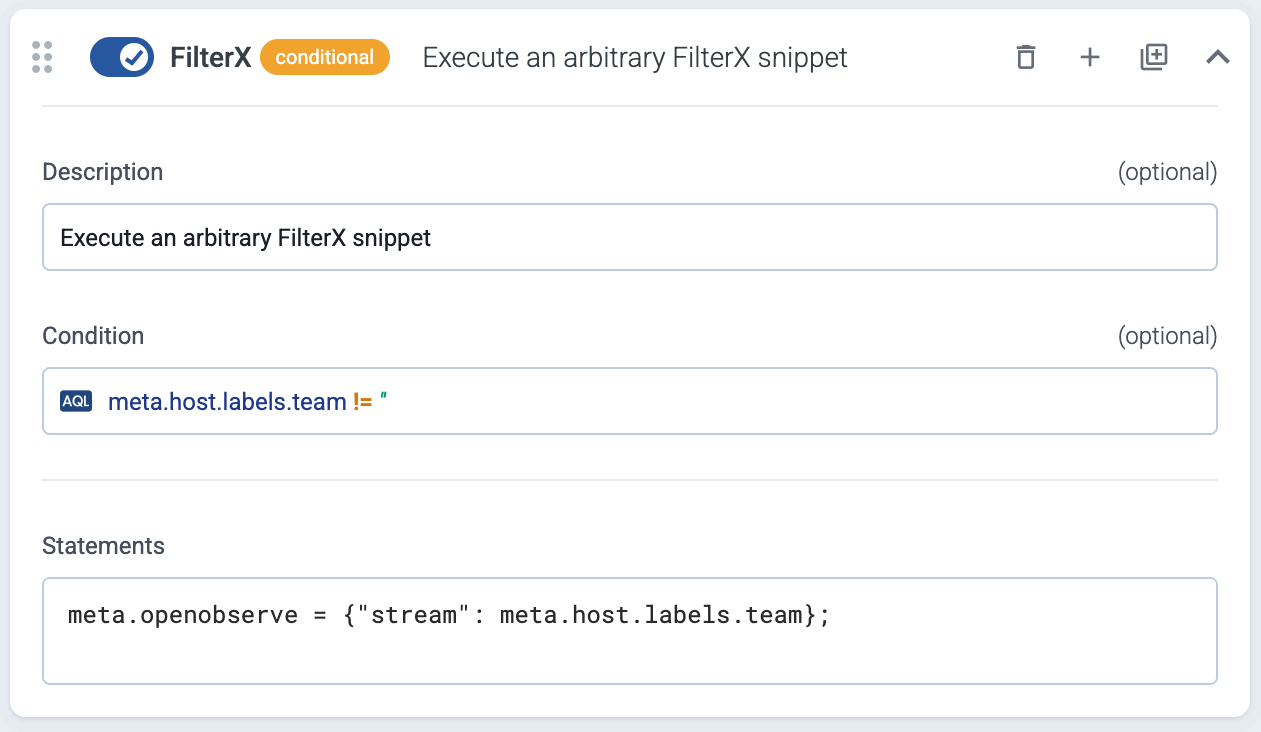
FilterX
Execute an arbitrary FilterX snippet. The following example checks if the meta.host.labels.team field exists, and sets the meta.openobserve variable to a JSON value that contains stream as a key with the value of the meta.host.labels.team field.
Normalize
Prerequisite: It’s recommended to enable the Classify step (or its equivalent in the Connector rule) when using the Normalize step. Normalization implicitly performs the Parse step as well.
The Normalize step reformats the content of the message to the selected normalization scheme. The following normalization schemas are supported:
Parse
Prerequisite: The Classify step (or its equivalent in the Connector rule) is required for the Parse step to work.
The Parse step automatically parses the data from the content of the message, and replaces the message content (the log.body field in the internal message schema) with the structured information. AxoRouter can parse data from the supported data sources. If your source is not listed, contact us. Alternatively, you can create your own parser using FilterX processing steps.
For example, if the message content is in the Common Event Format (CEF), AxoRouter creates a structured FilterX dictionary from its content, like this:
CEF:0|KasperskyLab|SecurityCenter|13.2.0.1511|KLPRCI_TaskState|Completed successfully|1|foo=foo bar=bar baz=test
Parsed and structured content:
{
"version":"0",
"device_vendor":"KasperskyLab",
"device_product":"SecurityCenter",
"device_version":"13.2.0.1511",
"device_event_class_id":"KLPRCI_TaskState",
"name":"Completed successfully",
"agent_severity":"1",
"foo":"foo=bar",
"bar":"bar=baz",
"baz":"test"
}
By default, messages that aren’t successfully parsed are forwarded to the next processing step of the flow. If you want to discard such messages instead, enable the Drop unparseable messages option.
Probe
Set a measurement point that provides metrics about the throughput of the flow. Note that you can’t name your probes input and output, as these are reserved.
For details, see Flow metrics.
Reduce
Prerequisite: The Classify and Parse steps (or their equivalent in the Connector rule) are required for the Reduce step to work.
The Reduce step automatically removes redundant content from the messages.
- If you want to keep certain fields unchanged, use the Keep fields field. For details on the message fields, see Message schema.
- To see what changed in a message, add a Probe processing step before and after the reduce step, then use Flow tapping
For details on how data reduction works, see Classify and reduce security data.
Regex
Use a regular expression to process the message.
-
Input is an AxoSyslog template string, for example,
${MESSAGE}that the regular expression will be matched with. -
Pattern is a Perl Compatible Regular Expression (PCRE). If you want to match the pattern to the whole string, use the
^and$anchors at the beginning and end of the pattern.You can use https://regex101.com/ with the ECMAScript flavor to validate your regex patterns. (When denoting named capture groups,
?Pis not supported, use?.)
Named or anonymous capture groups denote the parts of the pattern that will be extracted to the Field field. Named capture groups can be specified like (?<group_name>pattern), which will be available as field_name["group_name"]. Anonymous capture groups will be numbered, for example, the second group from (first.*) (bar|BAR) will be available as field_name["2"]. When specifying variables, note the following points:
-
If you want to include the results in the outgoing message or in its metadata for other processing steps, you must:
- Reference an existing variable or field. This field will be updated with the matches.
- For new variables, use names for the variables that start with the
$character, or - declare them explicitly. For details, see the FilterX data model in the AxoSyslog documentation.
-
The field will be set to an empty dictionary (
{}) when the pattern doesn’t match. For details about the message schema and the available fields, see Message schema reference.
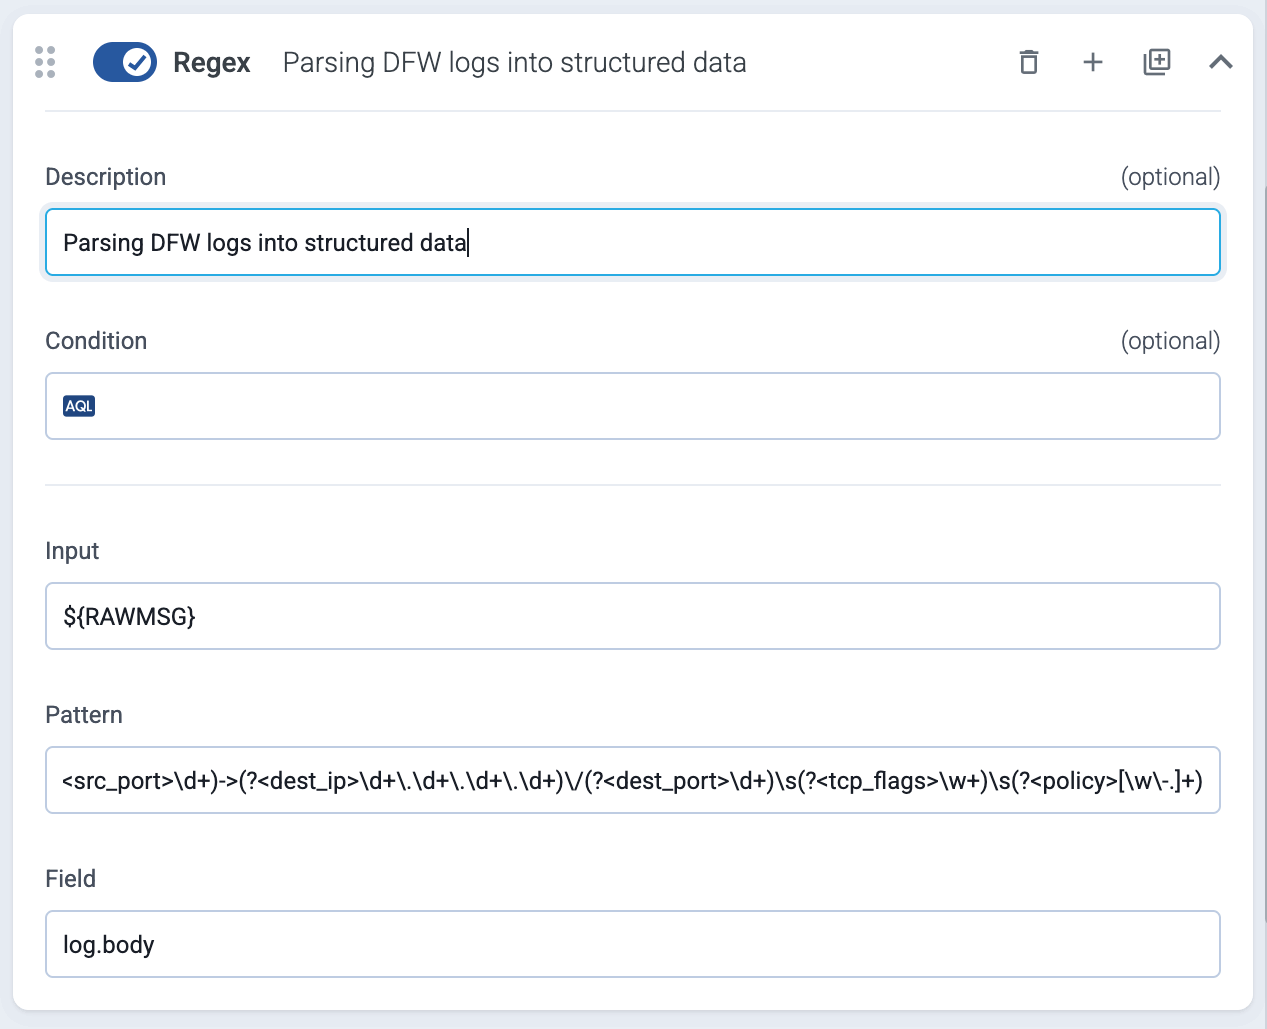
For example, the following processing step parses an unclassified log message from a firewall into a structured format in the log.body field:
-
Input:
${RAWMSG} -
Pattern:
^(?<priority><\d+>)(?<version>\d+)\s(?<timestamp>[\d\-T:.Z]+)\s(?<hostname>[\w\-.]+)\s(?<appname>[\w\-]+)\s(?<event_id>\d+|\-)\s(?<msgid>\-)\s(?<unused>\-)\s(?<rule_id>[\w\d]+)\s(?<network>\w+)\s(?<action>\w+)\s(?<result>\w+)\s(?<rule_seq>\d+)\s(?<direction>\w+)\s(?<length>\d+)\s(?<protocol>\w+)\s(?<src_ip>\d+\.\d+\.\d+\.\d+)\/(?<src_port>\d+)->(?<dest_ip>\d+\.\d+\.\d+\.\d+)\/(?<dest_port>\d+)\s(?<tcp_flags>\w+)\s(?<policy>[\w\-.]+) -
Field:
log.body
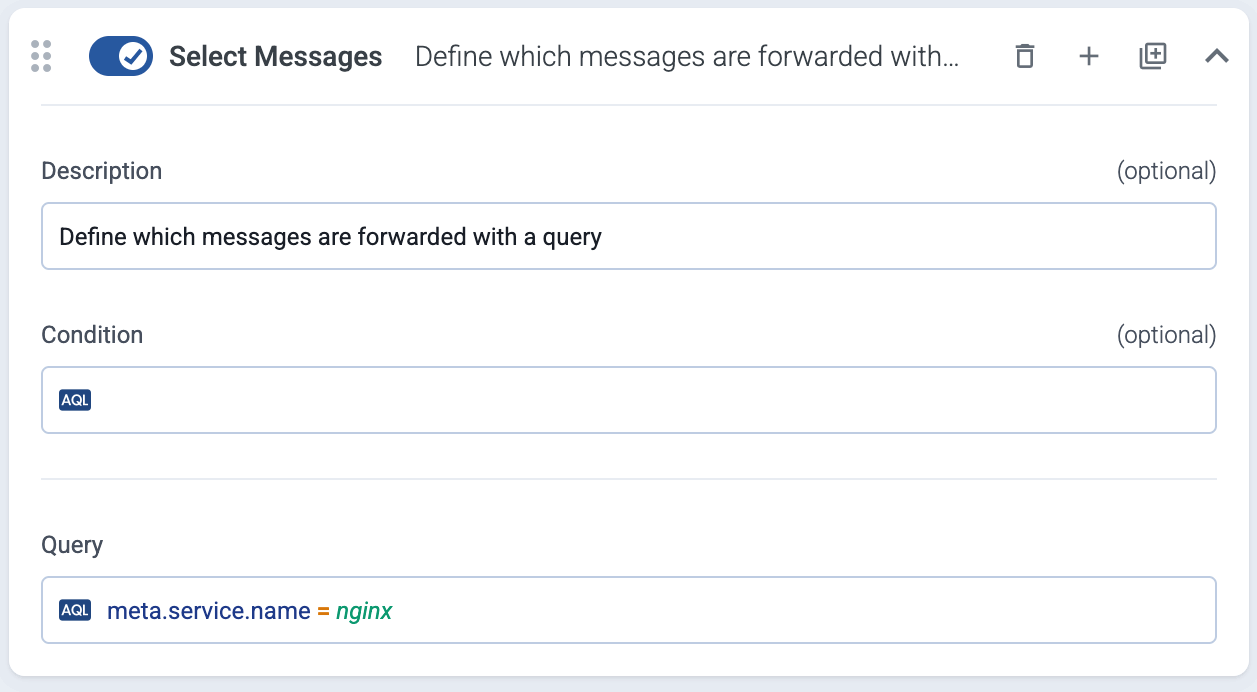
Select messages
Filter the messages using a query. Only the matching messages will be processed in subsequent steps.
The following example selects messages that have the resource.attributes["service.name"] label set to nginx.
You can also select messages using various other metadata about the connection and the host that sent the data, the connector that received the data, the classification results, and also custom labels, for example:
- a specific connector:
meta.connector.name = axorouter-mysyslog-connector - a type of connector:
meta.connector.type = otlp - a sender IP address:
meta.connection.src_ip = 192.168.1.1 - a specific product, if classification is enabled in an earlier processing step or in the connector that received the message:
meta.product = fortigate(see Vendors for the metadata of a particular product) - a custom label you’ve added to the host:
meta.host.labels.location = eu-west-1
In addition to exact matches, you can use the following operators:
!=not equal (string match)=*contains (substring match)!*: doesn’t contain=~: matches regular expression!~: doesn’t match regular expression==~: matches case sensitive regular expression!=~: doesn’t match case sensitive regular expression
You can combine multiple expressions using the AND (+) operator. (To delete an expression, hit SHIFT+Backspace.)
Note
To check the metadata of a particular message, you can use Log tapping. The metadata associated with the event is under the Event > meta section.
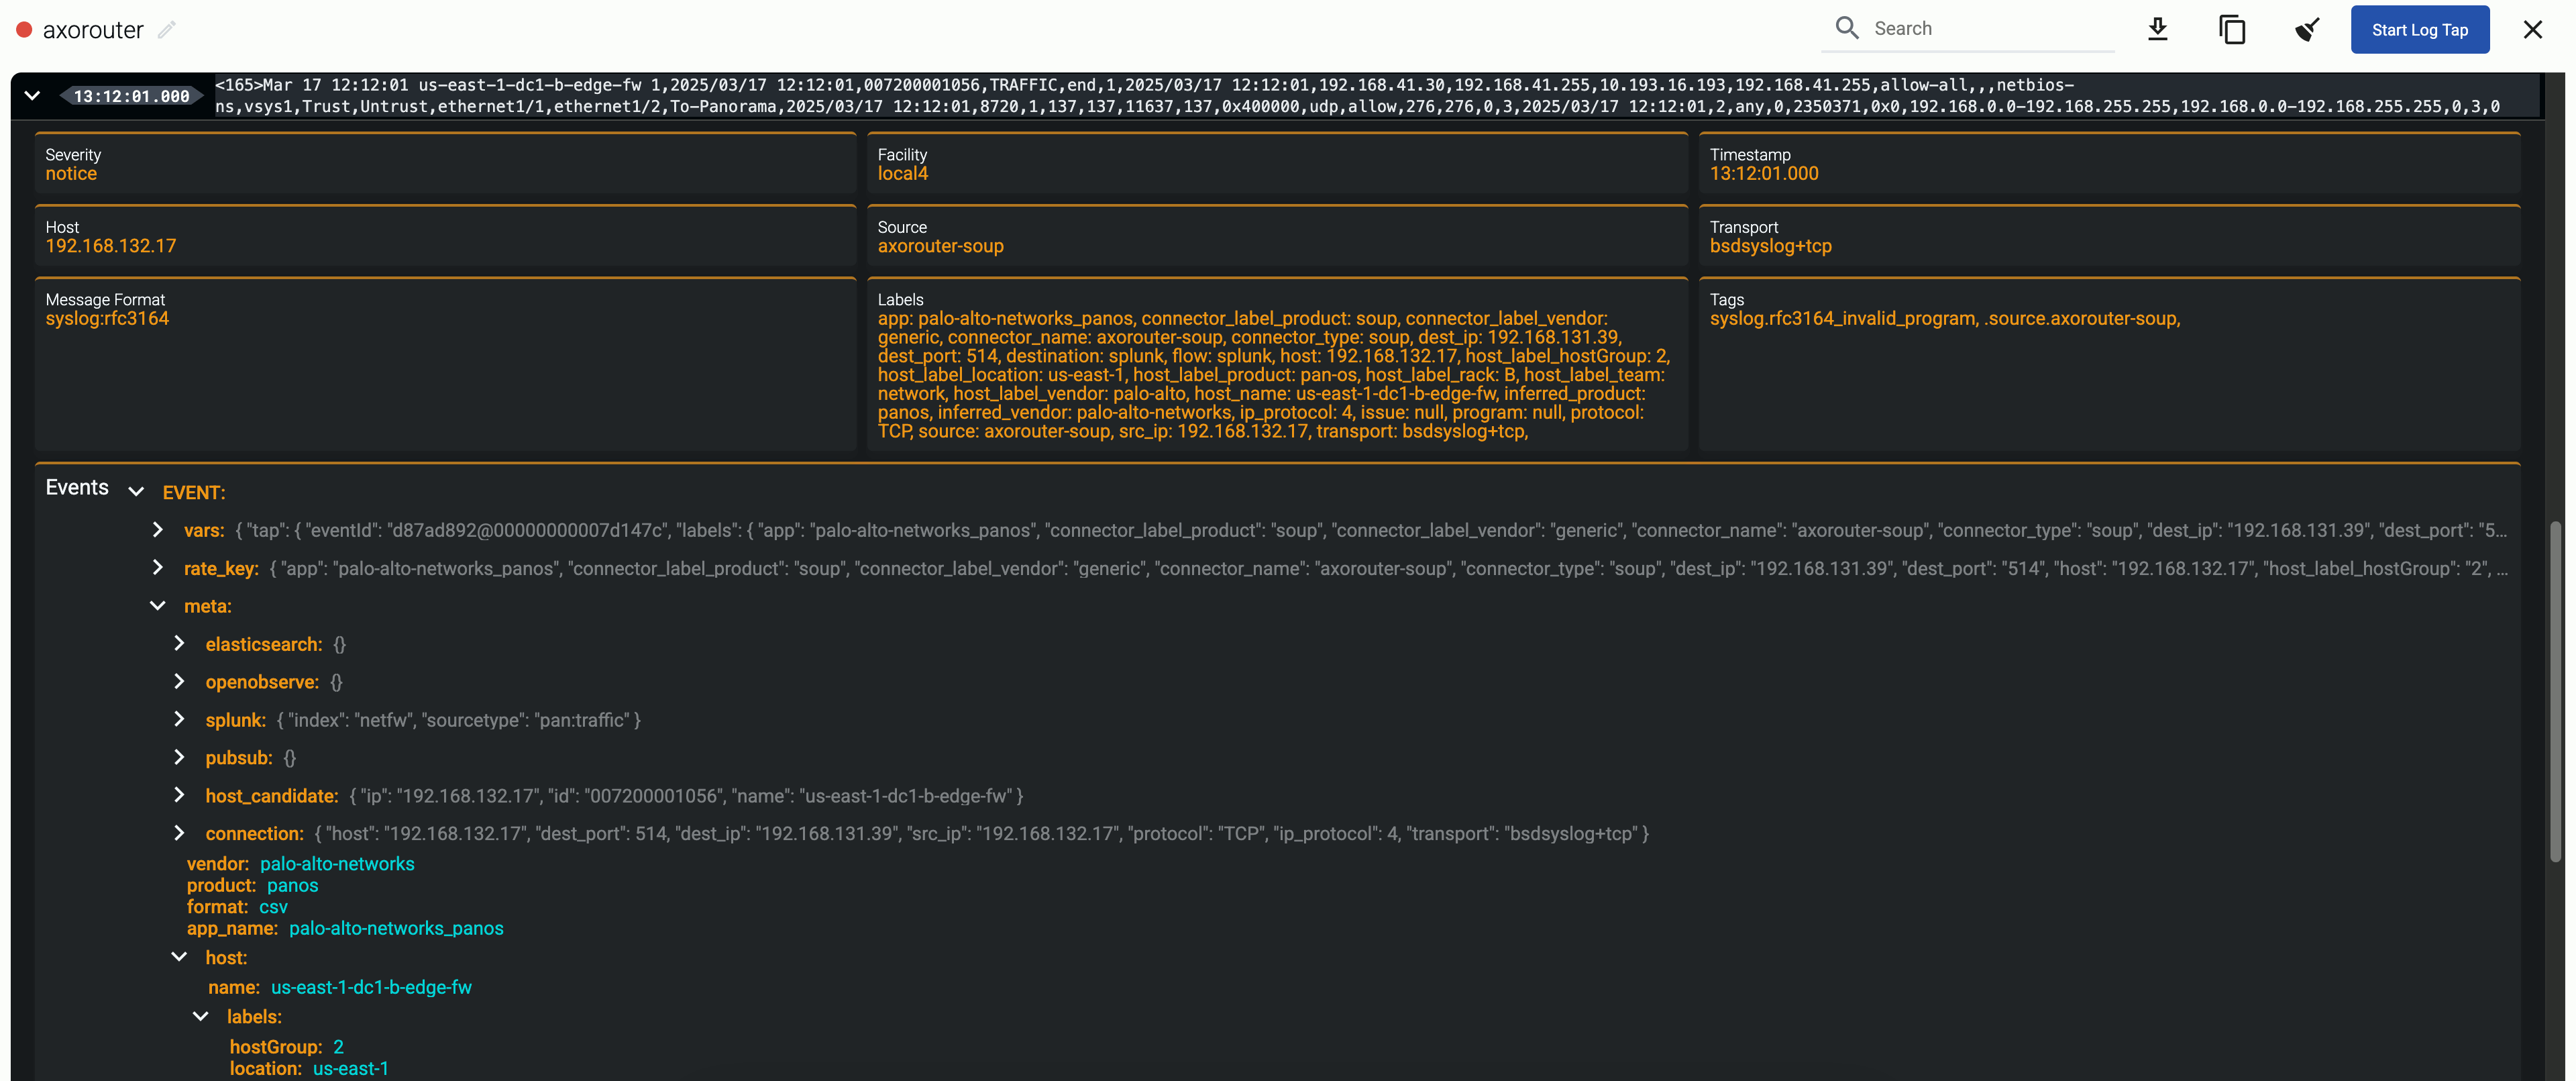
For details about the message schema and the available fields, see Message schema reference.
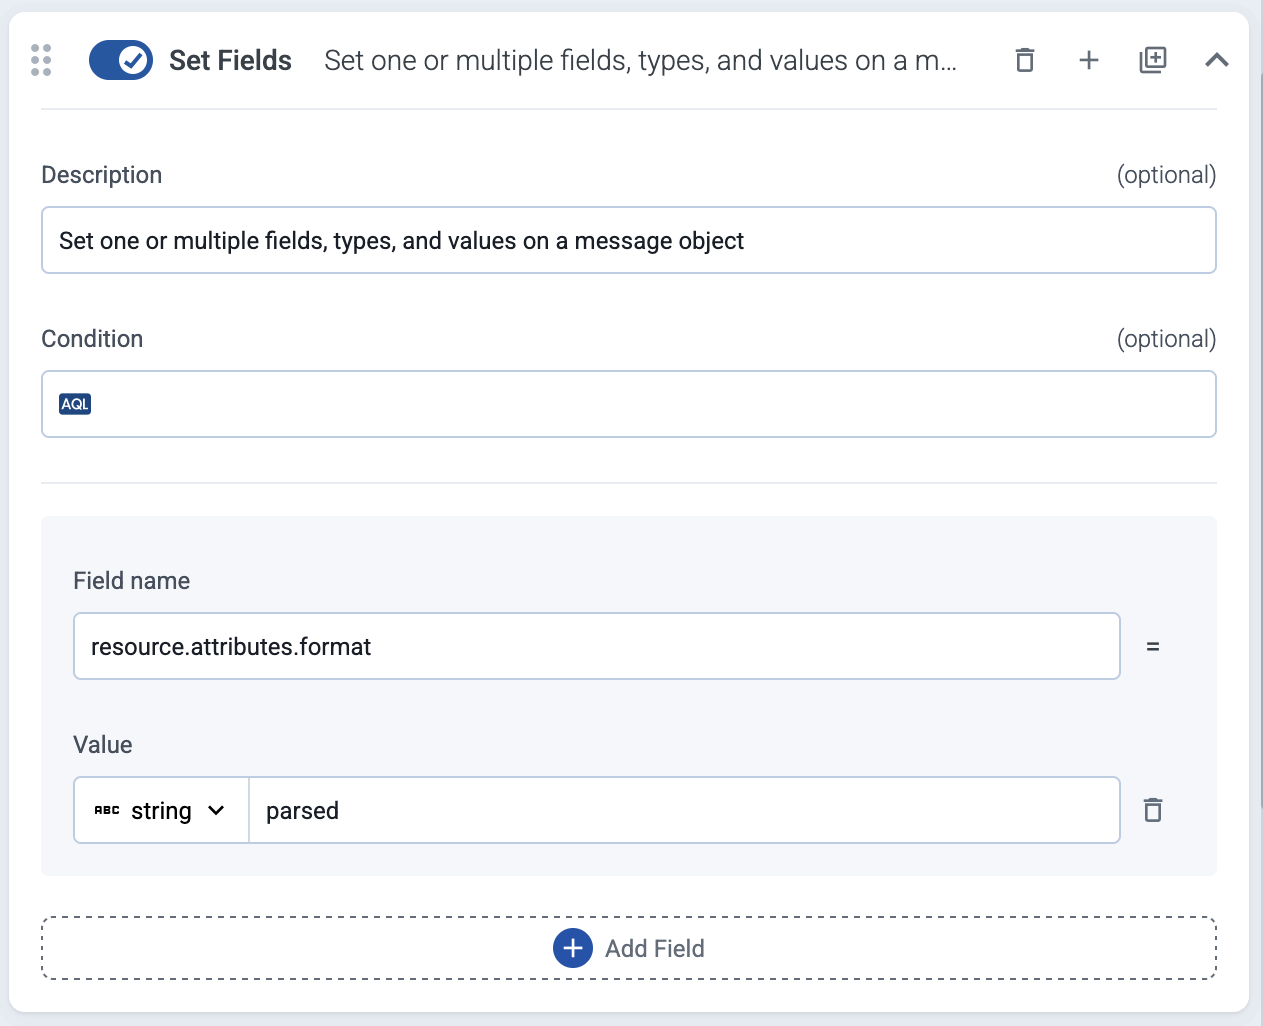
Set fields
Set specific field of the message. You can use static values, and also dynamic values that were extracted from the message automatically by Axoflow or manually in a previous processing step. If the field doesn’t exist, it’s automatically created. The following example sets the resource.attributes.format field to parsed.
The type of the field can be string, number, and expression. Select expression to use set the value of the field using a FilterX expression.
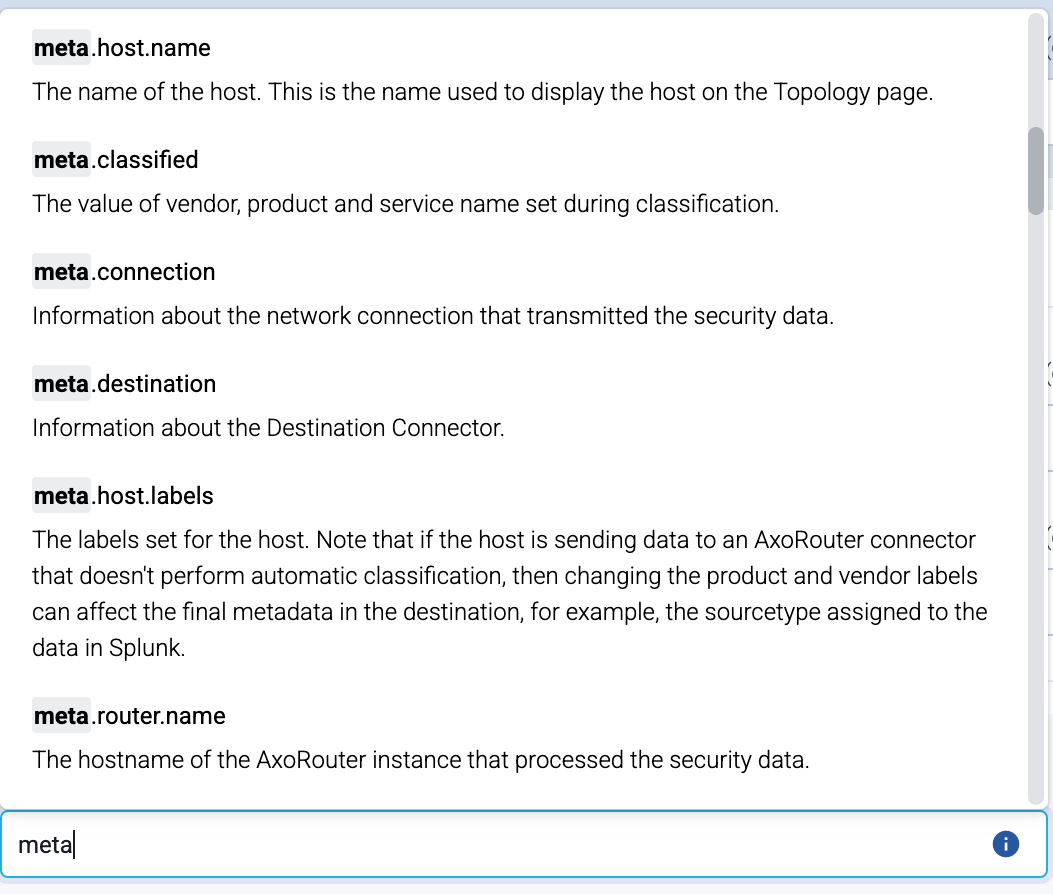
If you start typing the name of the field, the UI shows matching and similar field names:
Set destination options
If you select the Set Destination Options in the Destination step of the flow, it automatically inserts a special Set Fields processing step into the flow, that allows you to set destination-specific fields, for example, the index for a Splunk destination, or the stream name for an OpenObserve destination. You can insert this processing step multiple times if you want to set the fields to different values using conditions.
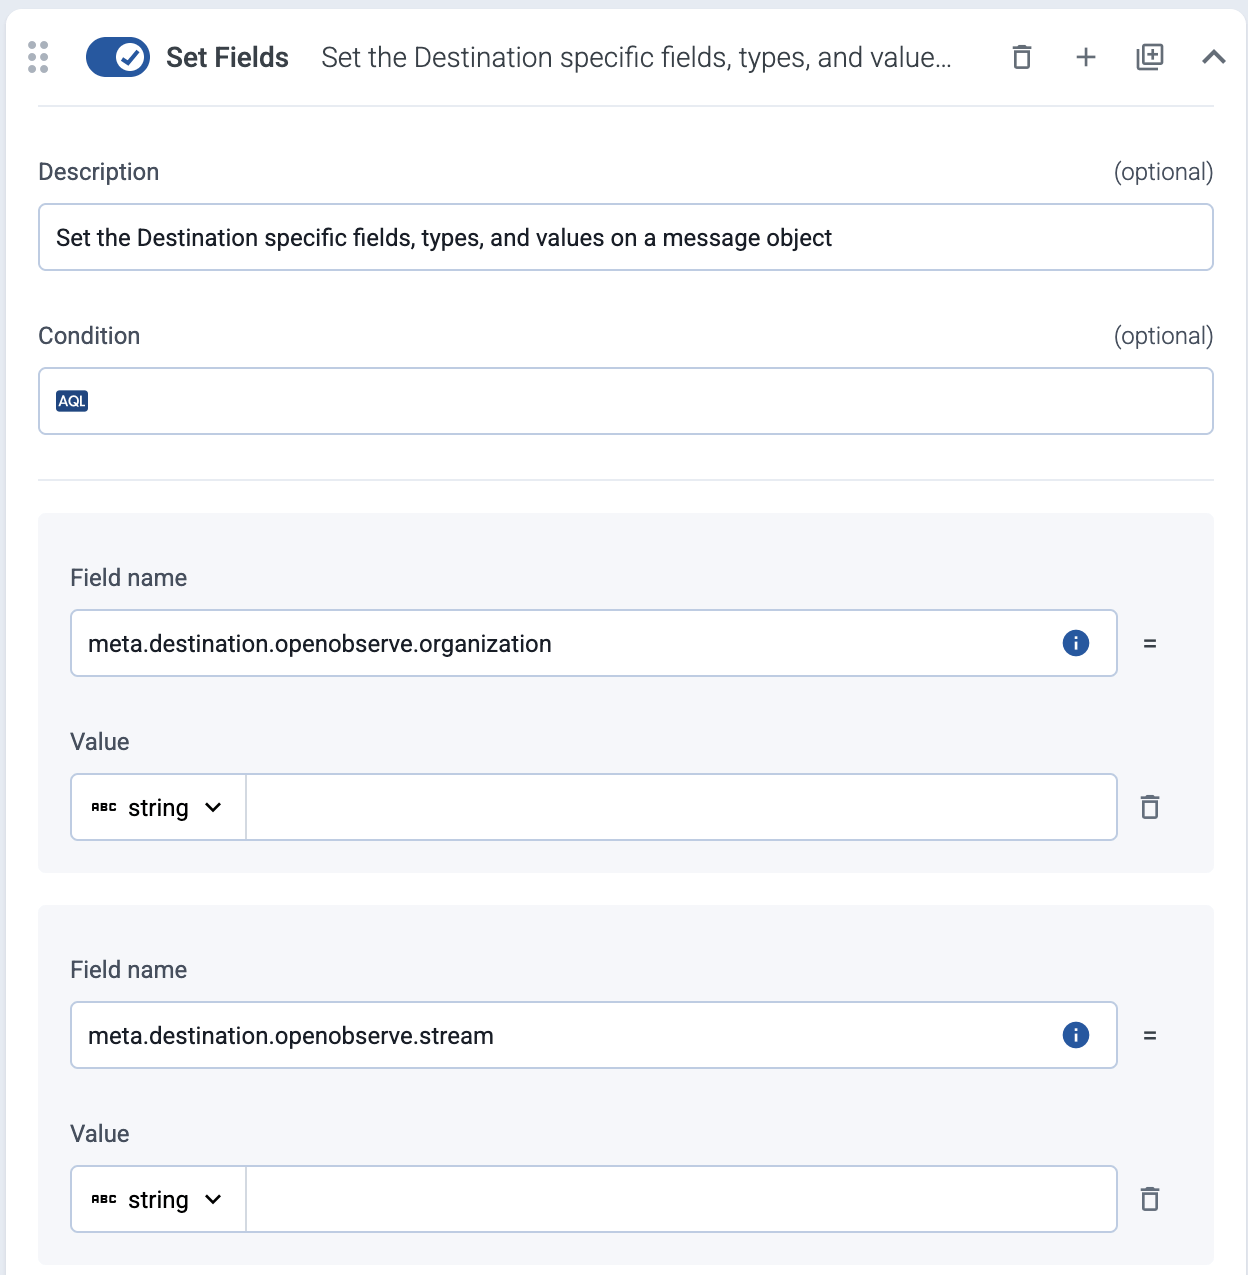
When using Set Destination Options, note the if you leave a parameter empty, AxoRouter will send it as an empty field to the destination. If you don’t want to send that field at all, delete the field.
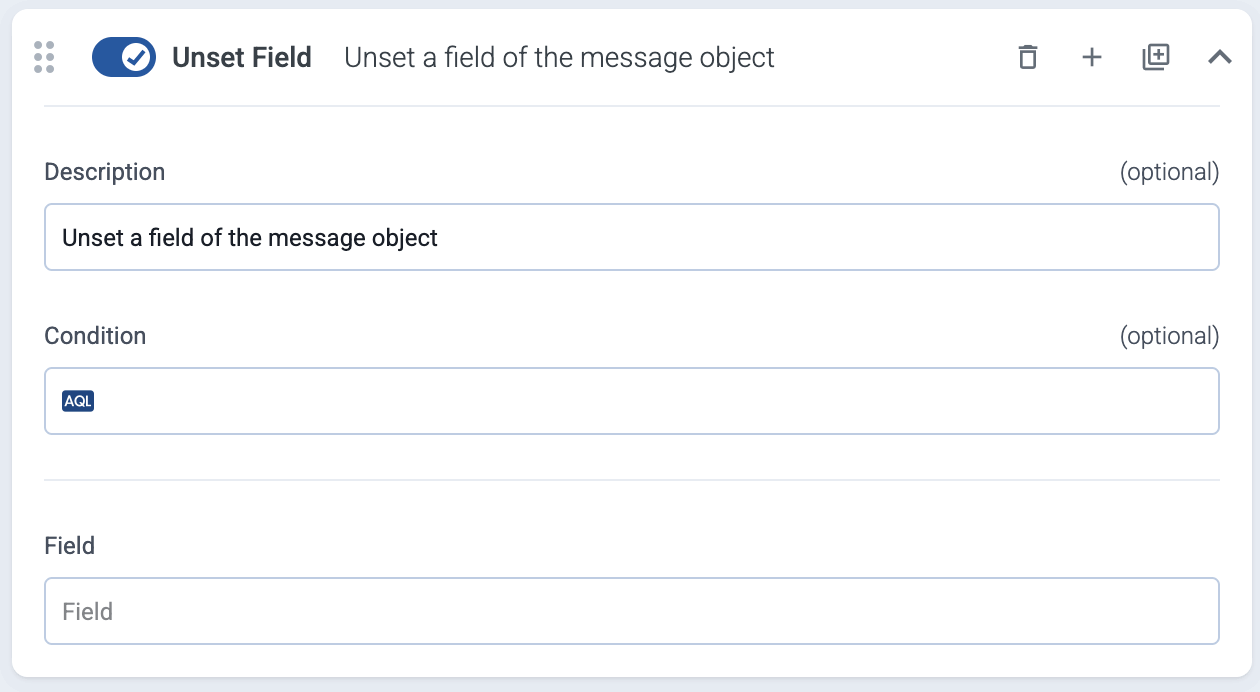
Unset field
Unset a specific field of the message.
4 - Flow metrics
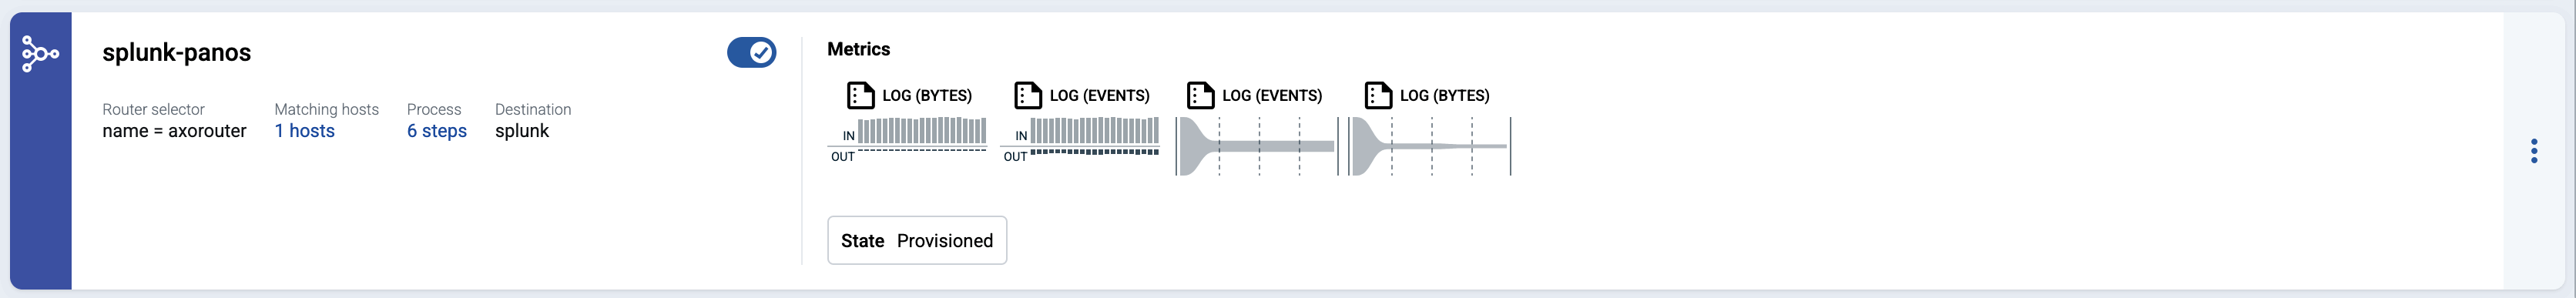
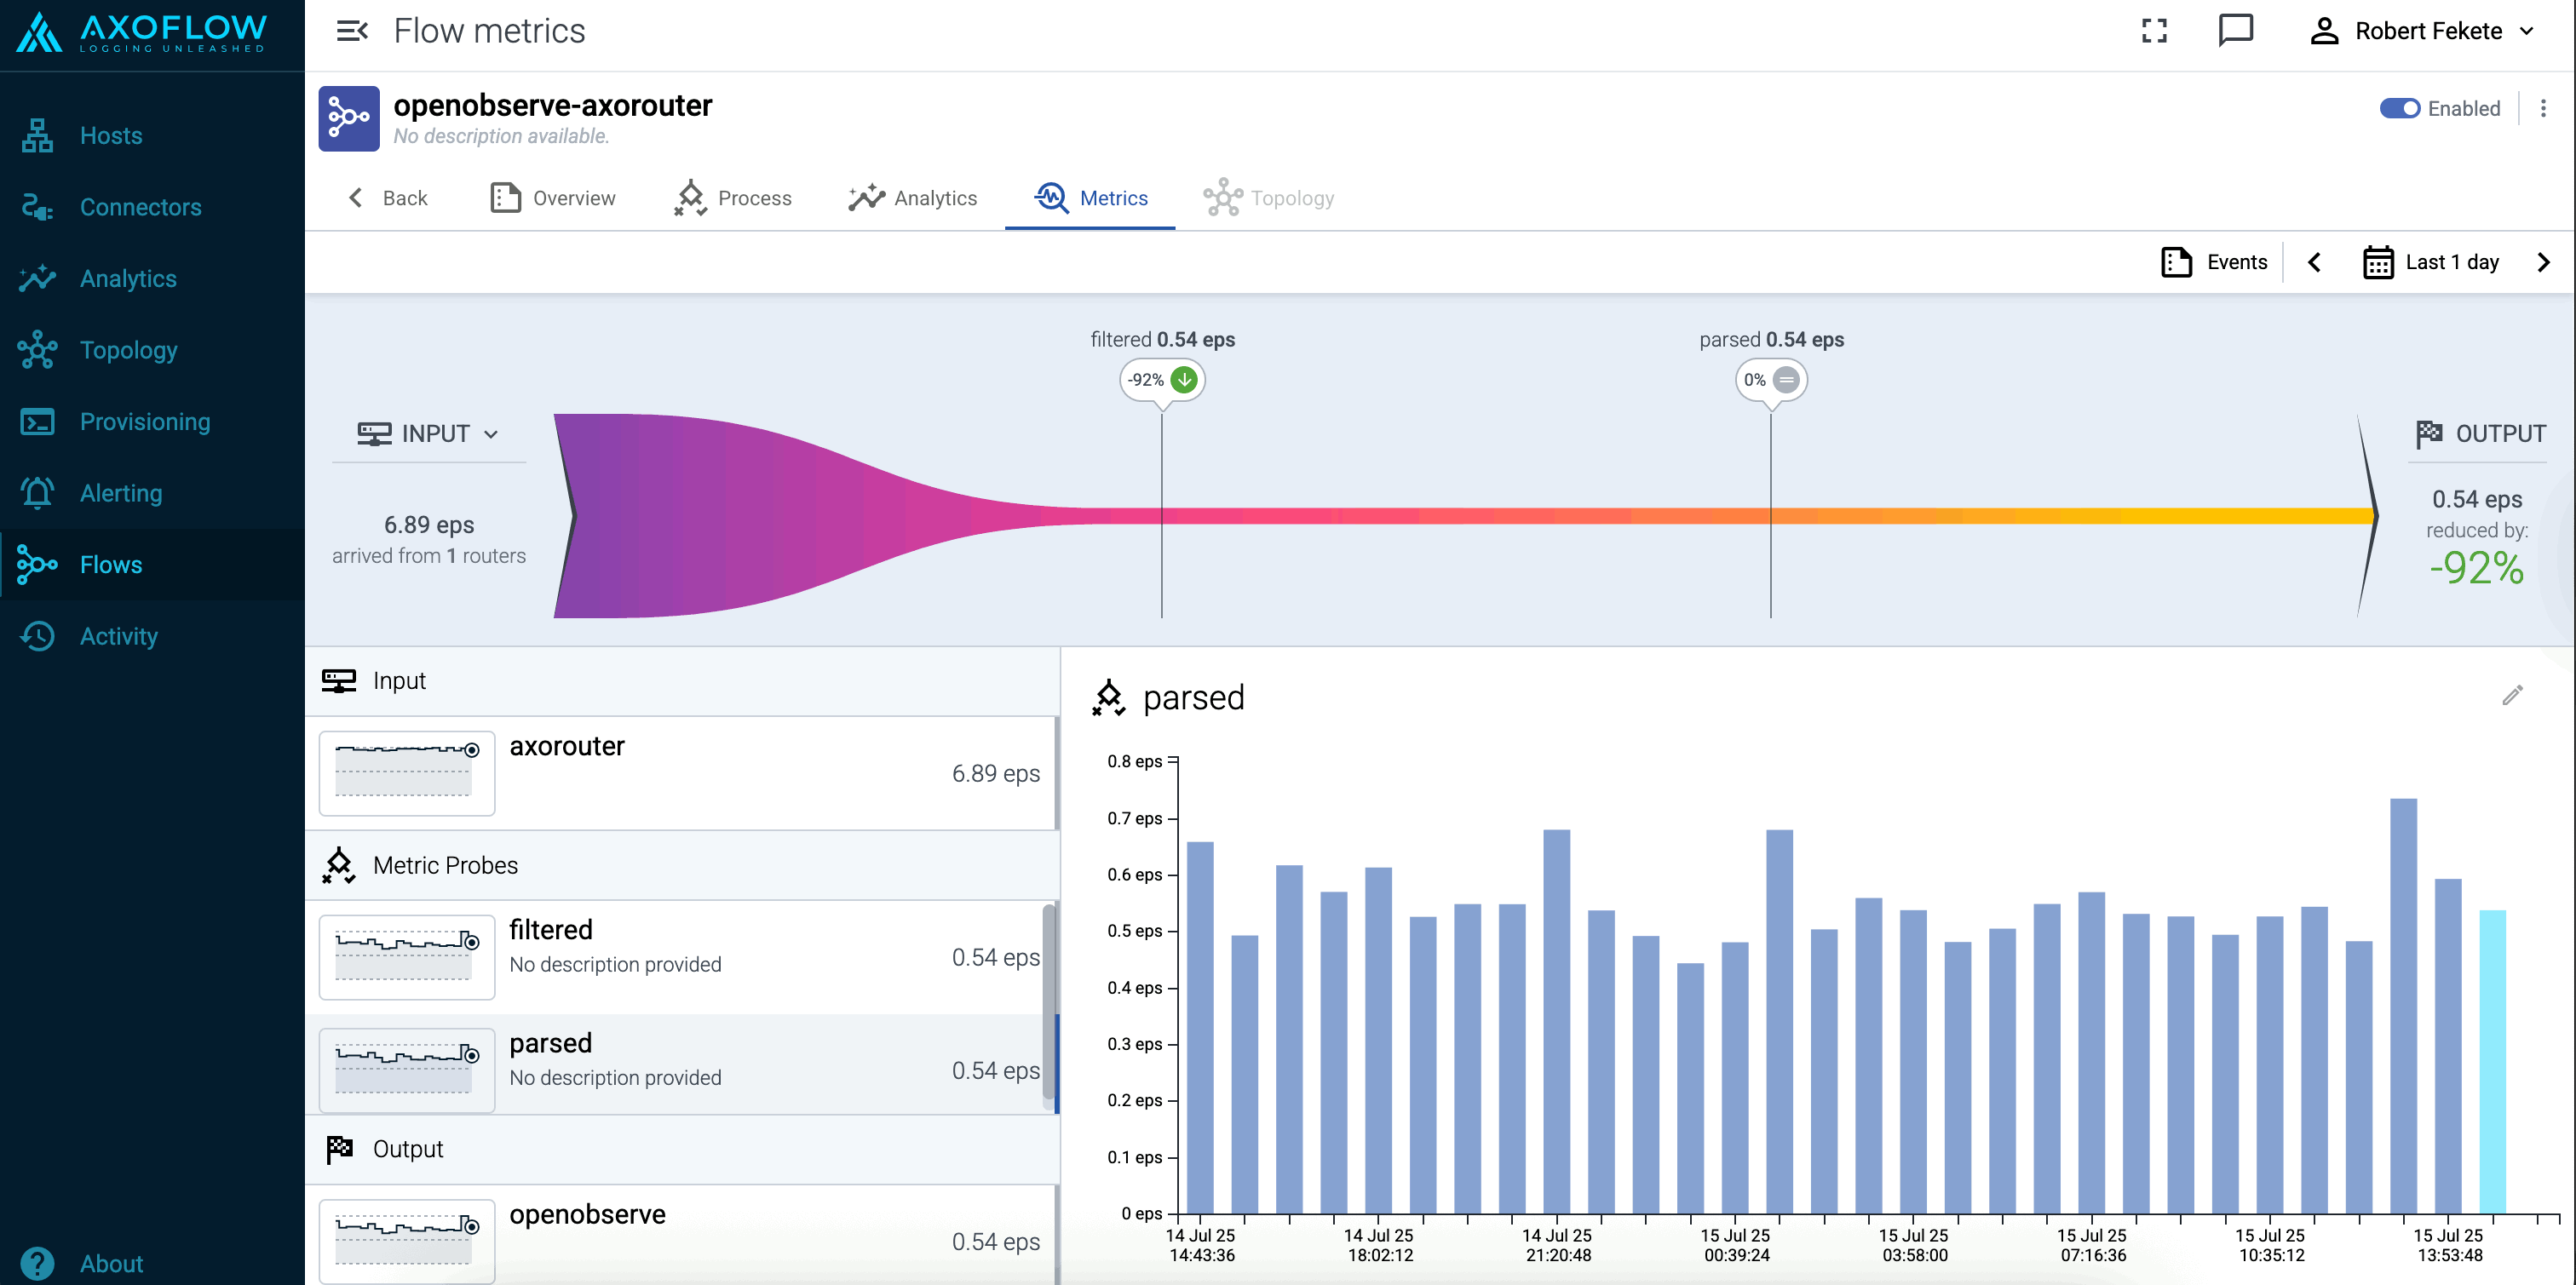
The Metrics page of a flow shows the amount of data (in events per second or bytes per second) processed by the flow. By default, the flow provides metrics for the input and the output of the flow. To get more information about the data flow, add Probe steps to the flow. For example, you can add a probe after:
- Select Messages steps to check the amount of data that match the filter, or
- Reduce steps to check the ratio of data saved.
Note
By default, Axoflow stores metrics for 30 days, unless specified otherwise in your support contract. Contact us if you want to increase the data retention time.
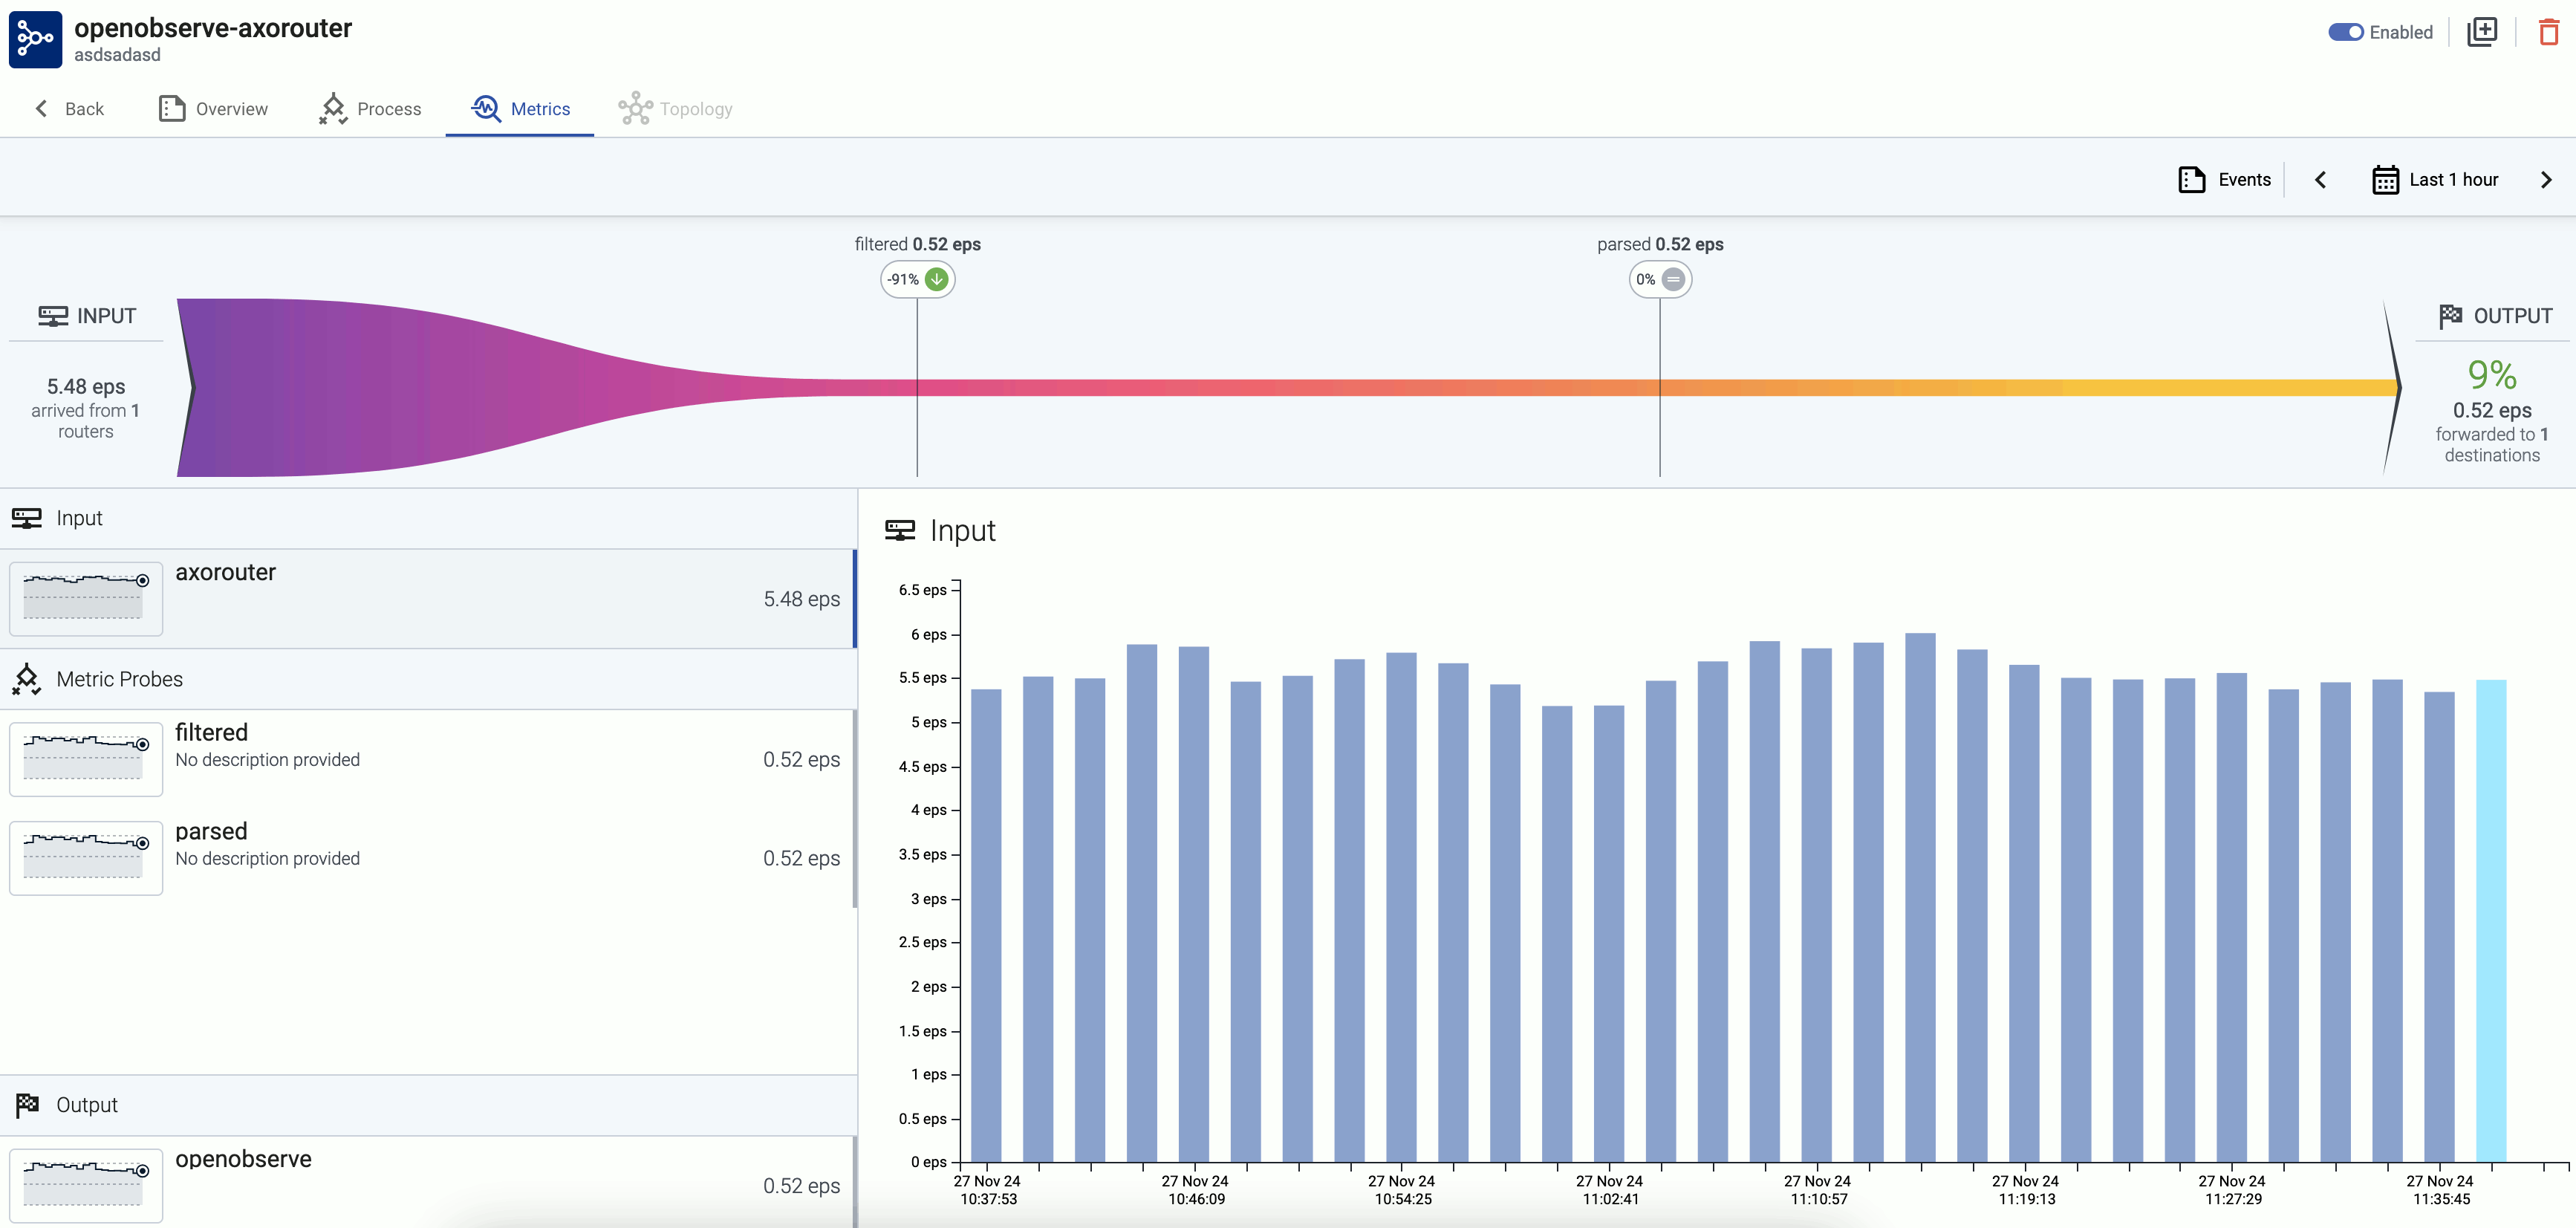
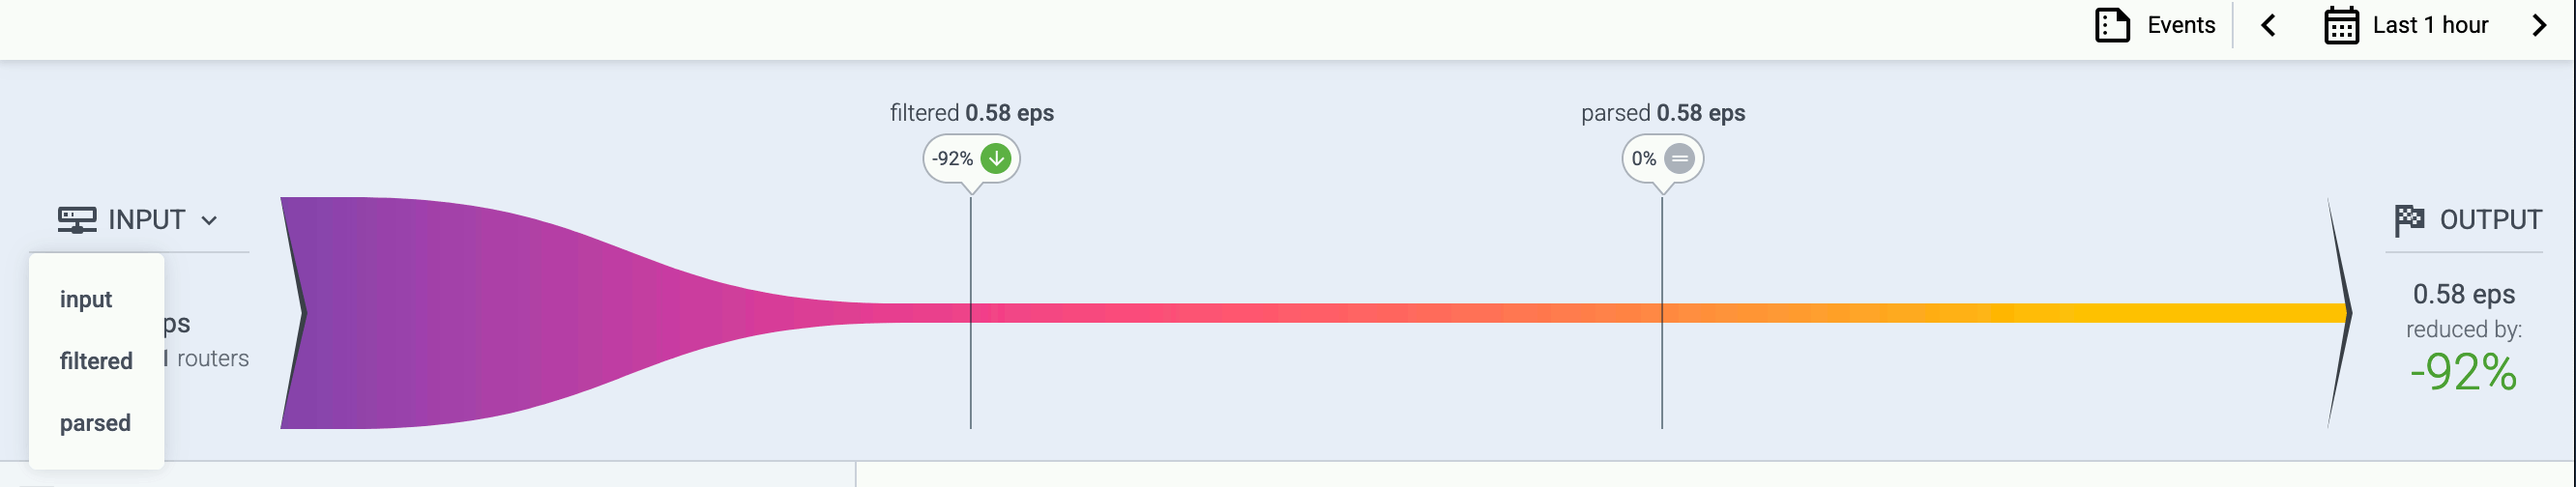
The top of the page is a funnel graph that shows the amount of data (in events/sec or bytes/sec) processed at each probe of the flow. To show the funnel graph between a probe and the output, click the INPUT field on the left of the funnel graph and select a probe. That way you can display a diagram that starts at a probe (for example, after the initial Select Messages step of the flow) and shows all subsequent probes. Note that OUTPUT on the right of the funnel graph shows the relative amount of data at the output compared to the input. This value refers to the entire flow, it’s not affected by selecting a probe for the funnel graph.
The bottom part of the page shows how the amount of data processed by a probe (by default, the input probe) changed over time. Click the name of a probe on the left to show the metrics of a different probe. Click on the timeline to show the input-probe-output states corresponding to the selected timestamp. Clicking the timeline updates the funnel graph as well. You can adjust the time range in the filter bar at the top.
You can adjust the data displayed using the filter bar:
-
Time period: Select the icon to change the time period that’s displayed on the charts. You can use absolute (calendar) time, or relative time (for example, the last 2 days).
Axoflow stores all dates in Coordinated Universal Time (UTC), and automatically converts it to the timezone of set in your browser/operating system.
- Data unit: Select the icon to change the data unit displayed on the charts (events/second or bytes/second).
-
The settings of the filter bar change the URL parameters of the page, so you can bookmark it, or share a specific view by sharing the URL.
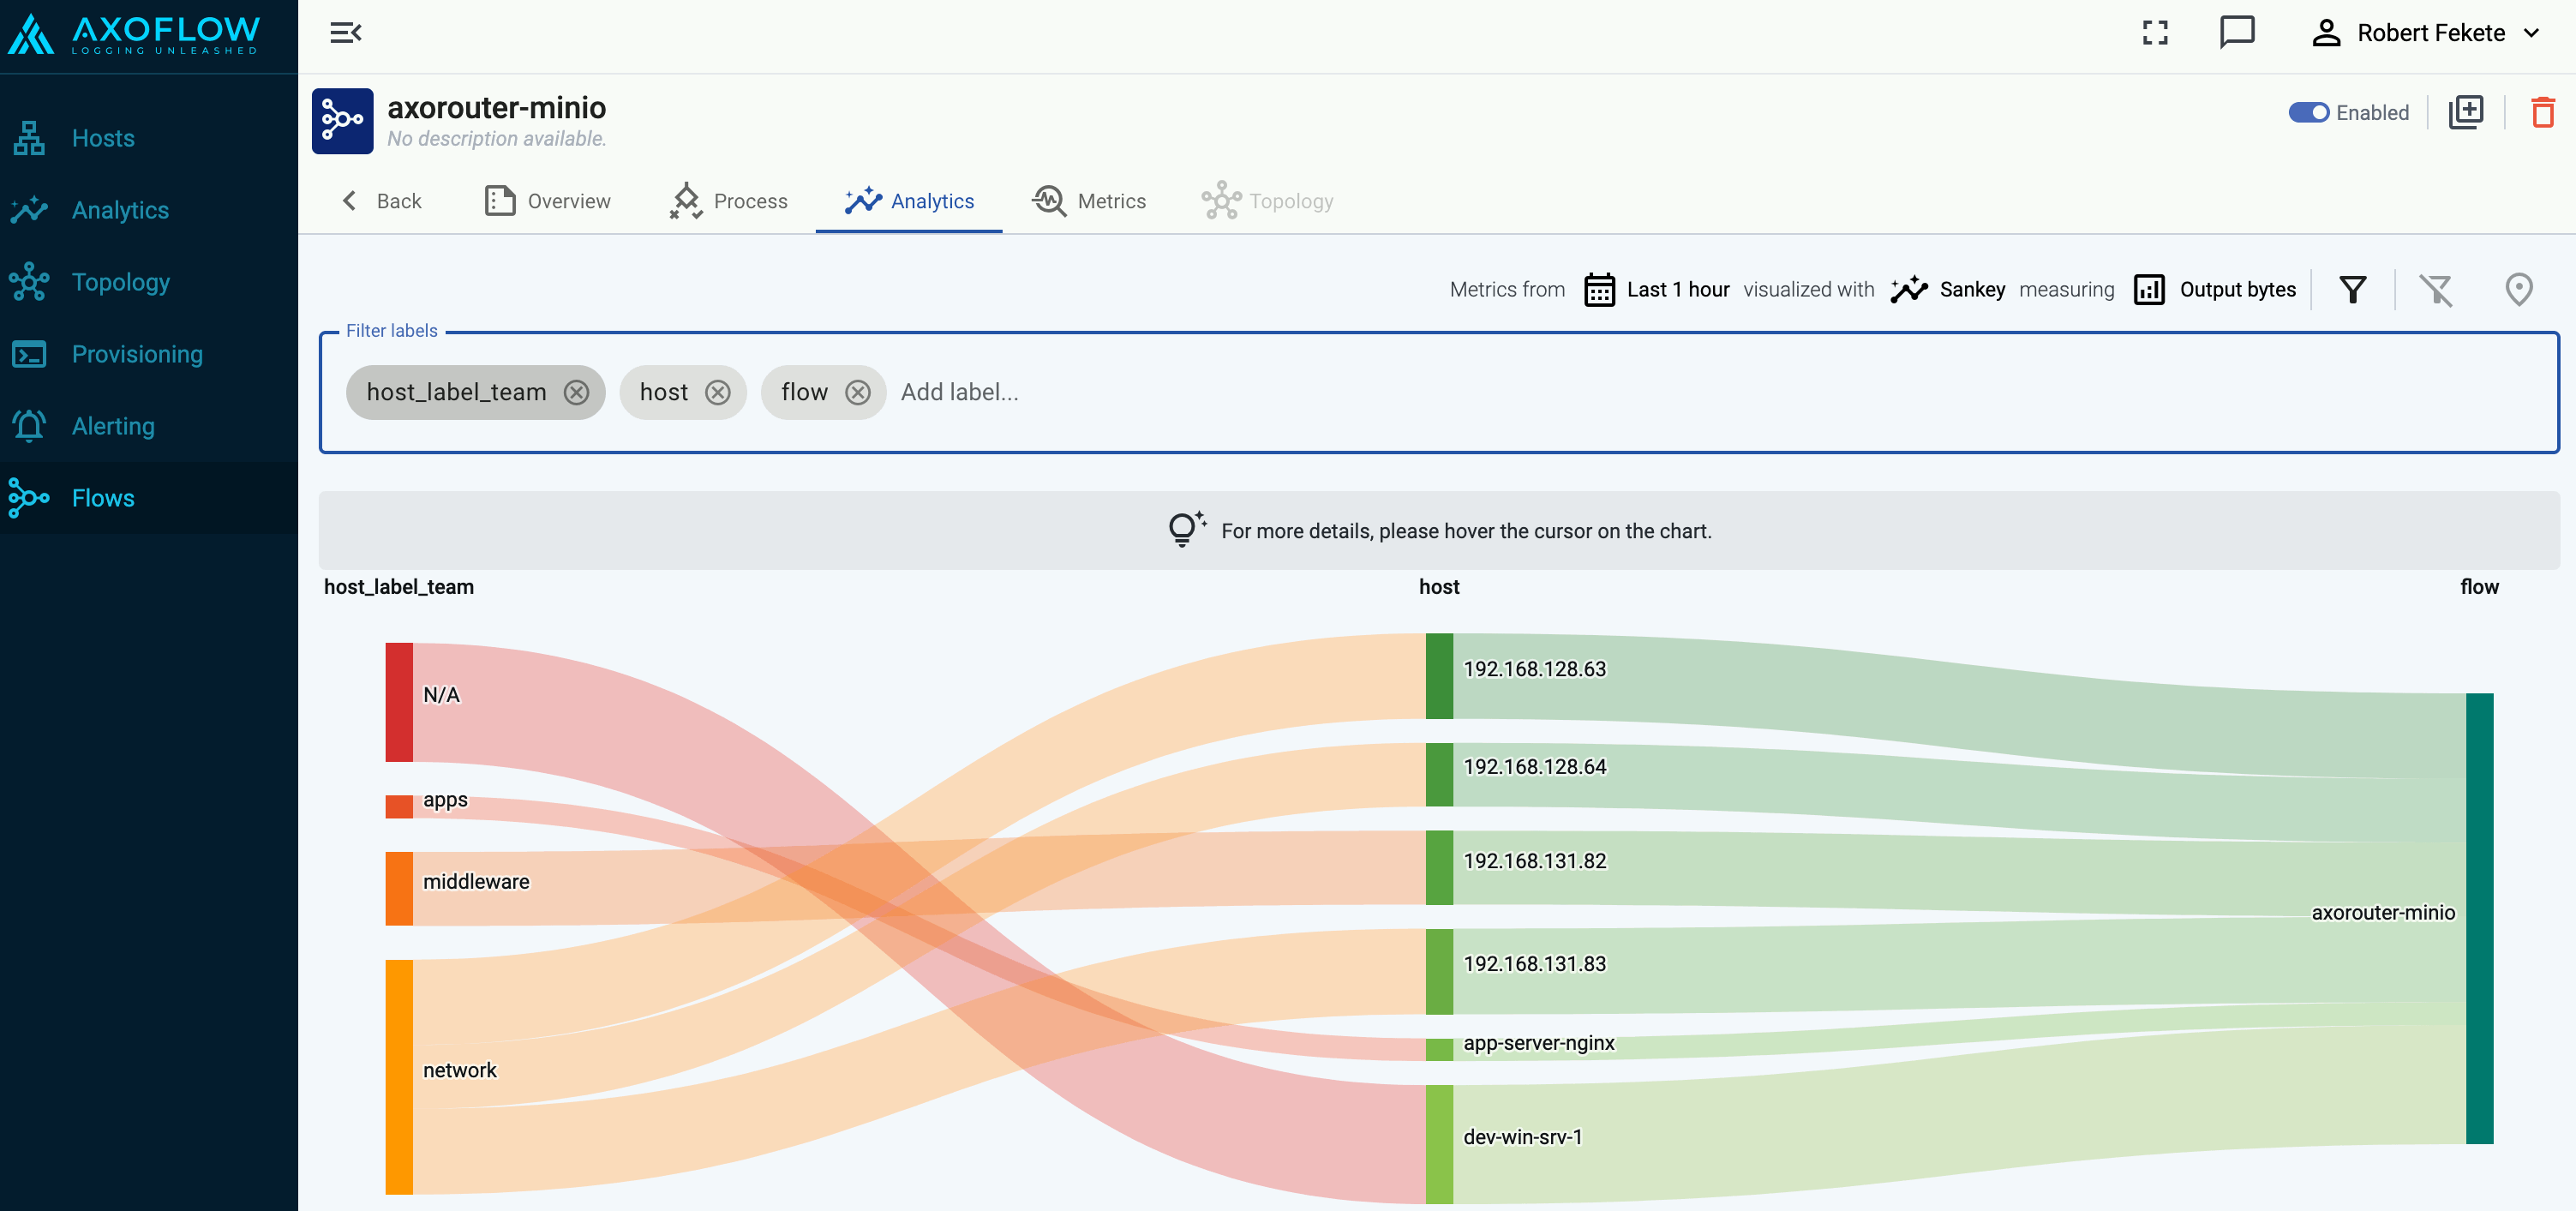
5 - Flow analytics
The Analytics page of a flow allows you to analyze the data throughput of the flow using Sankey and Sunburst diagrams. For details on using these analytics, see Analytics.
6 - Paths
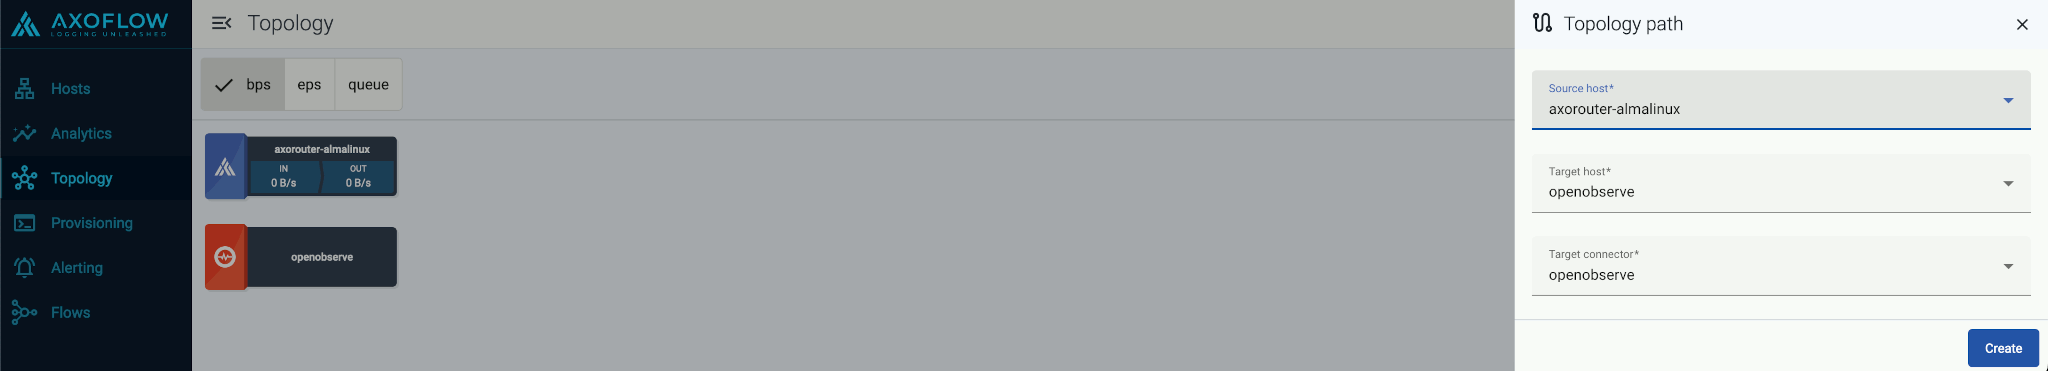
Create a path
Open the AxoConsole.
-
Select Topology > Add Item > Path.
-
Select your data source in the Source host field.
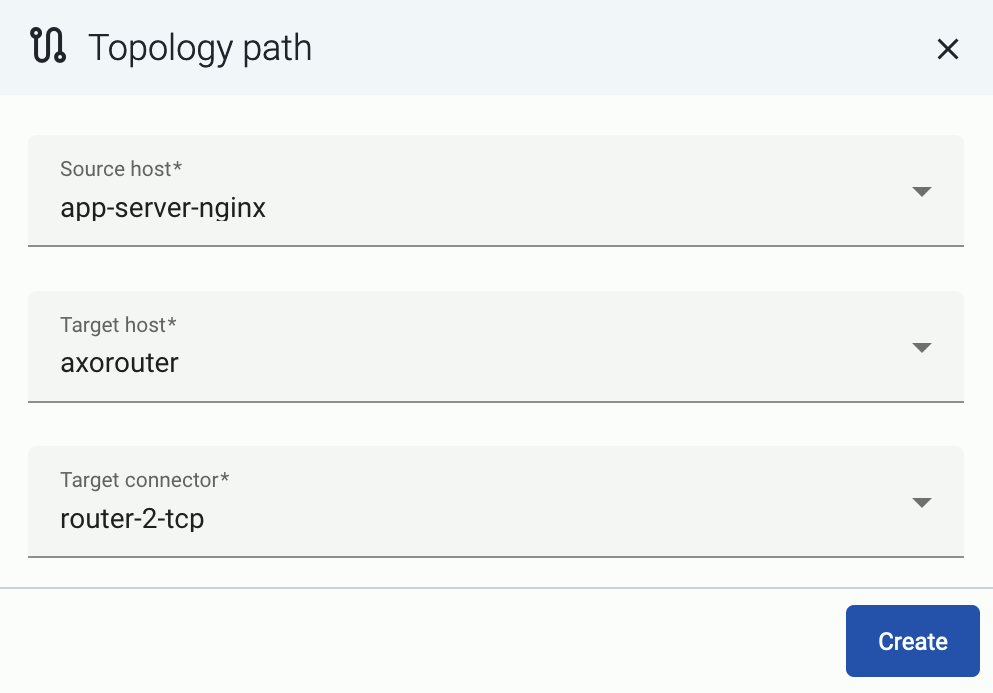
-
Select the target router or aggregator this source is sending its data to in the Target host field, for example,
axorouter. -
Select the Target connector. The connector determines how the destination receives the data (for example, using which protocol or port).
-
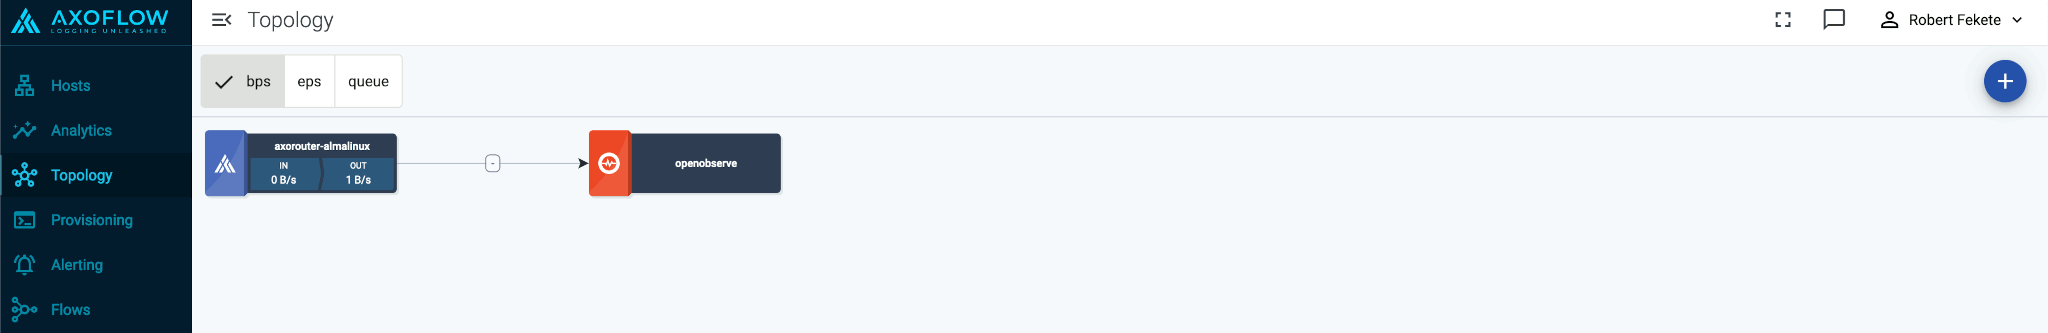
Select Add. The new path appears on the Topology page.
7 - Flow tapping
Flow tapping allows you to sample the data flowing in a Flow and see how it processes the logs. It’s useful to test the flow when you’re configuring or adjusting Processing Steps.
Note
Neither AxoRouter nor AxoConsole records any log data. The Flow tapping and Log tapping features only send a sample of the data to your browser using encrypted connections while the tapping is active. Only authorized users can use tapping.
Prerequisites
Flow tapping works only on flows that have been deployed to an AxoRouter instance. This means that if you change a processing step in a flow, you must first Save the changes (or select Save and Test).
If you want to experiment with a flow, we recommend that you clone ( ) the flow and configure it to use the /dev/null destination, then redo adjusting the final processing steps in the original flow.
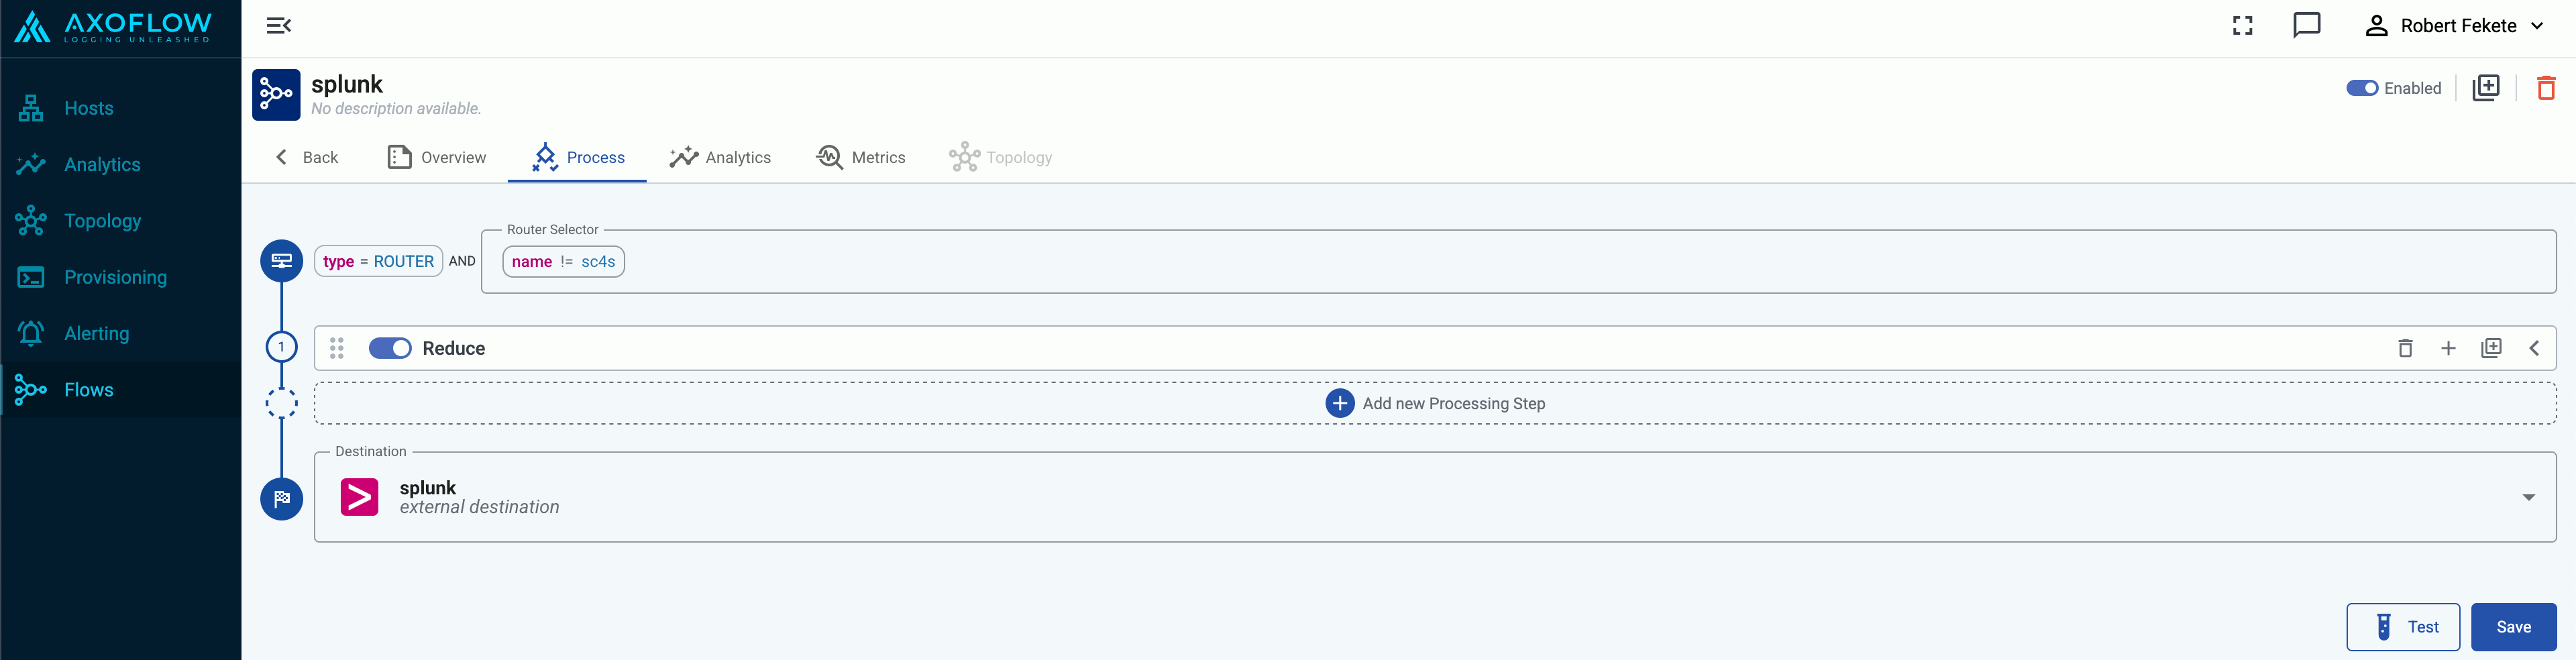
Tap into a flow
To tap into a Flow, complete the following steps.
-
Open AxoConsole and select Flows.
-
Select the flow you want to tap into, then select Process > Test.
-
Select the router where you want to tap into the flow, then click Start Log Tapping.
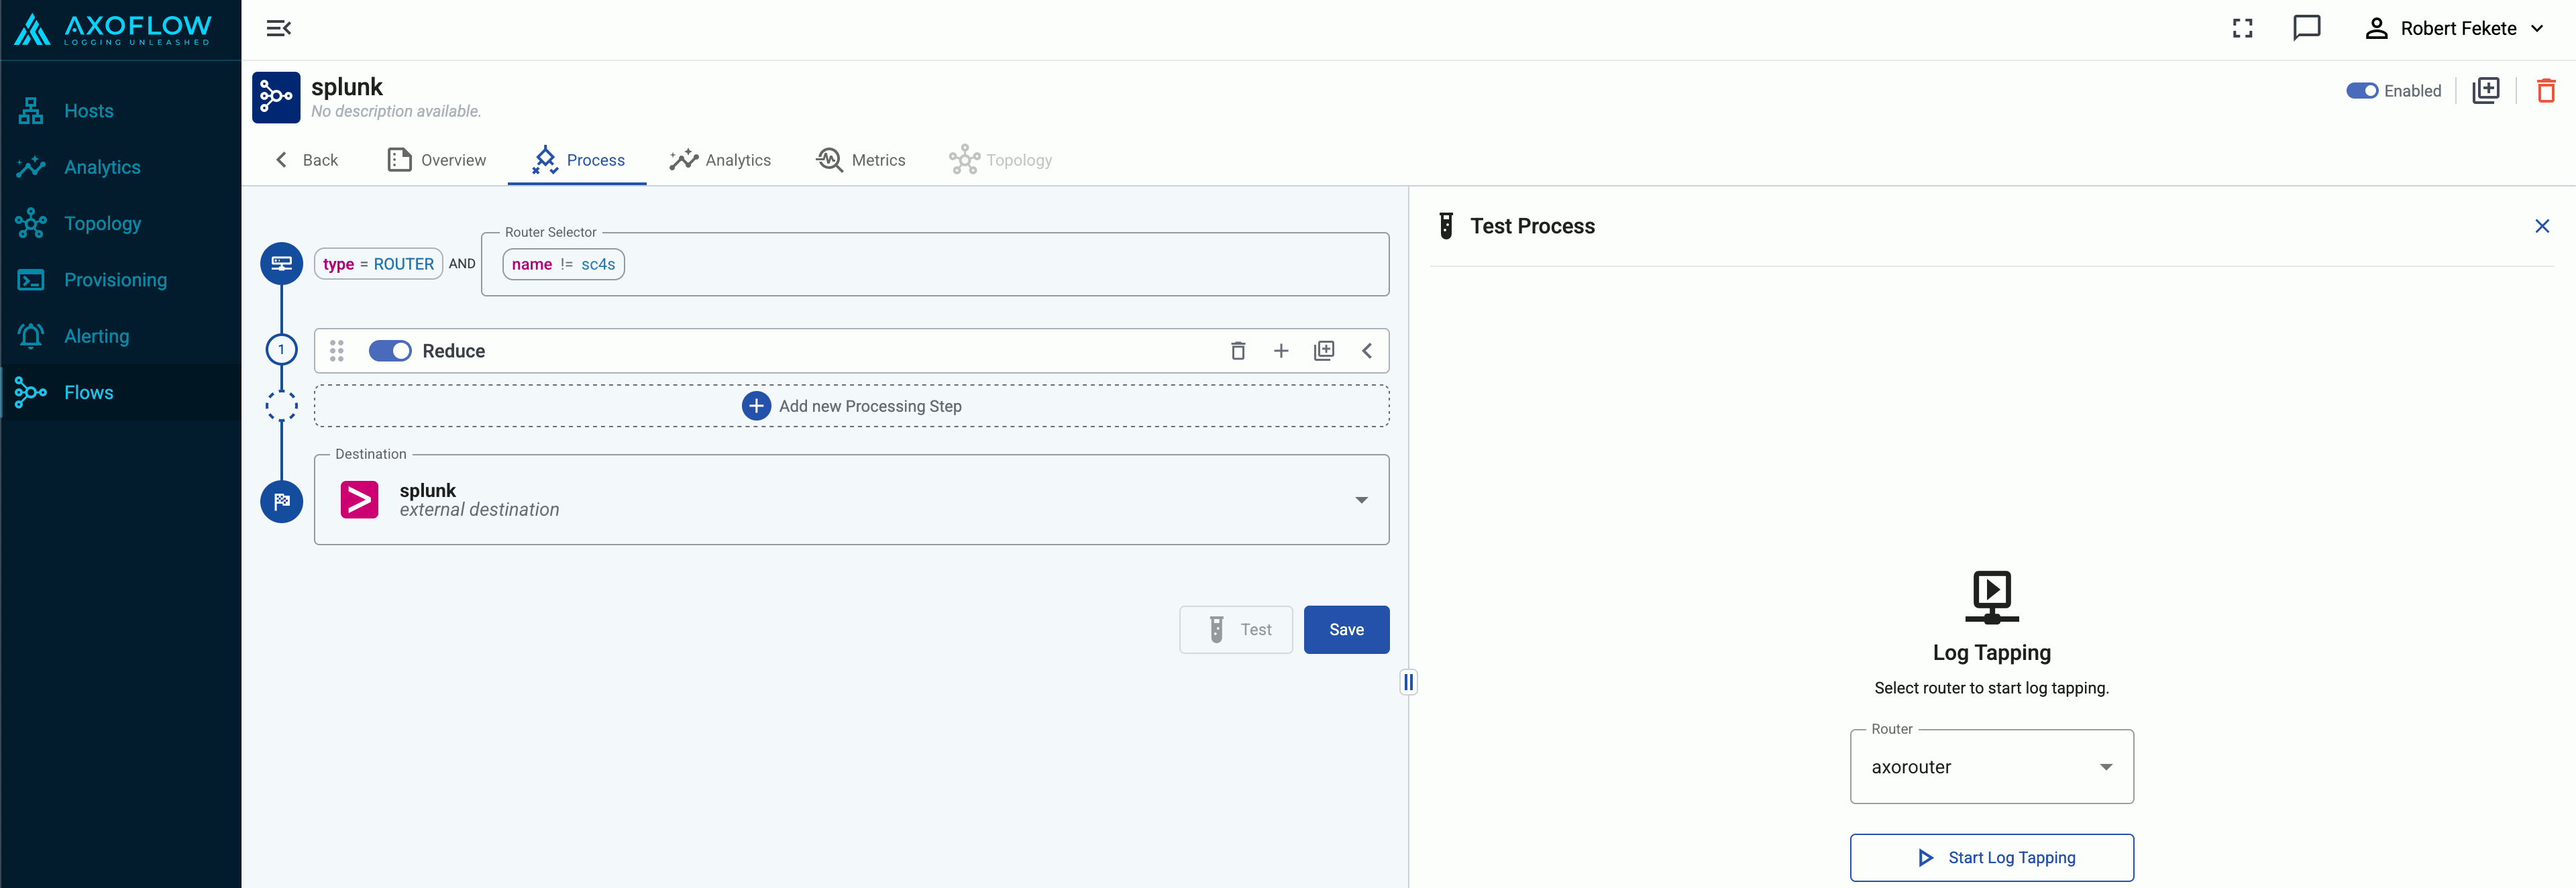
-
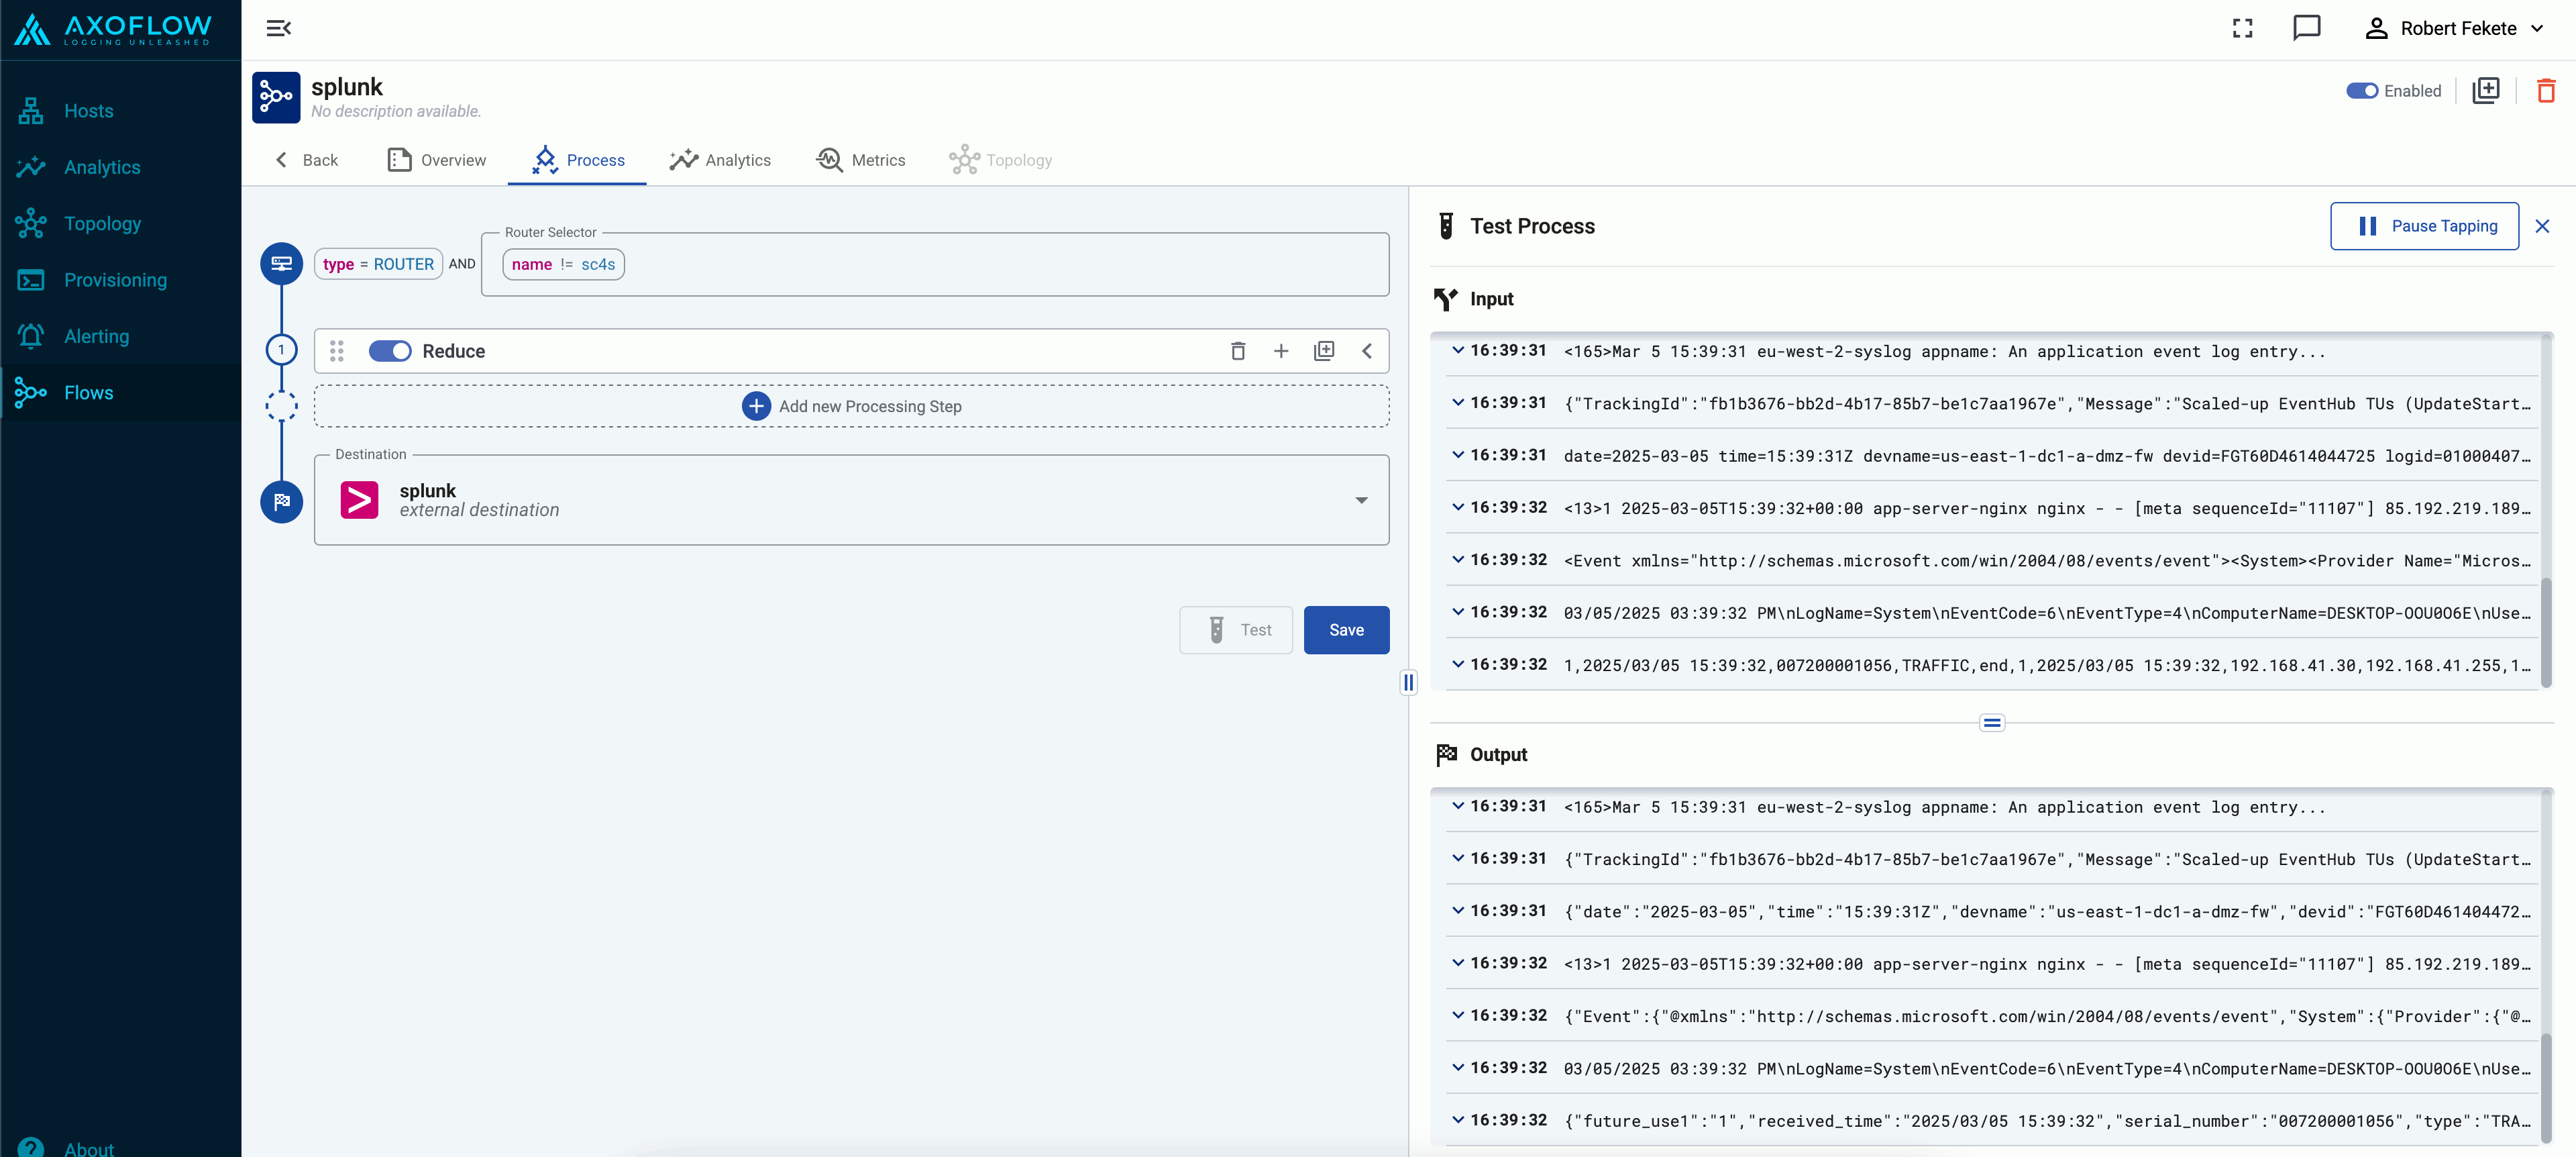
AxoConsole displays a sample of the logs from the data flow in matched pairs for the input and the output of the flow.
The input point is after the source connector finished processing the incoming message (including parsing and classification performed by the connector).
The output shows the messages right before they are formatted according to the specific destination’s requirements.
-
You can open the details of the messages to compare fields, values, and so on. For details about the message schema and the displayed fields, see Message schema reference.
By default, the messages are linked: opening the details of a message in the output automatically opens the details of the message input window, and vice versa (provided the message you clicked exists in both windows).
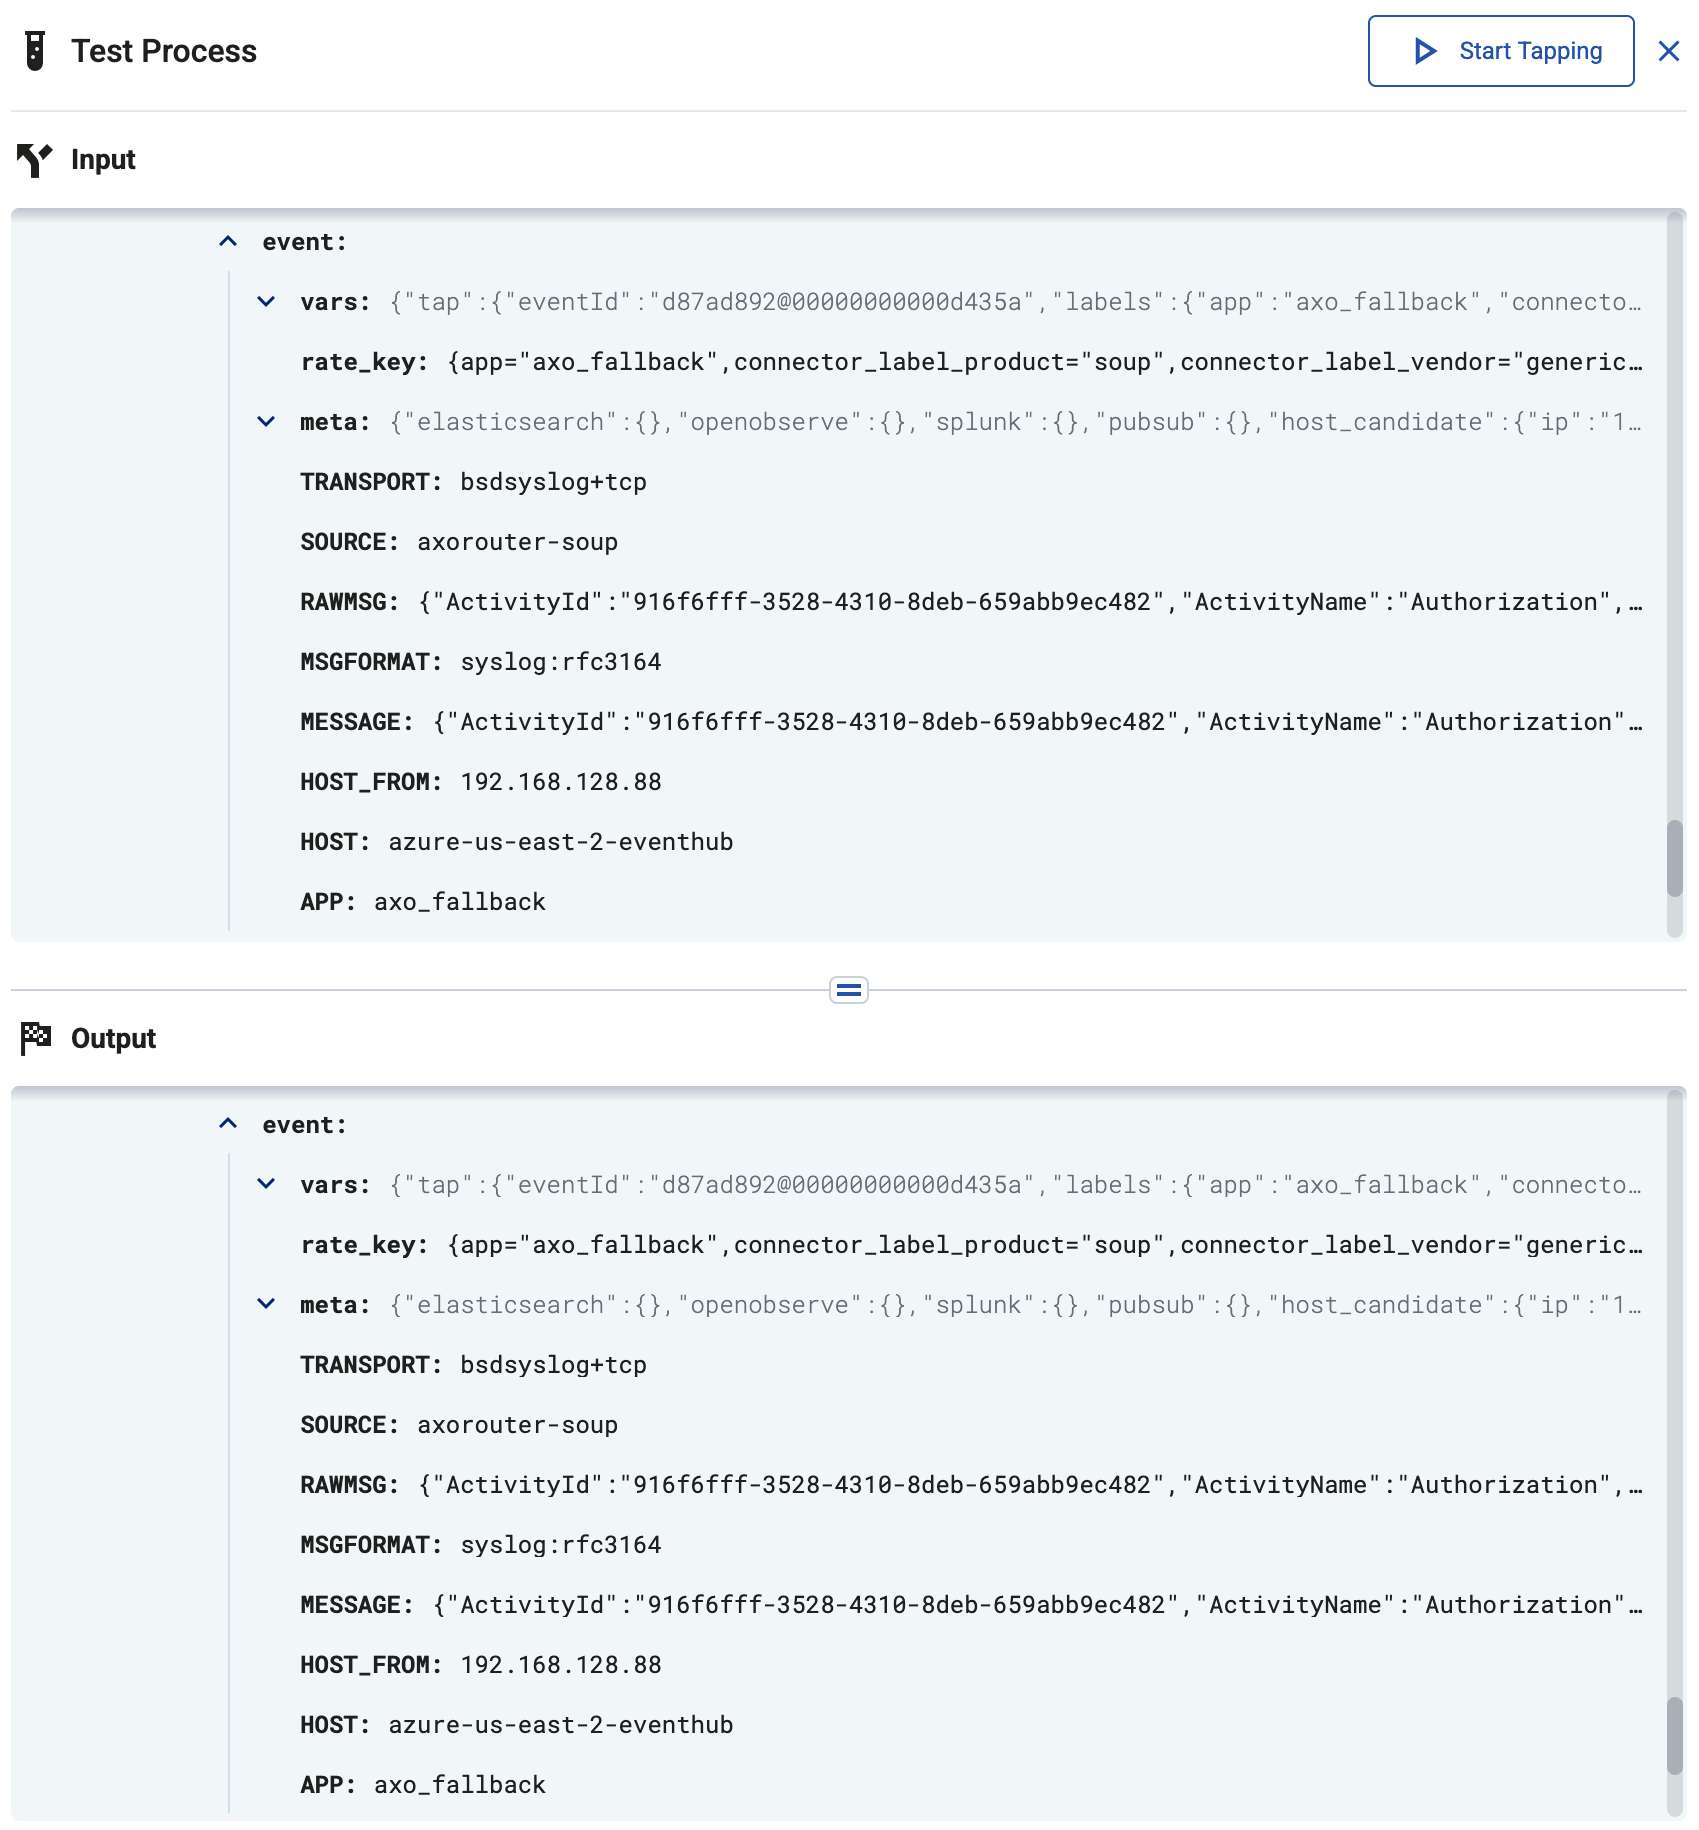
If you want to compare a message with other messages, click to disable linking.
-
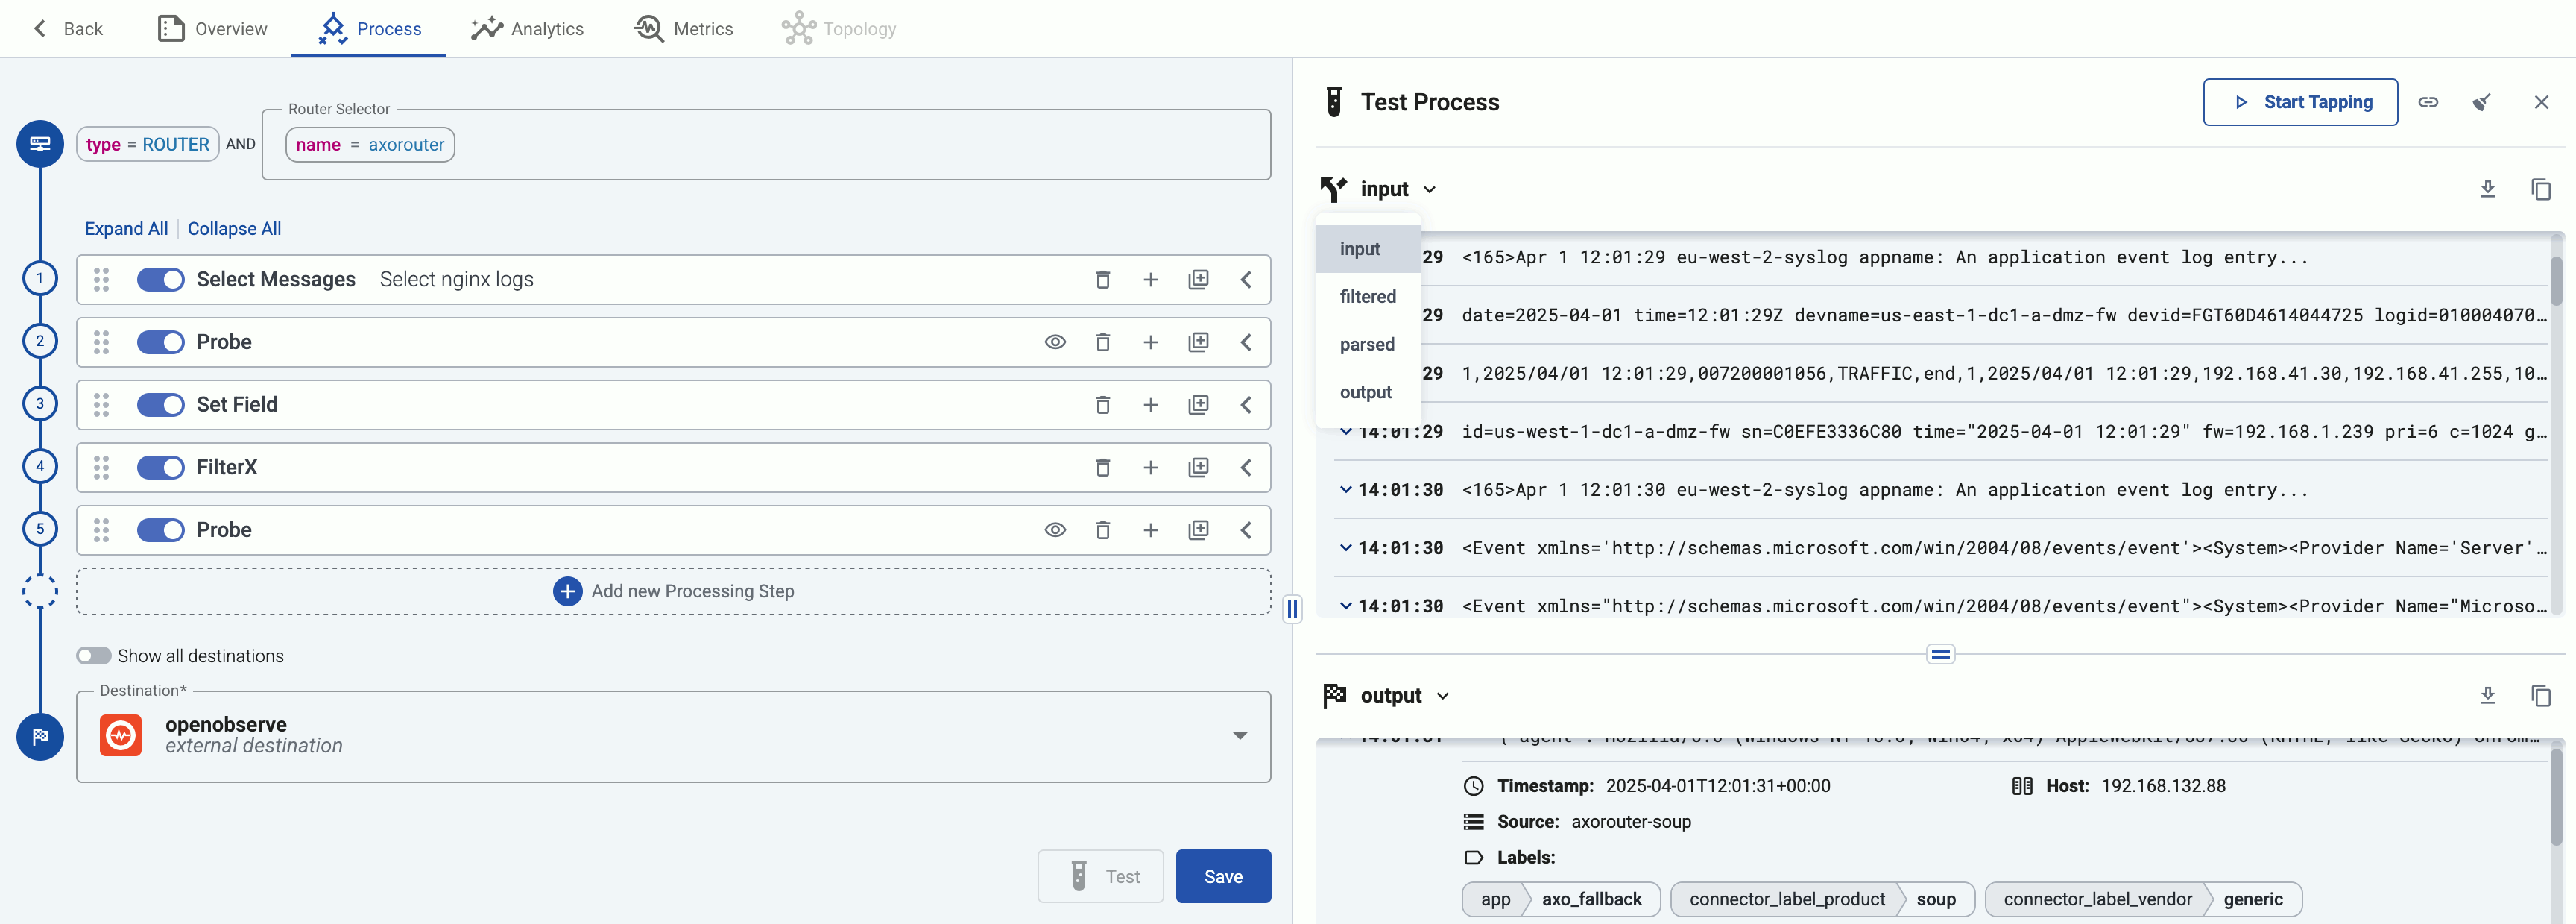
If the flow contains one or more Probe steps, you can select the probe as the tapping point. That way you can check how the different processing steps modify your messages. You can change the first and the second tapping point by clicking and , respectively.
-
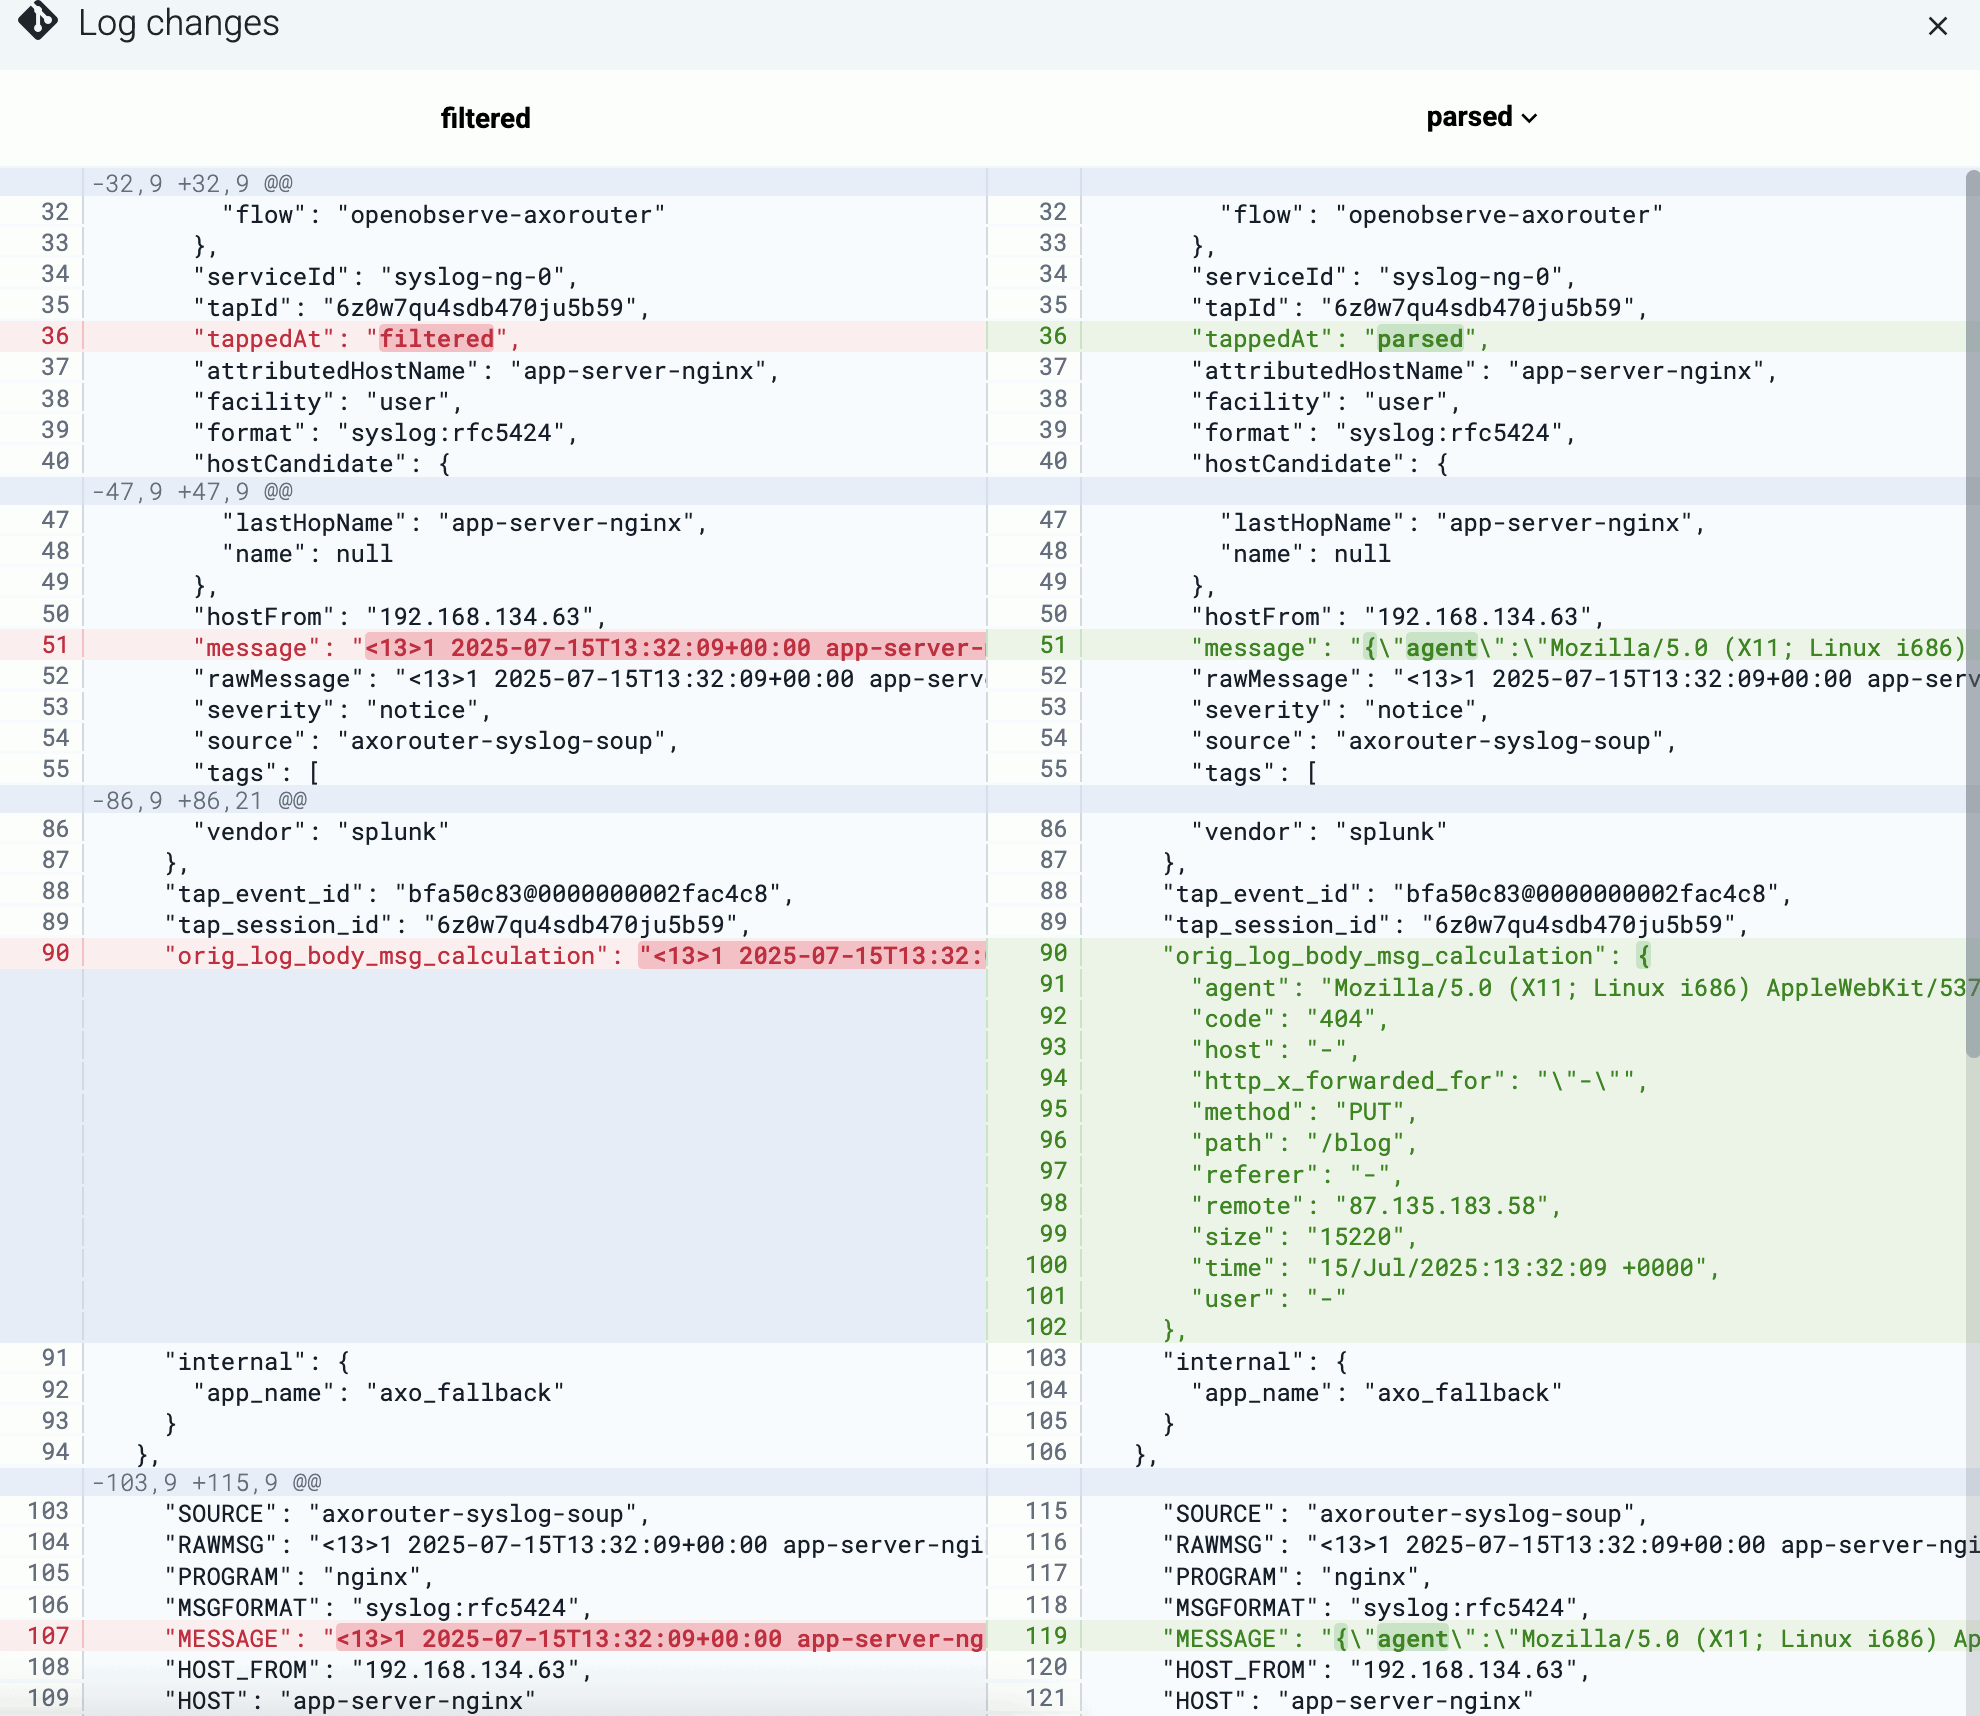
Diff view. To display the line-by-line difference between the state of a message at two stages of processing, scroll down in the details of the message and select Show diff.
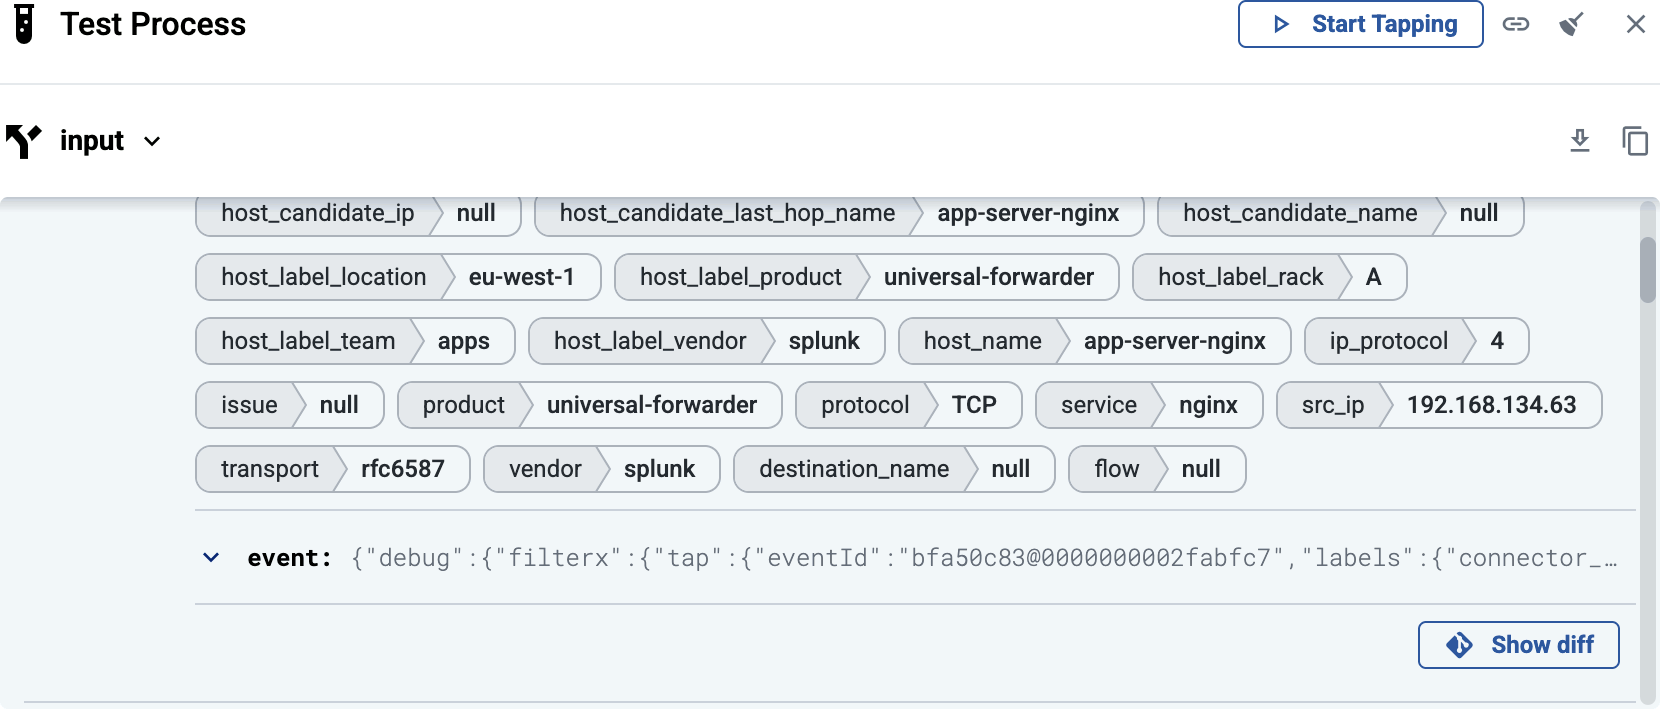
The internal JSON representation of the message and its metadata is displayed, compared to the previous probe of the flow. Obviously, at the input of the flow the entire message is new.
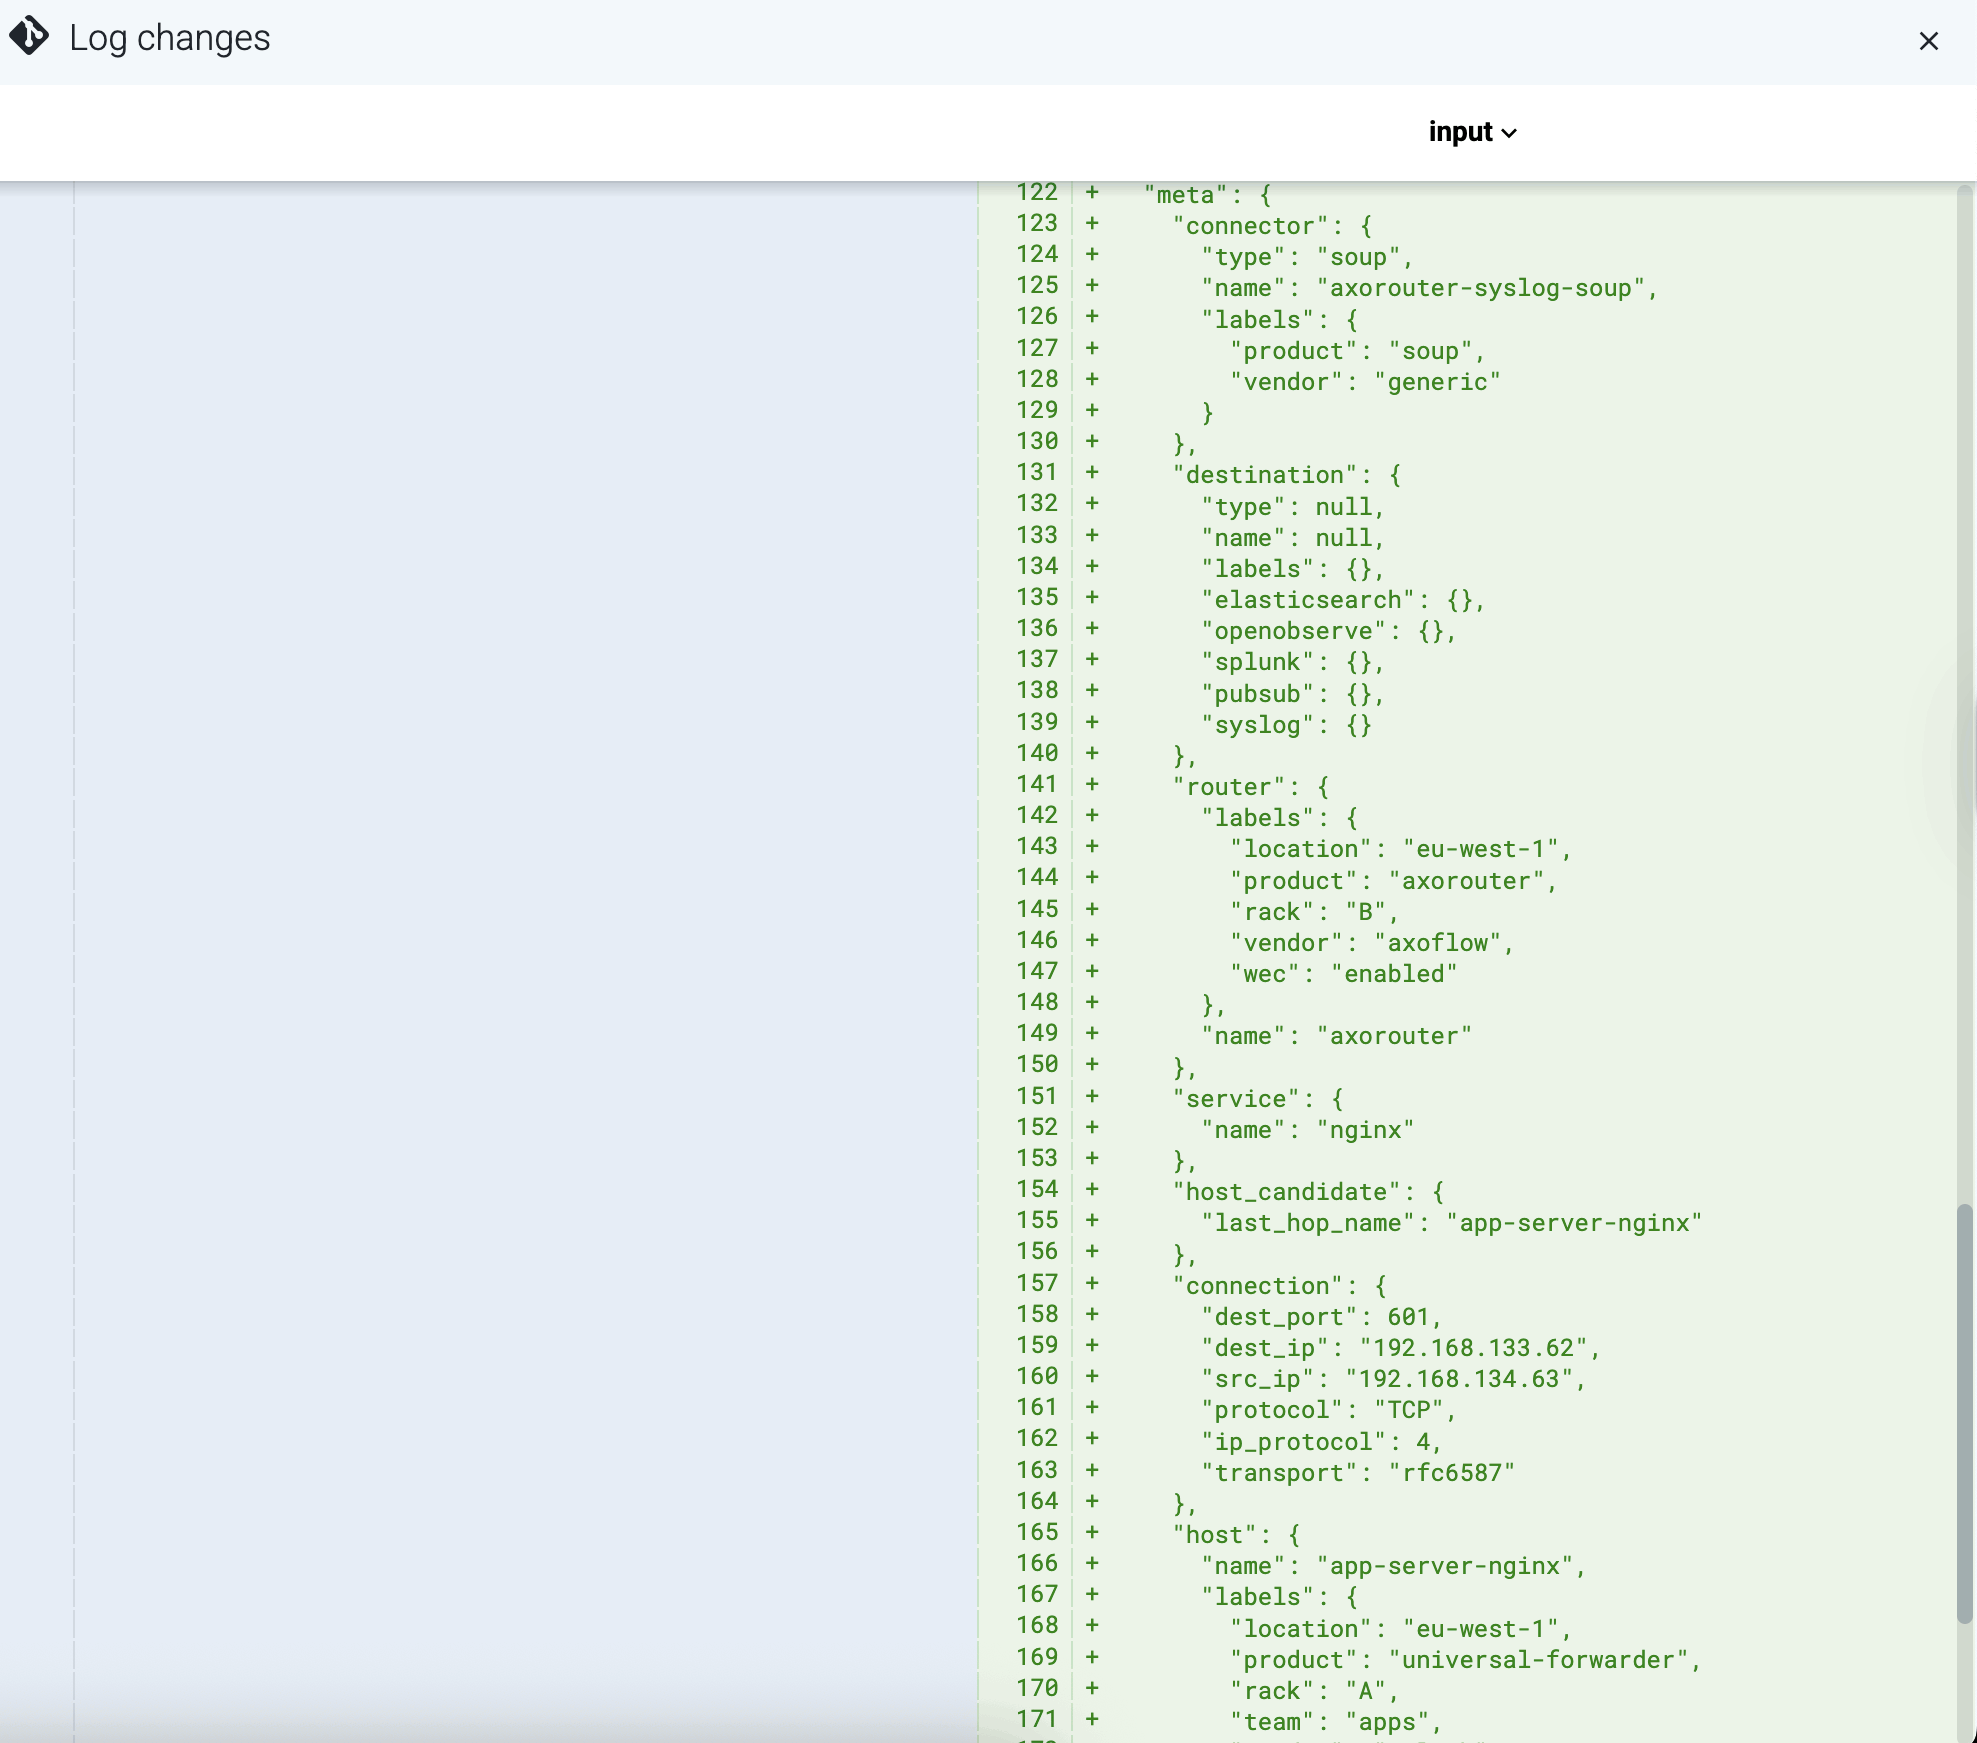
You can change the probe in the right-hand pane, and the left side automatically switches to the previous probe in the flow. For example, the following screenshot shows a message after parsing. You can see that the initial string representation of the message body has been replaced with a structured JSON object.