Log tapping in Axoflow samples the log flow. You can use labels to filter for specific messages (like ones with parse errors) and tap only those messages. To not get overwhelmed with events, Axoflow automatically samples the output: if many messages match the selected filter, only a subset is shown (about 1 message per second). Using log tapping, you can quickly troubleshoot both parsing/curation errors and destination ingest (API) errors, and check:
- What was in the original message?
- What is sent in the final payload to the destination?
To see log tapping in action, check this blog post.
- Tap into your log flow.
- Display the logs of the log collector service. Service logs also contain the output of the systemd units used to launch the containers (where applicable).
Tap into the log flow
To tap into your log flow, complete the following steps.
-
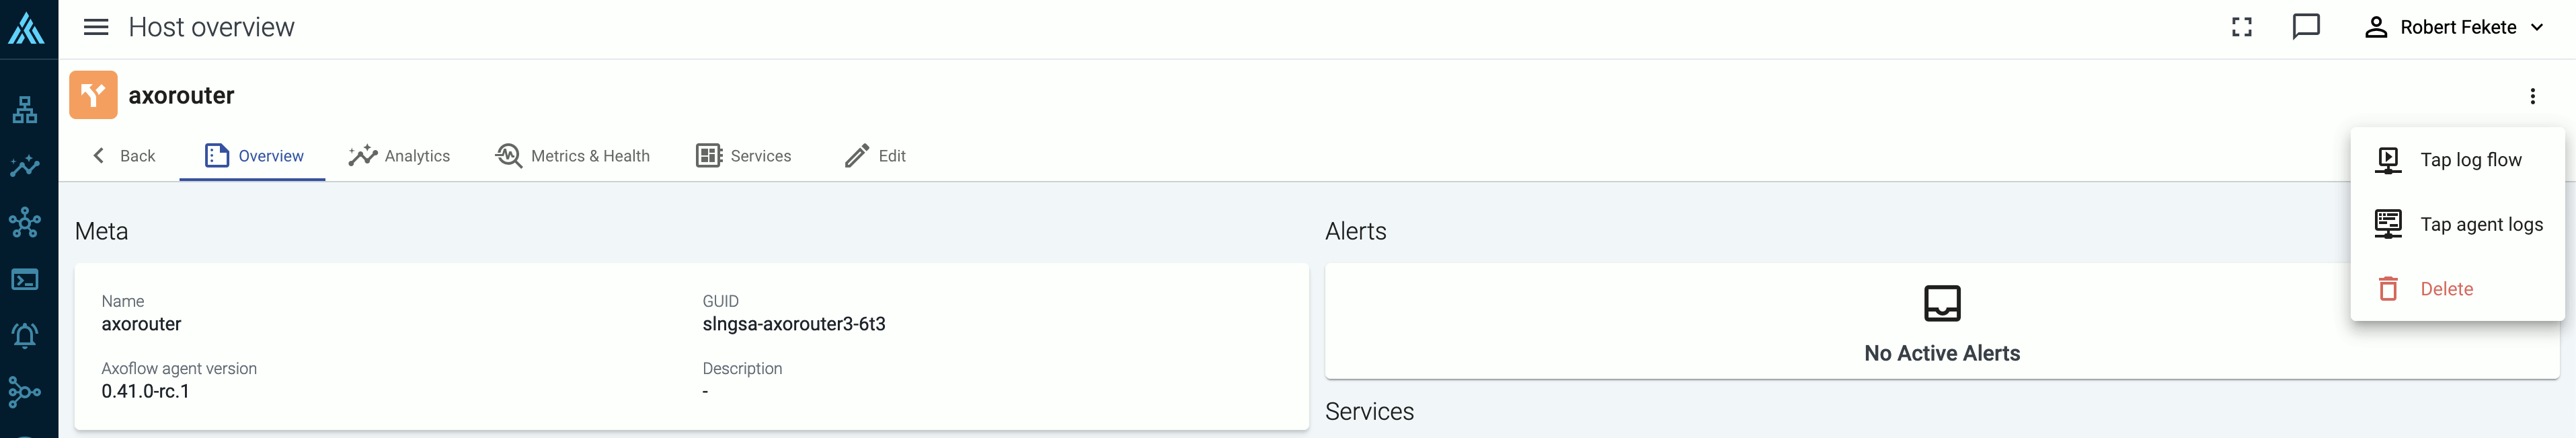
Select the AxoRouter where you want to tap the logs on the Topology or Routers page. Alternatively, select
⌘/Ctrl + Kand enter the name of the AxoRouter. -
Select ⋮ > Tap log flow.
-
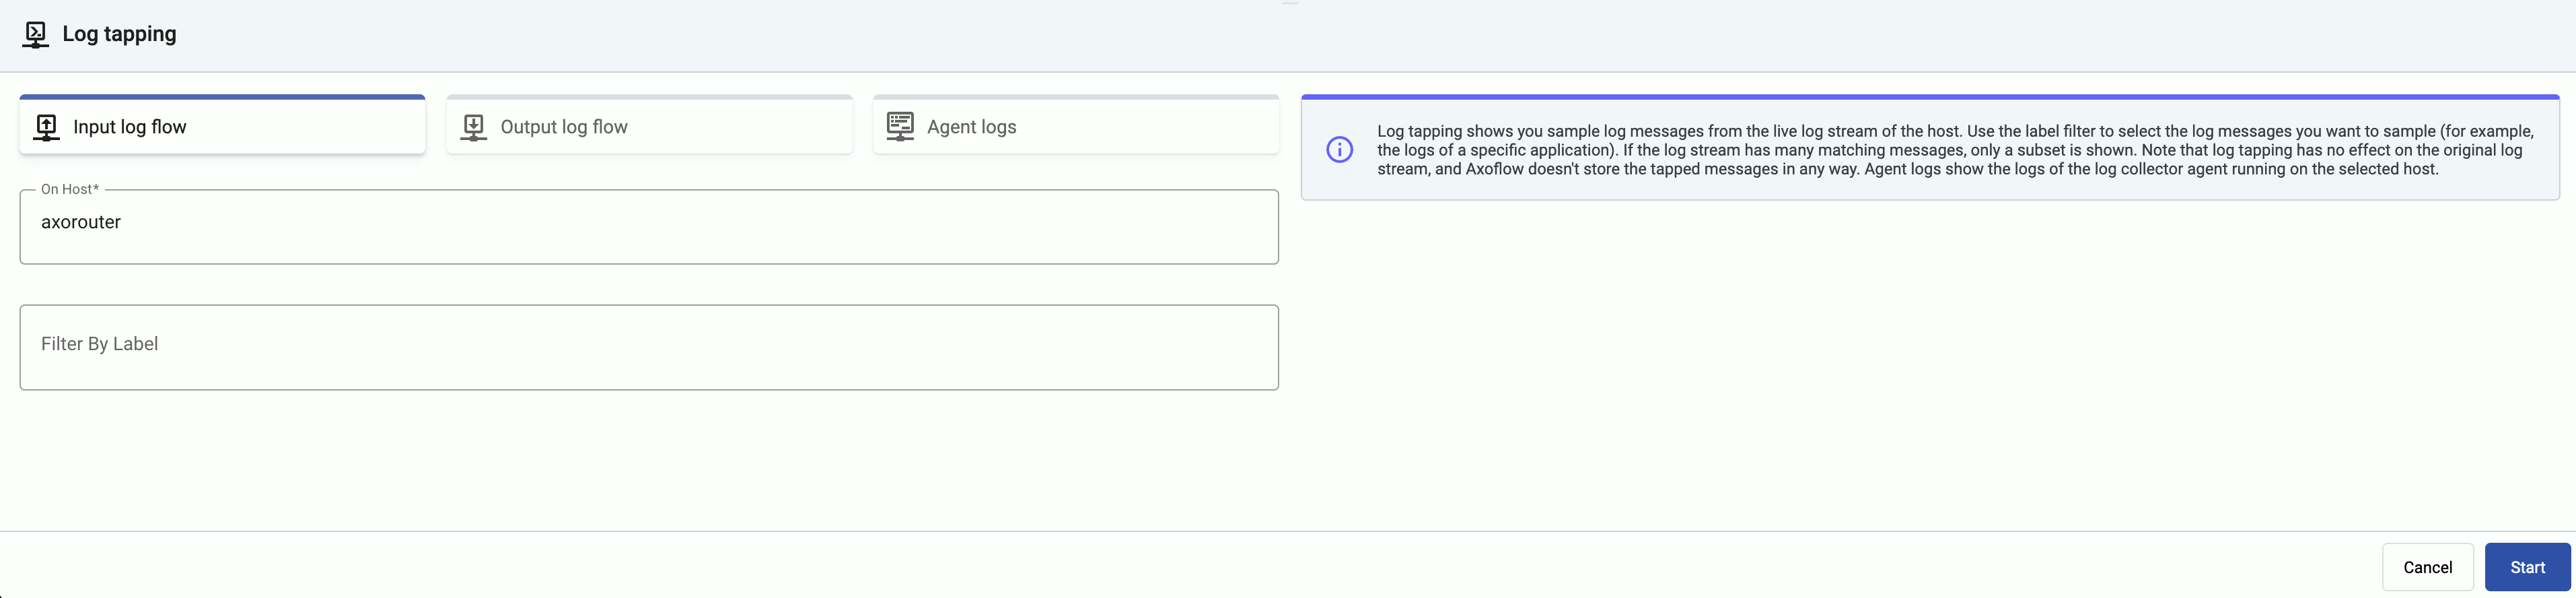
Tap into the log flow.
- To see the input data, select Input log flow > Start.
- To see the output data, select Output log flow > Start.
You can use labels to filter the messages and sample only the matching ones.
-
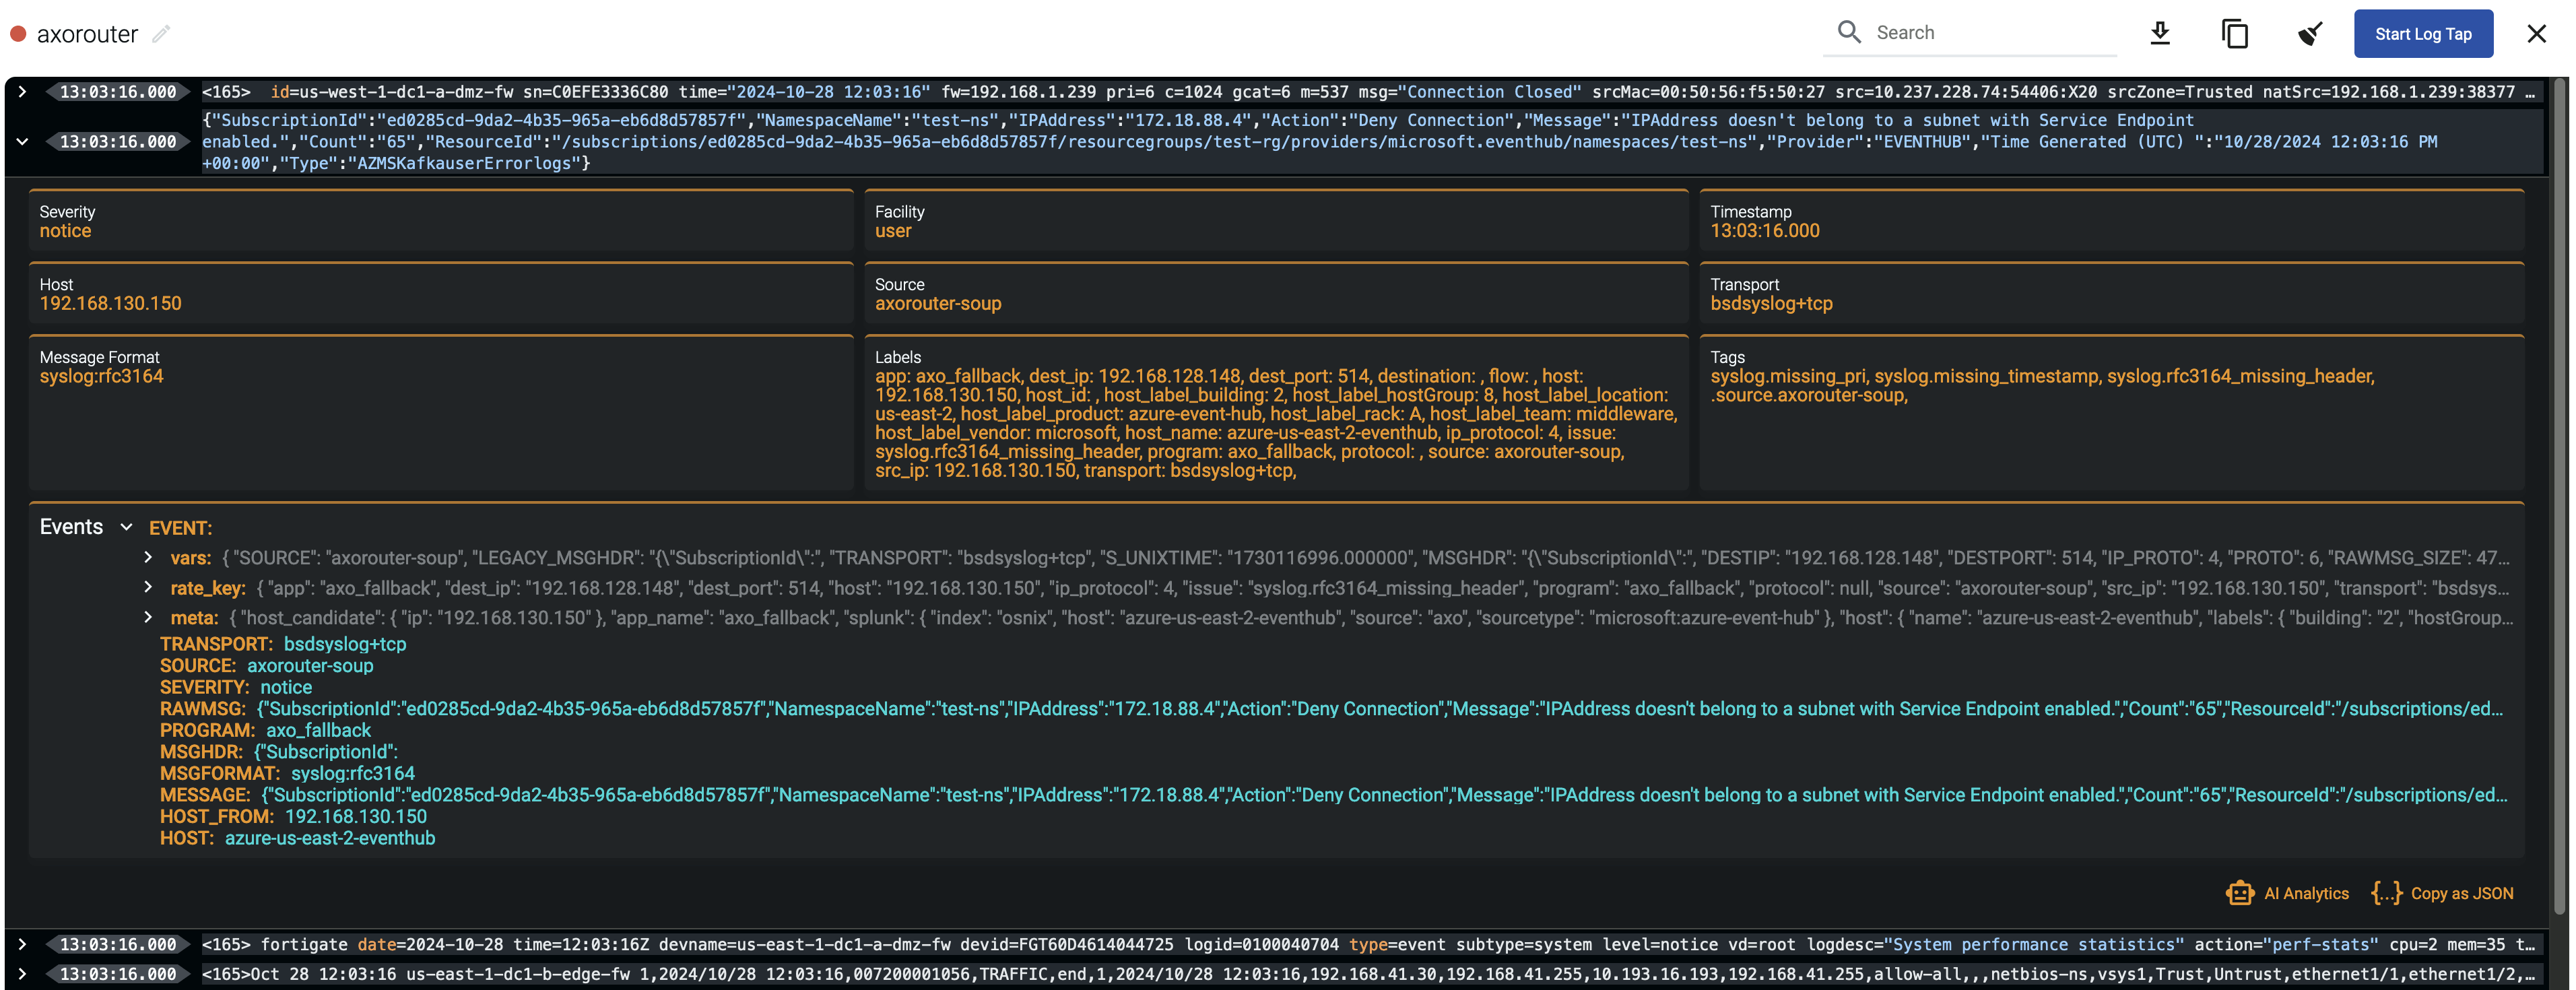
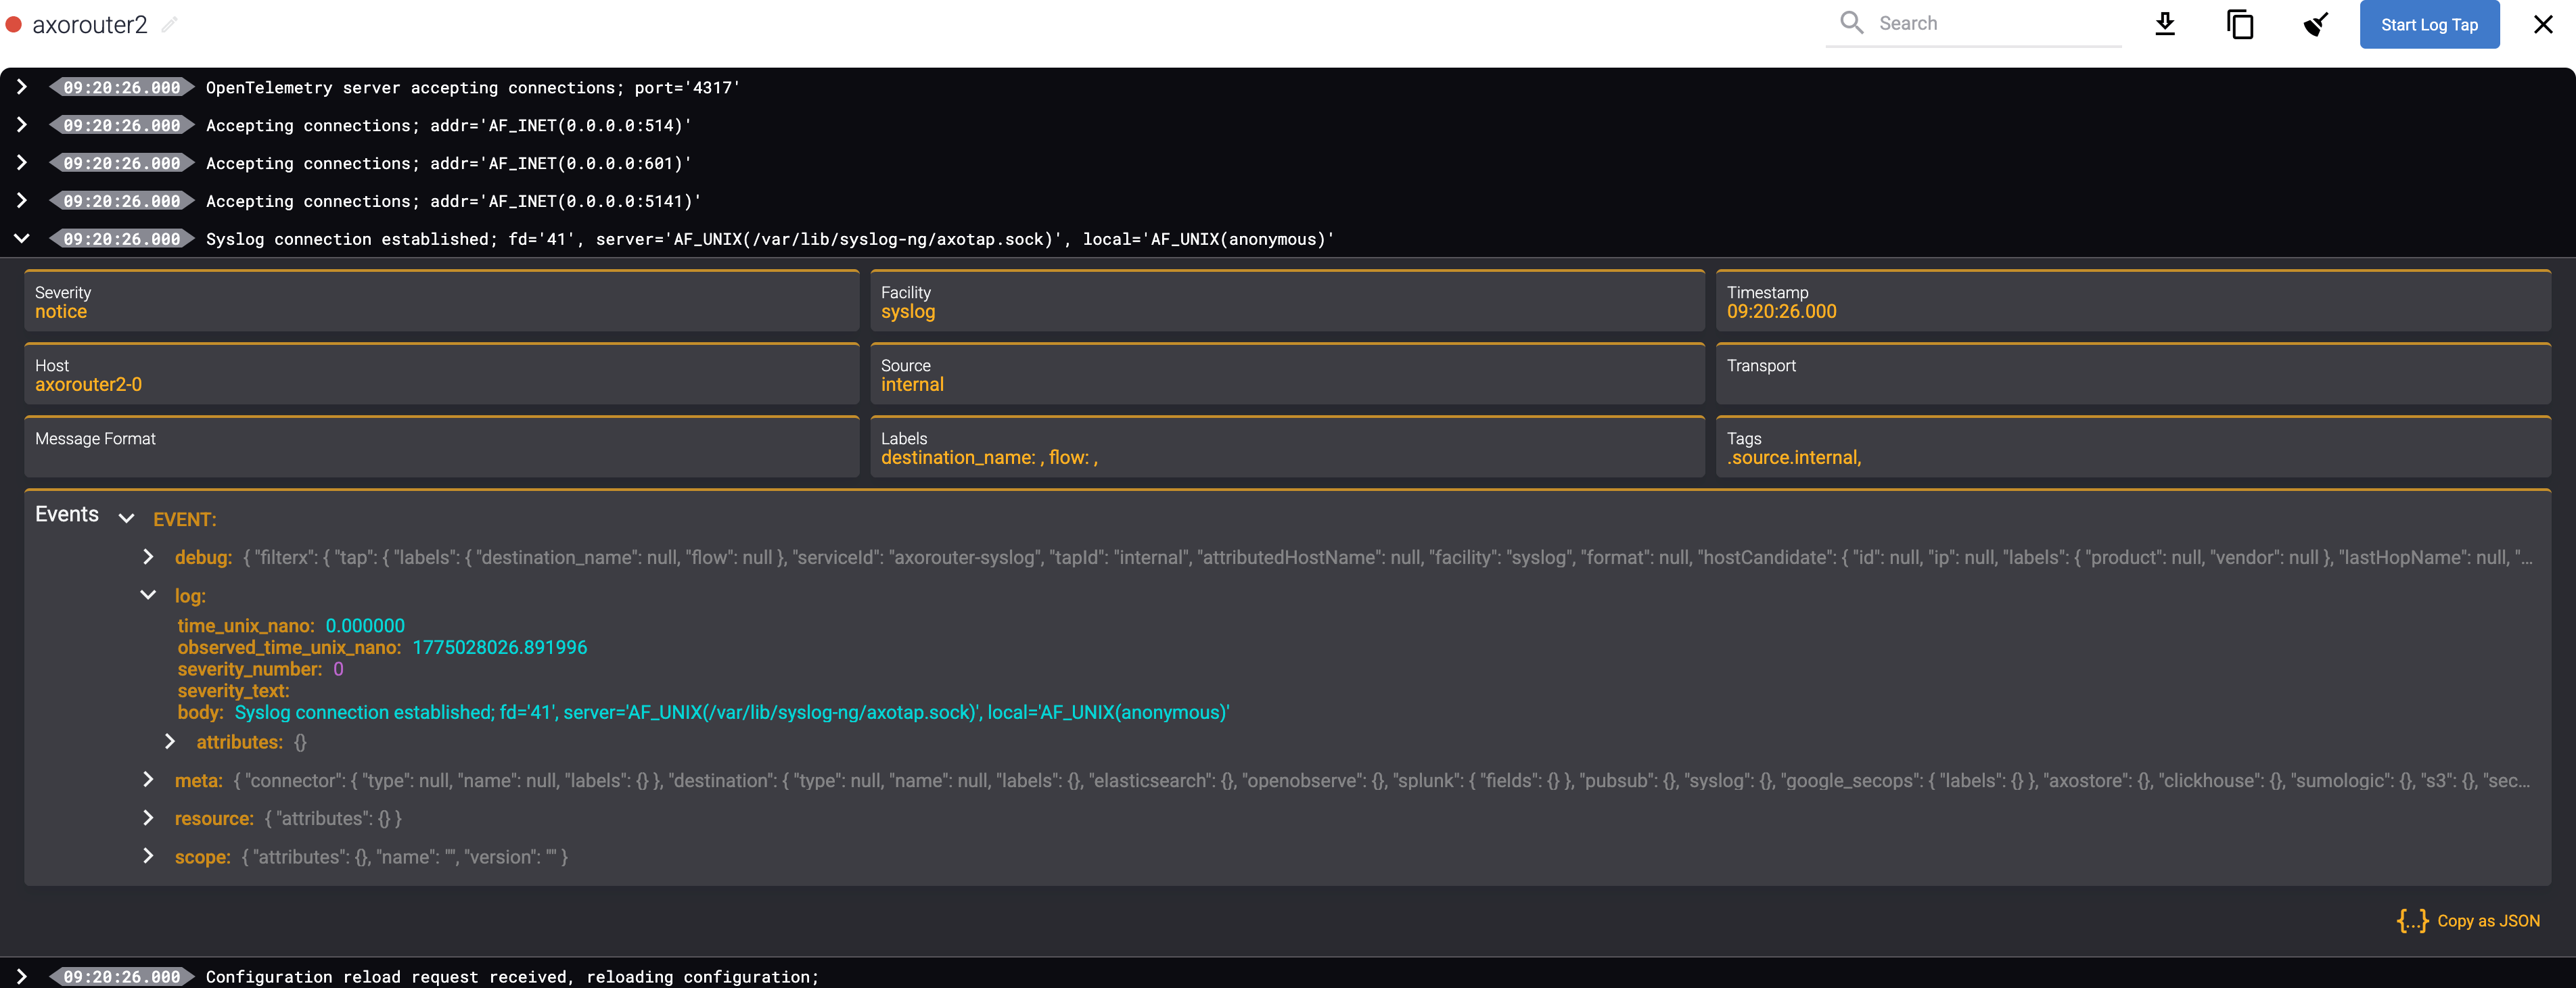
When the logs you’re interested in show up, click Stop Log Tap, then click a log message to see its details. For details about the message schema and the displayed fields, see Message schema reference.
 Note
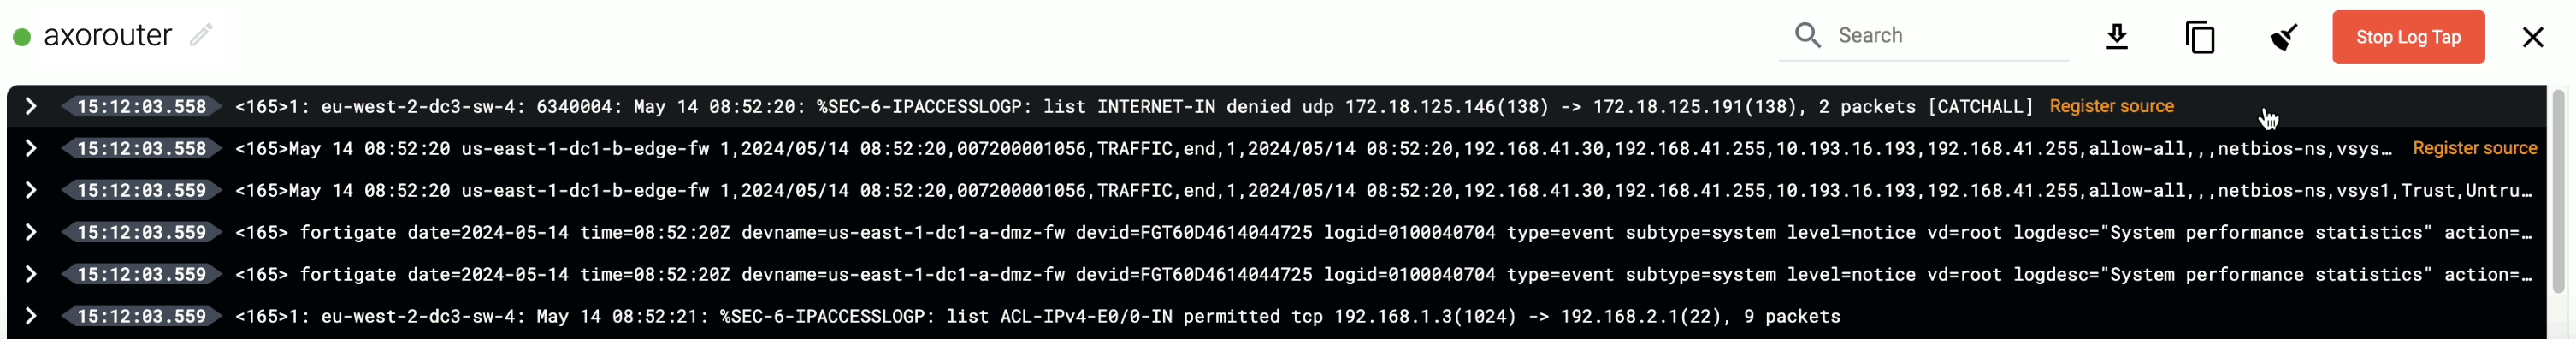
NoteFor sources that are not yet registered in the AxoConsole host database, the Register source button is shown at the end of the message. Click it to add the source to AxoConsole: this will allow attributing the logs coming from the given source as such, enriching the messages, the analytics data, as well as the Topology page.
 Note When using Log tapping, ETW events look a bit weird: the body of these events is empty. That’s normal, the reason for that is that everything is sent as metadata.
 -
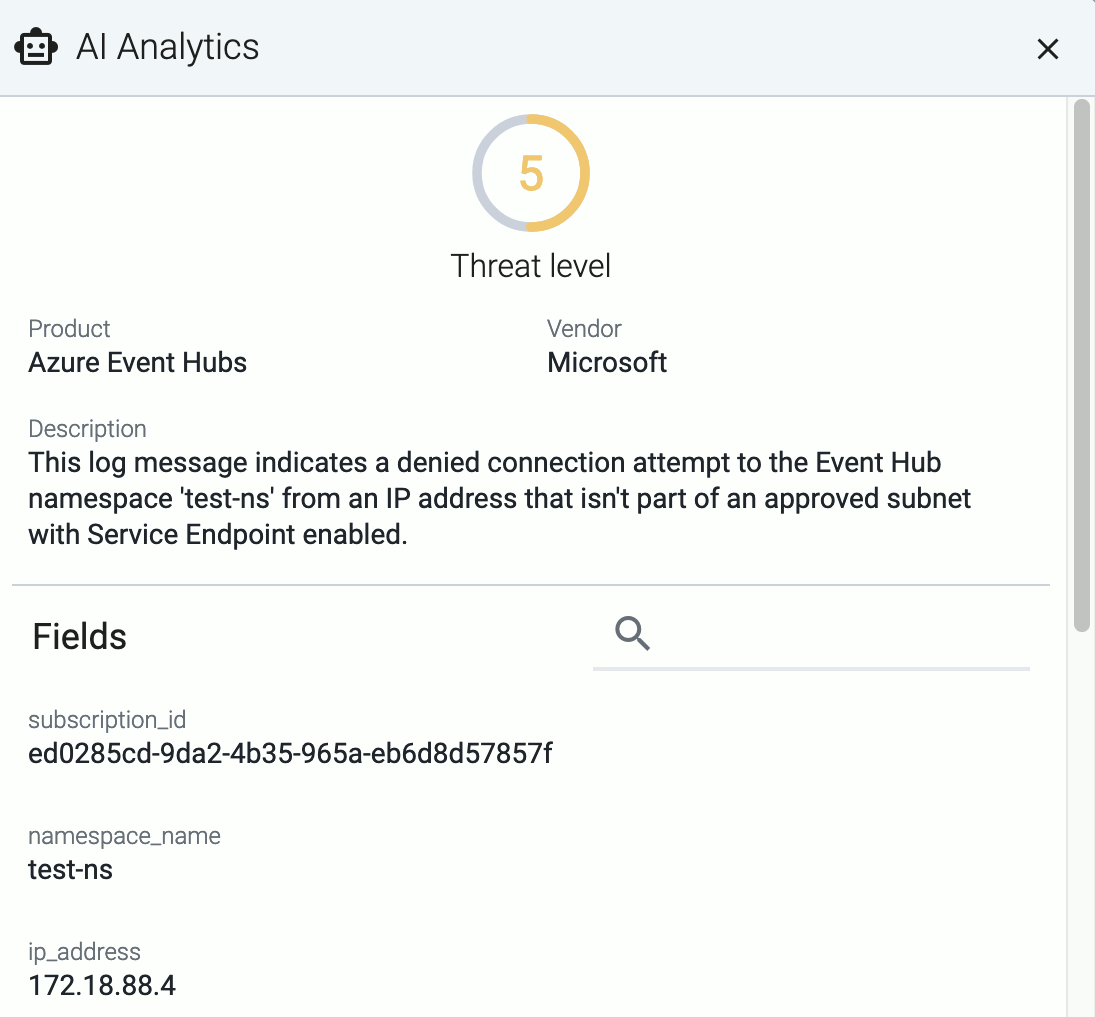
If you don’t know what the message means, select AI Analytics to ask our AI to interpret it.
Tap service logs
Display the logs of the log collector service, complete the following steps. AxoConsole supports service log tapping on AxoRouter and Axoflow agent for Linux hosts.
-
Find the host you want to tap.
- Select the AxoRouter on the Topology or Routers page.
- Select the Axoflow agent on the Topology or Sources page.
Alternatively, select
⌘/Ctrl + Kand enter the name of the host. -
To start log tapping instantly, select Services > ✓ Service log in the row of the
axorouter-syslogoraxoflow-otel-collector.serviceservice.To filter the logs or to tap the logs of a specific service, select ⋮ > Tap service logs and complete the following steps.
-
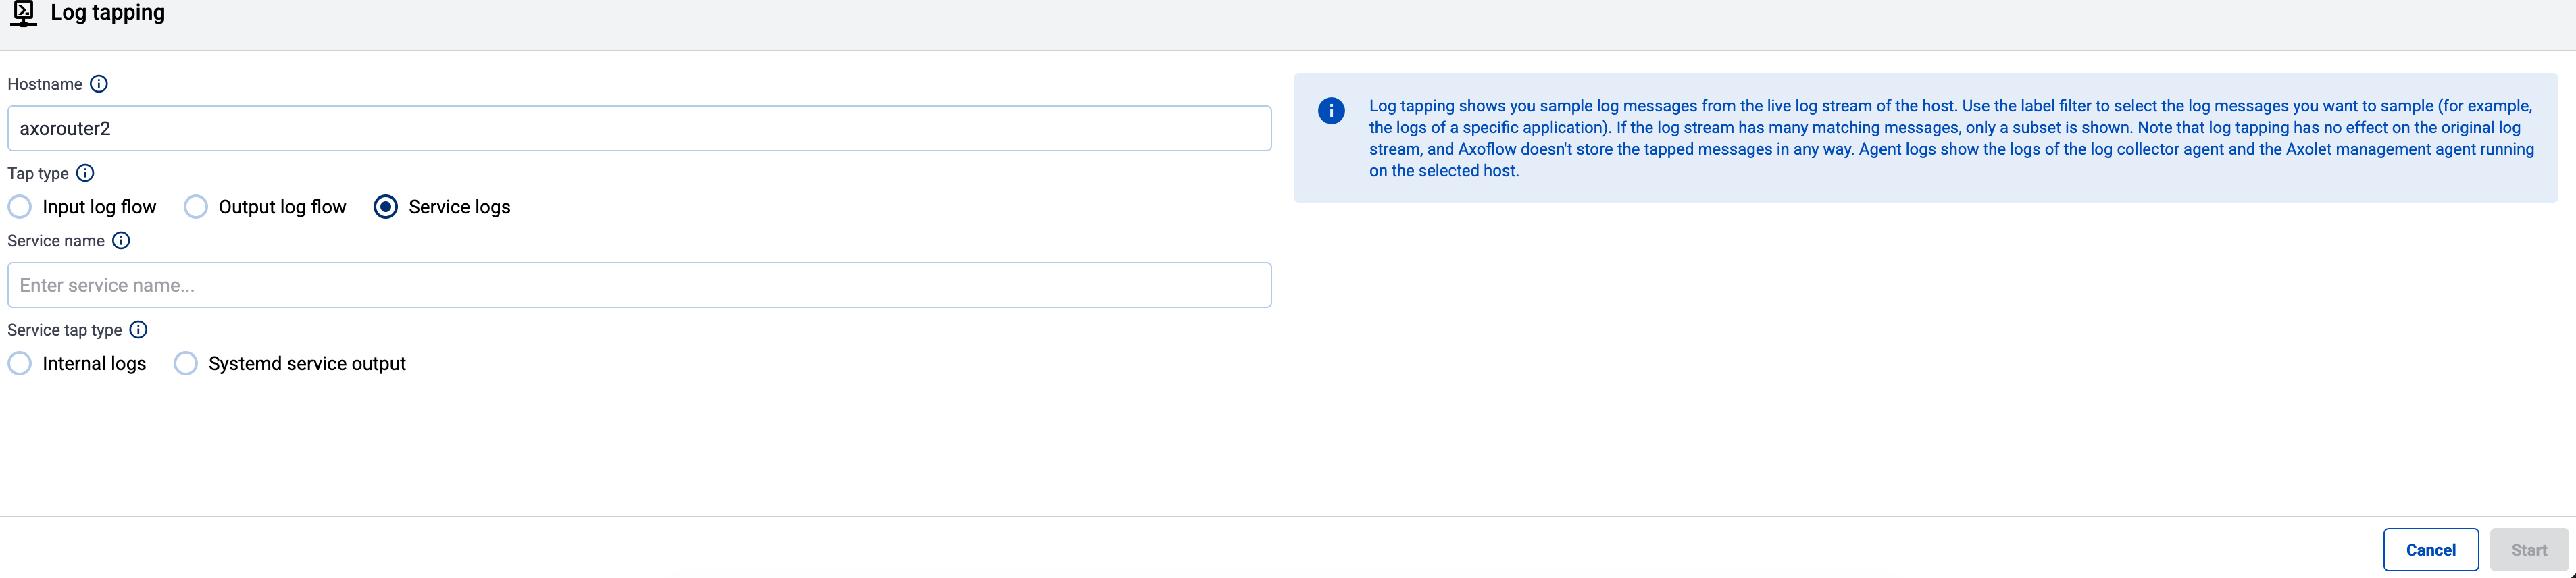
Select Service logs.
-
Set the Service name field to see the logs of a specific service.
Depending on the configuration of the host, the following services can be available:
- axoflow-otel-collector: The collector agent on edge hosts.
- axolet: The monitoring and management agent for Axoflow pipeline elements.
- axorouter-syslog: The main processing element of AxoRouter deployments.
- axorouter-wec: The service that handles the Windows Events connector (WEC).
- axostore: The service that handles AxoStore on the host. Only available if there are stores configured on the host.
If systemd is available on the host, select Systemd service output to show the logs of the service from the systemd journal. Otherwise, the Internal logs of the service are available.
-
-
When the logs you’re interested in show up, click Stop Log Tap, then click a log message to see its details. For details about the message schema and the displayed fields, see Message schema reference.
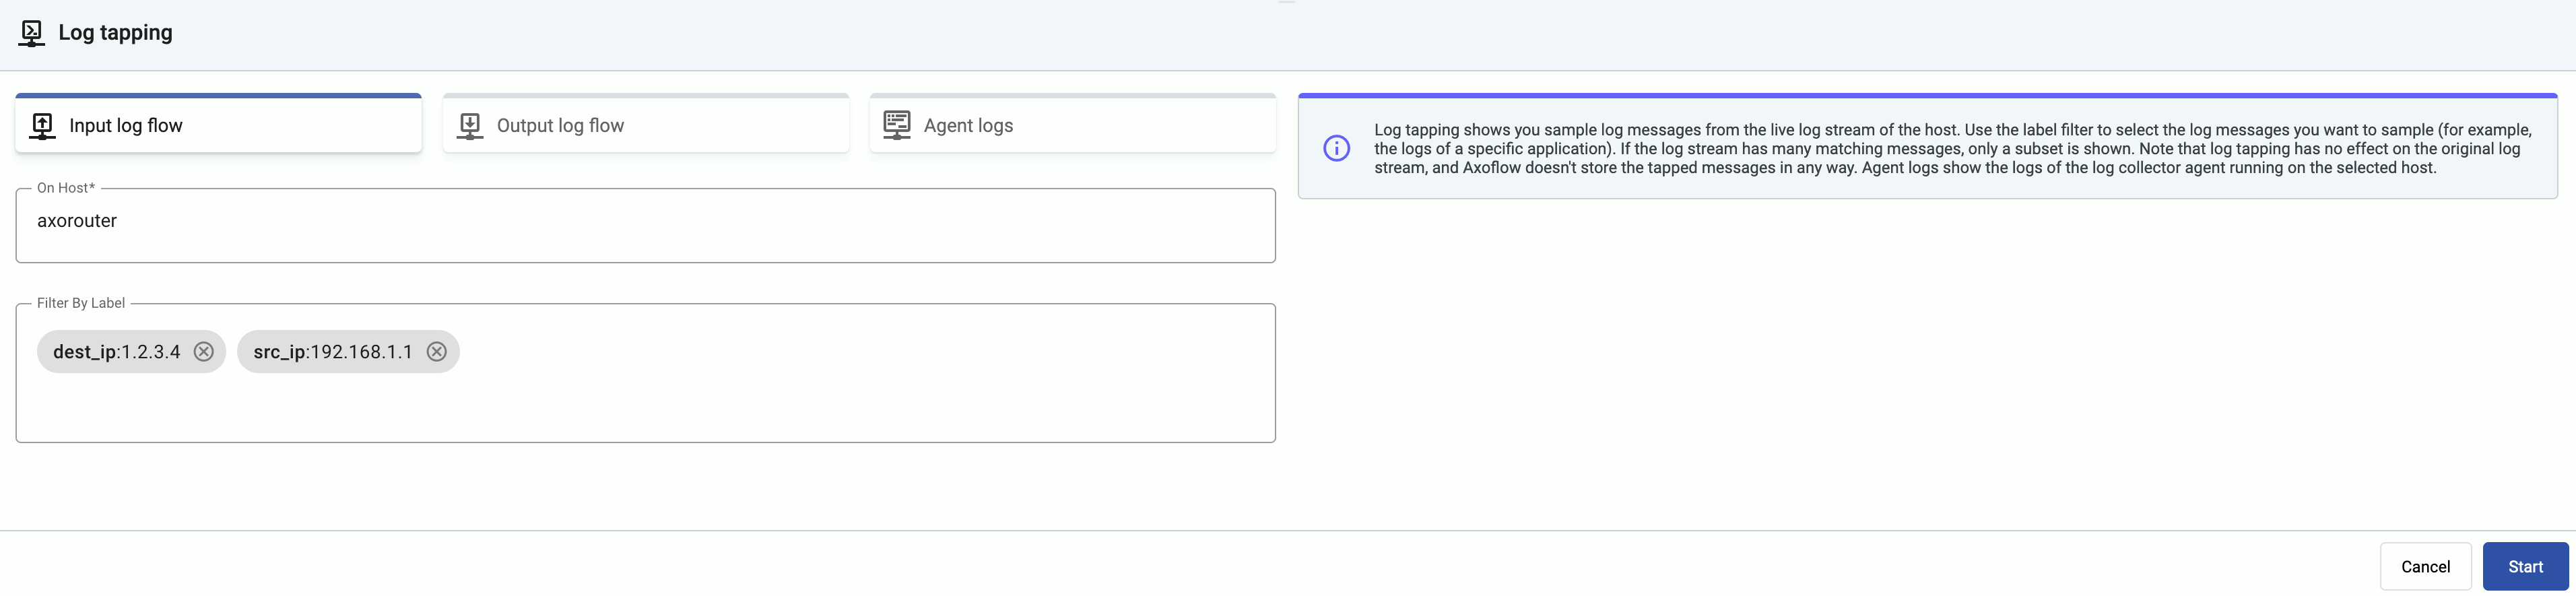
Filter the messages
You can add labels to the Filter By Label field to sample only messages matching the filter. If you specify multiple labels, only messages that match all filters will be sampled. For example, the following filter selects messages from a specific source IP, sent to a specific destination IP.
For details about the labels available for filtering, see Metrics schema.
To tap the messages received from edge hosts, you can use the related metrics labels of the edge collector, for example, edge_connector_type:windowsEventLog samples only the event log messages received from edge hosts. For details about the message schema and the available fields, see Message schema reference.