
From API Calls to True Pipeline Integrations
People try to quantify things to make comparisons. Telemetry pipelines are no exception. Everyone is quick to highlight the biggest numbers, like how many integrations they support. But in cybersecurity, quality always beats quantity.
As we continue expanding Axoflow with more destinations, it’s important to focus on what truly matters when evaluating a pipeline. In this blog, we’ll walk through the key factors you should consider and highlight the differences using our latest additions: the Dynatrace and the Sumo Logic destination.
When people talk about integration or support it is usually done by implementing an HTTP or gRPC endpoint and job’s done. Or is it? The real work starts after that. What is the best way to represent the data on that endpoint? What about the failure scenarios? Are there any special changes needed based on the type of the ingested data? That is the real value!
This post explains our philosophy on destinations, what real support looks like compared to a checkbox integration, and how Axoflow provides outcomes your SOC teams can feel: faster investigations, lower bill, higher signal.
The rabbit hole of an integration
Support for a destination all too often means only a minimal API implementation and ignoring the following:
- schema fidelity and field semantics
- identity mapping across products (host/service/entity)
- timestamps, timezones, and event ordering
- data reduction and deduplication
- data normalization
- backpressure, retries, and dead-letter handling
- provider-specific constraints (batch sizes, rate limits, auth, TLS nuances)
If your pipeline doesn’t provide these capabilities out of the box, the burden falls on you to handle them. And when the time comes to introduce a new destination or source into your infrastructure, you’re going to have a hard time.
What true end-to-end support means at Axoflow
When we say Axoflow supports a destination, we mean:
- Schema-aware formatting
Axoflow normalizes incoming data and delivers it in a destination-friendly format and schema - covering keys, data types, streams, or indexes - rather than ingesting raw blobs. This includes consistent timestamps and attributes that downstream search queries, alerts, and detection engineers can immediately use. When a destination supports a specific normalization framework, Axoflow applies it by default. For vendor-specific schemas, such as Dynatrace Grail’s semantic dictionary, Axoflow adds native support to ensure seamless integration. - Context preservation
Extracting and carrying identity across hops - hostnames, device IDs, cloud resource tags - so queries and dashboards line up with how your teams think. - Data quality improvements in transit
On the wire deduplication of redundant data, reducing noise, fixing malformed message headers and payloads, and enriching the data with labels/metadata so you ingest relevant information. - Operational resilience
Built-in buffering, error handling, flow control and backpressure mean pipelines don’t stall just because a destination hiccups. - Migration-friendly by design
Sending data to multiple destinations is first-class: mirror traffic, validate your dashboards in the new SIEM, then flip the switch.
If you’ve followed our posts on data quality, cost control, and pipeline automation, you’ll recognize these themes—they’re the Axoflow way.
Why Normalization Matters
Logs and security data come in different formats, from different devices, even when referring to the same event, making it difficult to find, understand, and correlate the data. Security events and detection rules should be agnostic to how the data was collected or where it came from. Your detection engineers shouldn't care about what's the exact name of the field where your different firewalls store the IP of the client: all such events should refer to a standard name. If this is so obvious why don’t others do it out of the box?
> The answer is simple: because it’s hard!
It needs expertise and a lot of legwork to do it properly. There is no one-to-one mapping of sources to schemas. You need to check the schema descriptions, understand the original content and know how the data will be used for analysis.
Axoflow builds this intelligence in. By combining AI with our deep data and security expertise, Axoflow automatically normalizes your data in real time within the pipeline. It supports multiple normalization frameworks, including OCSF and ECS, so your security teams can work with normalized data from the start, enabling them to write stronger detection rules and uncover insights faster.
The benefits are speaking for themselves:
- simplifies data ingestion for your SIEM
- improves correlation and detection
- speeds up investigations
- decreases vendor lock-in and improves flexibility
Example: landing great data in Dynatrace
Many tools can push data through an HTTP API—but Axoflow goes further:
- Classification and parsing: Identifies and parses logs from hundreds of COTS products in real time, enabling effective noise reduction.
- Noise reduction before ingestion: Removes redundant events and duplicate fields so Grail queries run faster and cost less.
- Smart field mapping: Normalizes data into standard fields and attributes that Dynatrace can interrogate effectively—no more “dump it into content and pray.”
- Enriched identity tags: Cloud resource tags, Kubernetes metadata, device IDs, and dynamic labels arrive pre-mapped for filters, SLOs, and drill-down investigations.
To understand the process we will follow the journey of a raw log that we ingest into a destination.

Raw message
The legacy practice was to ingest the data as-it-is into your SIEM or Observability tool. If you do that you would give up the benefits of:
- Pre-filtering messages before ingestion and sending only relevant data to the SIEM. Remember, most analytics tools are priced by the ingested amount of data.
- Enriching your logs to give more context to your detection engineers.
- Fixup the data, for example, correct timezones, add missing fields, etc…
This is a log message from a Palo Alto Networks firewall.
<165>Sep 15 08:15:26 us-east-1-dc1-b-edge-fw 1,2025/09/15 08:15:26,007200001056,TRAFFIC,end,1,2025/09/15 08:15:26,192.168.41.30,192.168.41.255,10.193.16.193,192.168.41.255,allow-all,,,netbios-ns,vsys1,Trust,Untrust,ethernet1/1,ethernet1/2,To-Panorama,2025/09/15 08:15:26,8720,1,137,137,11637,137,0x400000,udp,allow,276,276,0,3,2025/09/15 08:15:26,2,any,0,2076598,0x0,192.168.0.0-192.168.255.255,192.168.0.0-192.168.255.255,0,3,0Classification
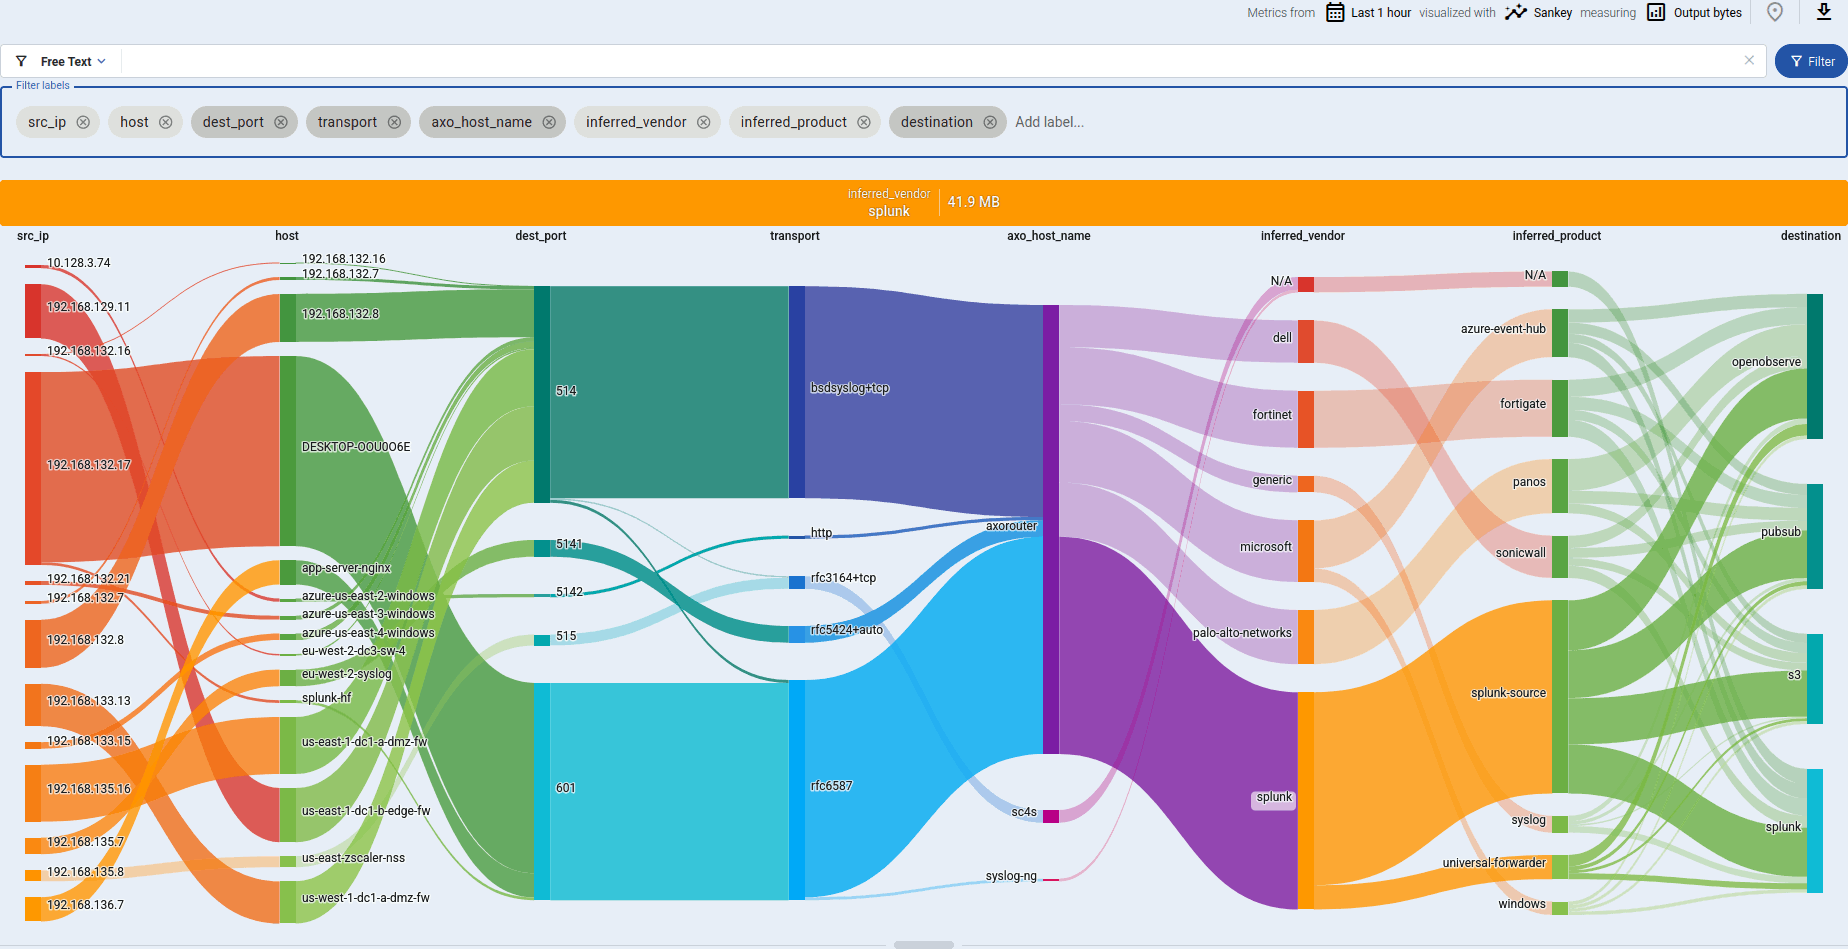
The first step is to identify the data. This simple yet not trivial step will help later on to start working on the content. Even classification (without doing any further steps) helps with ingestion, as many analytics tools only require you to send the raw data and the type of the log along with it. Axoflow does this out-of-the box for you, and moreover provides real-time analytics of all the data that travels through the system.
Parsing
Parsed messages give you access to the content of the message, for example, to the specific fields of the message text. However, parsing requires an understanding of the specific message, and is often left to the SIEM (think Splunk TAs). Most pipelines only provide you with tools so you can manually write your parsers, which is difficult and time-consuming.
Axoflow includes parsers for hundreds of COTS products, and those are maintained, updated, and extended by Axoflow. Say goodbye to manually figuring out which field means what. Parsing allows you to modify your data in a comfortable way, and makes normalization possible.
{
  "future_use1": "1",
  "received_time": "2025/09/15 08:15:26",
  "serial_number": "007200001056",
  "type": "TRAFFIC",
  "log_subtype": "end",
  "version": "1",
  "generated_time": "2025/09/15 08:15:26",
  "src_ip": "192.168.41.30",
  "dest_ip": "192.168.41.255",
  "src_translated_ip": "10.193.16.193",
  "dest_translated_ip": "192.168.41.255",
  "rule": "allow-all",
  "src_user": "",
  "dest_user": "",
  "app": "netbios-ns",
  "vsys": "vsys1",
  "src_zone": "Trust",
  "dest_zone": "Untrust",
  "src_interface": "ethernet1/1",
  "dest_interface": "ethernet1/2",
  "log_forwarding_profile": "To-Panorama",
  "future_use3": "2025/09/15 08:15:26",
  "session_id": "8720",
  "repeat_count": "1",
  "src_port": "137",
  "dest_port": "137",
  "src_translated_port": "11637",
  "dest_translated_port": "137",
  "session_flags": "0x400000",
  "protocol": "udp",
  "action": "allow",
  "bytes": "276",
  "bytes_sent": "276",
  "bytes_received": "0",
  "packets": "3",
  "start_time": "2025/09/15 08:15:26",
  "elapsed_time": "2",
  "http_category": "any",
  "future_use4": "0",
  "sequence_number": "2076598",
  "action_flags": "0x0",
  "src_location": "192.168.0.0-192.168.255.255",
  "dest_location": "192.168.0.0-192.168.255.255",
  "future_use5": "0",
  "packets_sent": "3",
  "packets_received": "0"
}
From now on it's trivial to filter data using the content of the message, for example, based on log type or IP address range.

Normalization
The normalized version of an event helps your security teams best in their detection and investigation, as it makes it easy to correlate events received from different vendors (or different devices).
At Axoflow, we create and maintain our normalization database using an AI-backed process supervised by our engineers, so development is rapid, while it maintains high-quality and consistency. And since Axoflow supports multiple normalization schemas (like OCSF and ECS), you can even send the same data to multiple destinations in the normalized format that the specific destination supports. Here's the earlier log message normalized to OCSF:
{
  "time": 1757924126000,
  "raw_data": "<165>Sep 15 08:15:26 us-east-1-dc1-b-edge-fw 1,2025/09/15 08:15:26,007200001056,TRAFFIC,end,1,2025/09/15 08:15:26,192.168.41.30,192.168.41.255,10.193.16.193,192.168.41.255,allow-all,,,netbios-ns,vsys1,Trust,Untrust,ethernet1/1,ethernet1/2,To-Panorama,2025/09/15 08:15:26,8720,1,137,137,11637,137,0x400000,udp,allow,276,276,0,3,2025/09/15 08:15:26,2,any,0,2076598,0x0,192.168.0.0-192.168.255.255,192.168.0.0-192.168.255.255,0,3,0",
  "src_endpoint": {
    "ip": "192.168.41.30",
    "name": "us-east-1-dc1-b-edge-fw",
    "uid": "007200001056",
    "port": 137,
    "type_id": 9,
    "zone": "Trust",
    "interface_name": "ethernet1/1"
  },
  "device": {
    "type_id": 9,
    "hostname": "us-east-1-dc1-b-edge-fw",
    "uid": "007200001056"
  },
  "metadata": {
    "profiles": [
      "host",
      "security_control"
    ],
    "product": {
      "vendor_name": "palo-alto-networks",
      "name": "panos"
    },
    "version": "1.6.0"
  },
  "activity_id": 6,
  "category_uid": 4,
  "class_uid": 4001,
  "type_uid": 400106,
  "severity_id": 1,
  "dst_endpoint": {
    "ip": "192.168.41.255",
    "port": 137,
    "type_id": 0,
    "zone": "Untrust",
    "interface_name": "ethernet1/2"
  },
  "traffic": {
    "bytes": 276,
    "bytes_in": 0,
    "bytes_out": 276,
    "packets": 3,
    "packets_in": 0,
    "packets_out": 3
  },
  "connection_info": {
    "protocol_name": "UDP",
    "direction": "Unknown",
    "direction_id": 0,
    "boundary": "External"
  },
  "disposition": "Allowed",
  "disposition_id": 1,
  "severity": "Informational"
}
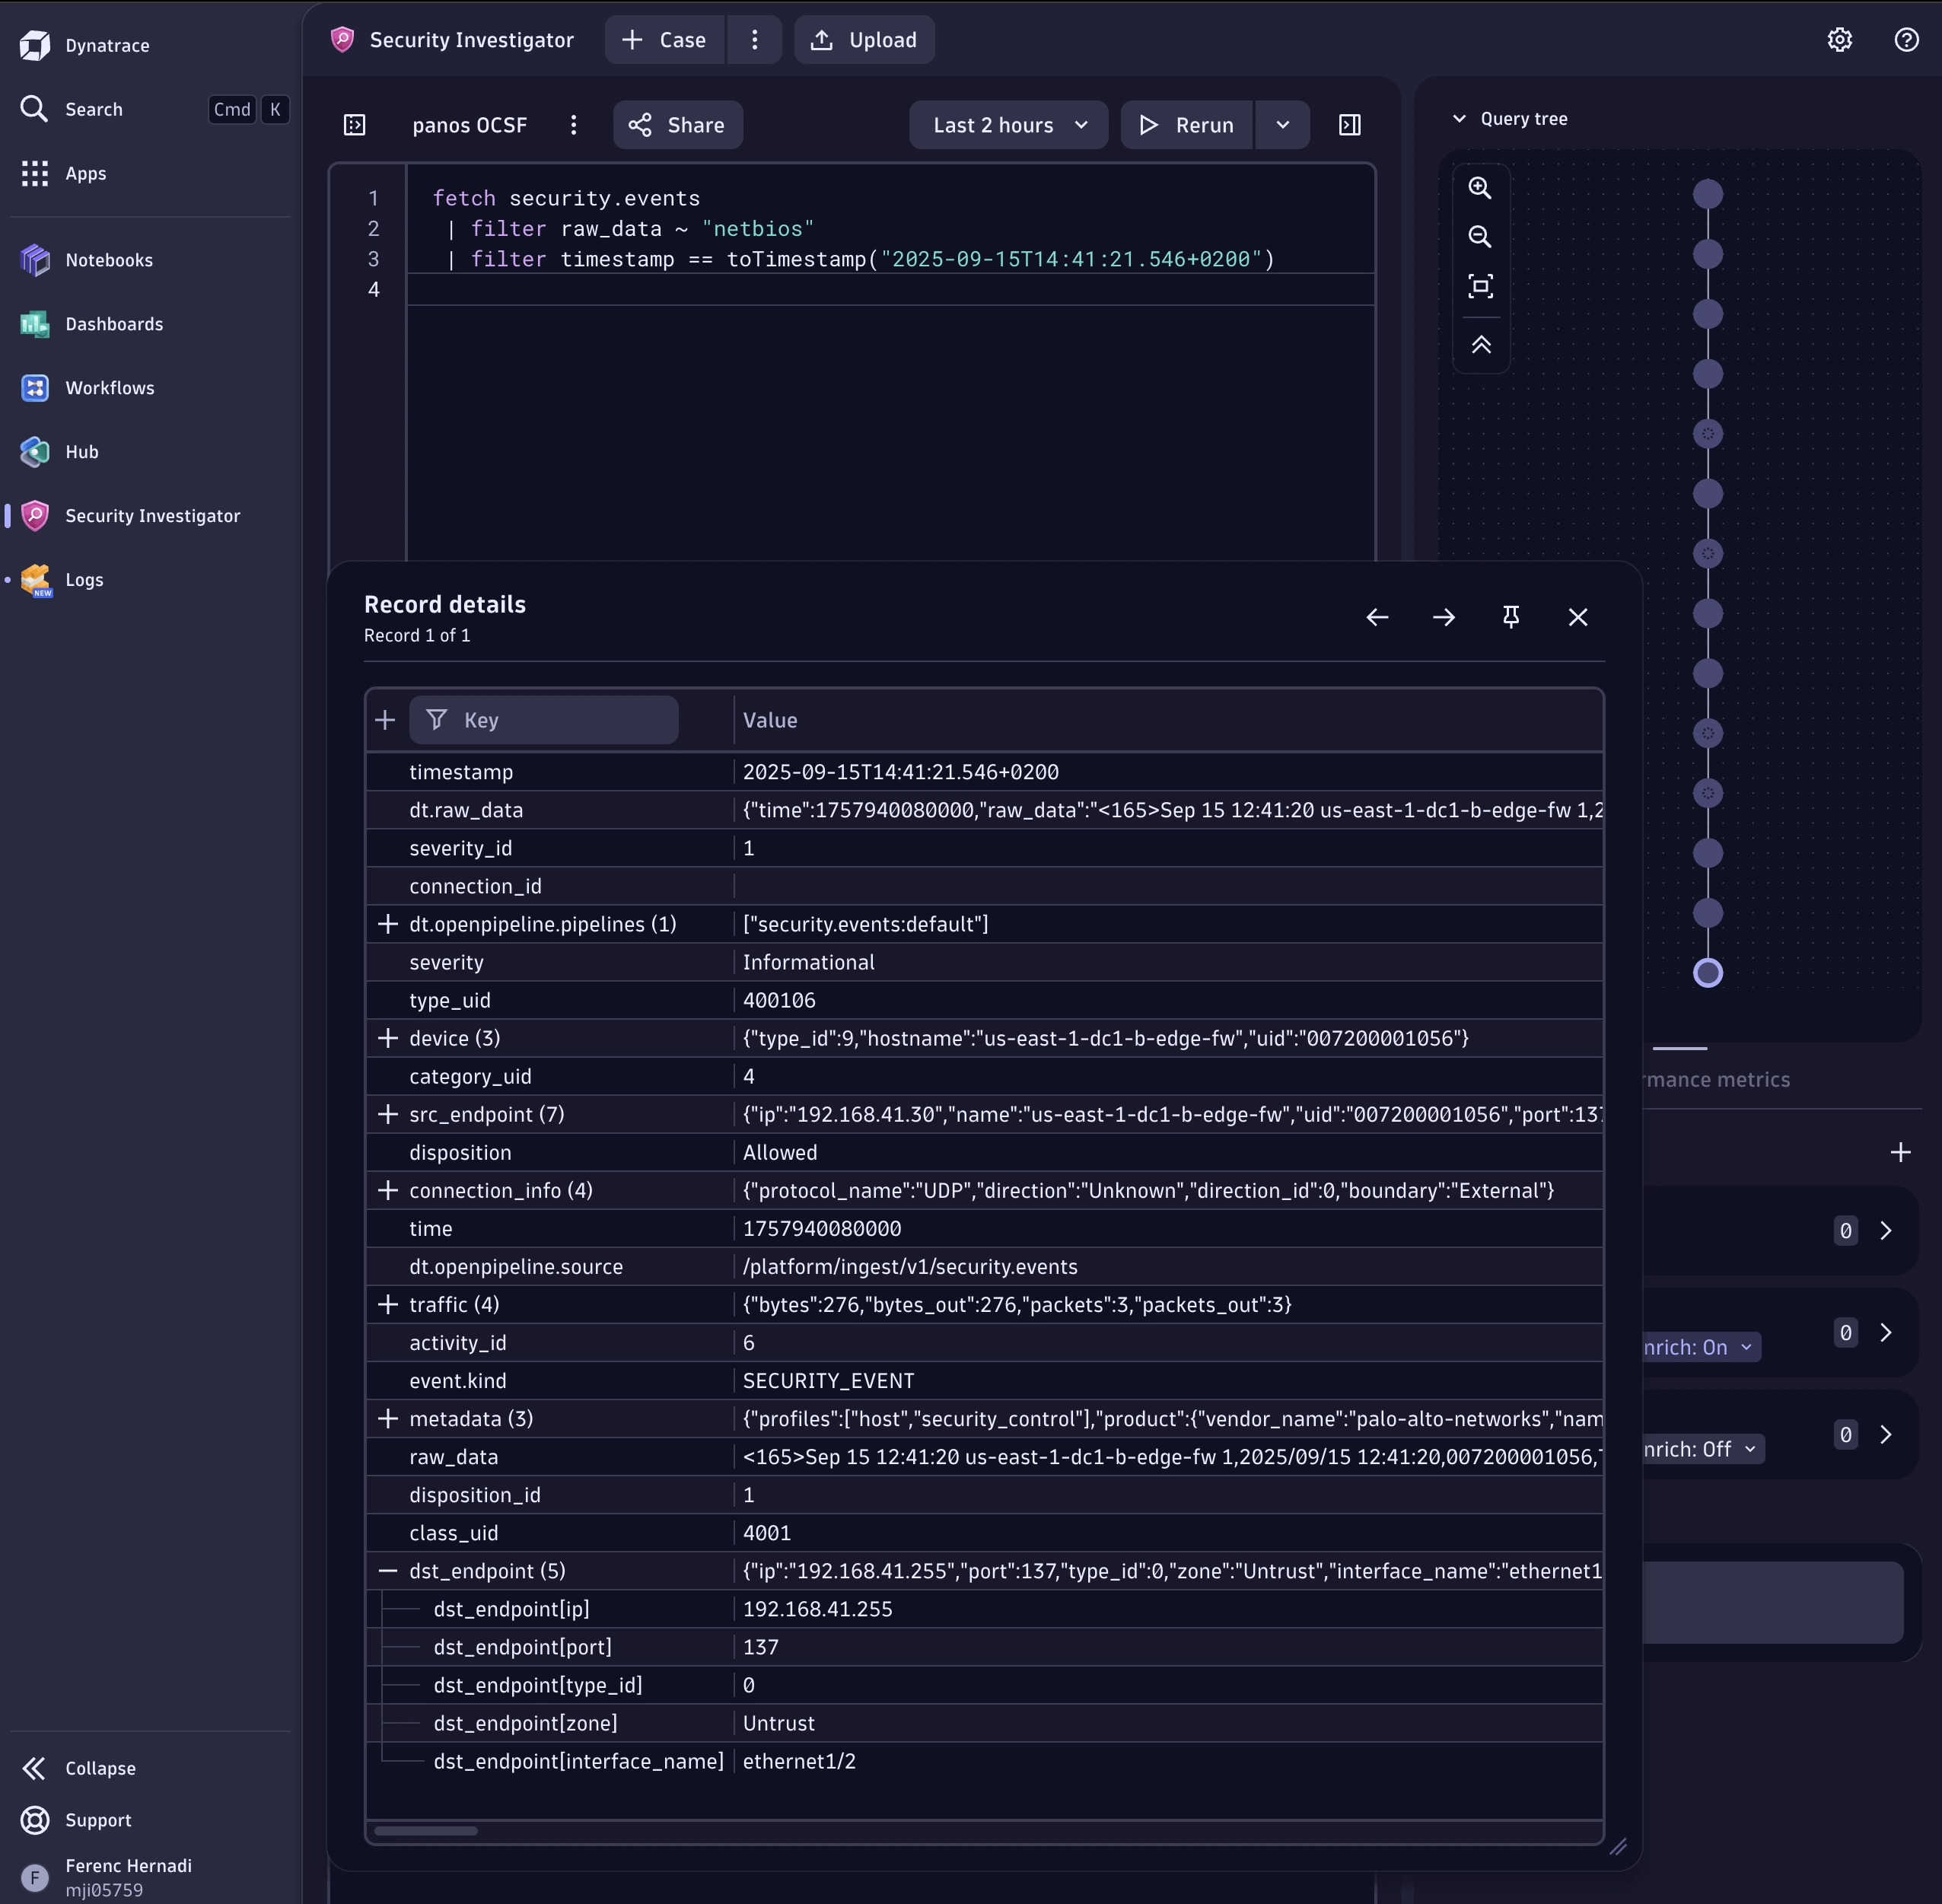
Destination-specific normalization
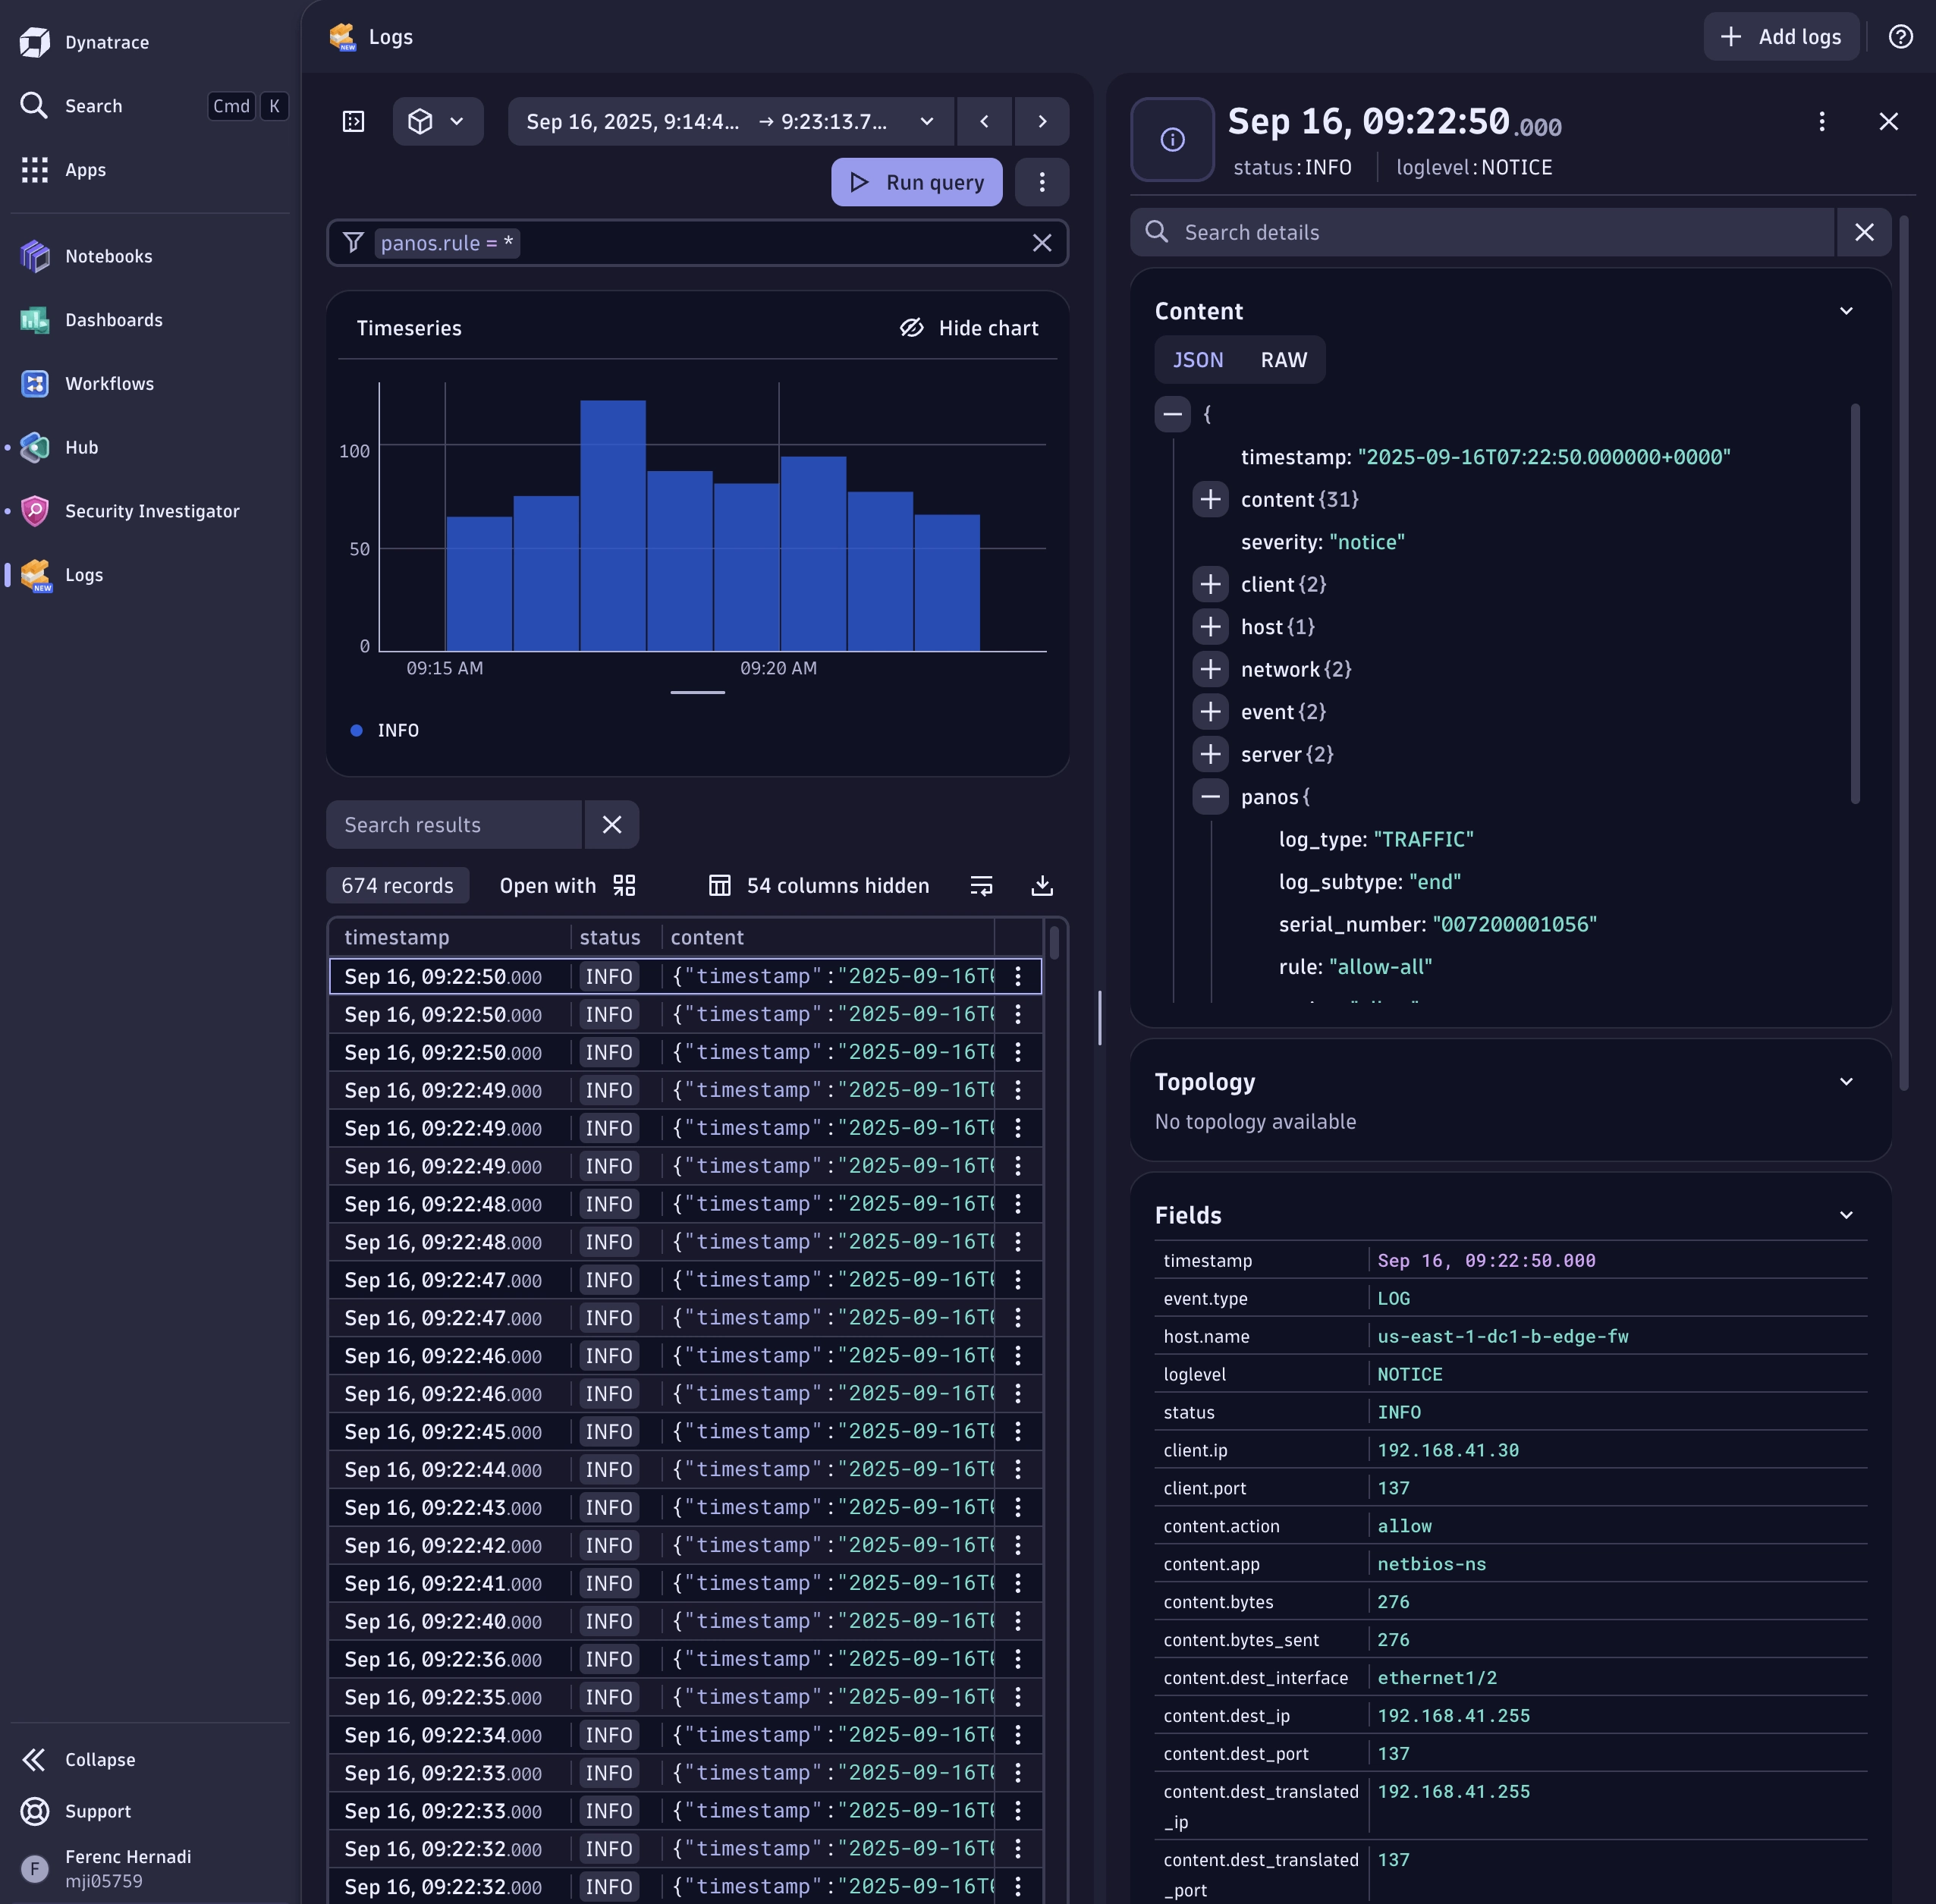
Dynatrace Grail uses a vendor-specific normalization format internally. Leveraging this format enables effective filtering and indexing in Dynatrace—for example, within the Security Inspector. Axoflow automatically maps your event data into this format, delivering true integration and support rather than simply dumping raw data.
Which format you should choose depends on your use case:
- If you use multiple destinations and want consistent formatting—such as aligning with AWS Security Lake—OCSF may be the better choice.
- If you prefer optimized indexing and storage performance within Dynatrace, opt for its native schema.
Here’s how a sample message looks in this format (note the vendor-specific sections at the end) and how it appears in the Security Inspector:
{
  "timestamp": "2025-09-15T08:15:26.000000+0000",
  "content": {
    "future_use1": "1",
    "received_time": "2025/09/15 08:15:26",
    "serial_number": "007200001056",
    "type": "TRAFFIC",
    "log_subtype": "end",
    "version": "1",
    "generated_time": "2025/09/15 08:15:26",
    "src_ip": "192.168.41.30",
    "dest_ip": "192.168.41.255",
    "src_translated_ip": "10.193.16.193",
    "dest_translated_ip": "192.168.41.255",
    "rule": "allow-all",
    "app": "netbios-ns",
    "vsys": "vsys1",
    "src_zone": "Trust",
    "dest_zone": "Untrust",
    "src_interface": "ethernet1/1",
    "dest_interface": "ethernet1/2",
    "log_forwarding_profile": "To-Panorama",
    "future_use3": "2025/09/15 08:15:26",
    "session_id": "8720",
    "repeat_count": "1",
    "src_port": "137",
    "dest_port": "137",
    "src_translated_port": "11637",
    "dest_translated_port": "137",
    "session_flags": "0x400000",
    "protocol": "udp",
    "action": "allow",
    "bytes": "276",
    "bytes_sent": "276",
    "bytes_received": "0",
    "packets": "3",
    "start_time": "2025/09/15 08:15:26",
    "elapsed_time": "2",
    "http_category": "any",
    "future_use4": "0",
    "sequence_number": "2076598",
    "action_flags": "0x0",
    "src_location": "192.168.0.0-192.168.255.255",
    "dest_location": "192.168.0.0-192.168.255.255",
    "future_use5": "0",
    "packets_sent": "3",
    "packets_received": "0"
  },
  "severity": "notice",
  "client": {
    "ip": "192.168.41.30",
    "port": 137
  },
  "host": {
    "name": "us-east-1-dc1-b-edge-fw"
  },
  "network": {
    "protocol": {
      "name": "udp"
    },
    "transport": "udp"
  },
  "event": {
    "kind": "INFRASTRUCTURE_EVENT",
    "provider": "PAN-OS"
  },
  "server": {
    "address": "192.168.41.255",
    "port": 137
  },
  "panos": {
    "log_type": "TRAFFIC",
    "log_subtype": "end",
    "serial_number": "007200001056",
    "rule": "allow-all",
    "action": "allow",
    "application": "netbios-ns",
    "virtual_system": "vsys1",
    "source_zone": "Trust",
    "destination_zone": "Untrust"
  }
}
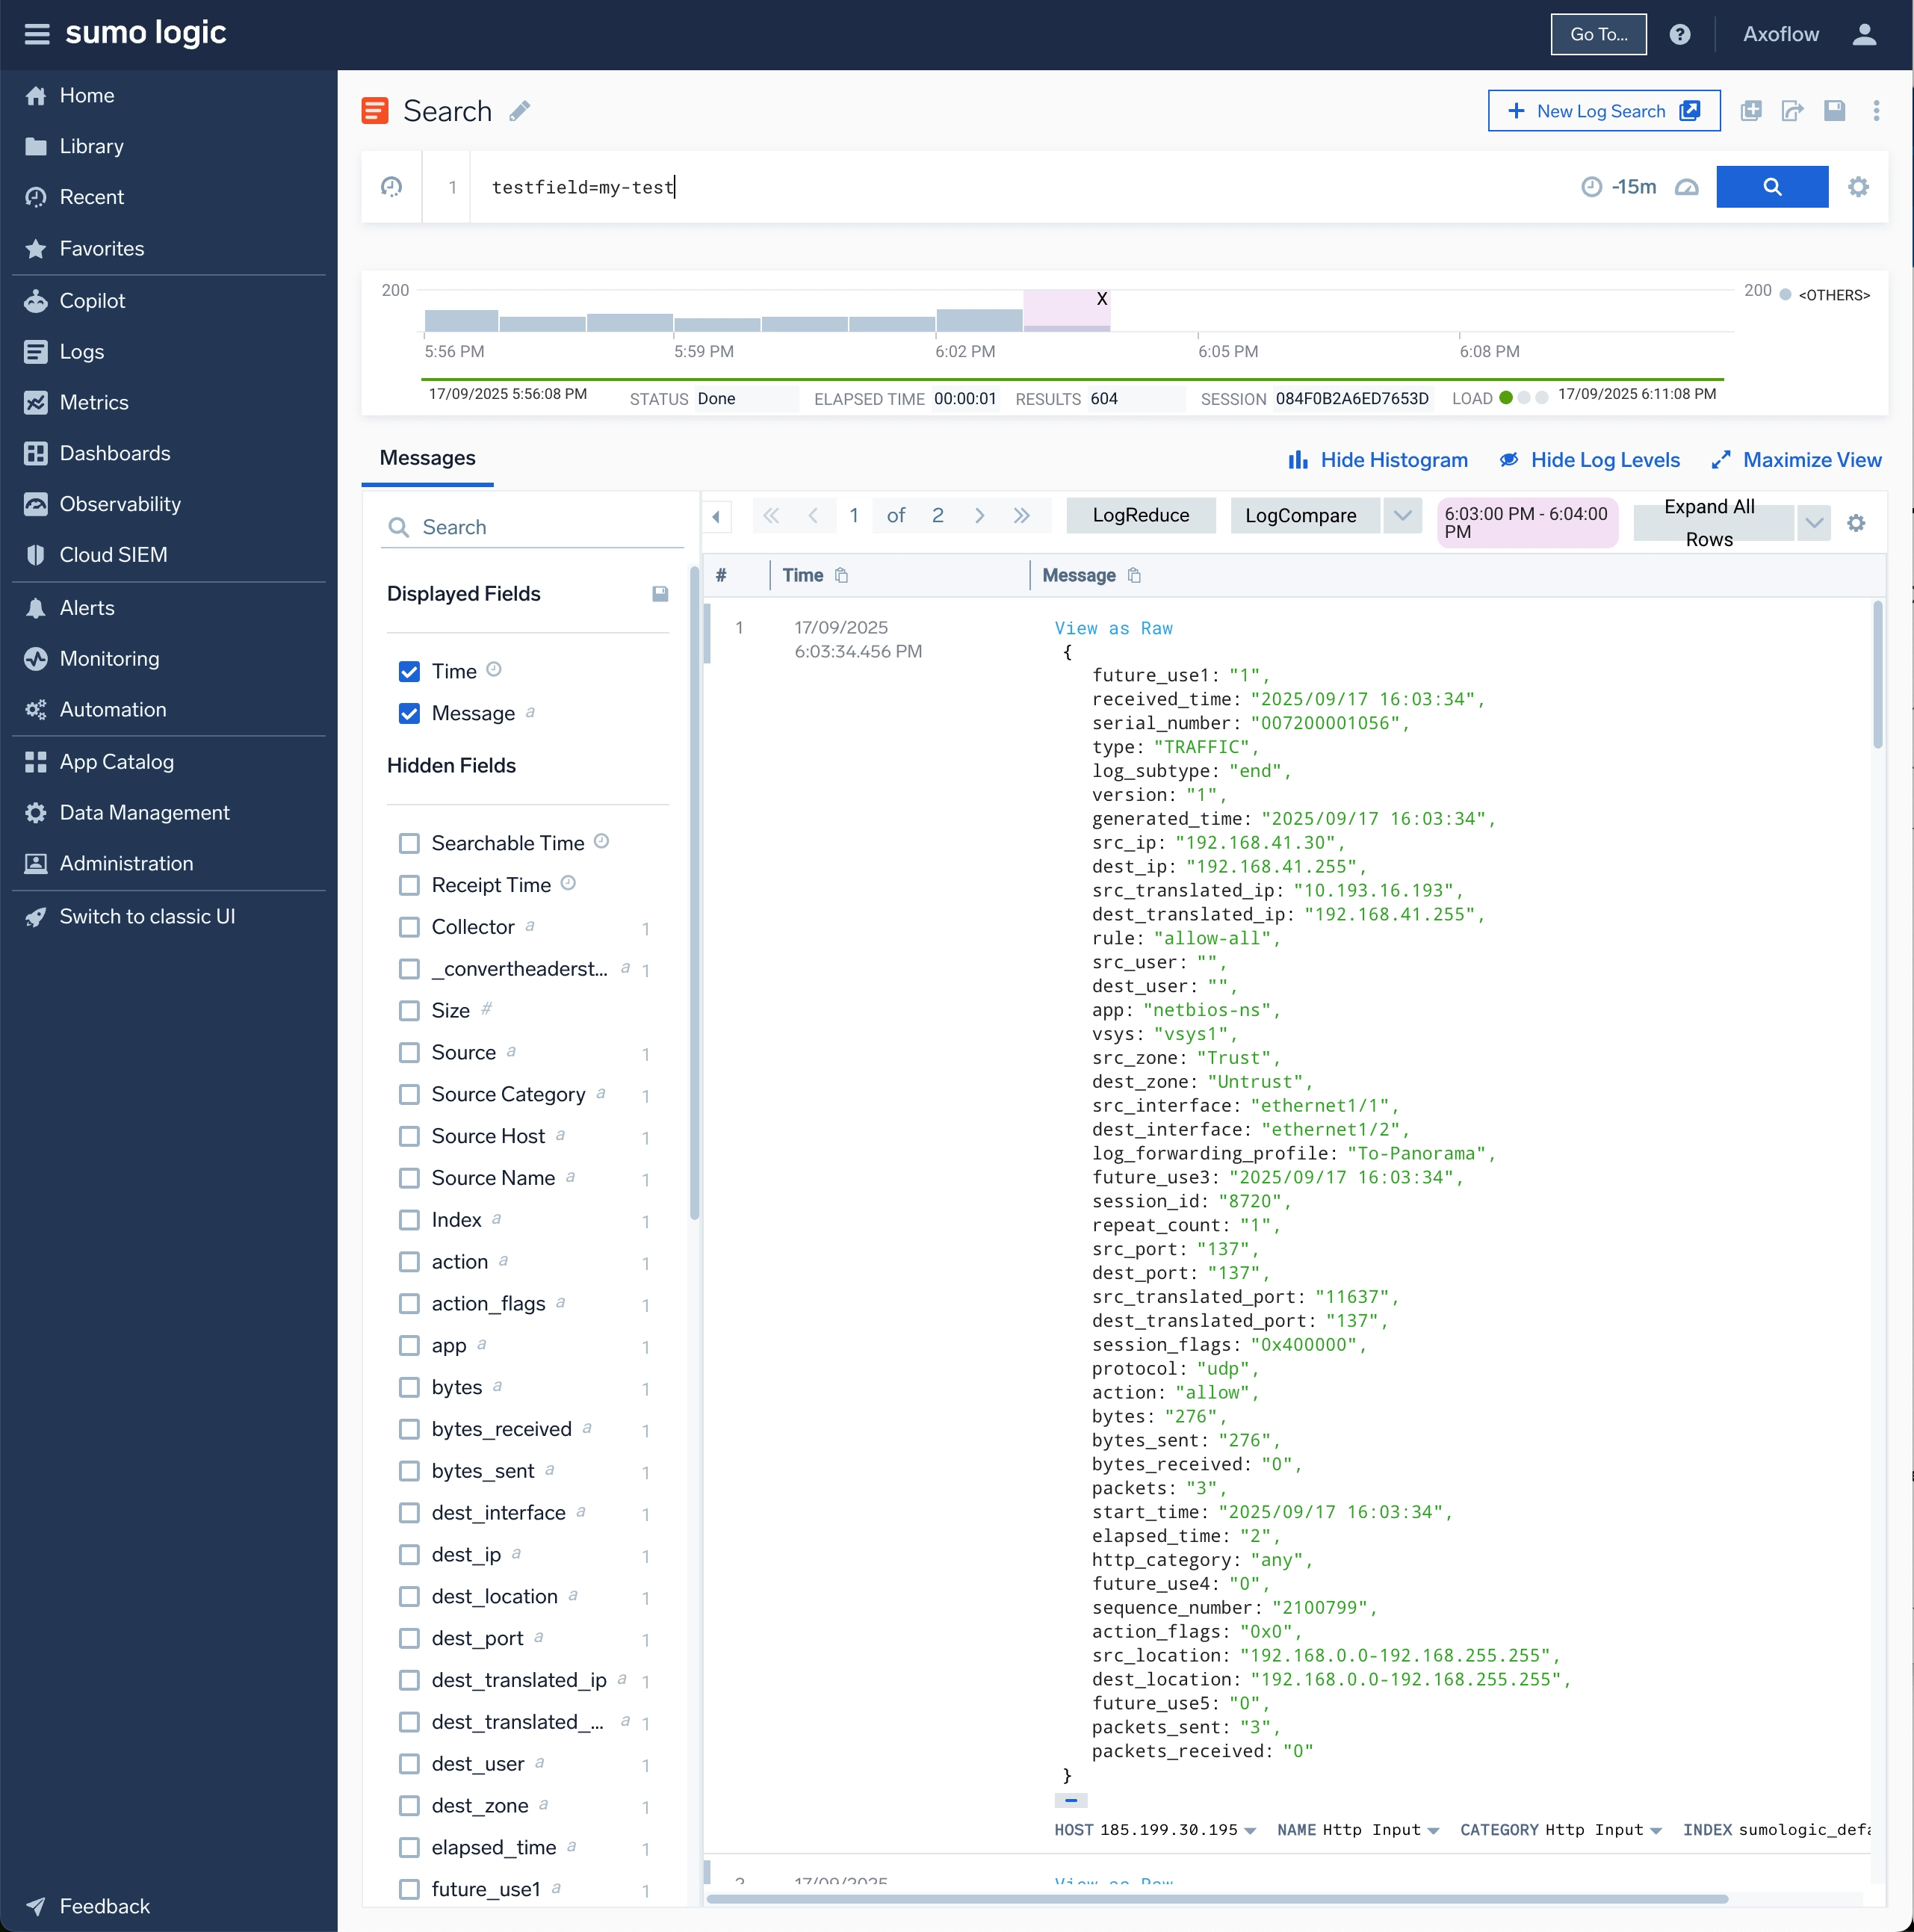
Sumo Logic integration
The other recent addition to our list of supported destinations is Sumo Logic. As we already explained the method in detail, we will just highlight the unique parameters in Sumo Logic. In a later blog post we will walk through an end-to-end example featuring Kubernetes log collection! There are a few handy “tricks” that make HTTP ingestion into Sumo both efficient and nicely labeled.
Map your labels to headers
Use these headers per request (apply to all lines in the batch):
X-Sumo-Category(maps to_sourceCategory)X-Sumo-Name(source name)X-Sumo-Host(host)X-Sumo-Fields: key1=value1,key2=value2 (for example,environment=dev,cluster=k8s) (custom fields/tags)
If you want to send arbitrary custom headers (like team:secops) and have Sumo turn them into fields automatically, enable Extended HTTP Metadata Collection by adding the field _convertHeadersToFields=true on the HTTP Source in Sumo Logic. Then any non-reserved header becomes a field. (Note: limit ~30 fields per HTTP request, length limits apply; Sumo drops unknown fields unless added to your Fields schema.)
Benefits of using Fields
- Attach searchable labels without inflating cost – for example,
environment,service,region. - Improve query performance – structured Fields make searches faster than relying on regex extraction at query time.
- Standardize log organization – consistent labels mean you can slice/dice logs by dimensions (like
env=prodorservice=api) without messy parsing. - Keep raw logs lean – you don’t need to bake all that context directly into each log line.
Batch and compress smartly
- Batch logs to ~100 KB–1 MB (pre-compression) per POST. This reduces request overhead and improves throughput.
- Compress payloads with
Content-Encoding: gzip(or zstd/deflate where supported) to cut bandwidth and speed up delivery. - Reuse connections and avoid lots of tiny requests; Sumo’s HTTP source isn’t designed for large numbers of concurrent connections—batch on a thread where possible.
Keep labels searchable (and cheap)
- Use Fields for search and indexing because Sumo Logic bills based on the request payload. With Fields, you can organize your logs using labels without adding to your costs. Pretty neat, right?
- Make sure the keys you send via
X-Sumo-Fieldsexist (and are enabled) in your Fields schema, otherwise Sumo drops them. Typical keys in a Kubernetes environment include:cluster, namespace, app, env.
Gotchas
- Don’t exceed field limits (30 per request; length limits apply).
- Reserved Sumo headers can’t be repurposed (
X-Sumo-Category,X-Sumo-Dimensions,X-Sumo-Fields,X-Sumo-Host,X-Sumo-Metadata,X-Sumo-Name,Webhook-AuthID,Webhook-ValidationCode, andx-amz-sns-topic-arn).
The Sumo Logic destination in Axoflow automatically takes care of all these things, so you don't have to. If you send me your exact sender you're using (Fluent Bit, syslog-ng, OTel Collector), I’ll drop in a ready-to-paste config that sets these headers and batching/compression knobs correctly.
Deep integration beats “copy-paste collectors”
A quick HTTP destination gets the demo green—but it leaves your SOC with brittle dashboards, skewed MTTR, and a ballooning bill. Deep integrations—like our out-of-box parsing and enrichment in AxoRouter—deliver cleaner, consistent, actionable data without you having to babysit parsers.
What you get out of the box with Axoflow:
- Data in the normalized format your SIEM/observability tool expects and likes best
- Less junk and noise (duplicates, malformed lines, overly-verbose fields)
- Safer operations (retries, DLQs, metrics for SREs)
- Fewer surprises when you dual-write and cut over between destinations
What’s new in Axoflow (and what it means for you)
We publish new integrations bi-weekly in Axoflow. The latest addition in this release is Dynatrace and Sumo Logic. That expands your options for routing the same, high-quality stream to where it’s most valuable—without re-plumbing agents or rewriting parsers. Whether you’re consolidating tools, piloting Dynatrace for logs, or keeping Splunk for specific workflows while shifting other analytics elsewhere, Axoflow makes the cutover controlled and measurable. For background on why we sweat data quality and automation so much, see our recent write-ups on cost reduction, SOC efficiency, duplication control, and secure, supported log and security data infrastructure.

Follow Our Progress!
We are excited to be realizing our vision above with a full Axoflow product suite.
Sign Me UpFighting data Loss?

Book a free 30-min consultation with syslog-ng creator Balázs Scheidler