This is the multi-page printable view of this section.
Click here to print.
Return to the regular view of this page.
Hosts
Axoflow collects and shows you a wealth of information about the hosts of your security data pipeline. Sources and edge hosts are listed on the Sources page, while AxoRouters are shown on the Routers page.
- Sources are hosts that are sending data to a data aggregator, like AxoRouter.
- Edges are source hosts that are running a collector agent managed by AxoConsole, or have an Axolet agent reporting metrics from the host.
1 - Find a host
To find a specific host, you have the following options:
-
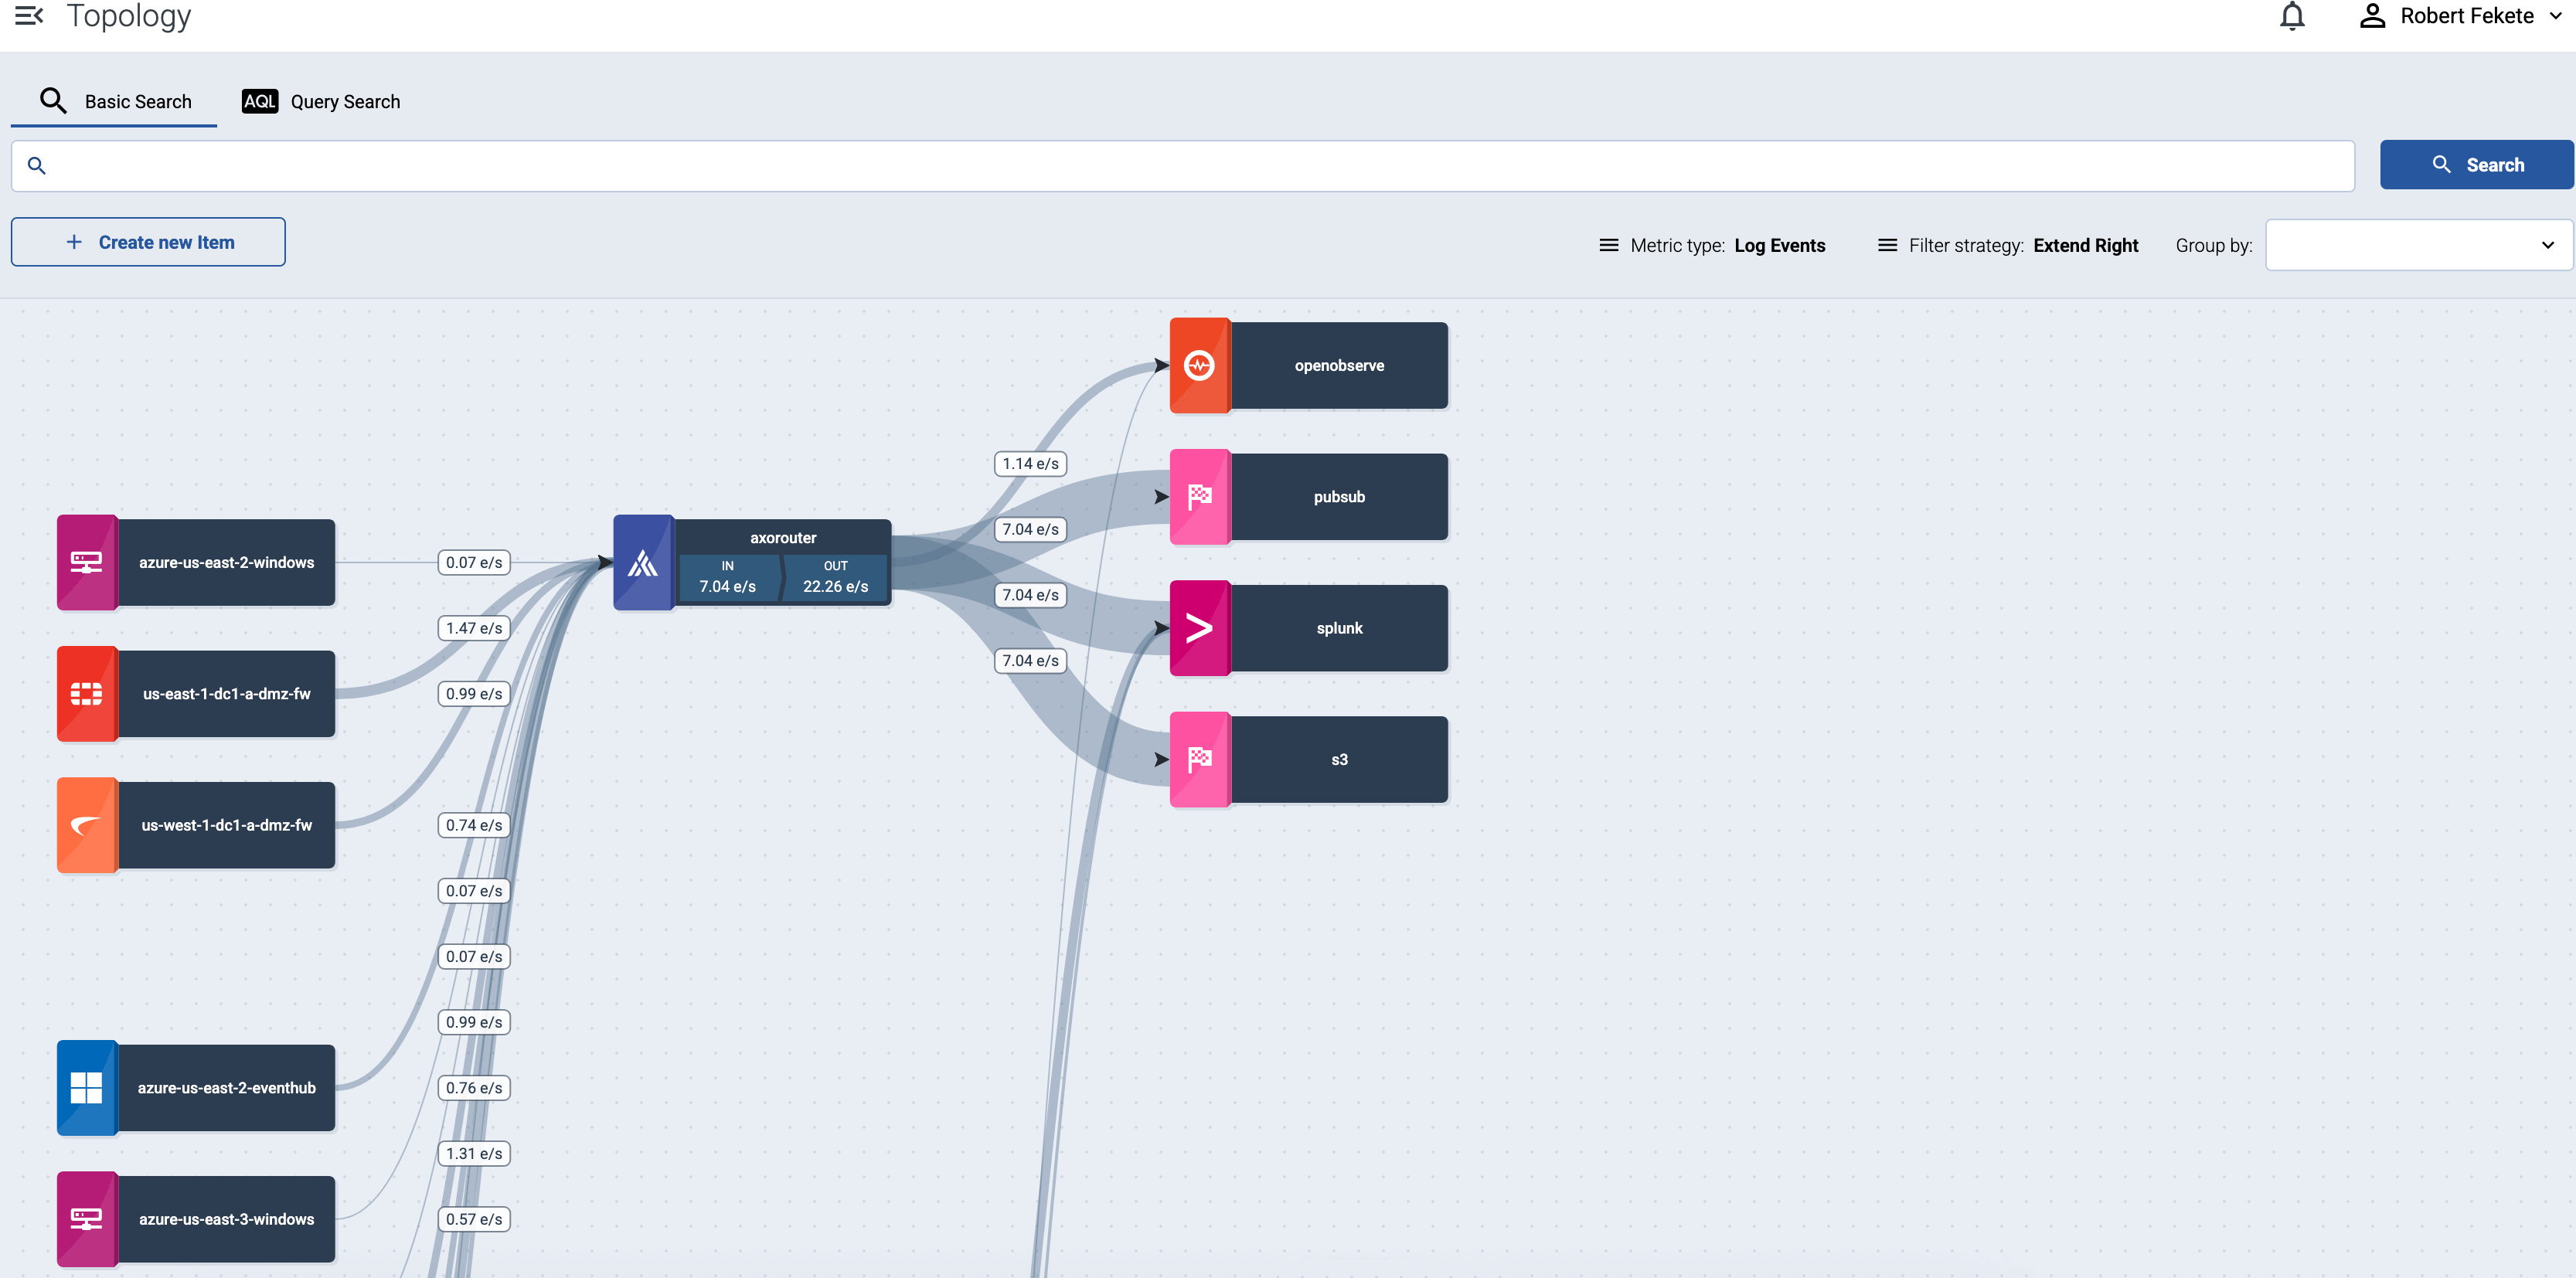
Open the Topology page, then click the name of the host you’re interested in. If you have many host and it’s difficult to find the one you need, use filtering, or grouping.
-
To find an AxoRouter, open the Routers page. To find a source or an edge host, open the Sources page.
To find or display only specific hosts, you can use the filter bar.
-
Free-text mode searches in the values of the following fields of the host: Name, IP Address, GUID, FQDN, and the labels of the host.
Basic Search is case insensitive. Adding multiple keywords searches for matches in any of the previous fields. This is equivalent to the @ANY =* keyword1 AND @ANY =* keyword2 AQL query.
-
AQL Expression mode allows you to search in specific fields or the labels of the hosts.
It also makes more complex filtering possible, using the Equals, Contains (partial match), and Match (regular expression match) operators. Note that:
- To execute the search, click Search, or hit ESC then ENTER.
- AxoConsole autocompletes the built-in and custom labels and field names, as well as their most frequent values, but doesn’t autocomplete labels and variables created by data parsing and processing steps.
- You can use the AND and OR operators to combine expressions, and also parenthesis if needed. For details on AQL, see AQL operator reference.
- The precedence of the operators is the following: parentheses, AND, OR, comparison operators.
- Use the usual keyboard shortcuts to undo (⌘/Ctrl + Z) or redo (⌘/Ctrl + Shift + Z) your edits.
For details about the message schema and the available fields, see Message schema reference.
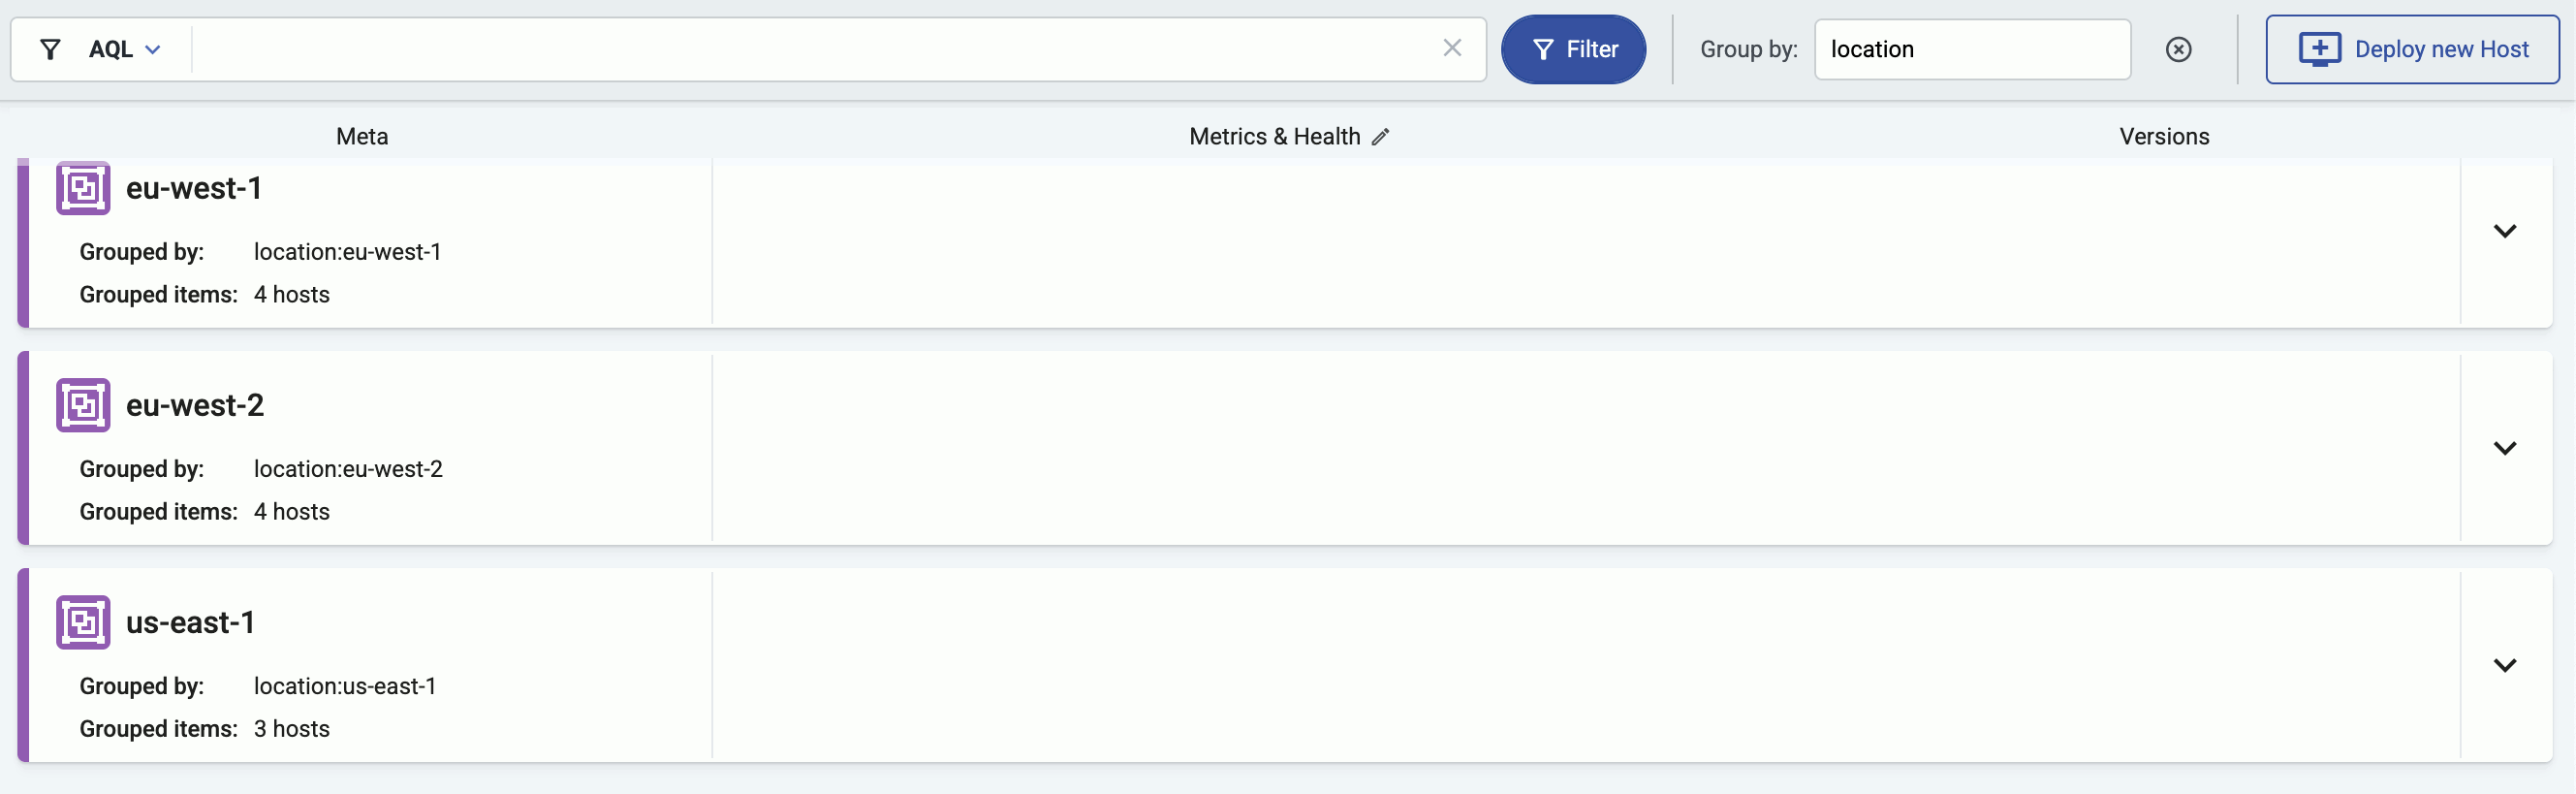
You can also select one or more features (for example, label.location) to group hosts by in the Group by field. For details on how grouping works, see Grouping hosts.
2 - Host information
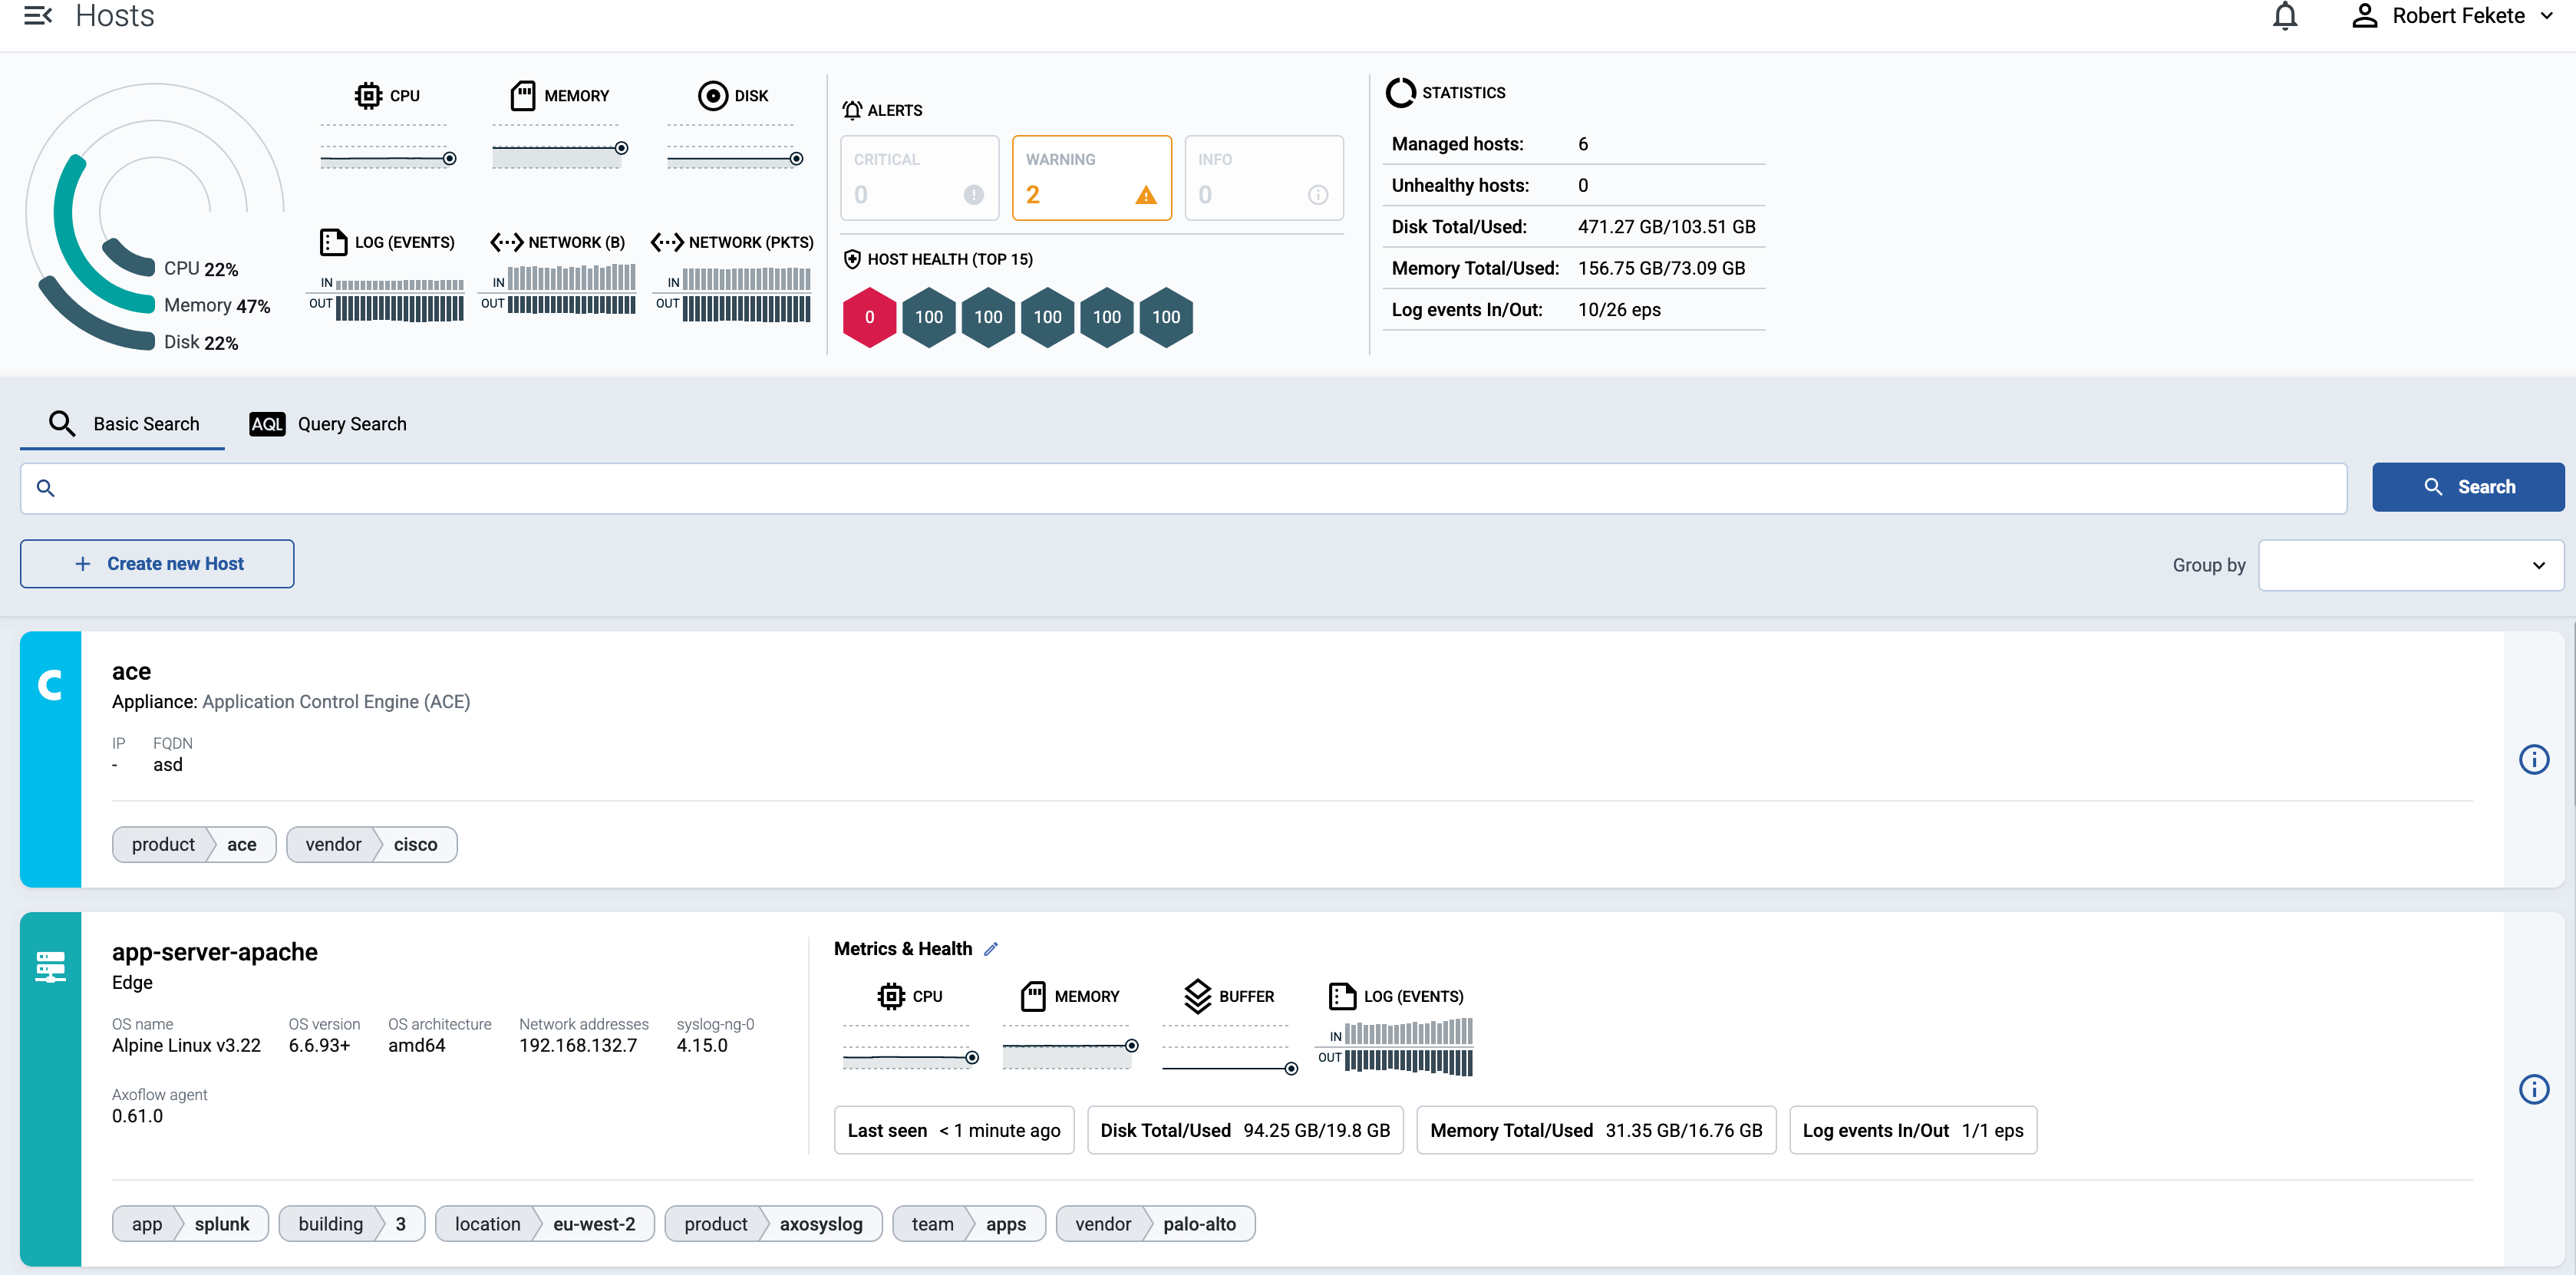
AxoConsole provides a quick overview of every data source and edge host on the Sources page, and AxoRouter on the Routers page. The exact information depends on the type of the host: hosts managed by Axoflow provide more information than external hosts.
The following information is displayed:
- Hostname or IP address
- Metadata labels. These include labels added automatically during the Axoflow curation process (like product name and vendor labels), as well as any custom labels you’ve assigned to the host.
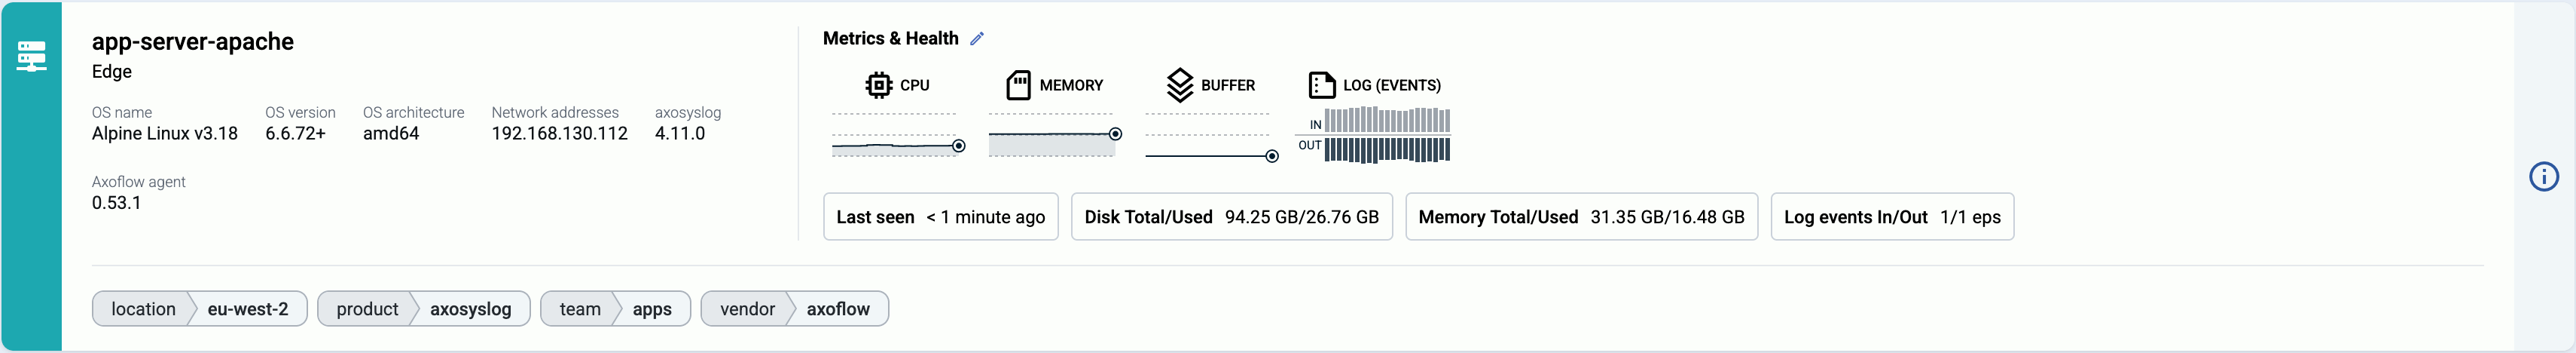
For edge hosts (hosts that have the Axoflow agent (Axolet) installed):
- The version on the agent
- The name and version of the log collector running on the host (for example, AxoSyslog or Splunk Connect for Syslog)
- Operating system, version, and architecture
- When AxoConsole has last received metrics from the host
- Resource information: CPU and memory usage, disk buffer usage. Click on a resource to open its resource history on the Metrics & health page of the host.
- Traffic information: volume of the incoming and outgoing data traffic on the host.
- Cloud-related labels: If the host is running in the cloud, the provider, region, zone labels are automatically available.
- An indicator if there are any active alerts on the host.
For more details about the host, select the hostname, or click ⋮.
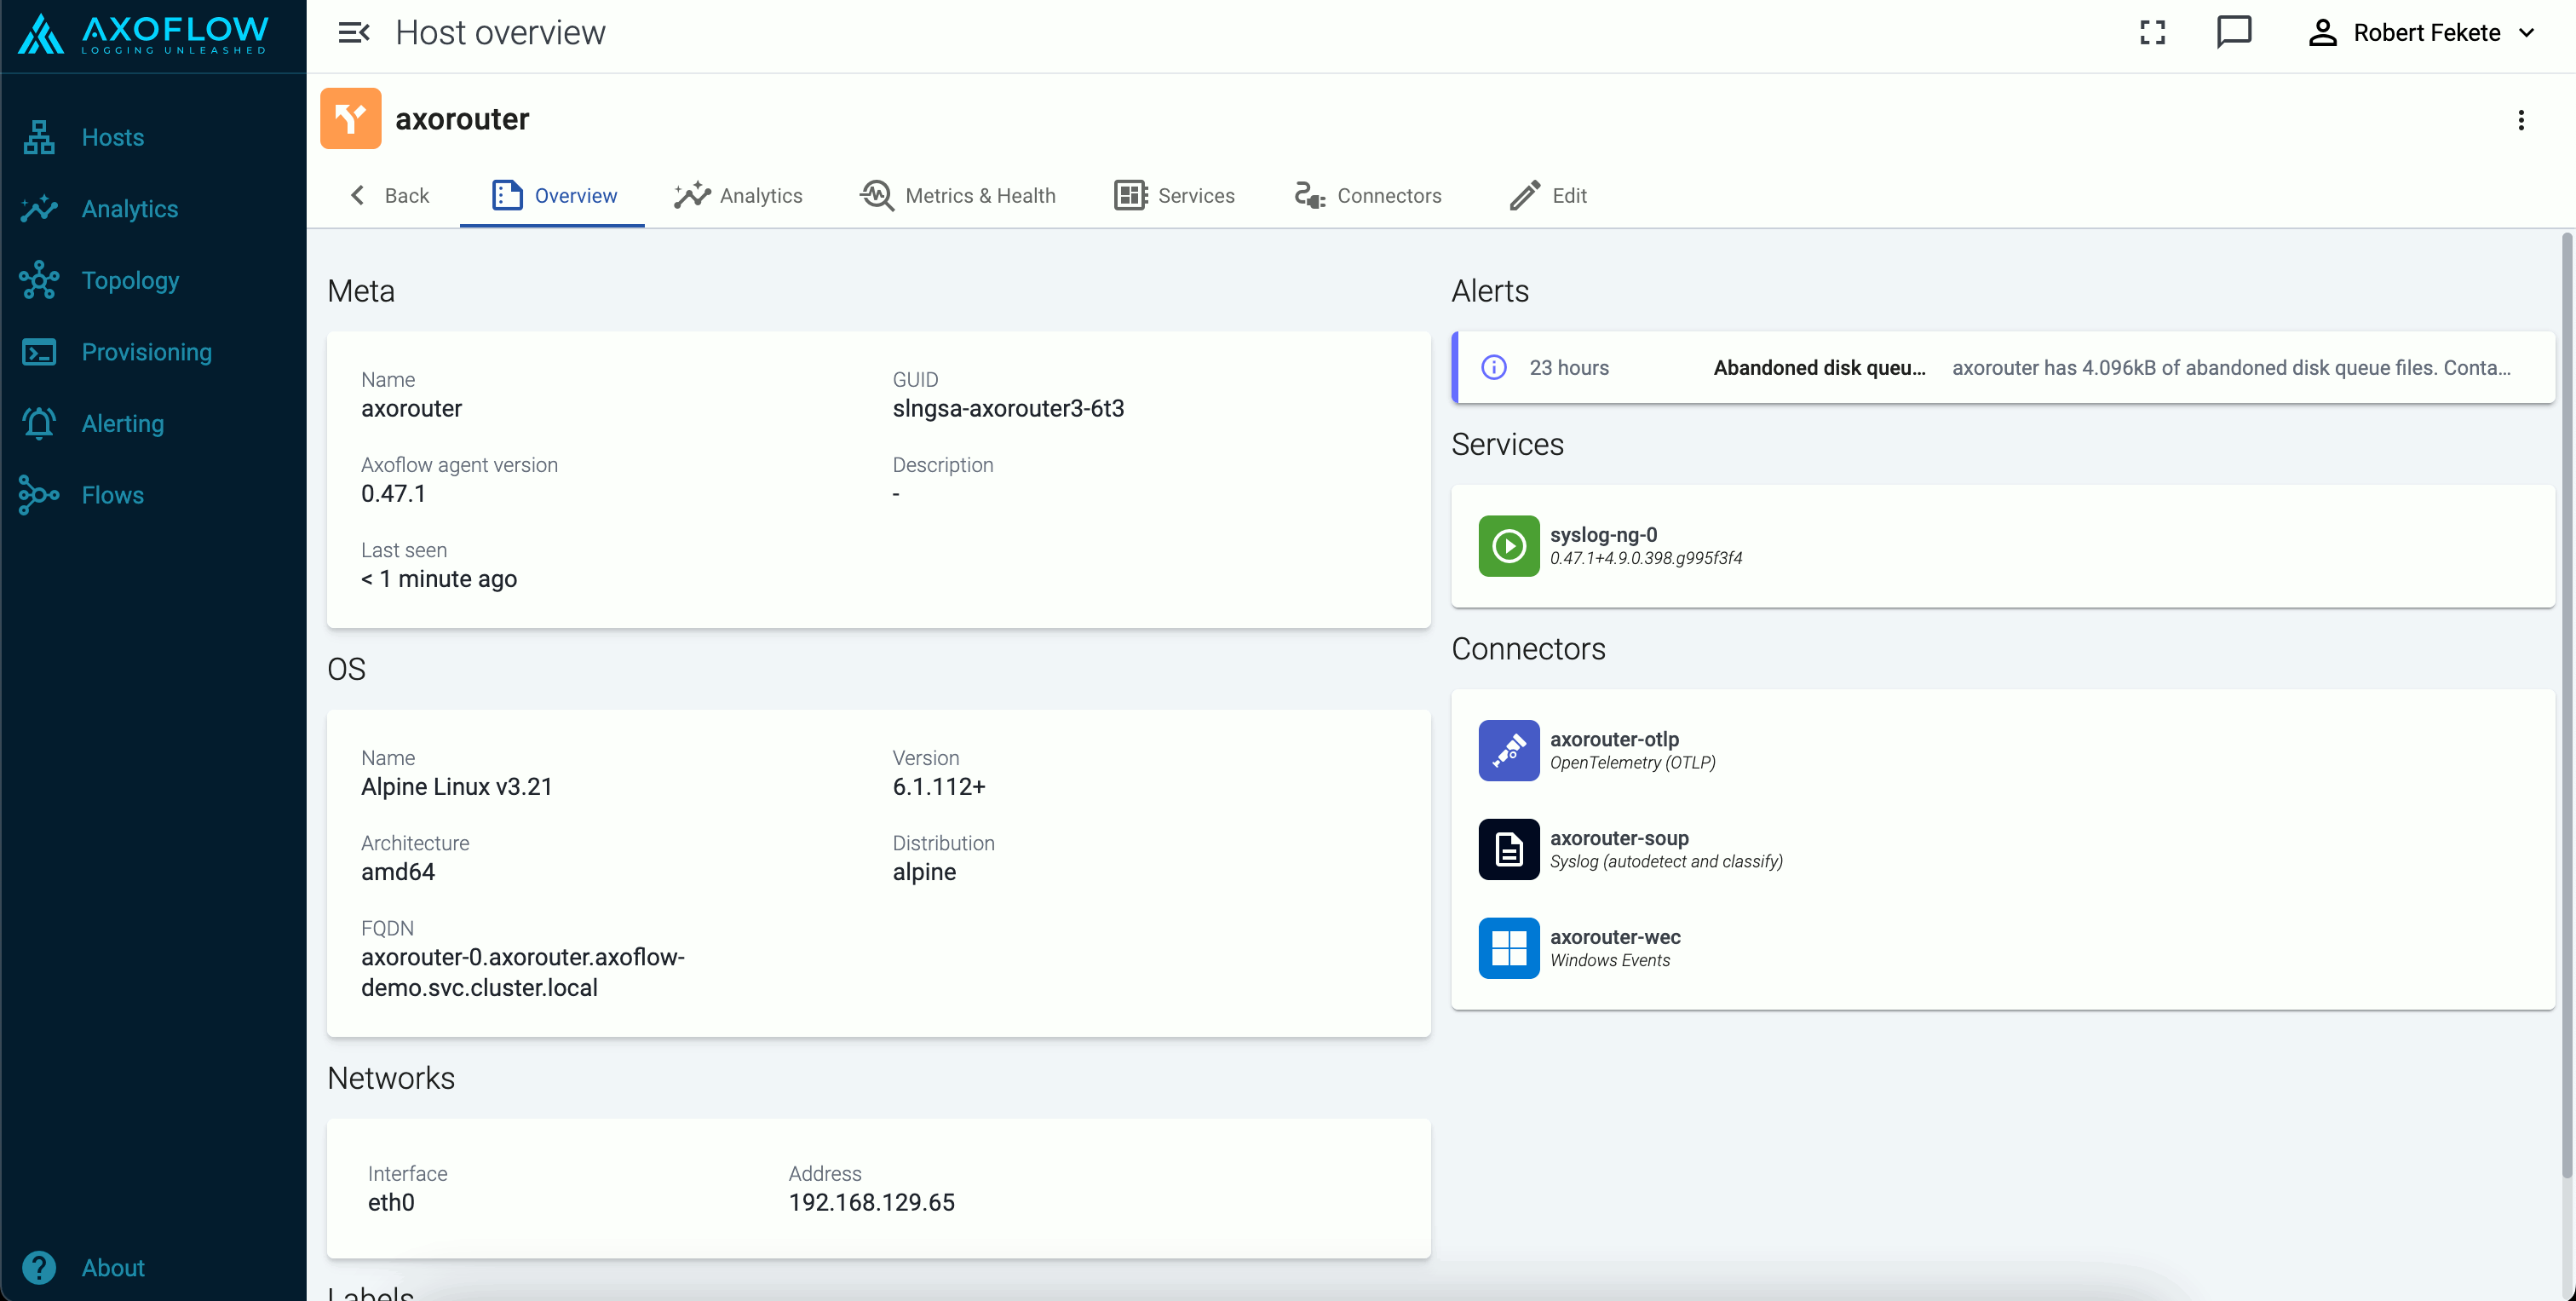
The host Overview page gives a quick overview of the host, including the Services, any active Alerts, and the Connectors and Stores available on AxoRouter hosts.
You can also access host-specific Analytics and Metrics.
3 - Custom labels and metadata
To add custom labels to a host, complete the following steps. Note that these are static labels. To add labels dynamically based on the contents of the processed data, use processing steps in data flows.
-
Find the host on the Topology page, and click on its hostname. The overview of the host is displayed. (Alternatively, you can find AxoRouters on the Routers page, and source and edge hosts on the Sources page.)
-
Select Edit.
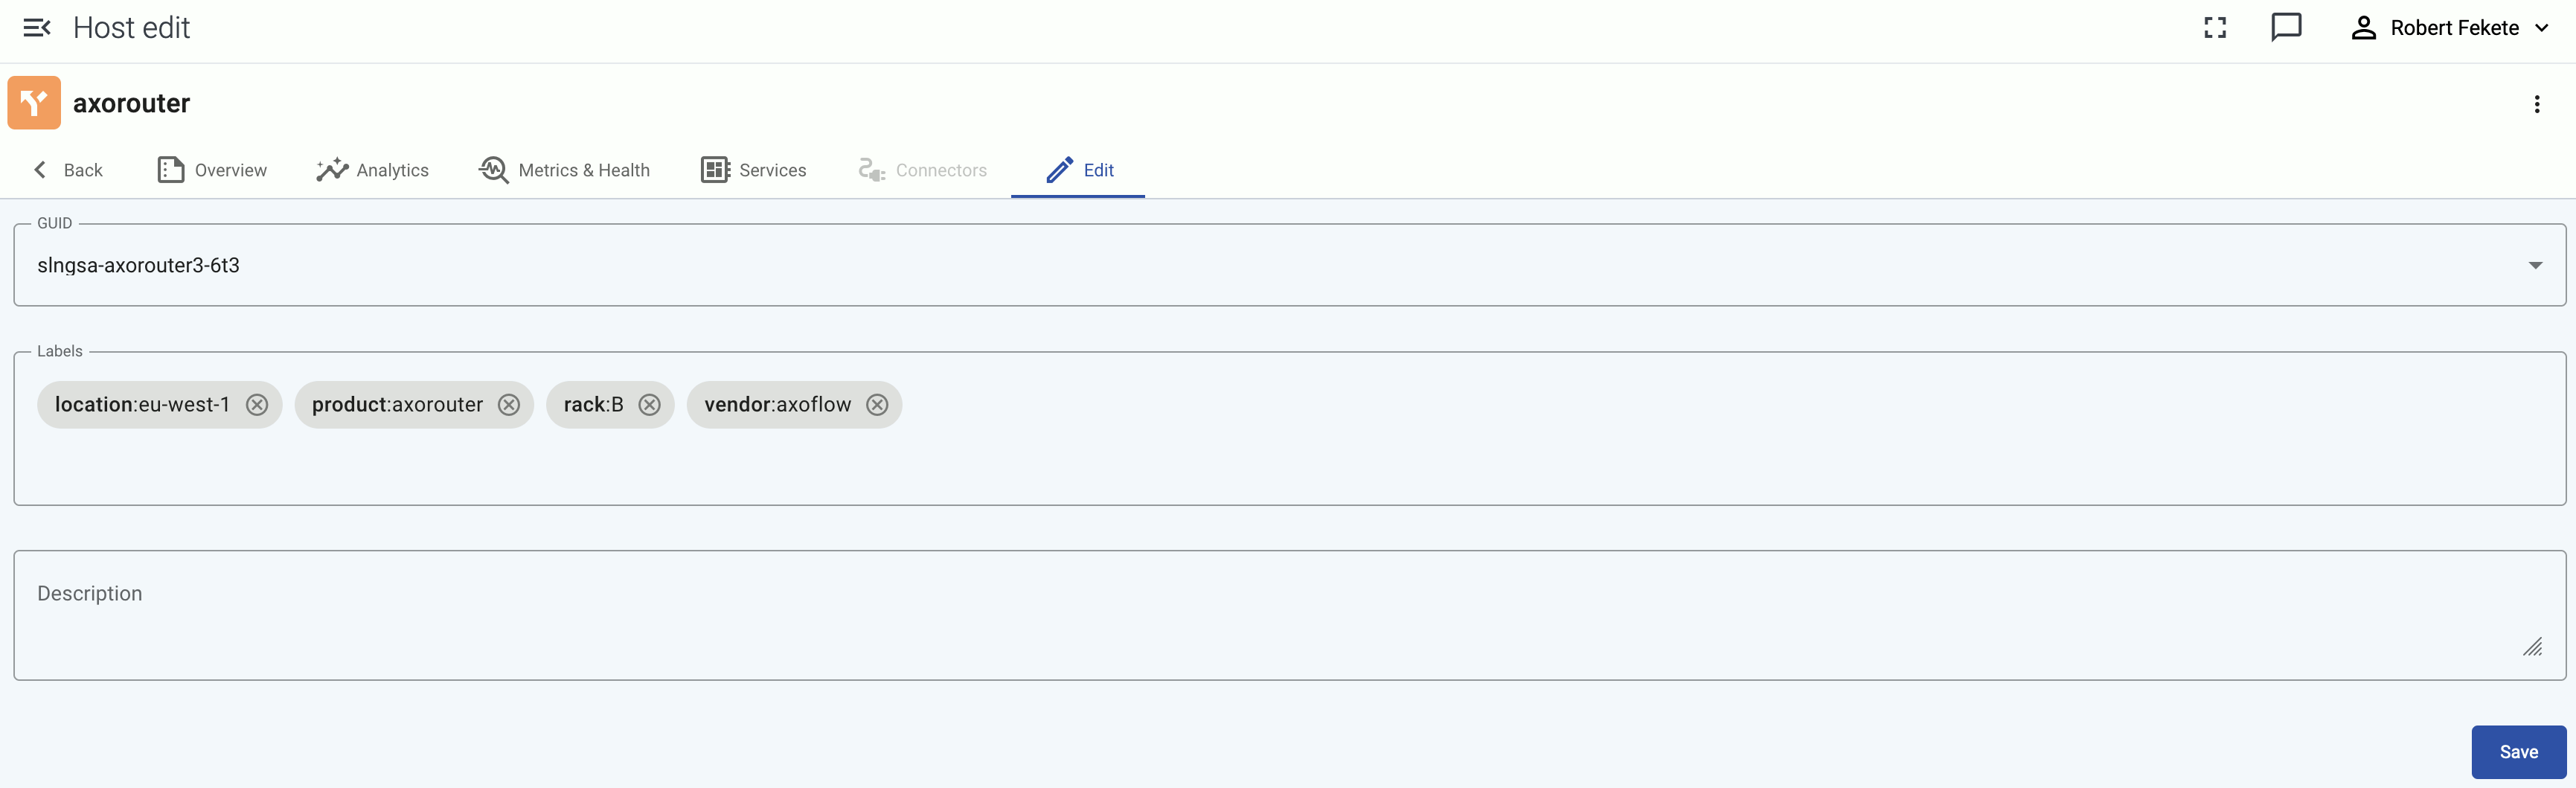
You can add custom labels in <label-name>:<value> format (for example, the group or department a source device belongs to), or a generic description about the host. You can use the labels for quickly finding the host on the Hosts page, and also for filtering when configuring Flows.
When using labels in filters, processing steps, or search bars, note that:
- Labels added to AxoRouter hosts get the
axo_host_ prefix.
- Labels added to data sources get the
host_ prefix. For example, if you add a rack label to an edge host, it’ll be added to the data received from the host as host_rack.
- Labels added on edge hosts get the
edge_connector_label_ prefix.
On other pages, like the Host Overview page, the labels are displayed without the prefixes.
-
Select Save.
4 - Services
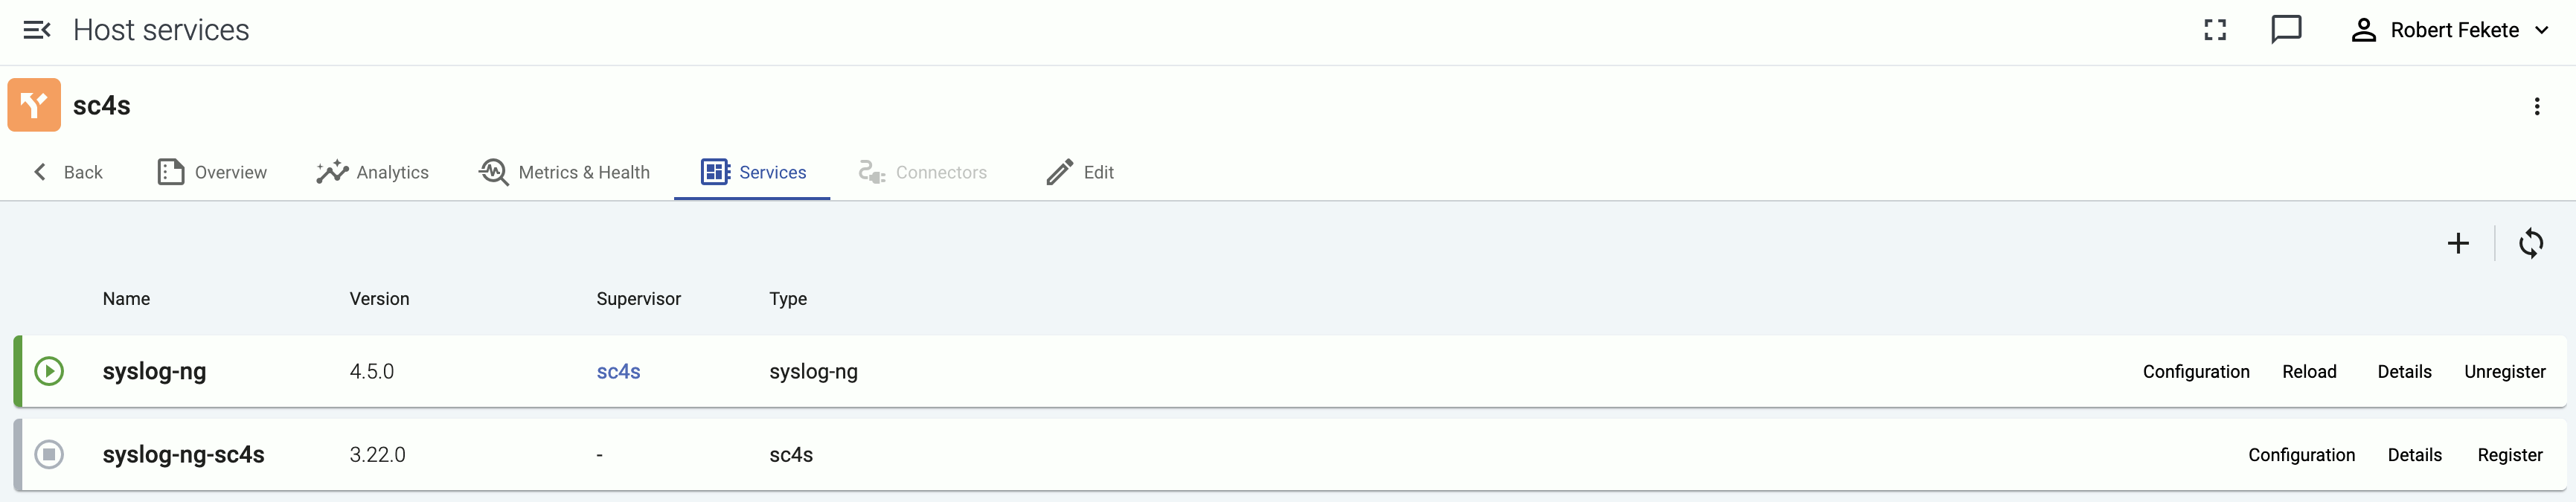
The Services page of an AxoRouter or edge host shows information about the data collector or router services running on the host. This page is only available for managed pipeline elements.
The following information is displayed:
- Name: Name of the service
- Version: Version number of the service
- Type: Type of the service (which data collector or processor it’s running), for example,
axorouter-syslog, axorouter-wec, or axostore
- Supervisor: The type of the supervisor process. For example, Splunk Connect for Syslog (
sc4s) runs a syslog-ng process under the hood.
Icons and colors indicate the status of the service: running, stopped, or not registered.
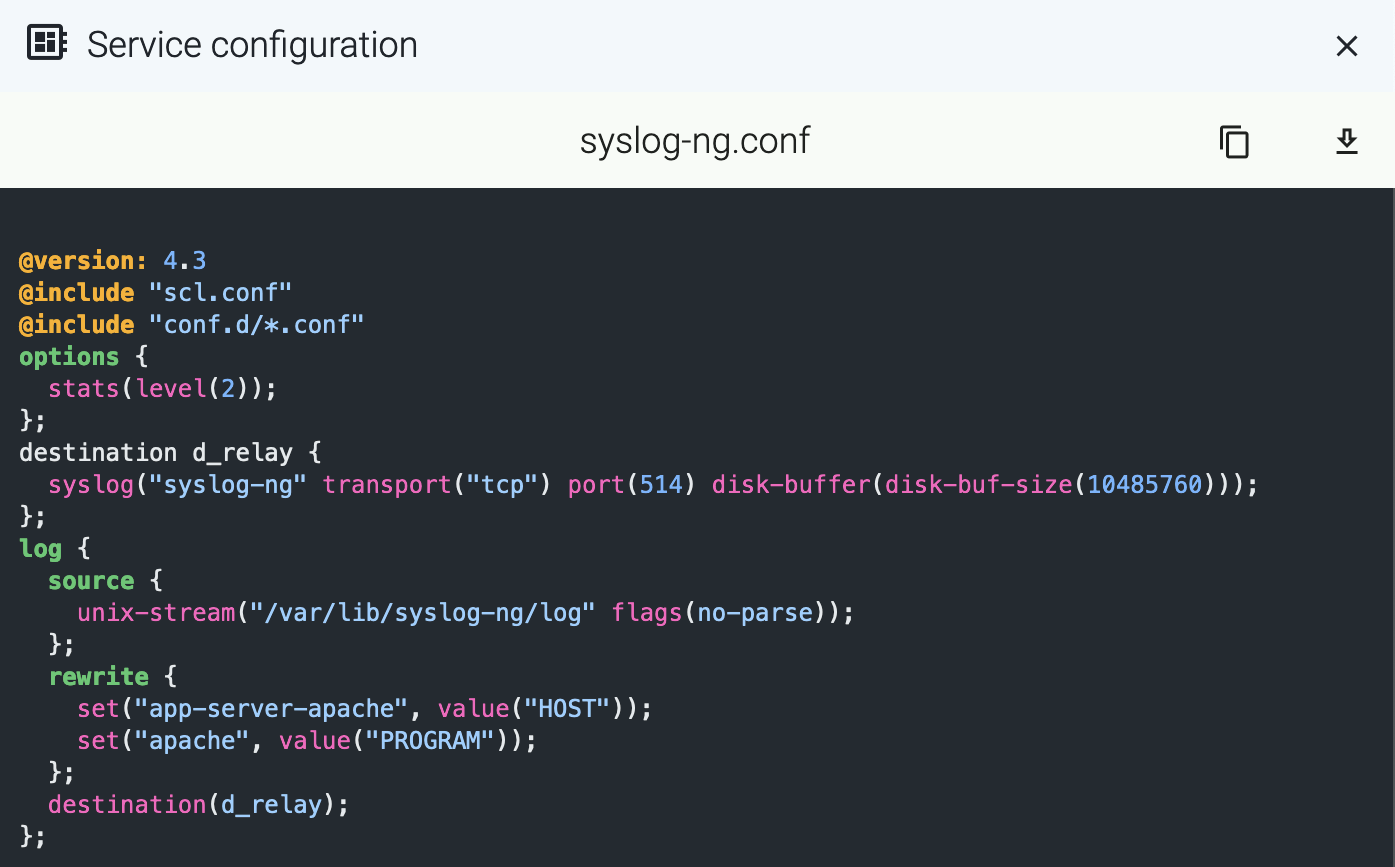
Service configuration
To check the configuration of the service, select Configuration. This shows the list of related environment variables and configuration files. Select a file or environment variable to display its value. For example:
To display other details of the service (for example, the location of the configuration file or the binary), select Details.
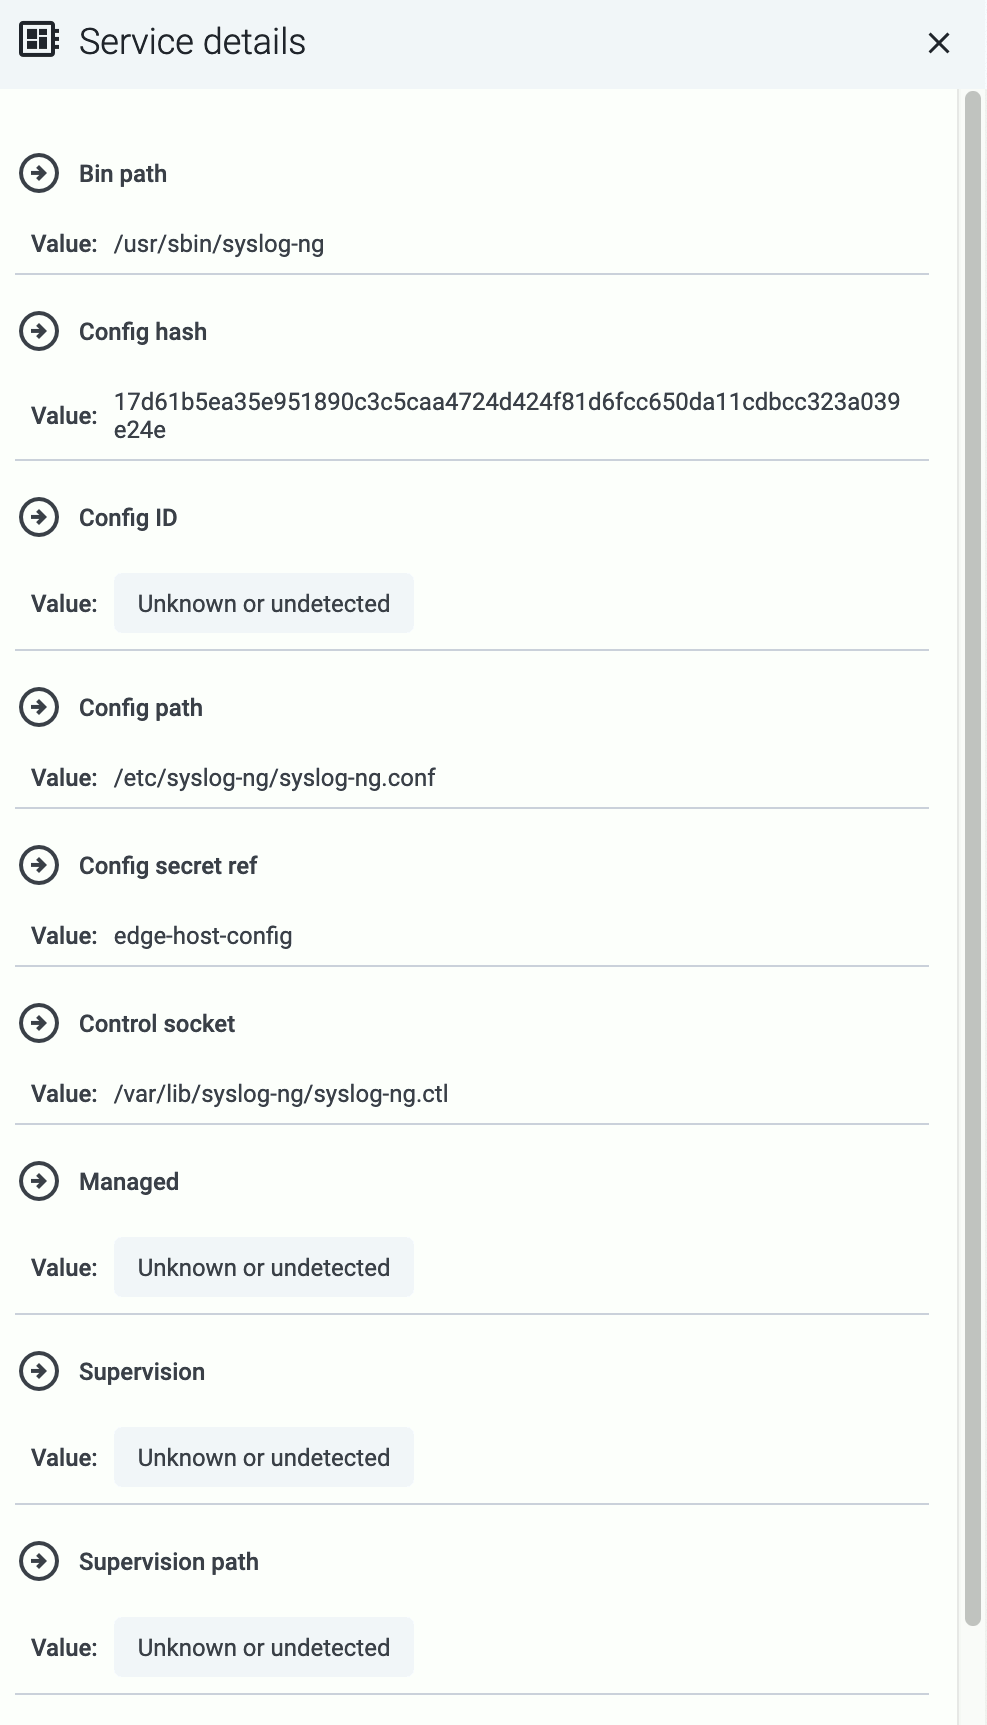
Manage service
- To reload a registered service, select Reload.
- To restart a registered service, select Restart.
Register service manually
If Automatic service registration is disabled, or the service discovery is unable to find a running service, you can register it manually by specifying:
- the service’s control socket path, or
- the name of its managing systemd unit.
To register a service manually, complete the following steps.
-
Find the host and open its Services page.
-
Select Register static service.
-
Enter a name for the service. This name will be displayed in the services list.
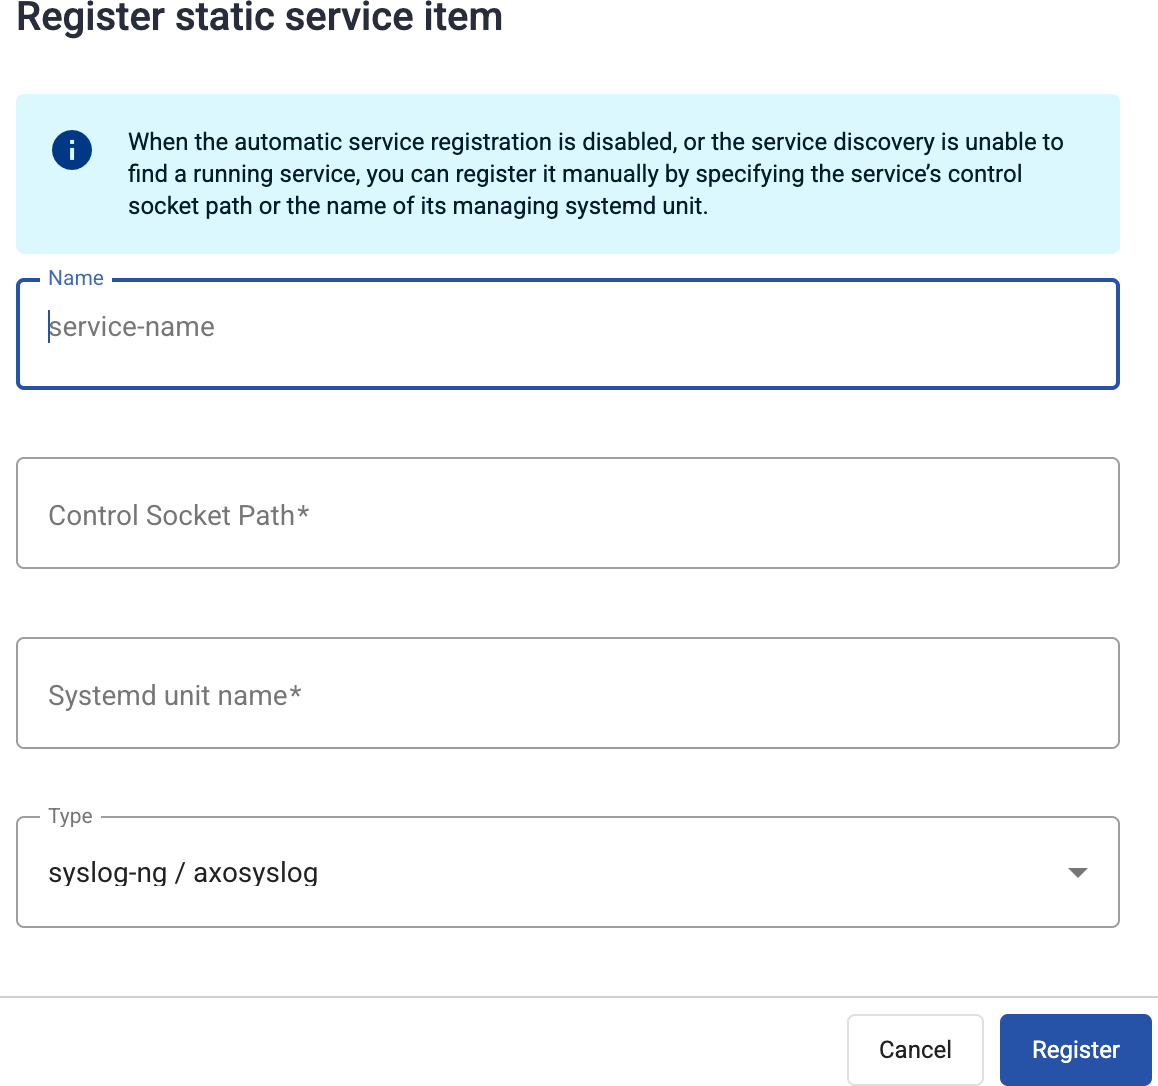
-
Provide at least one of the following:
- Control Socket Path: The path to the Unix domain socket used to communicate with the service, for example,
/var/lib/syslog-ng/syslog-ng.ctl.
- Systemd unit name: The name of the systemd service of the service you’re registering, for example,
syslog-ng.service.
-
Select Register.