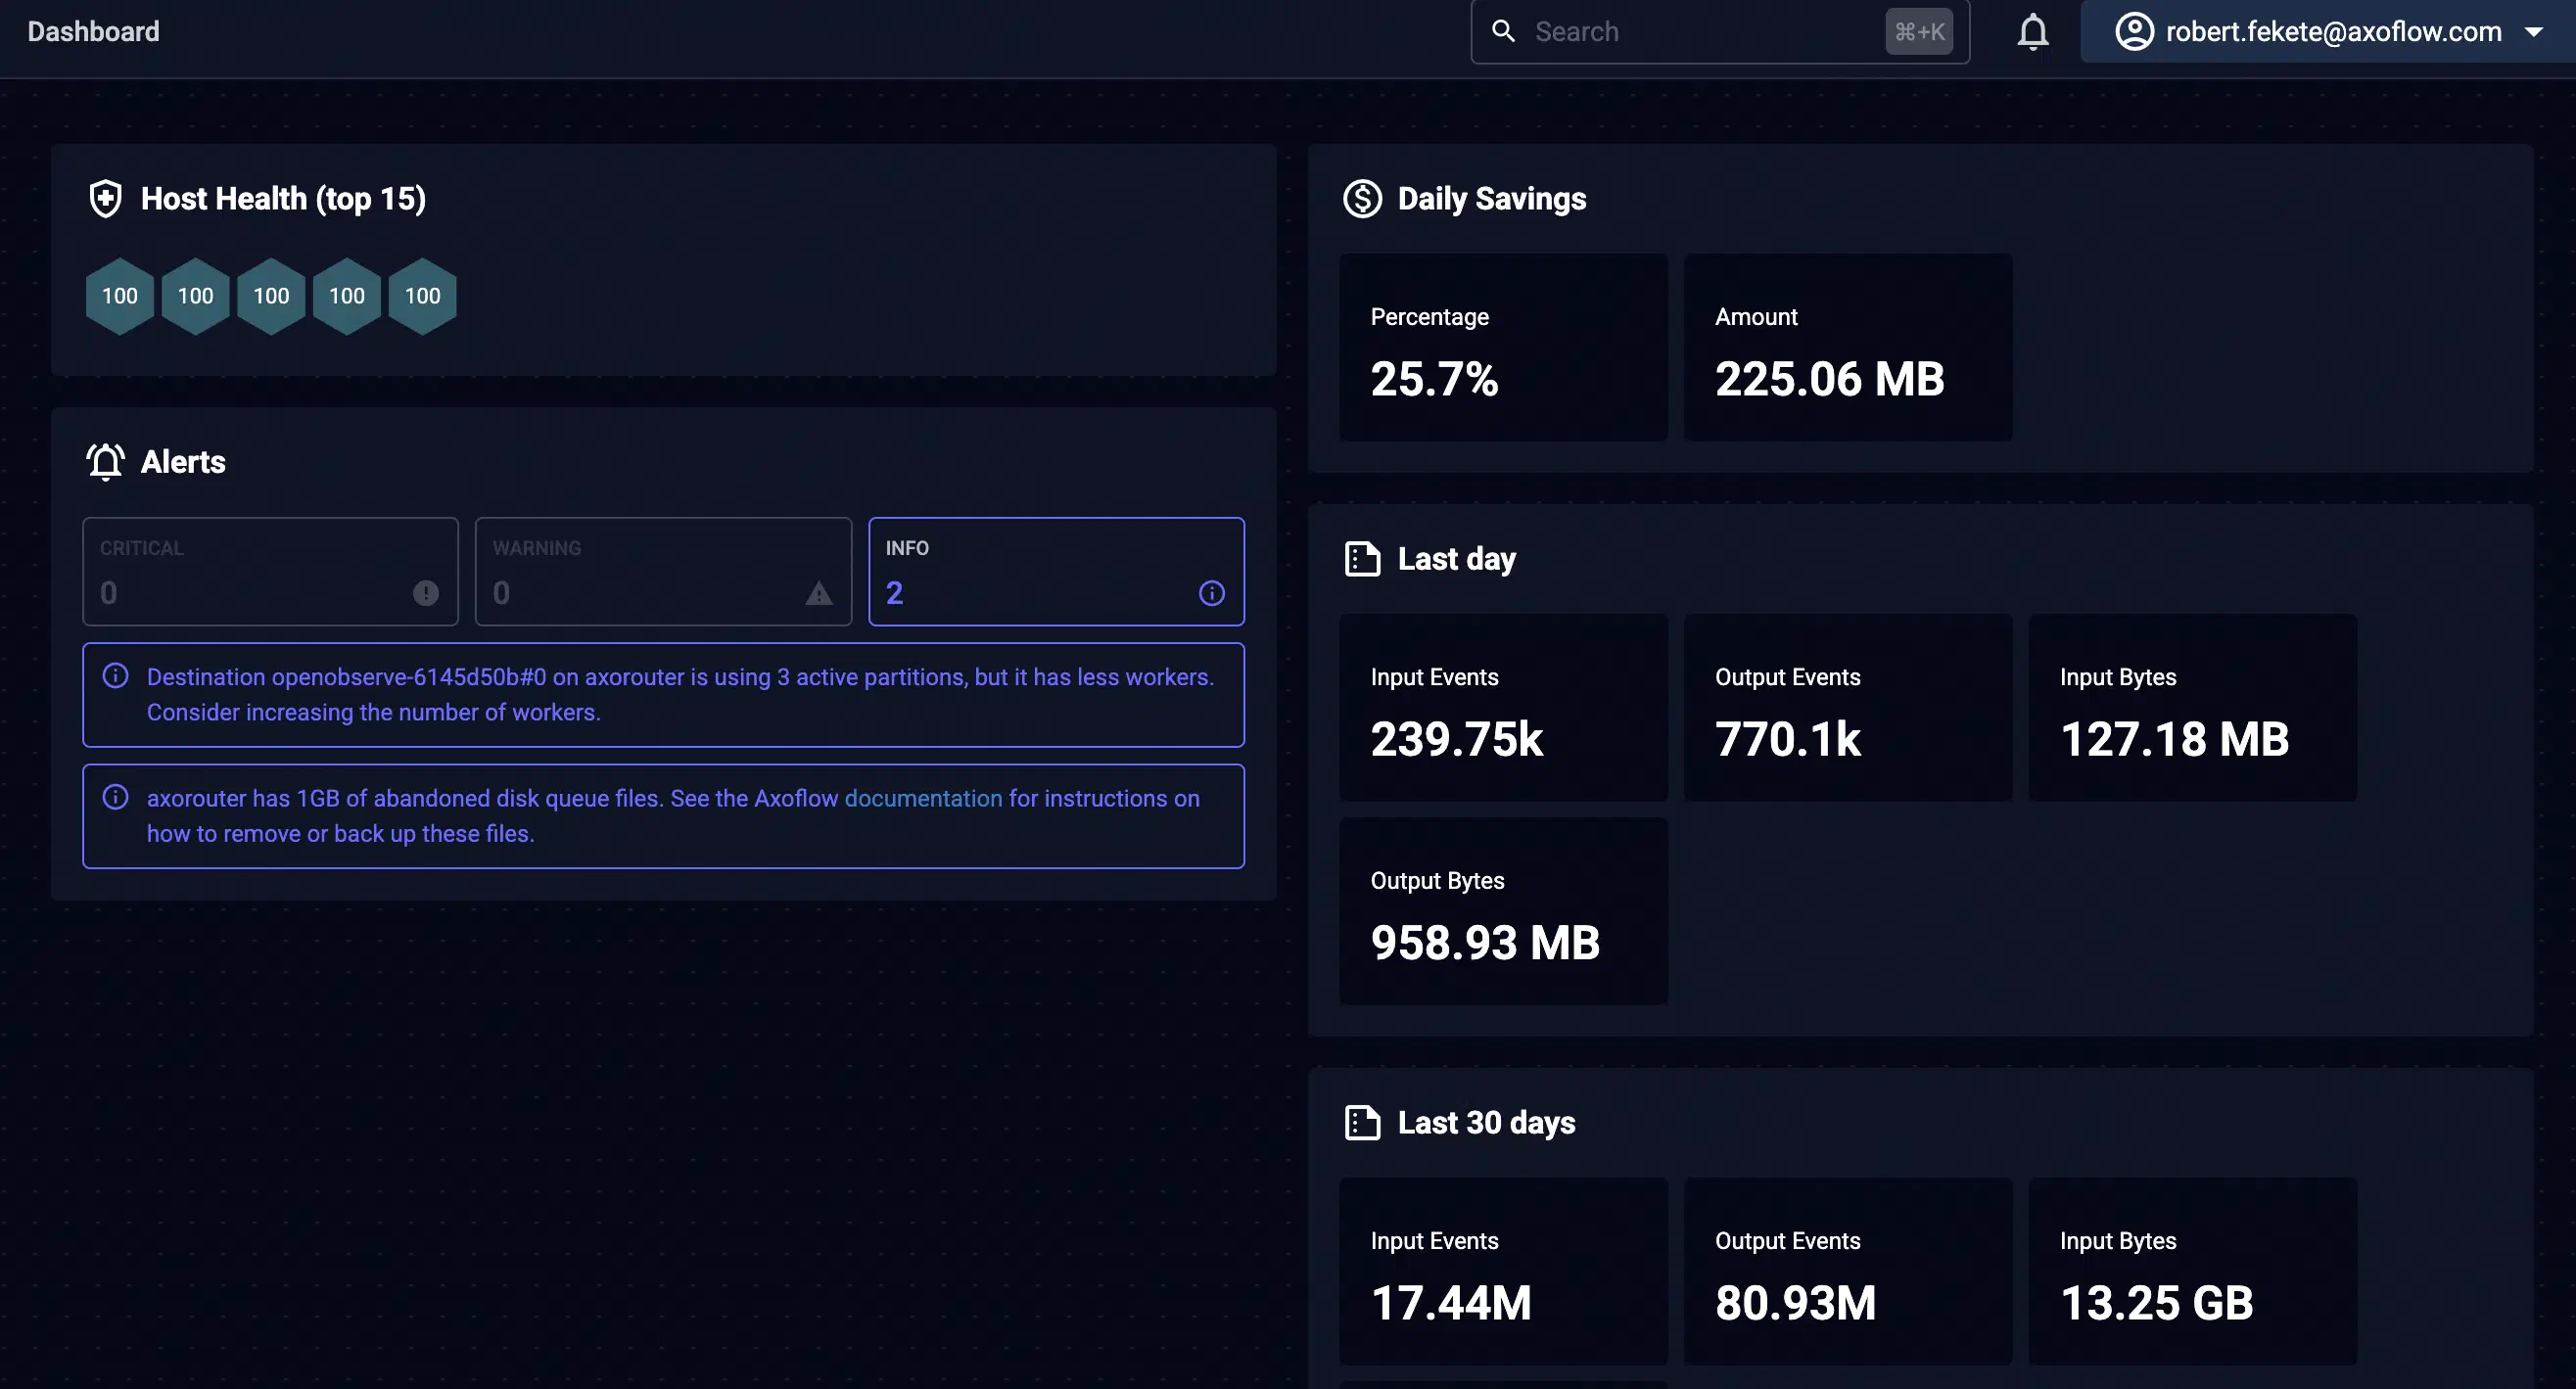
The Dashboard page gives you an overview of your pipeline, and links to relevant pages of pipeline elements. All data is automatically updated every 10 seconds.
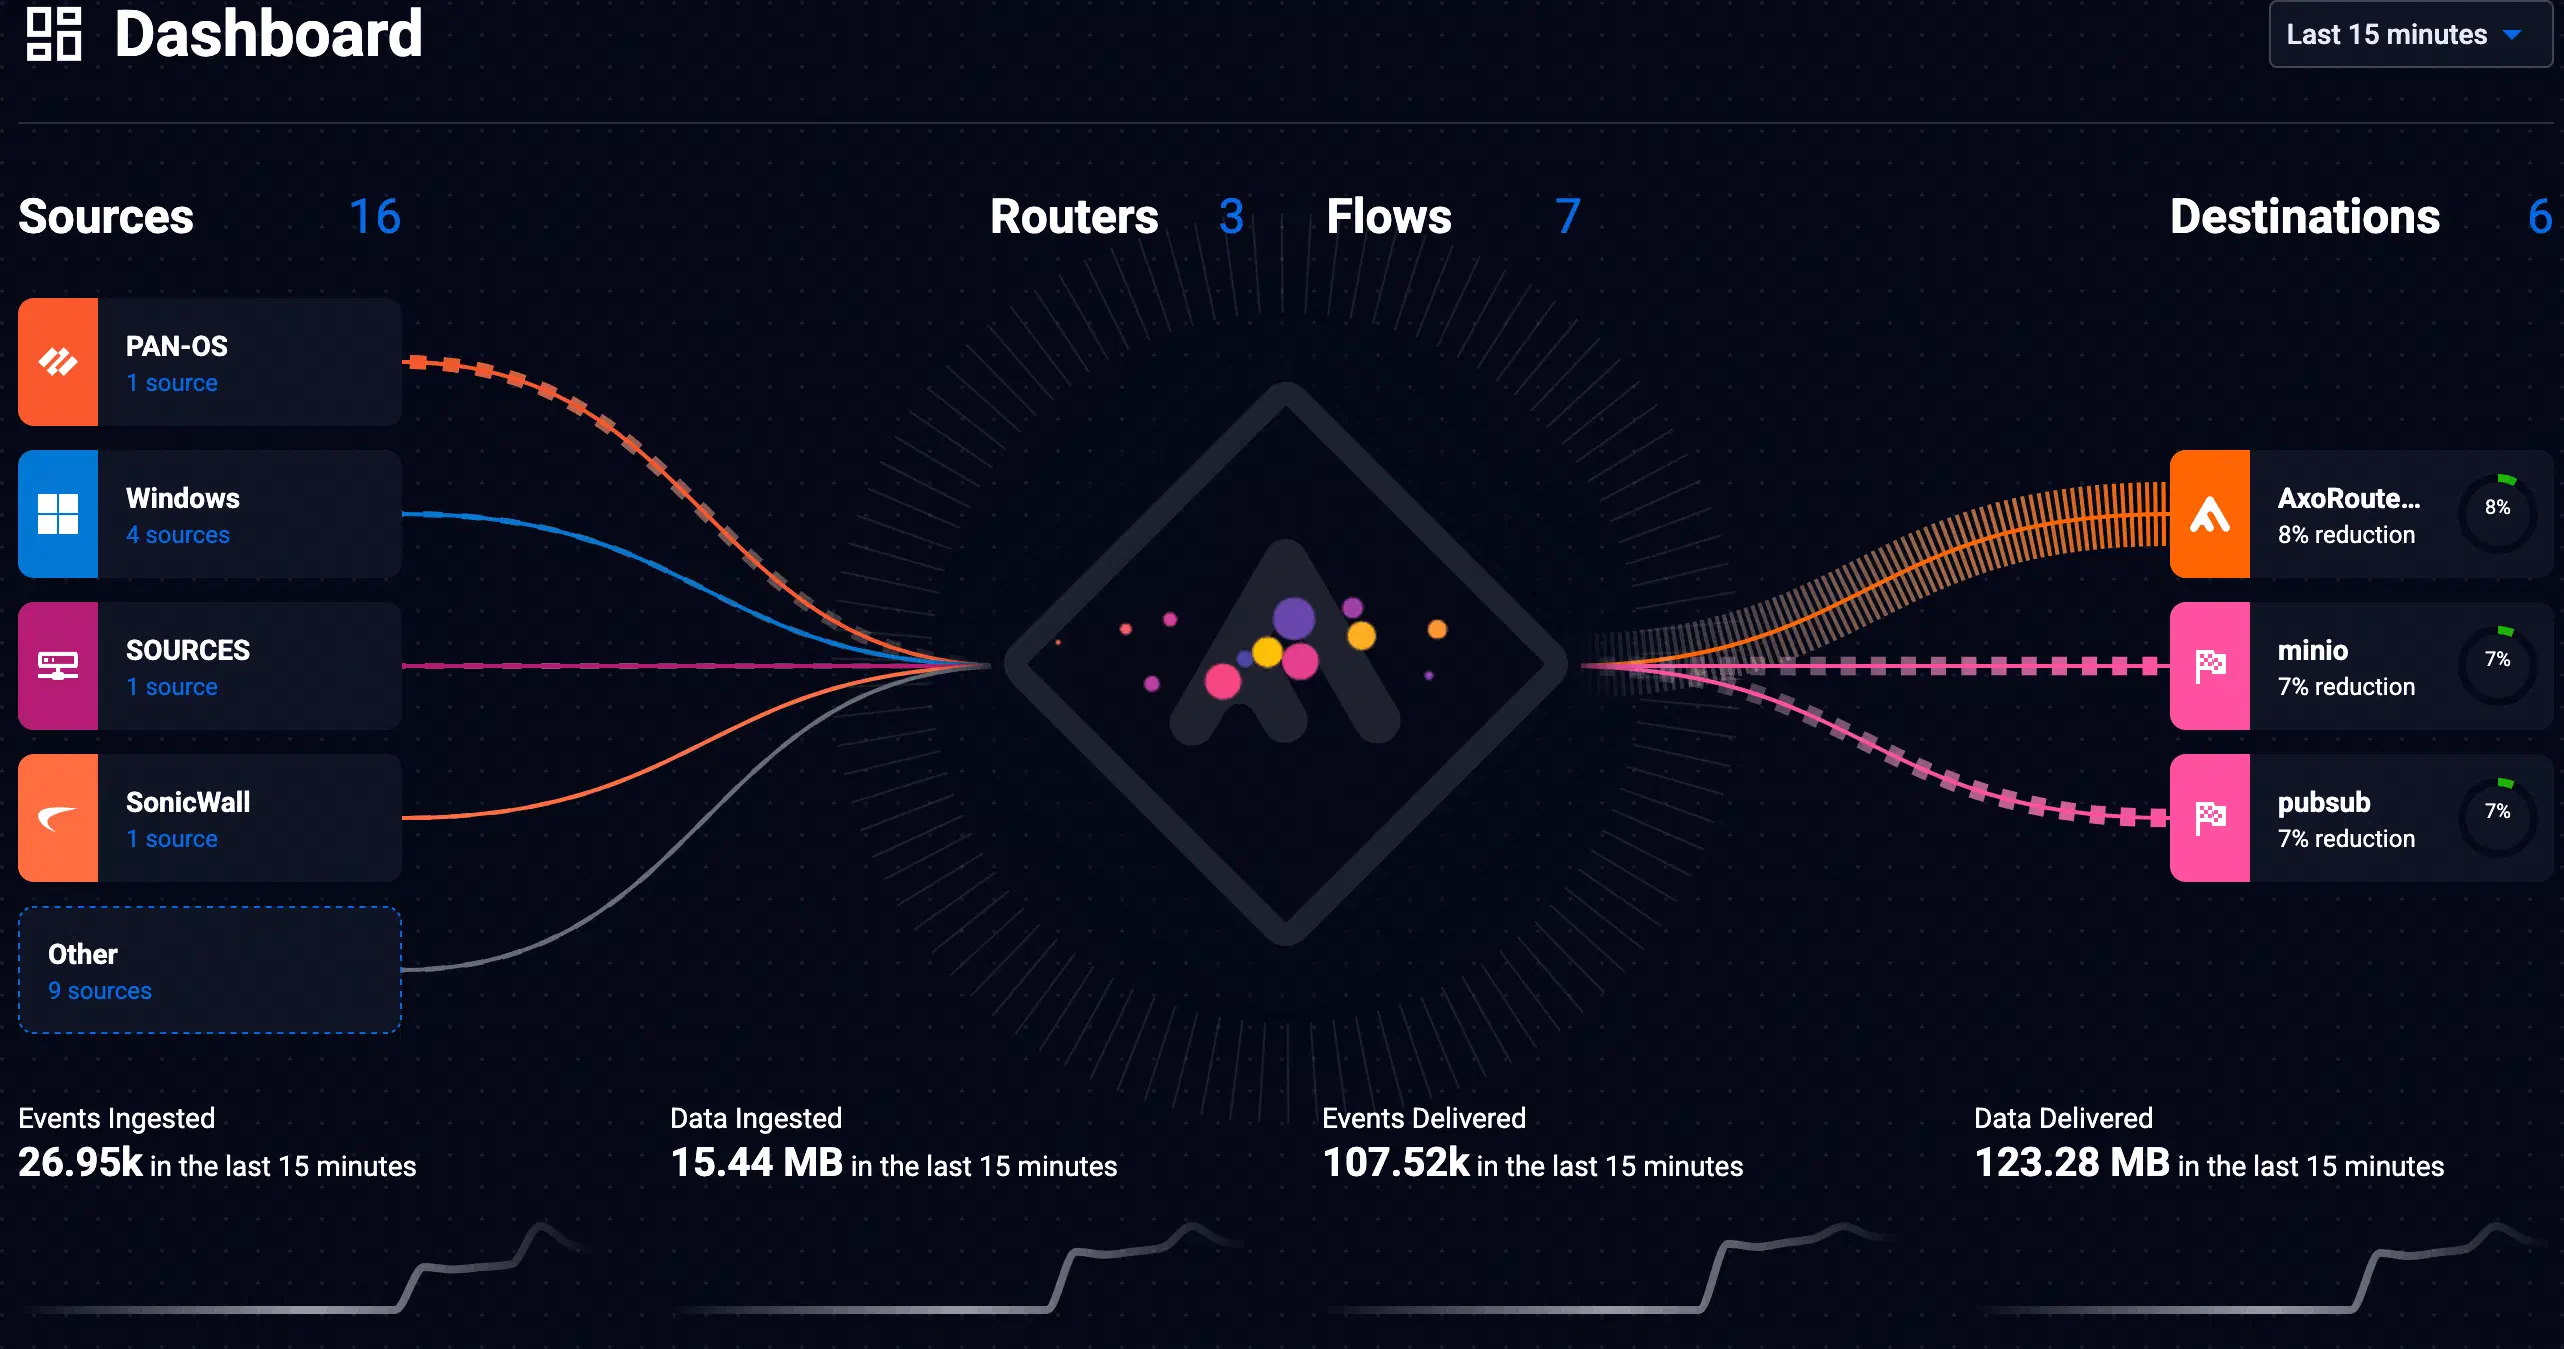
The top row shows the number of Sources, Routers, Flows, and Destinations.

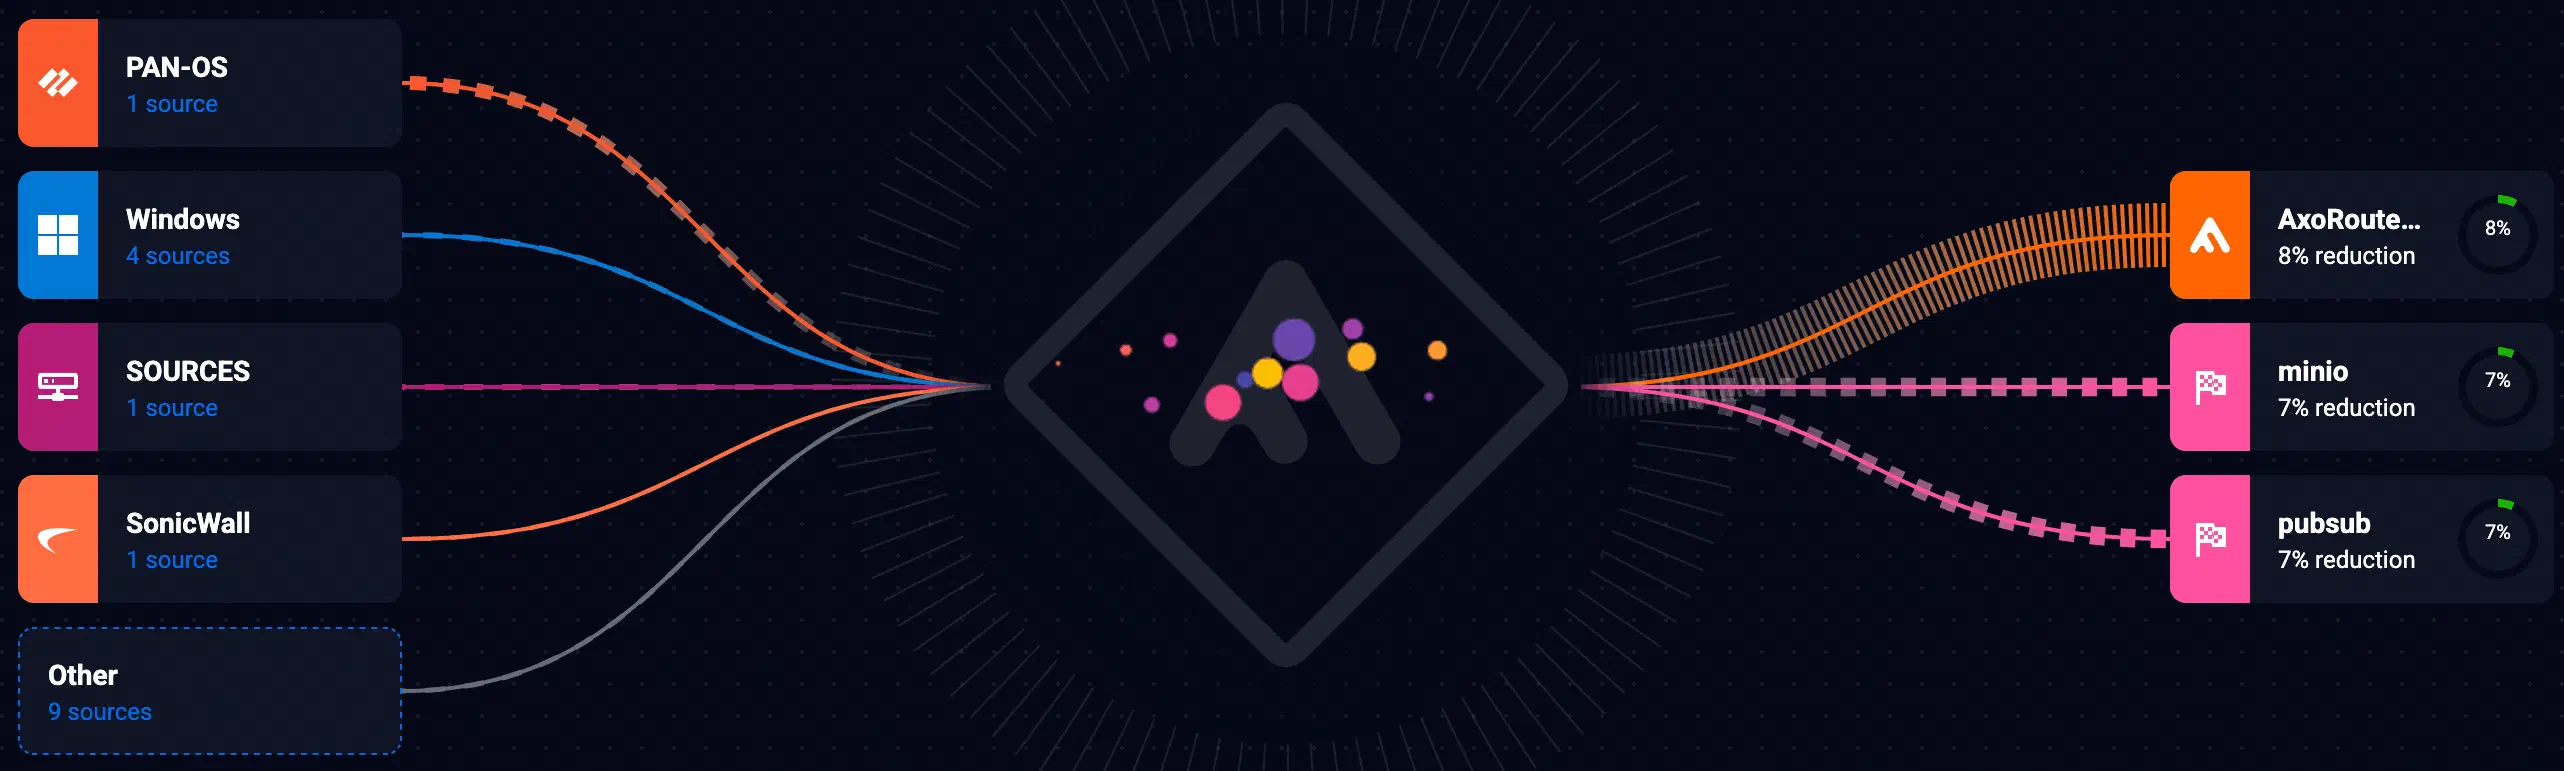
The animated section shows a simplified version of the Topology page.
-
The source side shows the most active source groups.
-
The destination side shows the three most active destinations and the data reduction achieved.
Data reduction is calculated as follows:
- The input is the total data of every flow that sends data to the destination, measured either: before classification and parsing, or at the Probe processing step called
filteredif it exists in the flow. - The reduced data is the total amount of data (in bytes) sent to the destination.
- The data reduction is the ratio of the reduced data and the input.
- The input is the total data of every flow that sends data to the destination, measured either: before classification and parsing, or at the Probe processing step called
The metrics bar shows the number of events and amount of data ingested from the sources and delivered to the destinations during the selected time frame. (You can change the time frame in the top-right of the page.) Note that the small charts under the metrics show the historic value of the related metric for a longer period, not the just within the selected time frame, so the current numbers correspond to the endpoint of the chart.

Further down, the dashboard shows the active alerts (if any), and metrics for the last day and the last 30 days.