Based on the collected metrics, Axoflow visualizes the topology of your security data pipeline. The topology allows you to get a semi-real-time view of how your edge-to-edge data flows, and drill down to the details and metrics of your pipeline elements to quickly find data transport issues.
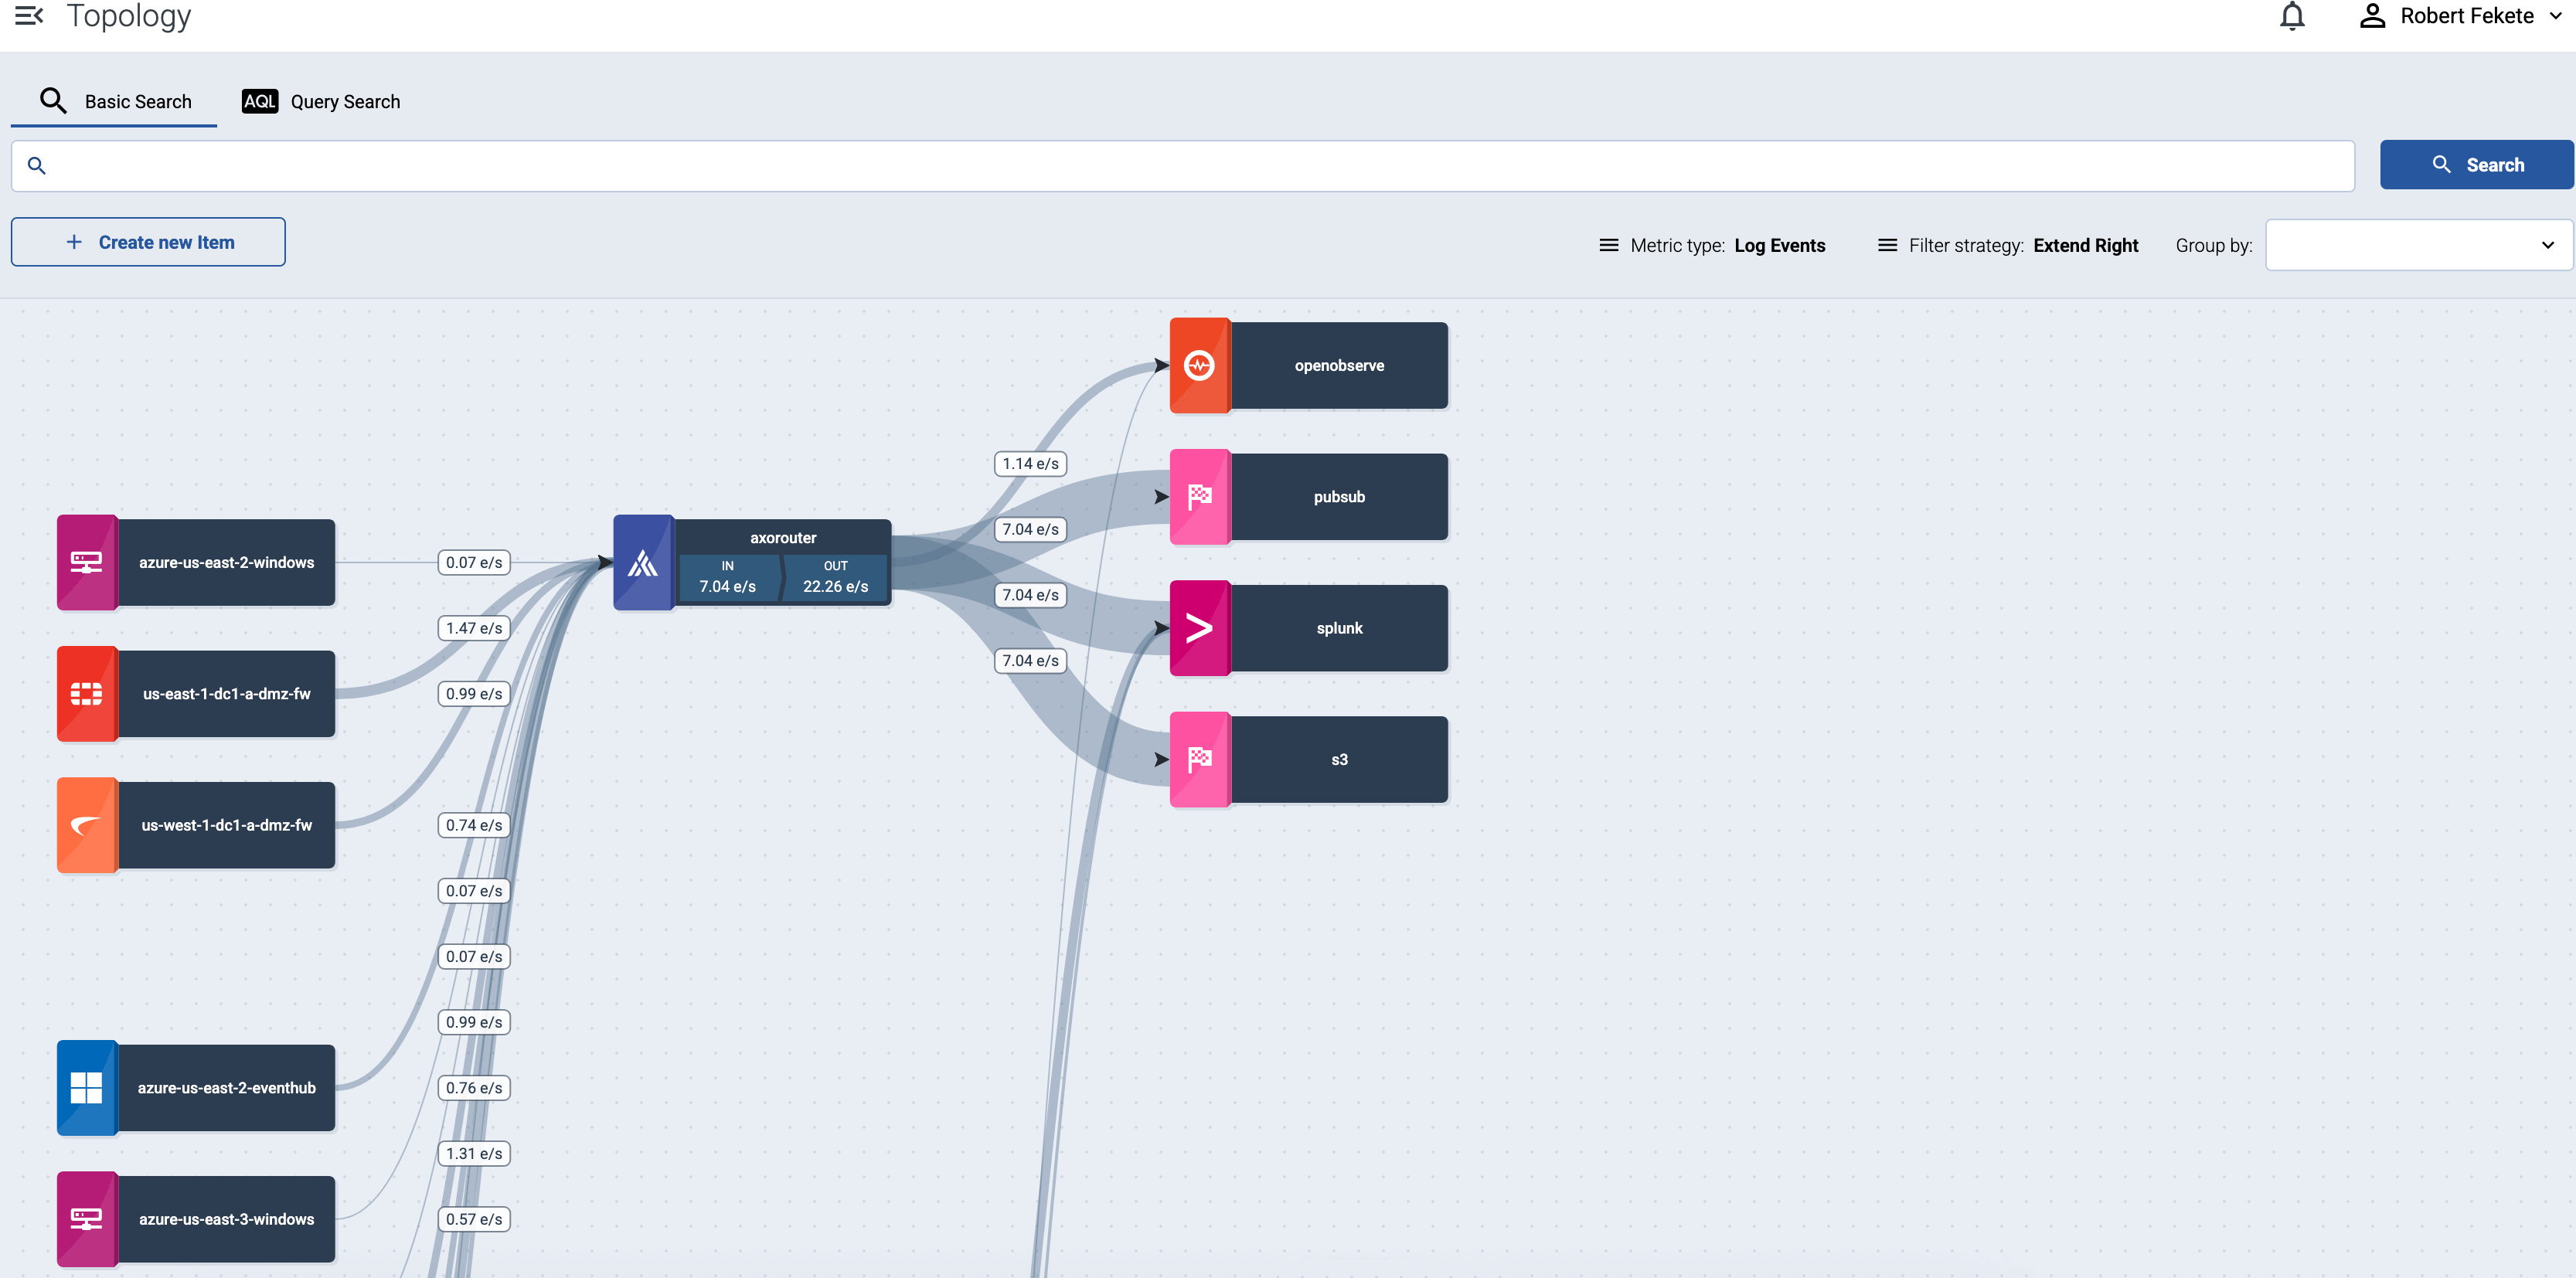
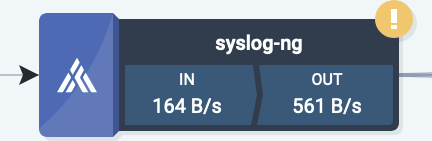
Select the name of a source host or a router to show the details and metrics of that pipeline elements.
If a host has active alerts, it’s indicated on the topology as well.
Traffic volume
Select bps or eps in the top bar to show the volume of the data flow on the topology paths in bytes per second or events per second.
Filter hosts
To find or display only specific hosts, you can use the filter bar.
-
Free-text mode searches in the values of the following fields of the host: Name, IP Address, GUID, FQDN, and the labels of the host.
Basic Search is case insensitive. Adding multiple keywords searches for matches in any of the previous fields. This is equivalent to the
@ANY =* keyword1 AND @ANY =* keyword2AQL query. -
AQL Expression mode allows you to search in specific fields or the labels of the hosts.
It also makes more complex filtering possible, using the Equals, Contains (partial match), and Match (regular expression match) operators. Note that:
- To execute the search, click Search, or hit ESC then ENTER.
- AxoConsole autocompletes the built-in and custom labels and field names, as well as their most frequent values, but doesn’t autocomplete labels and variables created by data parsing and processing steps.
- You can use the AND and OR operators to combine expressions, and also parenthesis if needed. For details on AQL, see AQL operator reference.
- The precedence of the operators is the following: parentheses, AND, OR, comparison operators.
- Use the usual keyboard shortcuts to undo (⌘/Ctrl + Z) or redo (⌘/Ctrl + Shift + Z) your edits.
For details about the message schema and the available fields, see Message schema reference.

If a filter is active, by default the AxoConsole will display the matching hosts and the elements that are downstream from the matching hosts. For example, if an aggregator like AxoRouter matches the filter, only the aggregators and destinations where the matching host is sending data are displayed, the sources that are sending data to the matching aggregator aren’t shown. To display only the matching host without the downstream pipeline elements, select Filter strategy > Strict. (For example, the AQL expression type = ROUTER shows only the aggregator hosts.)
The settings of the filter bar change the URL parameters of the page, so you can bookmark it, or share a specific view by sharing the URL.
Grouping hosts
You can select labels to group hosts in the Group by field, so the visualization of large topologies with lots of devices remains useful. AxoConsole automatically adds names to the groups. The following example shows hosts grouped by their region based on their location labels.
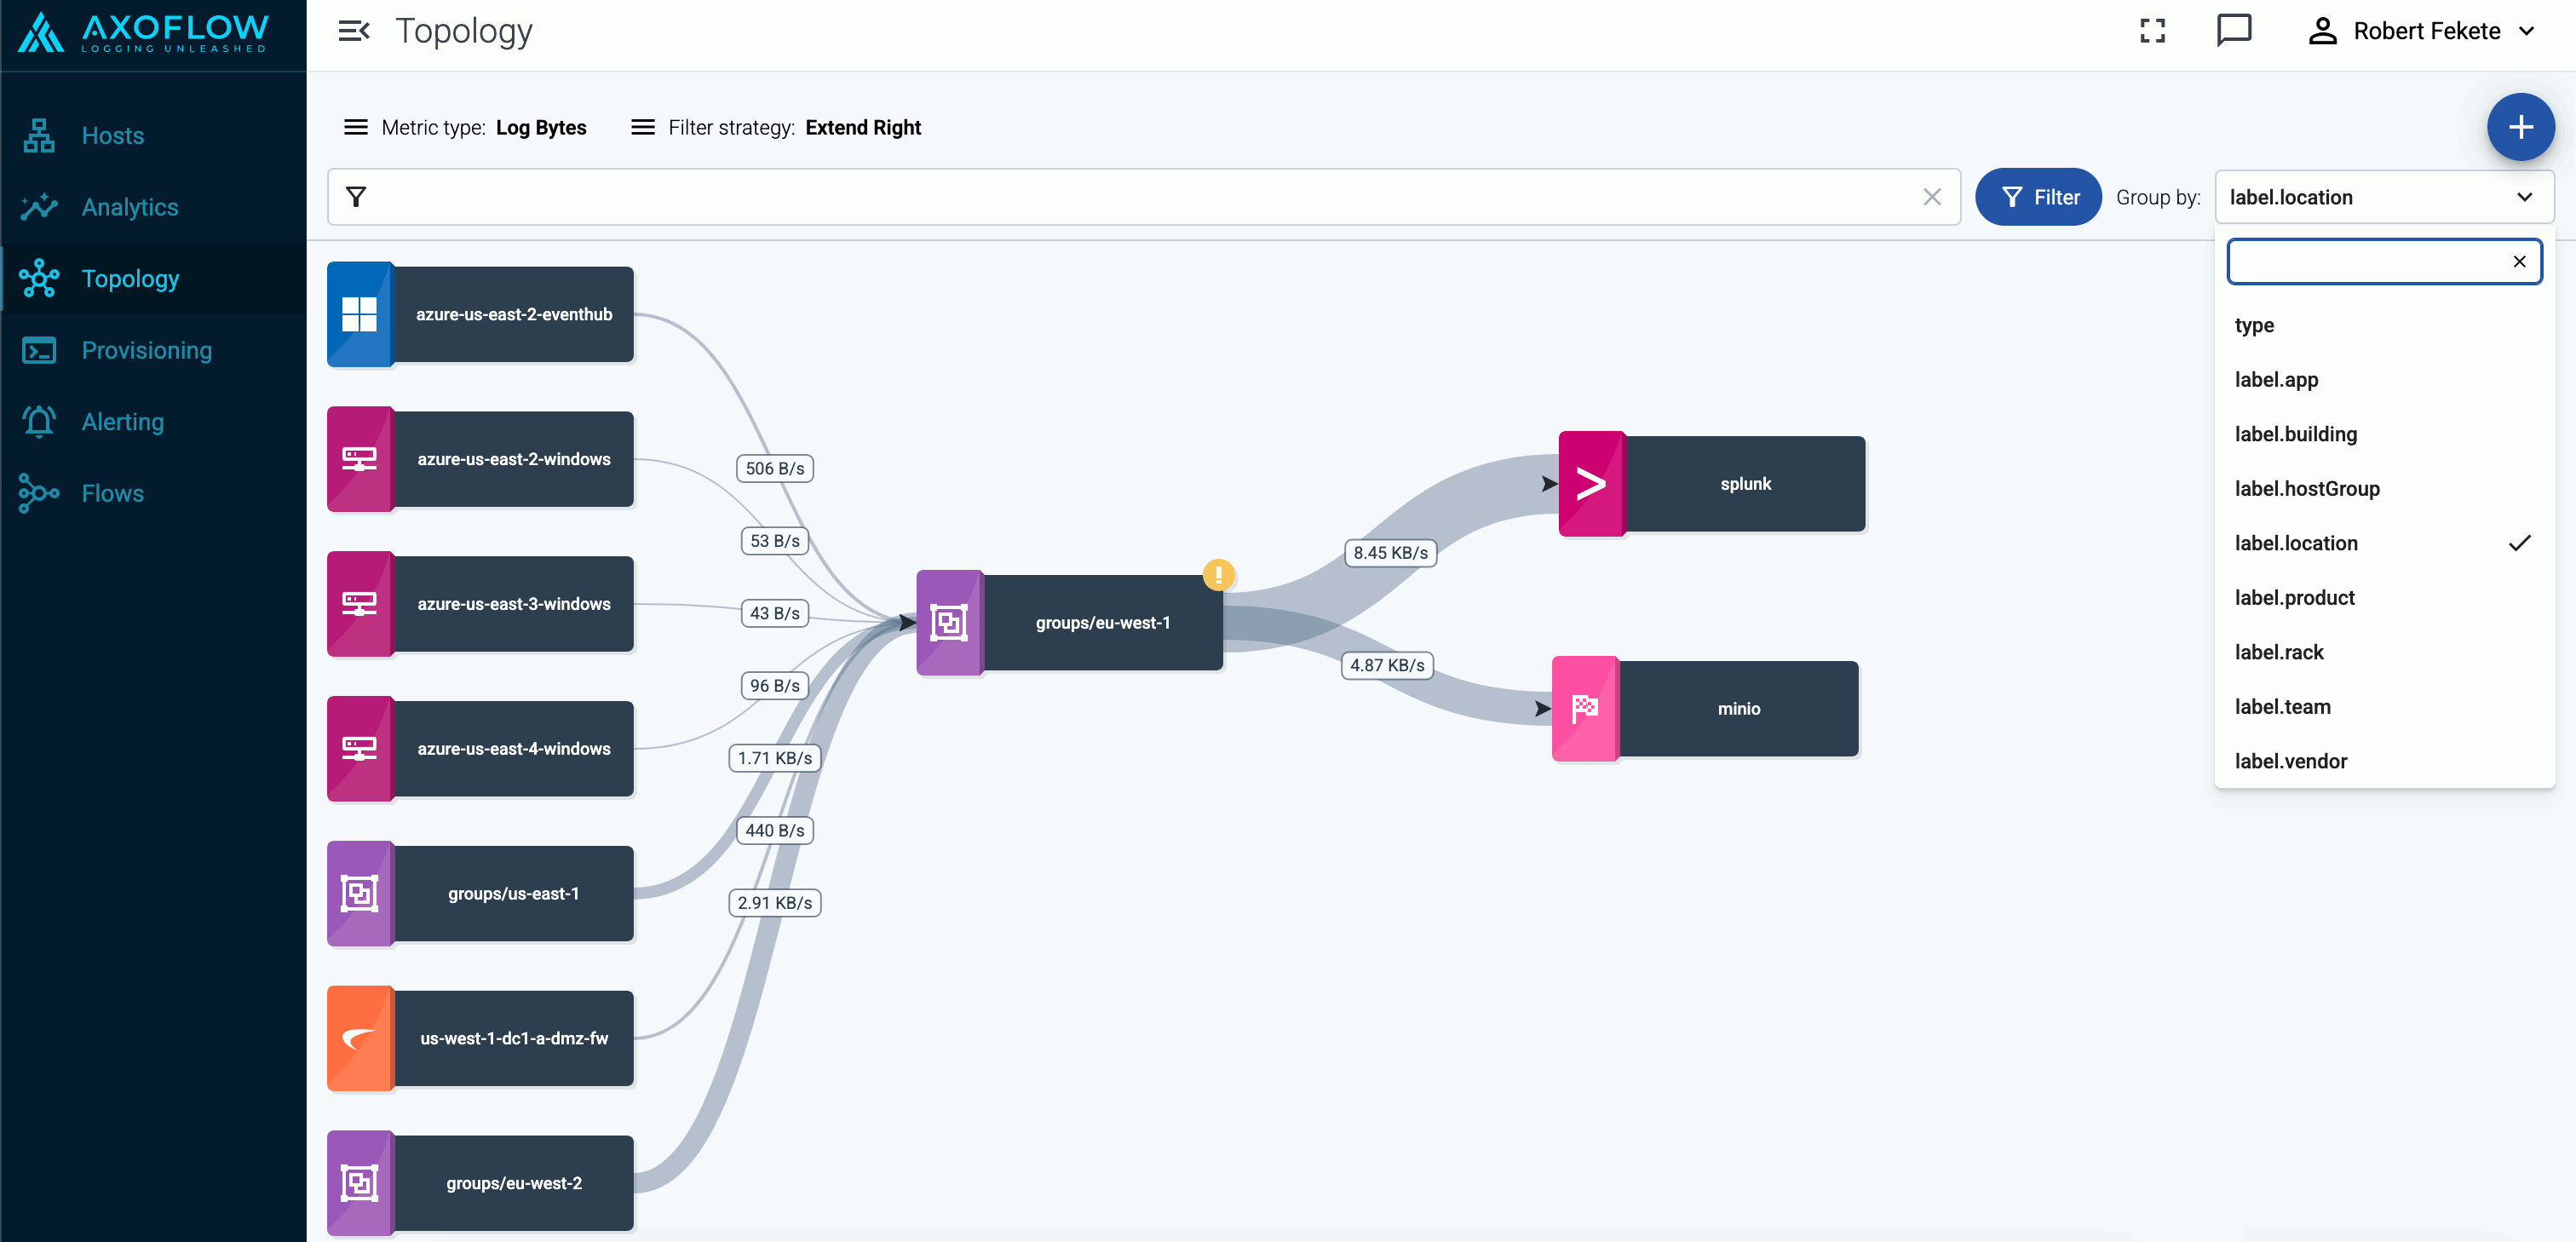
You can select one or more features to group hosts by. When multiple features are selected, groups will be formed by combining values of these features. This can be useful in cases where your information is split into multiple features, for example, if you have region (with values eu, us, etc.) and zone (with values central-1, east-1, east-2, west-1, etc.) labels on your hosts and select the label.region and label.zone features for grouping, you’ll groups will be the following:
- A cross-product of the selected feature values:
eu,central-1,eu,east-1,eu,east-2,eu,west-1,us,central-1,us,east-1, and so on. Obviously, in this example, several of these groups (likeeu,east-1,eu-east-2, andus,central-1) will be empty, unless your hosts are mislabeled. - Groups for the individual values, for hosts that have only one of the selected features:
eu,us,central-1,east-1,east-2,west-1, etc.
Queues
Select queue in the top bar to show the status of the memory and disk queues of the hosts. Select the status indicators of a host to display the details of the queues.
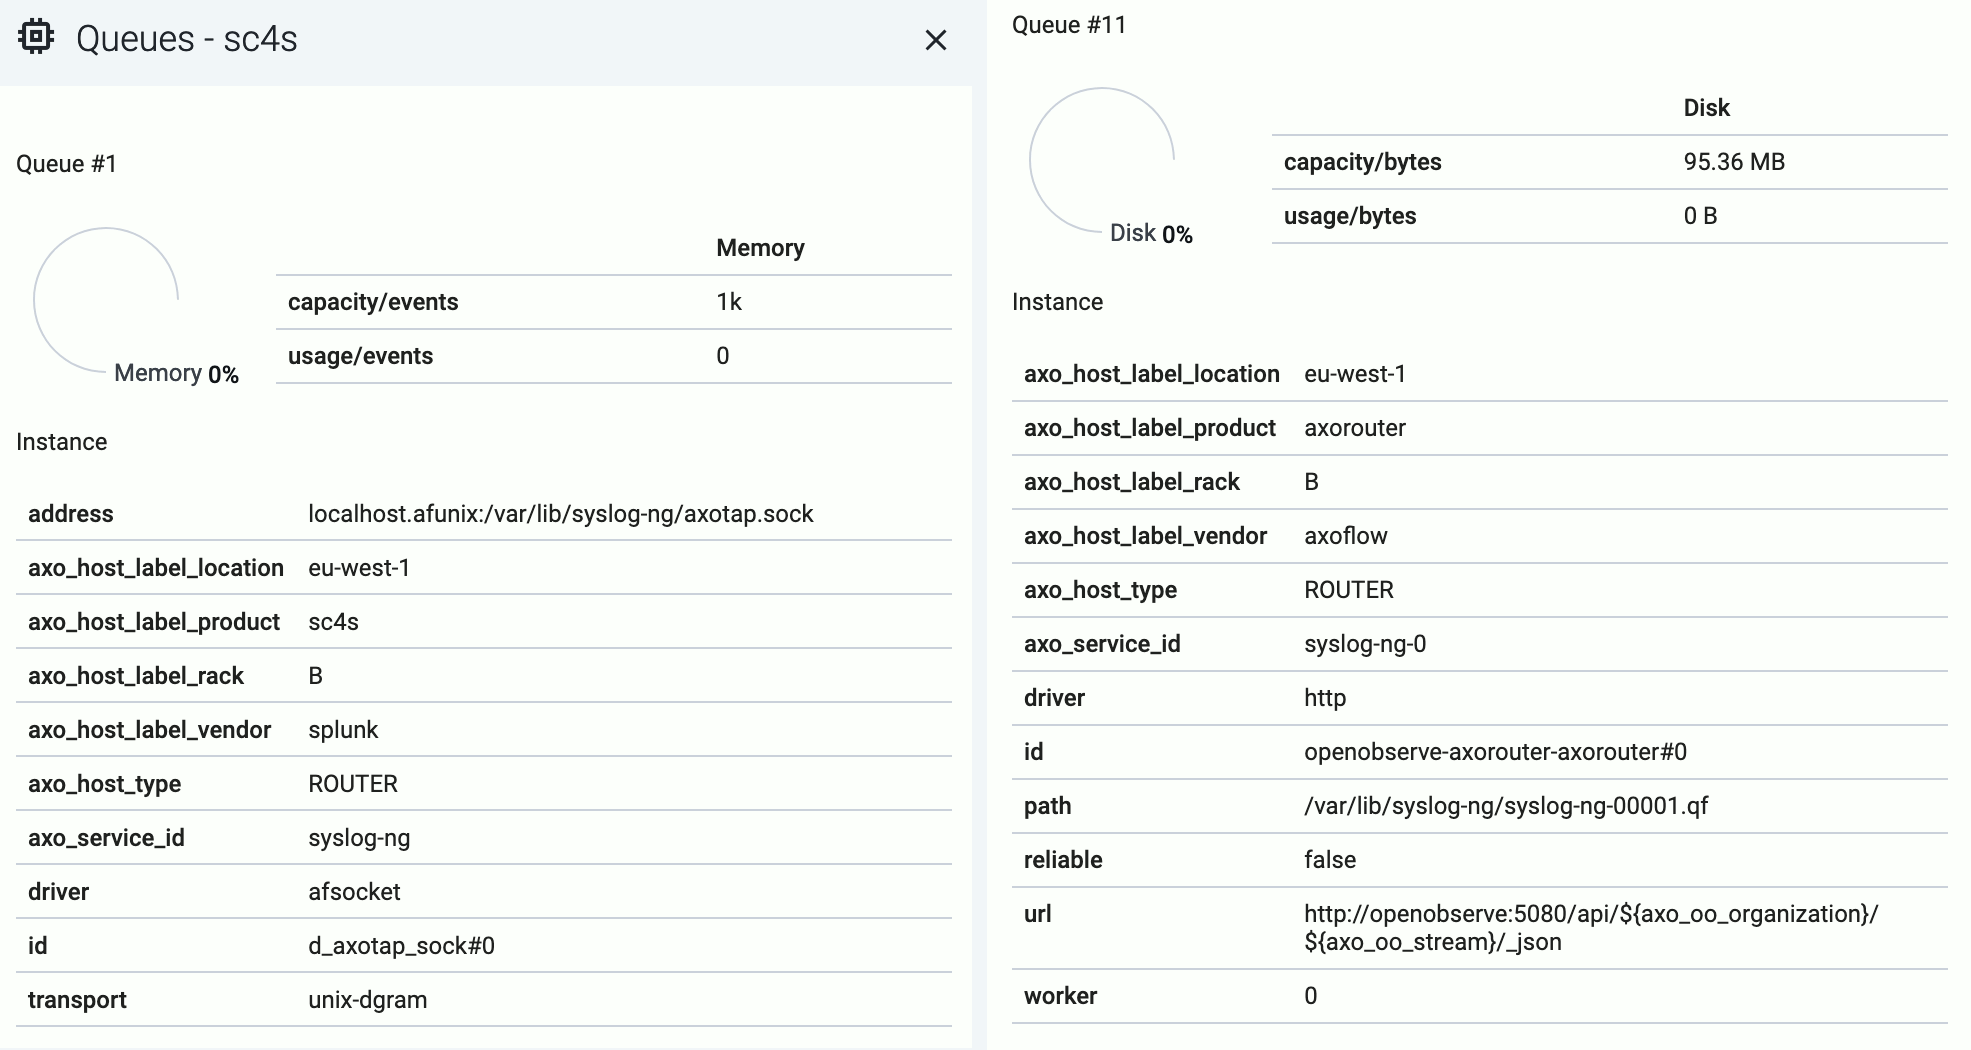
The following details about the queue help you diagnose which connections of the host are having throughput or connectivity issues:
- capacity: The total capacity of the buffer in bytes.
- usage: How much of the total capacity is currently in use.
- driver: The type of the AxoSyslog driver used for the connection the queue belongs to.
- id: The identifier of the connection.
Disk-based queues also have the following information:
- path: The location of the disk-buffer file on the host.
- reliable: Indicates wether the disk-buffer is set to be reliable or not.
- worker: The ID of the AxoSyslog worker thread the queue belongs to.
Both memory-based and disk-based queues have additional details that depend on the destination.