# Eyeglass
Eyeglass: Manages and automates data protection, DR, and reporting for PowerScale environments.
The following sections show you how to configure [Superna Eyeglass]() to send their log data to Axoflow.
**CAUTION:**
Make sure to set data forwarding on your appliances/servers as described in this guide. Different settings like alternate message formats or ports might be valid, but can result in data loss or incorrect parsing.
## Prerequisites
* You have administrative access to Superna Eyeglass.
* You have an [AxoRouter deployed and configured](../../../../docs/axoflow/provisioning/axorouter/index.md) with a [webhook connector](../../../../docs/axoflow/data-sources/webhook/index.md). This device is going to receive the data from Superna Eyeglass.
* You know the IP address the AxoRouter. To find it:
1. Open the AxoConsole.
2. Select the **Routers** or the **Topology** page.
3. Select on AxoRouter instance that is going to receive the logs.
4. Check the **Networks > Address** field.
## Steps
Note: The steps involving the Superna Eyeglass user interface are just for your convenience, for details, see the [official documentation]().
1. Log in to Ransomware Defender and open the Zero Trust menu.
2. Click the plus sign to add a webhook target.
3. Set the parameters of the webhook.
* **Name** : Enter a name for the webhook, for example, `Axoflow`.
* **URL** : Enter the URL of the [webhook connector](../../../../docs/axoflow/data-sources/webhook/index.md) of the AxoRouter instance where you want to post messages.
* **Event Severity Filter** : Select the severities of the events that you want to forward to the webhook.
* **Lifecycle filter** : Select the lifecycle changes that trigger a post message to the webhook.
4. Click **Save** , then the **Test webhooks** button. This will send a post message with a sample payload.
5. Add the source to AxoConsole.
1. Open the AxoConsole and select **Topology**.
2. Select **Add Item > Source**.
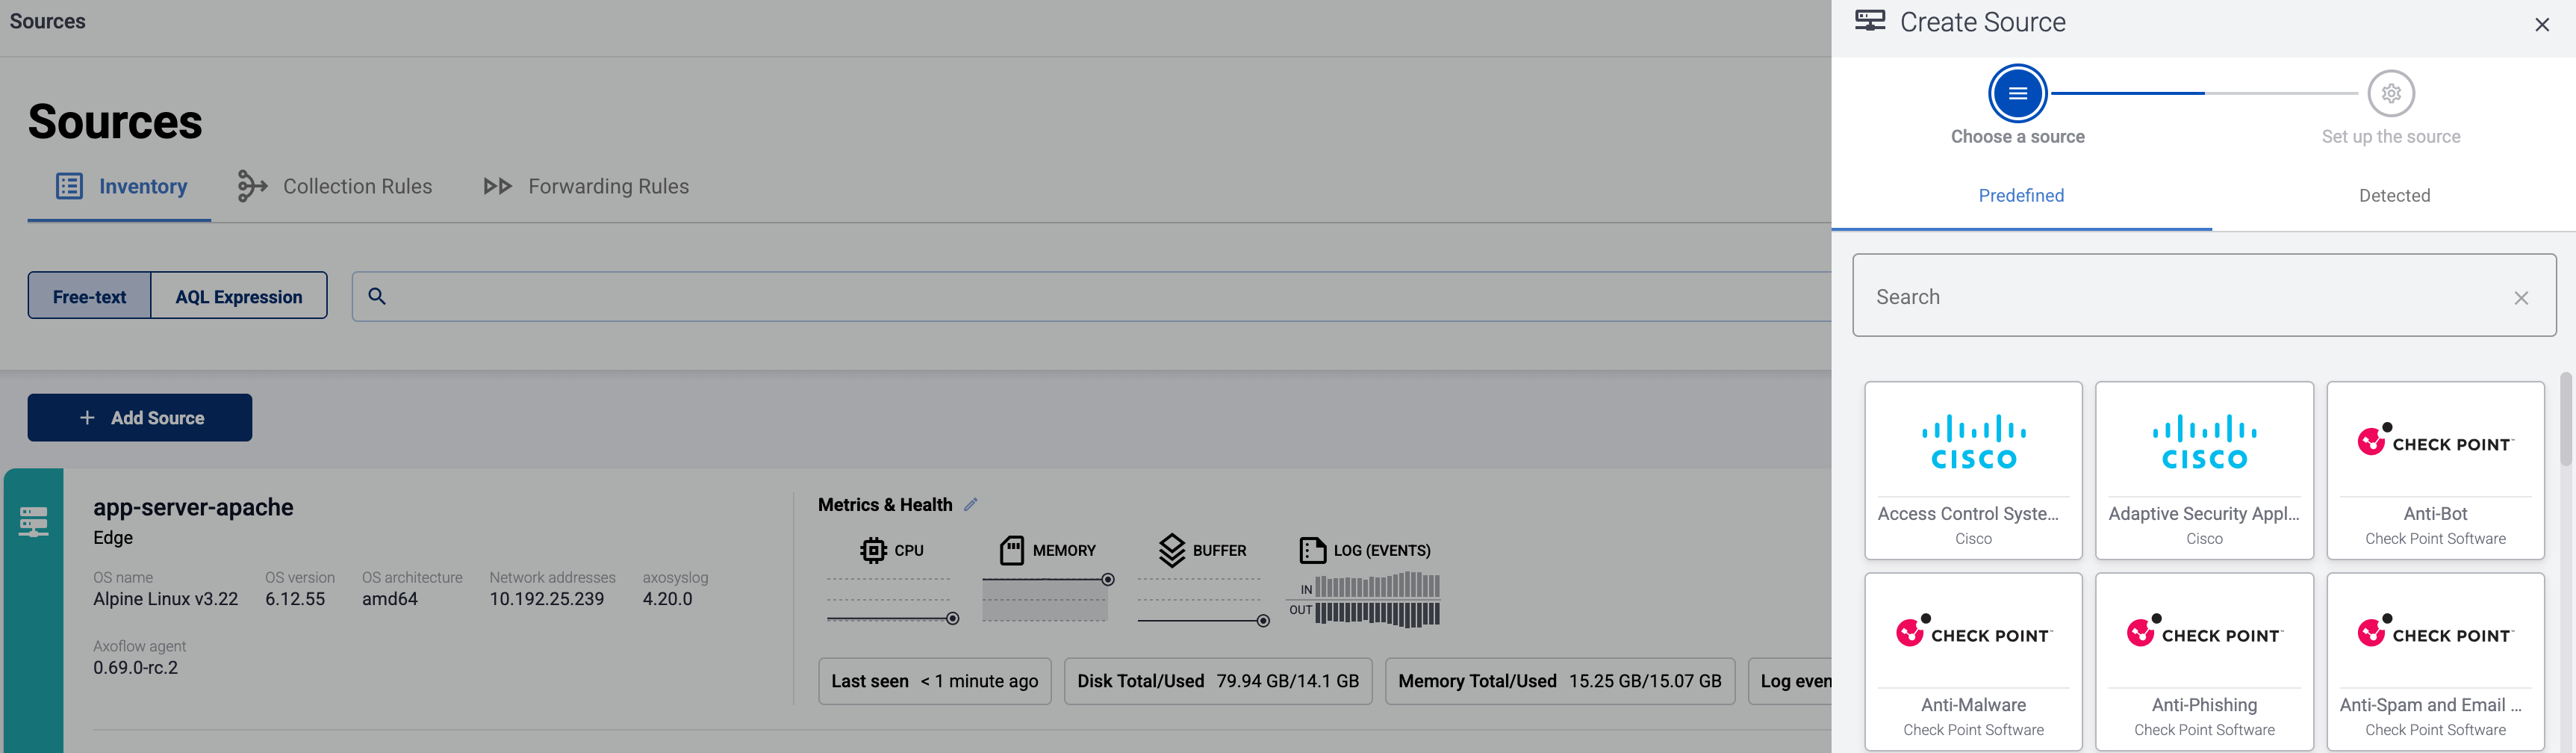
* If the source is actively sending data to an AxoRouter instance, select **Detected** , then select your source.
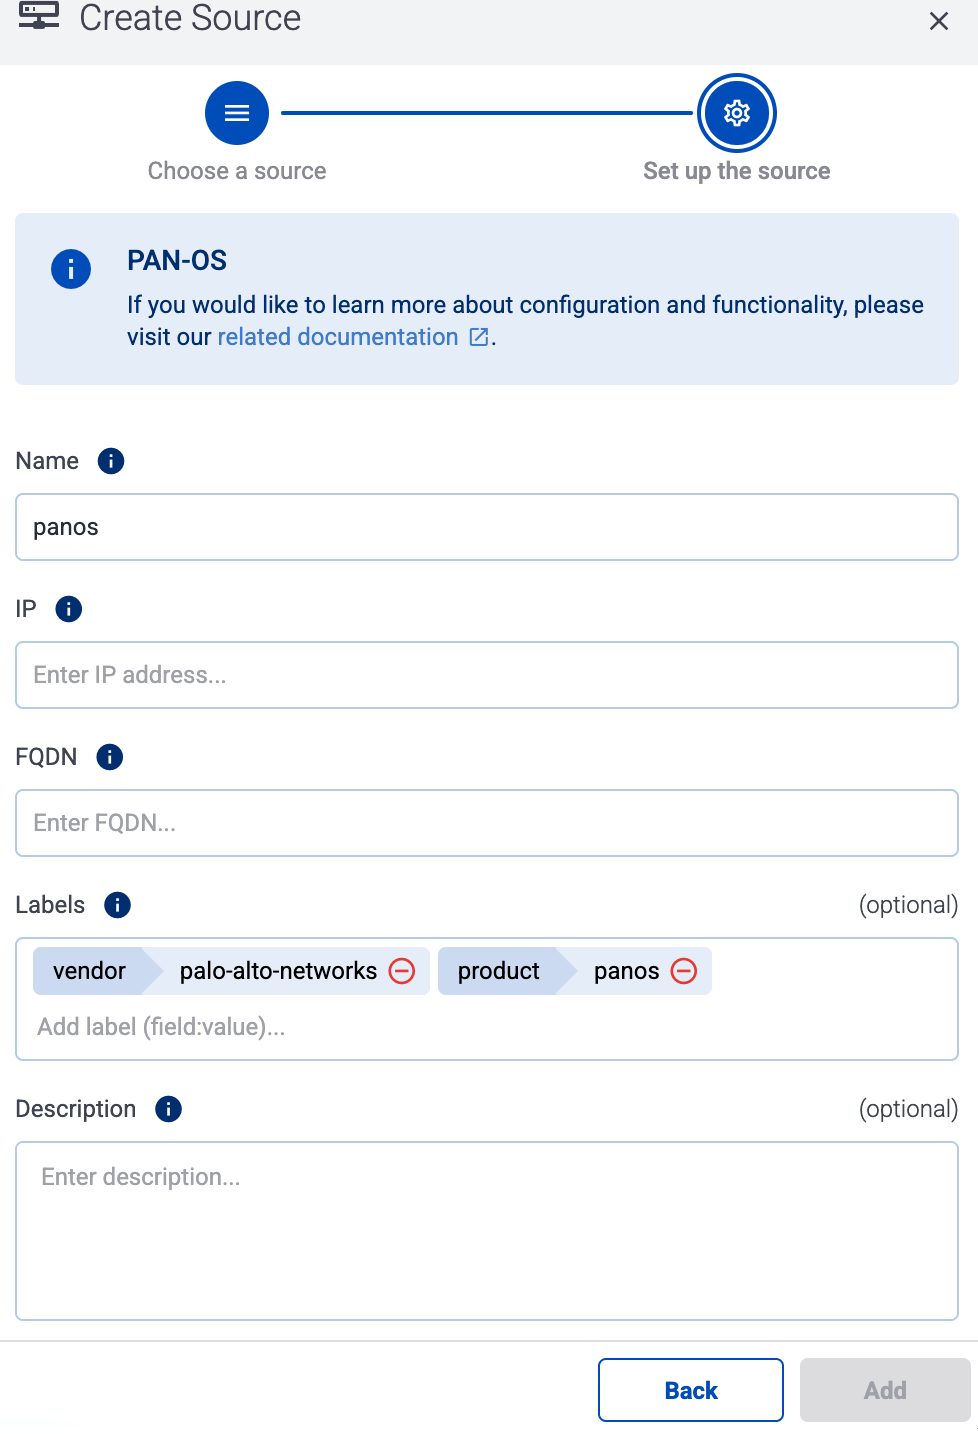
* Otherwise, select the vendor and product corresponding to your source from the **Predefined** sources, then enter the parameters of the source, like **IP address** and **FQDN**.
Note During [log tapping](../../../../docs/axoflow/onboard-hosts/log-tapping/index.md), you can add hosts that are actively sending data to an AxoRouter instance by clicking **Register source**.
3. (Optional) Add [custom labels](../../../../docs/axoflow/onboard-hosts/hosts/add-host-metadata/index.md) as needed.
4. Select **Add**.
5. (Optional) **Add Path** manually. That’s needed only when AxoConsole can’t detect the path based on the IP address and the FQDN, and you haven’t yet configured the source to send data to the router.
## Labels
Axoflow automatically adds the following labels to data collected from this source:
Analytics label | Message field | value
---|---|---
`vendor` | [`meta.vendor`](../../../../docs/axoflow/reference/message-schema/reference/index.md#meta.vendor) | `superna`
`product` | [`meta.product`](../../../../docs/axoflow/reference/message-schema/reference/index.md#meta.product) | `eyeglass`
You can use the labels as:
* **Filter labels** on the [Analytics page](../../../../docs/axoflow/metrics/analytics/index.md),
* in the **Filter By Label** field during [log tapping](../../../../docs/axoflow/onboard-hosts/log-tapping/index.md).
You can use the message fields
* in [Flow Processing steps](../../../../docs/axoflow/data-management/processing/index.md), for example, in the **Query** field of **Select Messages** steps,
* in AQL expressions in the search bars.
## Sending data to Splunk
When sending the data collected from this source to Splunk, Axoflow uses the following sourcetype and index settings:
sourcetype | index
---|---
`superna:eyeglass` | `main`
If the Axoflow classification doesn’t set the source field for the message automatically, and you haven’t set it in a [flow processing step](../../../../docs/axoflow/data-management/processing/index.md#set-fields) manually (by setting the `meta.destination.splunk.source` field), AxoRouter automatically sets the source to the [name of the AxoRouter connector](../../../../docs/axoflow/reference/message-schema/reference/index.md#meta.connector.name) that received the message (for example, `axorouter-syslog-tcp-514`).
## Sending data to Google SecOps
When sending the data collected from this source to a [_dynamic_ Google SecOps destination](../../../../docs/axoflow/destinations/google/secops/index.md), Axoflow sets the following log type: `SUPERNA_EYEGLASS`.
## Sending data to Microsoft Sentinel
When sending the data collected from this source to a [Microsoft Sentinel destination](../../../../docs/axoflow/destinations/microsoft/sentinel/index.md), Axoflow normalizes the data and sends it to the following table: `Syslog`.